Actuarial Report (16th) on the Old Age Security Program
Accessibility statement
The Web Content Accessibility Guidelines (WCAG) defines requirements for designers and developers to improve accessibility for people with disabilities. It defines three levels of conformance: Level A, Level AA, and Level AAA. This report is partially conformant with WCAG 2.0 level AA. If you require a compliant version, please contact webmaster@osfi-bsif.gc.ca.
The Honourable Deb Schulte, P.C., M.P. Minister of Seniors
House of Commons
Ottawa, Canada
K1A 0A6
Dear Minister:
In accordance with section 3 of the Public Pensions Reporting Act, I am pleased to submit the Actuarial Report prepared as at 31 December 2018, on the pension plan established under the Old Age Security Act.
Yours sincerely,
Assia Billig, FCIA, FSA, PhD
Chief Actuary
Table of contents
List of Tables
- Table 1 Best-Estimate Assumptions
- Table 2 Population of Canada
- Table 3 Economic Assumptions
- Table 4 Recipient Rates
- Table 5 Beneficiaries (historical)
- Table 6 Beneficiaries (projected)
- Table 7 Expenditures and Average Annual Benefit (historical)
- Table 8 Expenditures and Average Annual Benefit (projected)
- Table 9 Expenditures as Percentage of GDP (historical)
- Table 10 Expenditures as Percentage of GDP (projected)
- Table 11 Expenditures as Percentage of Total Employment Earnings (historical)
- Table 12 Expenditures as Percentage of Total Employment Earnings (projected)
- Table 13 Financial Results - Totals for 2016 to 2018
- Table 14 Reconciliation of Expenditures as a Percentage of GDP
- Table 15 Individual Sensitivity Test Assumptions
- Table 16 Life Expectancy in 2050 under Alternative Assumption
- Table 17 Sensitivity Test Results
- Table 18 Higher and Lower Economic Growth Sensitivity Tests
- Table 19 Younger and Older Populations Sensitivity Test Assumptions
- Table 20 Detailed Reconciliation of Expenditures as a Percentage of GDP
- Table 21 Cohort Fertility Rates by Age and Year of Birth
- Table 22 Fertility Rates for Canada
- Table 23 Annual Mortality Improvement Rates for Canada
- Table 24 Mortality Rates for Canada
- Table 25 Life Expectancies for Canada, without improvements after the year shown
- Table 26 Life Expectancies for Canada, with improvements after the year shown
- Table 27 Population of Canada by Age
- Table 28 Analysis of Population of Canada by Age
- Table 29 Births, Net Migrants, and Deaths for Canada
- Table 30 Active Population (Canada, ages 15 and over)
- Table 31 Labour Force Participation, Employment, and Unemployment Rates
- Table 32 Labour Force Participation Rates (Canada)
- Table 33 Employment of Population
- Table 34 Real Wage Increase and Related Components
- Table 35 Inflation, Real AAE and AWE Increases
- Table 36 Assumed Deferral Rates for Cohorts Reaching Age 65 in 2019 and Thereafter
- Table 37 OAS Basic Pension Recipient Rates by Age
- Table 38 OAS Basic Pension Recipient Rates by Age, Sex, and Level of Benefit
- Table 39 OAS Beneficiaries Affected by the OAS Recovery Tax
- Table 40 Financial Impact of OAS Recovery Tax
- Table 41 GIS and Allowance Recipient Rates
- Table 42 Impact of Additional CPP on GIS Beneficiaries and Expenditures
- Table 43 Projected Maximum Monthly Benefits
- Table 44 Average Benefits as Percentage of Maximum Rates
- Table 45 Experience Adjustment Factors
- Table 46 OAS Basic Benefit Beneficiaries
- Table 47 OAS Basic Benefit Expenditures
- Table 48 GIS Beneficiaries (Total)
- Table 49 GIS Expenditures (Total)
- Table 50 GIS Beneficiaries (Single)
- Table 51 GIS Expenditures (Single)
- Table 52 GIS Beneficiaries (Spouse a Pensioner)
- Table 53 GIS Expenditures (Spouse a Pensioner)
- Table 54 GIS Beneficiaries (Spouse Not a Pensioner)
- Table 55 GIS Expenditures (Spouse Not a Pensioner)
- Table 56 GIS Beneficiaries (Spouse with Allowance)
- Table 57 GIS Expenditures (Spouse with Allowance)
- Table 58 Allowance Beneficiaries (Total)
- Table 59 Allowance Expenditures (Total)
- Table 60 Allowance Beneficiaries (Regular)
- Table 61 Allowance Expenditures (Regular)
- Table 62 Allowance Beneficiaries (Survivor)
- Table 63 Allowance Expenditures (Survivor)
List of Charts
- Chart 1 Analysis of Population of Canada by Age Group
- Chart 2 Expenditures as a Proportion of GDP
- Chart 3 Historical and Projected Total and Cohort Fertility Rates for Canada
- Chart 4 Life Expectancies at Age 65 for Canada, without improvements after
the year shown - Chart 5 Net Migration Rate (Canada)
- Chart 6 Age Distribution of the Canadian Population
- Chart 7 Population of Canada
- Chart 8 Projected Components of Population Growth for Canada
- Chart 9 Components of the Labour Market
- Chart 10 Labour Force Participation Rates (Canada)
- Chart 11 Impact of Additional CPP and QPP on OAS Beneficiaries Affected by Recovery Tax (number in 000s and % affected)
- Chart 12 Impact of Additional CPP and QPP on Amount of OAS Recovery Tax
(amounts and % of total pensions payable) - Chart 13 GIS Single Recipient Rates (Males)
- Chart 14 GIS Single Recipient Rates (Females)
- Chart 15 Allowance Recipient Rates (Males)
- Chart 16 Allowance Recipient Rates (Females)
- Chart 17 Impact of Additional CPP and QPP on GIS Recipient Rates by Level of Benefit
1. Executive Summary
This is the 16th Actuarial Report on the Old Age Security program since the implementation of the Old Age Security Act in 1952. It presents the results of an actuarial review of the Old Age Security (OAS) program as at 31 December 2018, and includes projections of future experience through the year 2060. The previous triennial report is the 14th Actuarial Report on the Old Age Security program as at 31 December 2015, which was tabled in the House of Commons on 16 August 2017. The next triennial report is scheduled as at 31 December 2021.
This 16th OAS Actuarial Report takes into account three subsequent eventsFootnote 1, that is, events that became known to the Chief Actuary after the valuation date, but before the report date, that were deemed to have an effect on the actuarial review of the OAS program as at the valuation date. They are:
- The amendments to the OAS program under Bill C-97 – Budget Implementation Act, 2019, No. 1, which received Royal Assent on 21 June 2019 (effective 1 July 2020, increase the income exemption for GIS and Allowance benefits). These amendments were covered in the 15th Actuarial Report Supplementing the Actuarial Report on the Old Age Security program as at 31 December 2015, which was tabled in the House of Commons on 21 August 2019.
- The use of updated population estimates (for years 2018 and prior) from Statistics Canada that became available in January 2019.
- The impacts of the COVID-19 pandemic on the economic assumptions used in this report. It is important to note that the COVID-19 pandemic is a very fluid situation that will likely continue to evolve for some time. We have estimated the impacts based on the information known at the time the report was prepared. The final impacts of this health and economic crisis will likely generate some differences in the future.
The introduction of additional benefits under the Québec Pension Plan (QPP) (commencing 1 January 2019) have been taken into account. As such, the estimates presented in this report now take account of both the additional Canada Pension Plan (CPP) and the additional QPP.
1.1. Purpose of Report
This report has been prepared in compliance with the timing and information requirements of the Public Pensions Reporting Act, which provides that the Chief Actuary shall prepare a triennial actuarial report on the benefits under the various Parts of the Old Age Security Act, being as follows:
- Part I: OAS Basic Pension
- Part II: Guaranteed Income Supplement (GIS)
- Part III: Allowance
Another important purpose of the report is to inform the general public of the current and projected costs of the OAS program. The report provides information to evaluate the program's financial situation over a long period, provided the program remains unchanged. Such information should facilitate a better understanding of the program and the factors that influence its costs, and thus contribute to an informed public discussion of issues related to it.
1.2. Scope of Report
Section 2 presents a general overview of the methodology used in preparing the actuarial estimates included in this report, which are based on the best-estimate assumptions described in section 3. The results are presented in section 4 and include information on key demographic and financial indicators and on the projection of beneficiaries, expenditures, and cost ratios. Section 5 presents the reconciliation of the results with those presented in the previous triennial (14th) report. Section 6 presents a general conclusion, and section 7 provides the actuarial opinion.
The various appendices provide supplemental information on the uncertainty of results based on sensitivity analysis of the key best-estimate assumptions, the program provisions, detailed reconciliations of the results between the 14th Actuarial Report on the OAS program and this report, a description of the data, assumptions and methodology used in this report, detailed projections of beneficiaries and expenditures, and lastly acknowledgements.
1.3. Main Findings
The key observations and findings of this report are:
- Demographic changes, notably the aging of the Canadian population, will have a major impact on the ratio of the number of people aged 20 to 64 to those aged 65 and over. This ratio is projected to fall from about 3.3 in 2020 to 2.0 in 2060.
- The number of beneficiaries of the OAS basic pension is projected to increase by 53% over the period 2020 to 2035, growing from 6.6 million in 2020 to 10.1 million by 2035, mainly due to the retirement of the baby boom generation reaching age 65 over that period. Thereafter, the growth in the number of beneficiaries is projected to slow down. By 2060, the number of OAS basic pension beneficiaries is projected to reach 12.7 million.
- OAS basic pension annual expenditures are projected to increase from $46.3 billion in 2020 to $94.3 billion in 2035 and $195.5 billion by 2060.
- The number of GIS and Allowance beneficiaries is projected to increase by 52% over the period 2020 to 2035, growing from 2.3 million in 2020 to 3.5 million by 2035. The GIS recipient rate (i.e. the proportion of the Canadian population that has received, receives, or is projected to receive the GIS) is projected to increase from its current level of 32.3% in 2020 to 33.1% by 2035 and to then slowly decrease to 26.3% by 2060.
- GIS and Allowance annual expenditures are projected to increase from $14.3 billion in 2020 to $28.6 billion in 2035 and $46.9 billion by 2060.
- The introduction of the additional CPP and QPP will affect the GIS and Allowance recipient rates and the amount of expenditures. The impact of the additional CPP and QPP will be very gradual and, by 2060, results in projected overall reductions of 390,000 (or -10.2%) in the number of GIS beneficiaries and of $4.8 billion (or -9.6%) in annual GIS expenditures.
- Total annual OAS program expenditures are projected to increase from $60.8 billion in 2020 to $123.4 billion in 2035 and $243.4 billion by 2060.
- The ratio of program expenditures to the GDP is projected to be 2.77% in 2020 compared to 2.50% in 2019. This substantial year-over-year increase is mainly due to the estimated negative impact of COVID-19 on the GDP. Thereafter, this ratio is projected to reach a high of 3.1% between 2030 and 2037. After 2037, the ratio of expenditures to GDP is projected to gradually decrease to a level of 2.63% by 2060 which is comparable to the historical levels of the early 1990s. This reduction is mainly attributable to expected slower growth in inflation compared to growth in wages and GDP and to increases in additional CPP and QPP benefits.
1.4. Uncertainty of Results
To measure the sensitivity of the long-term projections of the program to future changes in the demographic and economic environments, different sensitivity tests were performed. The tests and results are presented in detail in Appendix A of this report.
The tests focus on varying the key best-estimate assumptions individually in order to measure the potential impact on the cost ratio of program expenditures to GDP. These tests show that the cost ratios could deviate significantly from their projected best‑estimate values if other than best-estimate assumptions were to be realized. For example, if life expectancies at age 65 were to increase by about two more years than the best estimates of this report, then the ratio in 2060 would increase from 2.63% to 2.80%. As another example, if benefit rates were increased to partially reflect the growth in real wages, then the ratio in 2060 would increase from 2.63% to 3.42%.
Scenario tests were also performed regarding the future economic growth and aging of the population, and how they may differ from the best-estimate projection. Two alternative economic scenarios were developed that portray higher and lower economic growth, and two demographically based scenarios were developed that portray generally younger and older populations. The economic scenarios produced cost ratios of program expenditures to GPD in 2060 of 1.85% (higher economic growth) and 3.78% (lower economic growth), while the demographic scenarios produced cost ratios of program expenditures to the GDP in 2060 of 2.40% (younger population) and 2.80% (older population).
1.5. Conclusion
The ratio of program expenditures to the GDP is projected to be 2.77% in 2020 compared to 2.50% in 2019. This substantial year-over-year increase is mainly due to the estimated negative impact of COVID-19 on the GDP. The retirement of the baby boomers reaching age 65 over the next few decades is projected to increase the expenditures of the program and the ratio is projected to reach a high of 3.1% between 2030 and 2037. Thereafter, although the impacts of Tax Free Savings Accounts (TFSAs) reduce the amount of income for benefit calculation purposes and tend to increase this ratio over the long term, the projected gradual growth in additional CPP and QPP benefits and the fact that OAS benefits are indexed to inflation as opposed to wages drive down the cost of the OAS program relative to the GDP over the long term. As a result, annual expenditures are expected to gradually fall to 2.63% of GDP by 2060 which is comparable to the historical levels of the early 1990s.
In comparison with the previous triennial (14th) Actuarial Report on the OAS program, the amendments which increase, effective 1 July 2020, the GIS and Allowance income exemption, slightly increase the projected expenditures by 0.01% of GDP by 2030. Changes in the economic assumptions (especially lower real wage growth) also lead to increases in the cost ratio. These increases are offset by the update in experience and changes to demographic and benefit assumptions. The net result is lower expenditures relative to the GDP over the projection period as compared to the previous 14th Actuarial Report on the OAS program.
2. Methodology
The actuarial examination of the OAS program involves projections of its expenditures and cost measurement bases over a long period of time, so that the future impact of historical and projected trends in demographic and economic factors can be properly assessed. The actuarial estimates in this report are based on the provisions of the Old Age Security Act as at 31 December 2018Footnote 2, data regarding the starting point for the projections, and best‑estimate assumptions regarding future demographic and economic experience.
Since the OAS program is financed from general tax revenues on a pay‑as‑you‑go basis, there is no need to project either contributions or investment earnings. However, projected total employment earnings and GDP levels are used as bases for measuring the relative costs over the projection period.
The costing begins with a projection of the general population of Canada. This requires assumptions regarding demographic factors such as fertility, migration, and mortality.
Expenditures are made up of the benefits paid out and administrative expenses. Benefits are projected by applying assumptions regarding recipient rates for various types and levels of benefits to the projected population at the relevant ages, along with assumptions regarding increases in the maximum benefit rates. Administrative expenses are projected by considering the historical relationship between expenses and total benefit expenditures.
The total employment earnings cost measurement basis is derived by applying labour force participation and job creation rates to the projected population and by projecting future employment earnings. This requires assumptions about various factors such as wage increases, an earnings distribution and unemployment rates. The GDP is projected based on the historical relationship between the GDP and total employment earnings.
The assumptions and results presented in the following sections make it possible to measure the costs of the OAS program over the projection period. A wide variety of factors influence both the current and projected costs of the program. Accordingly, the results shown in this report differ from those shown in previous reports. Likewise, future actuarial examinations will reveal results that differ from the projections included in this report.
3. Best-Estimate Assumptions
3.1. Introduction
The information required by statute, which is presented in section 4 of this report, requires making several assumptions regarding future demographic and economic trends. The projections included in this report cover a long period of time (up to the year 2060) and the assumptions are determined by examining historical long-term and short-term trends, and by applying judgement as to the extent these trends will continue in the future. These assumptions reflect the Chief Actuary's best judgment and are referred to in this report as the best-estimate assumptions. The assumptions were chosen to be, independently reasonable and appropriate in the aggregate, taking into account certain interrelationships between them. To the extent applicable, and with the exception of certain adjustments resulting from the impacts of the COVID-19 pandemic, the assumptions are consistent with the best-estimate assumptions used in the 30th Actuarial Report on the Canada Pension Plan as at 31 December 2018.
This actuarial report on the Old Age Security program presents projections of its expenditures over a long period of time. Both the length of the projection period and the number of assumptions required ensure that actual future experience will not develop precisely in accordance with the best-estimate projections. To measure the sensitivity of the long-term projections to future changes in demographic and economic environments, a variety of sensitivity tests were performed. The tests and results are presented in Appendix A of this report.
The assumptions were developed taking into account three subsequent eventsFootnote 3, that is, events that became known to the Chief Actuary after the valuation date, but before the report date, that were deemed to have an effect on the actuarial review of the OAS program as at the valuation date. They are:
- The amendments to the OAS program under Bill C-97 – Budget Implementation Act, 2019, No. 1, which received Royal Assent on 21 June 2019 (effective 1 July 2020, increase the income exemption for GIS and Allowance benefits). These amendments were covered in the 15th Actuarial Report Supplementing the Actuarial Report on the Old Age Security program as at 31 December 2015, which was tabled in the House of Commons on 21 August 2019.
- The use of updated population estimates (for years 2018 and prior) from Statistics Canada that became available in January 2019.
- The impacts of the COVID-19 pandemic on the economic assumptions used in this report. It is important to note that the COVID-19 pandemic is a very fluid situation that will likely continue to evolve for some time. We have estimated the impacts based on the information known at the time the report was prepared. The final impacts of this health and economic crisis will likely generate some differences in the future.
The introduction of additional benefits under the Québec Pension Plan (QPP) (commencing 1 January 2019) have also been taken into account. As such, the estimates presented in this report now take account of both the additional Canada Pension Plan (CPP) and the additional QPP.
Table 1 presents a summary of the most important assumptions used in this report compared with those used in the previous (14th) triennial report. The assumptions are described in more detail in Appendix D of this report.
| Canada | 16th Report (as at 31 December 2018) |
14th Report (as at 31 December 2015) |
||||||
|---|---|---|---|---|---|---|---|---|
| Total Fertility Rate | 1.62 (2027+) | 1.65 (2019+) | ||||||
| Mortality | Statistics Canada Life Table (CLT 3-year average table: 2014 – 2016) with assumed future improvements |
Canadian Human Mortality Database (CHMD 2011) with assumed future improvements |
||||||
| Canadian Life Expectancy | Males | Females | Males | Females | ||||
| at birth in 2019 | 86.9 years | 89.9 years | 87.0 years | 89.9 years | ||||
| at age 65 in 2019 | 21.4 years | 23.9 years | 21.5 years | 23.9 years | ||||
| Net Migration Rate | 0.62% of population (for 2021+) | 0.62% of population (for 2016+) | ||||||
| Participation Rate (age group 18-69) | 79.2% | (2035) | 79.1%Table 1 - Footnote 2 | (2035) | ||||
| Employment Rate (age group 18-69) | 74.4% | (2035) | 74.4%Table 1 - Footnote 2 | (2035) | ||||
| Unemployment Rate (ages 15+) | 6.2% | (2030+) | 6.2% | (2025+) | ||||
| Rate of Increase in Prices | 2.0% | (2021+) | 2.0% | (2017+) | ||||
| Real Wage Increase | 1.0% | (2025+) | 1.1% | (2025+) | ||||
| 2019 | 2030 | 2060 | 2019 | 2030 | 2060 | |||
| Recipient ratesTable 1 - Footnote 1 | OAS: | 96.3% | 97.0% | 97.5% | OAS: | 96.1% | 96.7% | 97.2% |
| GIS: | 31.1% | 33.4% | 26.3% | GIS: | 30.7% | 31.2% | 25.3% | |
| Allowance: | 2.8% | 4.3% | 3.1% | Allowance: | 2.8% | 3.2% | 2.6% | |
|
||||||||
3.2. Demographic Assumptions
The population projections start with the population of Canada on 1 July 2018, to which are applied fertility, migration, and mortality assumptions. The population projections are essential to determine the future number of OAS program beneficiaries. The distribution of the population by age changed considerably with the arrival of the baby boom generation, and the population has been aging since. The causes of this aging are examined in the following subsections.
3.2.1. Fertility
The first cause of the aging of the Canadian population is the decline in the total fertility rate that occurred during the last 50 years. The total fertility rate in Canada decreased rapidly from a level of about 4.0 children per woman in the late 1950s to 1.6 by the mid-1980s. The total fertility rate rose slightly in the early 1990s, but then declined to a level of 1.5 by the late 1990s. Canada is one of many industrialized countries that saw their fertility rates increase starting in the 2000s. By 2008, the total fertility rate for Canada reached 1.68. However, in some industrialized countries, including Canada, the total fertility rate has decreased since 2008, which could be attributable to the most recent economic downturn experienced. As of 2017, the total fertility rate for Canada stood at 1.55Footnote 4.
The overall decrease in the total fertility rate since the 1950s occurred as a result of changes in a variety of social, medical, and economic factors. Although there have been periods of growth in the total fertility rates in recent decades, it is unlikely that the rates will return to historical levels in the absence of significant societal changes. The assumed age-specific fertility rates lead to an assumed total fertility rate for Canada that will increase from its 2017 level of 1.55 children per woman to an ultimate level of 1.62 in 2027.
3.2.2. Mortality
Another element that has contributed to the aging of the population is the significant reduction in the age-specific mortality rates. This can be measured by the increase in life expectancy at age 65, which directly affects how long retirement benefits will be paid to beneficiaries. Male life expectancy (without future mortality improvements, i.e. reductions in mortality) at age 65 increased by 42% between 1966 and 2015, rising from 13.6 to 19.3 years. For women, life expectancy at age 65 (without future improvements) increased by 31%, from 16.9 to 22.1 years over the same period. Although the overall gains in life expectancy at age 65 since 1966 are similar for males and females (between 5 and 6 years), about 65% of the increase occurred after 1991 for males, while for females, only about 45% of the increase occurred in that period.
Mortality improvements are expected to continue in the future, but at a slower pace than most recently observed over the 15-year period ending in 2015. Further, it is assumed that ultimately, mortality improvement rates for males will decrease to the same level as for females. The analysis of the Canadian experience over the period 1925 to 2015, including the recent slowdown trends observed in mortality improvement rates for OAS beneficiariesFootnote 5, was combined with an analysis of the possible drivers of future mortality improvements.
The 15-year average mortality improvement rates by age and sex for the period ending in 2015 are the starting point for the projected annual mortality improvement rates from 2016 onward. For ages 65 and over, the annual mortality improvement rates for 2016 to 2017 were estimated using the trends derived from the administrative data on OAS beneficiaries, representing 98% of the general population.
Starting from 2015 (2017 for ages 65 and over), the rates are assumed to gradually reduce to their ultimate levels in 2035, which are for both sexes 0.8% per year for ages below 90, 0.5% for ages 90 to 94, and 0.2% for ages 95 and above. Considering future mortality improvements, life expectancy at age 65 in 2019 is projected to be 21.4 years for males, and 23.9 years for females. This represents a decrease of 0.1 years in life expectancy at age 65 in 2019 for males and no change for females, relative to the 14th OAS Actuarial Report projections.
3.2.3. Net Migration
Net migration corresponds to the number of immigrants less the number of emigrants, plus the number of returning Canadians and the net increase in the number of non-permanent residents.
The net migration rate is expected to decrease from its current (2018) level of 1.11% of the population to 0.86% in 2019, 0.73% in 2020, and reach an ultimate level of 0.62% of the population for the year 2021 and thereafter. The ultimate net migration rate of 0.62% corresponds to the average experience observed over the last 10 years, excluding the net increase in non-permanent residents during that period.
3.2.4. Population Projections
Table 2 shows the population of Canada for three age groups (0-19, 20-64 and 65 and over) throughout the projection period. The ratio of the number of people aged 20-64 to those aged 65 and over is a measure that approximates the ratio of the number of working-age people to retirees. Because of the aging population, this ratio is projected to drop from 3.3 in 2020 to 2.0 in 2060.
The number of people reaching age 65 in any given year is a good indicator of the number of new basic pension beneficiaries coming into pay each year. This population is expected to increase from 475,000 in 2020 to 523,000 by 2030.
| Year | Total | Age 0-19 | Age 20-64 | Age 65 and Over |
Ratio of 20‑64 to 65 and Over |
Reaching Age 65 |
|---|---|---|---|---|---|---|
| 2019 | 37,499 | 8,115 | 22,780 | 6,604 | 3.4 | 457 |
| 2020 | 37,899 | 8,144 | 22,892 | 6,862 | 3.3 | 475 |
| 2021 | 38,259 | 8,175 | 22,961 | 7,122 | 3.2 | 482 |
| 2022 | 38,621 | 8,226 | 23,005 | 7,390 | 3.1 | 496 |
| 2023 | 38,986 | 8,292 | 23,031 | 7,663 | 3.0 | 507 |
| 2024 | 39,351 | 8,361 | 23,054 | 7,937 | 2.9 | 513 |
| 2025 | 39,717 | 8,437 | 23,065 | 8,215 | 2.8 | 525 |
| 2030 | 41,502 | 8,726 | 23,248 | 9,528 | 2.4 | 523 |
| 2035 | 43,108 | 8,957 | 23,828 | 10,323 | 2.3 | 475 |
| 2040 | 44,512 | 9,157 | 24,520 | 10,836 | 2.3 | 471 |
| 2045 | 45,769 | 9,265 | 25,258 | 11,245 | 2.2 | 511 |
| 2050 | 46,948 | 9,357 | 25,864 | 11,727 | 2.2 | 554 |
| 2055 | 48,124 | 9,534 | 26,308 | 12,282 | 2.1 | 604 |
| 2060 | 49,362 | 9,790 | 26,585 | 12,988 | 2.0 | 623 |
3.3. Economic Assumptions
The OAS program expenditures are presented as cost ratios using two different measurement bases, namely total employment earnings and the GDP. These cost bases are projected using economic assumptions for indicators such as labour force participation rates, job creation rates, unemployment rates, and nominal increases in average employment earnings. For benefit projection purposes, assumptions regarding the rate of increase in prices and recipient rates for the various benefits are also required.
All economic assumptions are consistent with the 30th CPP Actuarial Report, except that we have adjusted some of the economic assumptions to reflect the impacts of the COVID-19 pandemic. The details of these adjustments appear in section 4 of Appendix D. It is important to note that the COVID-19 pandemic is a very fluid situation that will likely continue to evolve for some time. We have estimated the impacts based on the information known at the time the report was prepared. The final impacts of this health and economic crisis will likely generate some differences in the future.
One of the key elements underlying the best estimate economic assumptions relates to the continued trend toward longer working lives. Older workers are expected to exit the workforce at a later age, which could alleviate the impact of the aging of the population on future labour force growth. However, despite the expected later exit ages, labour force growth is projected to weaken as the working-age population expands at a slower pace and baby boomers exit the labour force. As a result, labour shortages together with projected improvements in productivity growth are assumed to create upward pressure on real wages until 2025.
3.3.1. Labour Force
Employment levels vary with the rate of unemployment, and reflect trends in increased workforce participation by women, longer periods of formal education among young adults, as well as changing retirement patterns of older workers.
As the population ages, older age groups with lower labour force participation increase in size. As a result, the labour force participation rate for Canadians aged 15 and over is expected to decline from 65.2% in 2019 to 63.0% in 2035. A more useful measure of the working-age population is the participation rate of those aged 18 to 69, which is expected to increase from 76.0% in 2019 to 79.2% in 2035.
The increase in the participation rate for those aged 18 to 69 is mainly due to an assumed increase in participation rates for those aged 55 and over as a result of an expected continued trend toward longer working lives. Furthermore, labour shortages create attractive employment opportunities that will continue to exert upward pressure on the participation rates for all age groups. It is also expected that future participation rates will increase with the aging of cohorts that have a stronger labour force attachment compared to previous cohorts due to higher education attainment. The cohort effect of stronger labour force attachment of women is expected to continue but at a much slower pace than in the past, resulting in a gradual narrowing of the gap between the age-specific participation rates of men and women.
As a result, the participation rates for females are projected to increase slightly more than for males. Overall, the male participation rate of those aged 18 to 69 is expected to increase from 79.8% in 2019 to 82.8% in 2035, while the female participation rate for the same age group is expected to increase from 72.1% in 2019 to 75.6% in 2035. Thereafter, the 2035 gap of 7.2% between males and females in this age group is expected to vary between 7.0% and 7.2%.
The job creation rate (i.e. the change in the number of persons employed) in Canada was on average 1.6% from 1976 to 2018 based on available employment data, and it is assumed that the rate will be 1.1% in 2019. The job creation rate assumption is determined on the basis of expected moderate economic growth. However, as a result of the COVID-19 pandemic, the unemployment rate is assumed to increase significantly in 2020, and then to revert to its pre-pandemic projected level by 2024 before reaching its ultimate level in 2030. The unemployment rate for Canada, ages 15 and over, is expected to increase from 5.8% in 2018 to 5.9% in 2019, and to 10.5% in 2020. It is then expected to decrease to 6.0% by 2024, before gradually increasing to an ultimate level of 6.2% by 2030. In 2020, the assumed job creation rate for Canada, ages 15 and over, is expected to be -4.1%, compared to an annual average of 1.9% from 2021 to 2024 and 0.6% from 2025 to 2030. It is assumed that, starting in 2030, the job creation rate will follow the labour force growth rate, with both averaging 0.7% per year between 2030 and 2035, and 0.5% per year thereafter. The aging of the population is the main reason behind the expected slower long-term growth in the labour force and job creation rate.
3.3.2. Price Increases
Price increases, as measured by changes in the Consumer Price Index (CPI), tend to fluctuate from year to year. In Canada, increases in prices (inflation) was 2.3% in 2018.
In 2016, the Bank of Canada and the Government renewed their commitment to keep inflation between 1% and 3% until the end of 2021. The Senior Deputy Governor of the Bank of Canada indicated in November 2018 that the Bank was undergoing an extensive review of its monetary policy framework. A number of variants to replace the inflation target are being explored. The Bank is also looking at a possible dual mandate of targeting inflation as well as GDP growth or employmentFootnote 6. Nevertheless, given the success of the 2% inflation target, it is considered very likely that the Bank will renew its inflation target commitment or that the target will at least constitute an important part of the Bank's future mandate.
Price increase forecasts from various economists indicate an average increase in prices of 2.0% from 2019 to 2040. To reflect these forecasts and the expectation that the Bank of Canada will renew its inflation target, the price increase assumption is set at 2.0% for 2019, 1.0% in 2020 (to reflect the impact of COVID-19) and at 2.0% thereafter.
3.3.3. Real Wage Increases
Wage increases affect the financial balance of the OAS program in two ways. In the short term, an increase in the average wage translates into higher total employment earnings and GDP, with little immediate impact on benefits. Therefore, costs in relation to these measurement bases will decrease. Over the longer term, higher average wages in relation to the level of prices could be expected to produce lower payouts for income-tested benefits such as the GIS and Allowance.
The difference between nominal wage increases and inflation represents increases in the real wage, which is also referred to in this report as the real wage increase. There are five main factors that influence increases in the real wage, namely general productivity, the extent to which changes in productivity are shared between labour and capital, changes in the compensation structure offered to employees, changes in the average number of hours worked, and changes in labour's terms of tradeFootnote 7.
The real wage increase is projected to gradually rise from 0.3% in 2019 to an ultimate value of 1.0% by 2025. The ultimate real wage increase assumption is developed taking into account the relationships described above, historical trends, labour shortages, and other changes in the labour market. The ultimate real wage increase assumption combined with the ultimate price increase assumption results in an assumed annual increase in average nominal wages of 3.0% in 2025 and thereafter.
The assumptions regarding the increase in average real annual employment earnings and job creation rates result in projected average annual real increases in total Canadian employment earnings of about 1.6% for the period 2018 to 2035. After 2035, this decreases to about 1.5% on average over the remainder of the projection period, reflecting the assumed 1.0% real increase in annual wages and projected average 0.5% annual growth in the working age population.
Given historical trends and the long-term relationship between increases in the average annual employment earnings and the YMPE, it is assumed that the nominal wage increase assumption is also applicable to the increases in the YMPE from one year to the next. Table 3 summarizes the main economic assumptions over the projection period.
| Year | Real Increase Average Annual Earnings |
Real Increase Average Weekly Earnings |
Price Increase |
Labour Force (Canada) | |||
|---|---|---|---|---|---|---|---|
| Participation Rate (Ages 15+) |
Job Creation Rate |
Unemployment Rate |
Labour Force Annual Increase |
||||
| 2019 | 0.3 | 0.3 | 2.0 | 65.2 | 1.1 | 5.9 | 1.1 |
| 2020 | 0.5 | 0.5 | 1.0 | 65.1 | (4.1) | 10.5 | 0.8 |
| 2021 | 0.6 | 0.6 | 2.0 | 64.9 | 3.5 | 8.0 | 0.7 |
| 2022 | 0.7 | 0.7 | 2.0 | 64.7 | 1.8 | 7.0 | 0.7 |
| 2023 | 0.8 | 0.8 | 2.0 | 64.5 | 1.2 | 6.5 | 0.7 |
| 2024 | 0.9 | 0.9 | 2.0 | 64.3 | 1.2 | 6.0 | 0.7 |
| 2025 | 1.0 | 1.0 | 2.0 | 64.1 | 0.6 | 6.1 | 0.7 |
| 2030 | 1.0 | 1.0 | 2.0 | 63.2 | 0.6 | 6.2 | 0.6 |
| 2035 | 1.0 | 1.0 | 2.0 | 63.0 | 0.7 | 6.2 | 0.7 |
| 2040 | 1.0 | 1.0 | 2.0 | 62.5 | 0.6 | 6.2 | 0.6 |
| 2045 | 1.0 | 1.0 | 2.0 | 62.2 | 0.5 | 6.2 | 0.5 |
| 2050 | 1.0 | 1.0 | 2.0 | 61.9 | 0.4 | 6.2 | 0.4 |
| 2055 | 1.0 | 1.0 | 2.0 | 61.5 | 0.3 | 6.2 | 0.3 |
| 2060 | 1.0 | 1.0 | 2.0 | 61.0 | 0.3 | 6.2 | 0.3 |
3.3.4. Recipient Rates
OAS recipient rates represent the proportion of the Canadian population that has received (historically), receives, or is projected to receive OAS program benefits. Recipient rates are different than coverage or eligibility rates for benefits, which are higher, since individuals upon becoming eligible for benefits don't necessarily apply for them immediately, but may rather defer application and commencement of their benefits (for reasons such as to receive actuarially-adjusted higher benefits for voluntary deferrals or to increase benefits from partial to full amounts by accruing more years of residence).
The recipient rate for a given benefit is derived as the ratio of the number of beneficiaries receiving that benefit to the population. It is worth noting that recipient rates for the OAS basic pension presented in this report exclude the impact of the OAS Recovery Tax. The impact of the OAS Recovery Tax on the basic pension recipient rates is discussed in section 5 of Appendix D of this report.
As shown in Table 4, the overall basic pension recipient rate for males is projected to increase from 95.5% in 2019 to 97.0% in 2060, while for females it is projected to increase from 97.1% to 98.0% over the same period. The rates for both sexes increase over time primarily due to the aging of the population. Moreover, the basic pension recipient rates include benefits paid outside of Canada and as such, could exceed 100%.
The GIS and Allowance recipient rates by age, sex, type and level of benefit for year 2019 were used as the starting point for determining the corresponding best-estimate assumptions. These rates were further adjusted for years 2020 and thereafter to account for the new income exemption that will come into effect on 1 July 2020.
GIS and Allowance recipient rates are projected under the assumption that initial retirement income increases in line with the rate of wage growth, where such retirement income mainly comprises CPP and QPP benefits (including additional CPP and QPP benefits starting in 2019). At the same time, it is assumed that the income limits for the GIS and Allowance will have increased in line with inflation prior to retirement. Together, this would normally result in a lower proportion of new retirees becoming eligible for these benefits over the projection period. However, the effect of TFSA income being excluded for GIS and Allowance benefits is projected to partially offset the expected decline in recipient rates for these benefits. For this report, the impact of the additional CPP and QPP benefits on eligibility and level of benefit has also been reflected. Section 5 of Appendix D of this report discusses in more detail the effect of the additional CPP and QPP on GIS and Allowance benefits.
Furthermore, for the GIS and Allowance, experience adjustment factors are used to adjust the projected recipient rates so that characteristics and trends of historical recipient rates by age, sex, type and level of benefit over the period 2015 to 2019 would be reproduced more closely. These experience adjustment factors are used for the first five years of the projection period, so that there is a gradual change in the assumed recipient rates by level of benefit that reflects a transition from the historical experience to the longer term projections.
Table 4 presents a summary of the projected recipient rates by type of benefit.
| Males | Females | |||||
|---|---|---|---|---|---|---|
| 2019 | 2030 | 2060 | 2019 | 2030 | 2060 | |
| OAS | 95.5 | 96.4 | 97.0 | 97.1 | 97.5 | 98.0 |
| GIS-Single | 11.8 | 12.8 | 10.6 | 24.2 | 24.9 | 21.6 |
| GIS-Spouse a Pensioner | 11.1 | 12.4 | 8.6 | 9.5 | 10.9 | 7.6 |
| GIS-Spouse not a Pensioner | 2.5 | 2.6 | 1.7 | 0.8 | 0.8 | 0.6 |
| GIS-Spouse with Allowance | 1.5 | 1.7 | 1.3 | 0.2 | 0.3 | 0.2 |
| GIS-AllTable 4 - Footnote 3 | 26.9 | 29.4 | 22.2 | 34.6 | 36.9 | 30.0 |
| Allowance-Regular | 0.5 | 1.2 | 0.9 | 3.4 | 6.0 | 4.9 |
| Allowance-Survivor | 0.2 | 0.2 | 0.1 | 1.5 | 1.0 | 0.3 |
| Allowance-AllTable 4 - Footnote 3 | 0.7 | 1.3 | 0.9 | 4.9 | 7.1 | 5.3 |
|
||||||
4. Results
4.1. Overview
The key observations and findings of this report are described below.
- Demographic changes, notably the aging of the Canadian population, will have a major impact on the ratio of the number of people aged 20 to 64 to those aged 65 and over. This ratio is projected to fall from about 3.3 in 2020 to 2.0 in 2060. Chart 1 shows an analysis of the Canadian population by age group.
- The number of beneficiaries of the OAS basic pension is projected to increase by 53% over the period 2020 to 2035, growing from 6.6 million in 2020 to 10.1 million by 2035, mainly due to the retirement of the baby boom generation reaching age 65 over that period. Thereafter, the growth in the number of beneficiaries is projected to slow down. By 2060, the number of OAS basic pension beneficiaries is projected to reach 12.7 million.
- OAS basic pension annual expenditures are projected to increase from $46.3 billion in 2020 to $94.3 billion in 2035 and $195.5 billion by 2060.
- The number of GIS and Allowance beneficiaries is projected to increase by 52% over the period 2020 to 2035, growing from 2.3 million in 2020 to 3.5 million by 2035. The GIS recipient rate (i.e. the proportion of the Canadian population that has received, receives, or is projected to receive the GIS) is projected to slowly increase from of 32.3% in 2020 to 33.1% in 2035 and to then slowly decrease to 26.3% by 2060.
- GIS and Allowance annual expenditures are projected to increase from $14.3 billion in 2020 to $28.6 billion in 2035 and $46.9 billion by 2060.
- The introduction of the additional CPP and QPP will reduce the GIS and Allowance recipient rates and the amount of expenditures. The impact of the additional CPP and QPP will be very gradual and, by 2060, together with other factors, lead to projected reductions of 390,000 (or -10.2%) in the number of GIS beneficiaries and of $4.8 billon (or -9.6%) in annual GIS expenditures.
- Total annual OAS program expenditures are projected to increase from $60.8 billion in 2020 to $123.4 billion in 2035 and $243.4 billion by 2060.
- The ratio of program expenditures to the GDP is projected to be 2.77% in 2020 compared to 2.50% in 2019. This substantial year-over-year increase is mainly due to the estimated negative impact of COVID-19 on the GDP. Thereafter, as shown in Chart 2, this ratio is projected to reach a high of 3.1% between 2030 and 2037. After 2037, the ratio of expenditures to GDP is projected to gradually decrease to a level of 2.63% by 2060 which is comparable to the historical levels of the early 1990s. This reduction is mainly attributable to expected slower growth in inflation compared to growth in wages and GDP and increases in additional CPP and QPP benefits.
Over time, price indexation of benefits that increases more slowly than the rate of growth in average employment earnings means that benefits will replace a decreasing share of an individual's pre-retirement earnings. In the past, this issue has been addressed through occasional ad hoc increases in the benefit rates. One of the sensitivity tests shown in Appendix A of this report provides an indication of the impact on projected results if benefit rates were increased to partially reflect the growth in real wages.
Chart 1 - Analysis of Population of Canada by Age Group
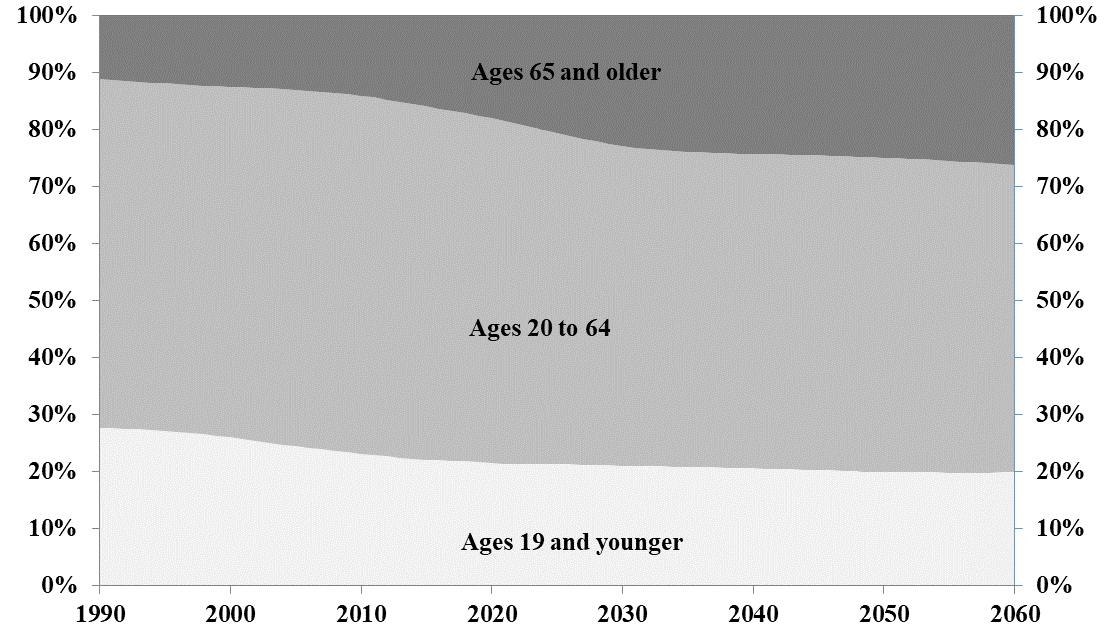
Chart 1 - Description
Stacked area chart showing the historical and projected distribution by age group of Canada's population. Y axis represents the percentage of the population. X axis represents the year.
The population aged 0 to 19 represents 28% of the total population in 1990, decreases to 22% by 2018, and is projected to further decrease to 20% by 2060.
The population aged 20 to 64 represents 61% of the total population in 1990 and in 2018, and is projected to decrease to 54% in 2060.
The population aged 65 and over represents 11% of the total population in 1990, increases to 17% in 2018, and is projected to increase to 26% in 2060.
Chart 2 - Expenditures as a Proportion of GDP
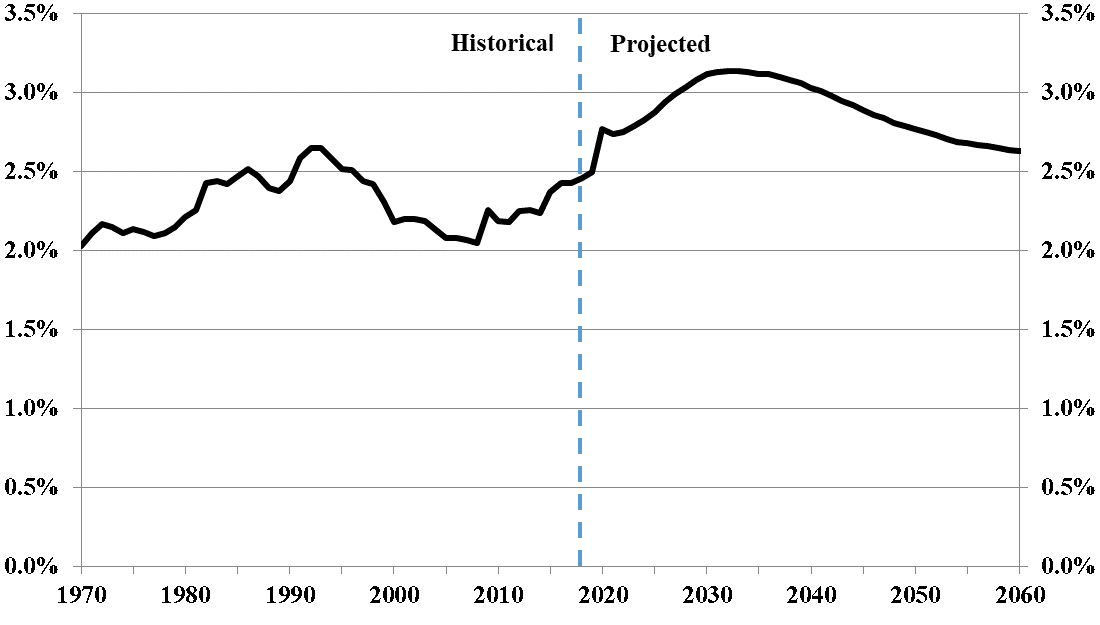
Chart 2 - Description
Line chart showing the historical and projected total OAS program expenditures as a percentage of GDP for Canada. Y axis represents the percentage of GDP. X axis represents the year.
Total OAS program expenditures are 2.03% of GDP in 1970, increase to reach 2.65% in 1992, then decrease to 2.05% in 2008, and increase again to 2.46% in 2018. After 2018, the proportion is projected to increase to 3.14% in 2032, and then decrease to 2.63% in 2060.
4.2. Number of Beneficiaries
Table 5 and Table 6 present the historical and projected number of beneficiaries along with the respective overall recipient rates. The number of beneficiaries is the product of the population and the relevant recipient rates, which vary by year, age, sex, and type and level of benefit. Beneficiaries include those who receive benefits outside of Canada. In 2018, about 1.4% of the population aged 65 and older was receiving a basic pension outside of Canada under international social security agreements.
The recipient rates shown in Table 6 reflect the eligible ages for program benefits, that is age 65 and over for the OAS basic pension and GIS, and ages 60 to 64 for the Allowance benefit. The OAS recipient rates also account for voluntary deferrals, which became effective 1 July 2013. The OAS basic pension recipient rates and number of beneficiaries shown in Table 5 and Table 6 are on a gross basis; that is, they have not been adjusted to account for the application of the OAS Recovery Tax, which is a provision of the Income Tax Act.
The OAS Recovery Tax, which applies to high-income pensioners, effectively reduces recipient rates, since very high-income pensioners may have their benefit completely reduced. It is projected that 8.0% (or 527,000) of all OAS pensioners in 2020 will be affected by the Recovery Tax. Of this group, 183,000 or 2.8% of all OAS pensioners that year will have their pensions completely reduced. In 2060, those affected by the Recovery Tax are projected to represent 9.9% (1.25 million) of all OAS pensioners, while those fully affected are projected to represent 3.2% (400,000) of pensioners. Section 5 of Appendix D presents more detailed information on the projected impact of the OAS Recovery Tax on the number of OAS basic pension beneficiaries and total amounts payable.
As shown in Table 6 , the number of beneficiaries for the basic pension is expected to increase by 53% over the period 2020 to 2035, growing from 6.6 million in 2020 to 10.1 million by the end of 2035. After 2035, due to the relative stability in the growth of the population aged 65 and over and in the basic pension recipient rates, the number of beneficiaries is expected to continue to increase but at a slower pace to reach 12.7 million by the end of the projection period.
The number of GIS beneficiaries is projected to increase by 55% over the period 2020 to 2035, growing from 2.2 million in 2020 to 3.4 million by 2035. Over that period, the increase in the number of basic pension and GIS beneficiaries is mainly a result of the aging of the population and the retirement of the baby boomers.
It is assumed that, for each cohort of individuals who may become eligible for the GIS or Allowance, the initial retirement income will consist mainly of base and additional CPP and QPP benefits. Both base and additional CPP and QPP benefits increase in line with wage growth prior to retirement and additional benefits further increase as the additional Plans mature. At the same time, it is assumed that the income limits for the GIS and Allowance will have increased in line with inflation prior to retirement. Over the projection period, this combined effect would have the overall effect of reducing the number of individuals who might have otherwise been eligible for the GIS or Allowance benefits. Section 5 of Appendix D provides more detailed information on the projected impact of additional CPP and QPP benefits on the number and total amounts of GIS benefits payable.
The number of Allowance beneficiaries is projected to increase over the period 2020 to 2030, going from 96,000 in 2020 to 102,000 by the end of 2030, with the recipient rates slightly increasing from 3.8% to 4.3% over the same period. After 2030, while the growth in the population aged 60 to 64 stabilizes, the Allowance recipient rate slowly decreases to reach 3.1% (96,000 recipients) by 2060. The expected decrease in the number of Allowance beneficiaries is mainly due to the difference between inflation and wage growth prior to retirement and additional CPP and QPP benefits that are assumed to eventually outweigh any increase in beneficiaries due to the effect of TFSAs.
| Year | Population Age 65+ (thousands) |
Number of Beneficiaries (thousands) | Recipient Rates (percentages) | ||||
|---|---|---|---|---|---|---|---|
| OAS | GIS | Allowance | OAS | GIS | Allowance | ||
| 1966 | 1,222 | 1,199 | - | - | 98.1 | - | - |
| 1970 | 1,716 | 1,689 | 816 | - | 98.4 | 47.6 | - |
| 1975 | 1,957 | 1,925 | 1,069 | 74 | 98.4 | 54.6 | 8.2 |
| 1980 | 2,306 | 2,259 | 1,191 | 80 | 98.0 | 51.7 | 8.4 |
| 1985 | 2,648 | 2,595 | 1,290 | 119 | 98.0 | 48.7 | 10.5 |
| 1986 | 2,737 | 2,683 | 1,316 | 139 | 98.0 | 48.1 | 12.2 |
| 1987 | 2,839 | 2,778 | 1,336 | 140 | 97.9 | 47.1 | 12.2 |
| 1988 | 2,929 | 2,862 | 1,342 | 135 | 97.7 | 45.8 | 11.6 |
| 1989 | 3,028 | 2,948 | 1,339 | 128 | 97.4 | 44.2 | 10.9 |
| 1990 | 3,124 | 3,036 | 1,325 | 121 | 97.2 | 42.4 | 10.3 |
| 1991 | 3,212 | 3,127 | 1,309 | 115 | 97.3 | 40.8 | 9.6 |
| 1992 | 3,291 | 3,210 | 1,300 | 110 | 97.5 | 39.5 | 9.2 |
| 1993 | 3,366 | 3,289 | 1,313 | 108 | 97.7 | 39.0 | 8.9 |
| 1994 | 3,434 | 3,367 | 1,340 | 109 | 98.0 | 39.0 | 9.0 |
| 1995 | 3,506 | 3,447 | 1,338 | 108 | 98.3 | 38.2 | 8.9 |
| 1996 | 3,579 | 3,524 | 1,341 | 101 | 98.5 | 37.5 | 8.3 |
| 1997 | 3,654 | 3,594 | 1,364 | 100 | 98.3 | 37.3 | 8.3 |
| 1998 | 3,724 | 3,656 | 1,368 | 97 | 98.2 | 36.7 | 8.0 |
| 1999 | 3,785 | 3,715 | 1,372 | 97 | 98.1 | 36.2 | 7.9 |
| 2000 | 3,851 | 3,781 | 1,363 | 95 | 98.2 | 35.4 | 7.6 |
| 2001 | 3,922 | 3,852 | 1,360 | 93 | 98.2 | 34.7 | 7.2 |
| 2002 | 3,989 | 3,923 | 1,404 | 92 | 98.3 | 35.2 | 6.9 |
| 2003 | 4,061 | 3,999 | 1,450 | 92 | 98.5 | 35.7 | 6.6 |
| 2004 | 4,136 | 4,078 | 1,483 | 93 | 98.6 | 35.8 | 6.3 |
| 2005 | 4,214 | 4,163 | 1,515 | 94 | 98.8 | 35.9 | 6.2 |
| 2006 | 4,319 | 4,261 | 1,546 | 94 | 98.7 | 35.8 | 5.9 |
| 2007 | 4,421 | 4,362 | 1,580 | 94 | 98.7 | 35.7 | 5.5 |
| 2008 | 4,541 | 4,478 | 1,584 | 93 | 98.6 | 34.9 | 5.2 |
| 2009 | 4,669 | 4,603 | 1,595 | 90 | 98.6 | 34.2 | 4.8 |
| 2010 | 4,804 | 4,732 | 1,614 | 92 | 98.5 | 33.6 | 4.6 |
| 2011 | 4,955 | 4,879 | 1,662 | 90 | 98.5 | 33.5 | 4.4 |
| 2012 | 5,155 | 5,076 | 1,701 | 90 | 98.5 | 33.0 | 4.3 |
| 2013 | 5,353 | 5,262 | 1,738 | 84 | 98.3 | 32.5 | 4.0 |
| 2014 | 5,542 | 5,436 | 1,742 | 80 | 98.1 | 31.4 | 3.7 |
| 2015 | 5,722 | 5,597 | 1,798 | 77 | 97.8 | 31.4 | 3.4 |
| 2016 | 5,921 | 5,761 | 1,860 | 73 | 97.3 | 31.4 | 3.2 |
| 2017 | 6,136 | 5,944 | 1,927 | 72 | 96.9 | 31.4 | 3.0 |
| 2018 | 6,358 | 6,154 | 1,985 | 73 | 96.8 | 31.2 | 3.0 |
|
|||||||
| Year | Population Age 65+ (thousands) |
Number of Beneficiaries (thousands) | Recipient Rates (percentages)Table 6 - Footnote 2 | |||||
|---|---|---|---|---|---|---|---|---|
| OAS | GIS | Allowance | OAS | GIS | Allowance | |||
| 2019 | 6,604 | 6,362 | 2,052 | 71 | 96.3 | 31.1 | 2.8 | |
| 2020 | 6,862 | 6,616 | 2,214 | 96 | 96.4 | 32.3 | 3.8 | |
| 2021 | 7,122 | 6,874 | 2,306 | 97 | 96.5 | 32.4 | 3.7 | |
| 2022 | 7,390 | 7,137 | 2,406 | 97 | 96.6 | 32.6 | 3.7 | |
| 2023 | 7,663 | 7,406 | 2,507 | 98 | 96.6 | 32.7 | 3.7 | |
| 2024 | 7,937 | 7,673 | 2,607 | 99 | 96.7 | 32.9 | 3.7 | |
| 2025 | 8,215 | 7,945 | 2,704 | 100 | 96.7 | 32.9 | 3.7 | |
| 2026 | 8,493 | 8,218 | 2,803 | 101 | 96.8 | 33.0 | 3.8 | |
| 2027 | 8,761 | 8,482 | 2,902 | 102 | 96.8 | 33.1 | 3.9 | |
| 2028 | 9,032 | 8,749 | 3,004 | 103 | 96.9 | 33.3 | 4.1 | |
| 2029 | 9,292 | 9,007 | 3,105 | 103 | 96.9 | 33.4 | 4.2 | |
| 2030 | 9,528 | 9,244 | 3,179 | 102 | 97.0 | 33.4 | 4.3 | |
| 2031 | 9,725 | 9,445 | 3,238 | 101 | 97.1 | 33.3 | 4.2 | |
| 2032 | 9,888 | 9,615 | 3,290 | 99 | 97.2 | 33.3 | 4.2 | |
| 2033 | 10,037 | 9,771 | 3,337 | 98 | 97.3 | 33.2 | 4.1 | |
| 2034 | 10,182 | 9,919 | 3,379 | 96 | 97.4 | 33.2 | 4.1 | |
| 2035 | 10,323 | 10,062 | 3,420 | 94 | 97.5 | 33.1 | 4.0 | |
| 2036 | 10,456 | 10,197 | 3,455 | 93 | 97.5 | 33.0 | 4.0 | |
| 2037 | 10,564 | 10,309 | 3,484 | 92 | 97.6 | 33.0 | 3.9 | |
| 2038 | 10,658 | 10,407 | 3,507 | 91 | 97.6 | 32.9 | 3.8 | |
| 2039 | 10,746 | 10,497 | 3,526 | 90 | 97.7 | 32.8 | 3.7 | |
| 2040 | 10,836 | 10,587 | 3,541 | 89 | 97.7 | 32.7 | 3.6 | |
| 2041 | 10,920 | 10,672 | 3,540 | 87 | 97.7 | 32.4 | 3.5 | |
| 2042 | 11,000 | 10,751 | 3,544 | 87 | 97.7 | 32.2 | 3.4 | |
| 2043 | 11,076 | 10,826 | 3,544 | 87 | 97.7 | 32.0 | 3.3 | |
| 2044 | 11,157 | 10,905 | 3,543 | 87 | 97.7 | 31.8 | 3.2 | |
| 2045 | 11,245 | 10,989 | 3,542 | 87 | 97.7 | 31.5 | 3.2 | |
| 2046 | 11,337 | 11,077 | 3,539 | 87 | 97.7 | 31.2 | 3.2 | |
| 2047 | 11,430 | 11,166 | 3,535 | 88 | 97.7 | 30.9 | 3.2 | |
| 2048 | 11,525 | 11,257 | 3,530 | 88 | 97.7 | 30.6 | 3.1 | |
| 2049 | 11,625 | 11,351 | 3,524 | 89 | 97.7 | 30.3 | 3.1 | |
| 2050 | 11,727 | 11,449 | 3,519 | 90 | 97.6 | 30.0 | 3.1 | |
| 2055 | 12,282 | 11,980 | 3,441 | 92 | 97.5 | 28.0 | 3.0 | |
| 2060 | 12,988 | 12,665 | 3,419 | 96 | 97.5 | 26.3 | 3.1 | |
|
||||||||
4.3. Expenditures and Average Annual Benefits
The historical and projected expenditures and average annual benefits by type are presented in Table 7 and Table 8 . The amounts of OAS basic pension benefits presented in Table 7 and Table 8 do not account for the OAS Recovery Tax in the determination of benefits. The OAS Recovery Tax reduces the OAS basic pension by 15 cents for each dollar of income above a minimum threshold. It is estimated that, in 2020, approximately 8.0% (or 527,000) of all OAS pensioners will be affected by the Recovery Tax, resulting in the repayment of about $2.1 billion or 4.4% of the total amount of basic pensions payable. Section 5 of Appendix D presents more detailed information on the projected impact of the OAS Recovery Tax on the basic pensions payable.
Total basic pension expenditures are projected to increase from $46.3 billion in 2020 to $94.3 billion by 2035 and $195.5 billion by 2060. The projected average annual basic pension of $6,994 in 2020 is equal to about 95% of the projected maximum annual OAS pension for 2020. Since the full impact of the introduction of partial pensions in 1977 (for those with less than 40 years of residence) has been reached , the average annual benefit as a percentage of the maximum is assumed to remain relatively stable at the level of 95% throughout the projection period. The OAS basic pension expenditures and average benefits also account for voluntary deferrals, which became effective 1 July 2013.
The amounts of GIS and Allowance expenditures presented in Table 8 account for additional CPP and QPP benefits that started being paid in 2019. Section 5 of Appendix D presents more detailed information on the projected impact of the additional CPP and QPP on these benefits. For each benefit, total expenditures are the product of the number of beneficiaries and respective average benefit by age, sex, and type and level of benefit.
Total GIS expenditures are projected to increase from $13.7 billion in 2020 to $27.7 billion by 2035 and $45.6 billion by 2060. The projected average annual GIS benefit is $6,361 in 2021 (first year full implementation of new income exemption), which is about 57% of the projected maximum annual GIS single rate for 2021. In the long term, the interaction of TFSAs and additional CPP and QPP benefits results in the average GIS benefit slightly decreasing to about 55% of the maximum GIS single rate by the end of the projection period.
Total Allowance expenditures are projected to increase from $628 million in 2020 to $874 million by 2035 and $1.3 billion by 2060. The projected overall average annual Allowance benefit is $7,376 in 2021 (first year full implementation of new income exemption), which is about 52% of the projected maximum regular annual benefit for 2021. In the long term, the interaction of TFSAs and additional CPP and QPP benefits results in the average Allowance benefit decreasing to about 45% of the maximum Allowance regular rate by the end of the projection period.
Projected total annual OAS program expenditures for all benefits and administrative expenses are $60.8 billion in 2020, rising to $123.4 billion in 2035 and $243.4 billion by 2060. OAS basic pension benefits are projected to be 76% of total expenditures in 2020, and this proportion is expected to increase to 80% by 2060.
| Year | Expenditures ($ million) | Average Annual Benefit ($) | ||||||
|---|---|---|---|---|---|---|---|---|
| OAS | GIS | Allowance | Administrative Expenses |
Total | OAS | GIS | Allowance | |
| 1966 | 1,007 | - | - | 5 | 1,012 | 840 | - | - |
| 1970 | 1,611 | 274 | - | 9 | 1,894 | 954 | 336 | - |
| 1975 | 2,883 | 896 | 13 | 10 | 3,802 | 1,498 | 838 | 180 |
| 1980 | 5,147 | 1,772 | 169 | 34 | 7,122 | 2,279 | 1,488 | 2,127 |
| 1985 | 8,696 | 3,278 | 295 | 60 | 12,329 | 3,351 | 2,542 | 2,478 |
| 1986 | 9,346 | 3,419 | 468 | 59 | 13,292 | 3,484 | 2,598 | 3,356 |
| 1987 | 10,070 | 3,577 | 482 | 59 | 14,188 | 3,624 | 2,677 | 3,446 |
| 1988 | 10,774 | 3,725 | 476 | 56 | 15,031 | 3,764 | 2,776 | 3,521 |
| 1989 | 11,579 | 3,851 | 464 | 62 | 15,956 | 3,927 | 2,877 | 3,621 |
| 1990 | 12,484 | 3,954 | 452 | 67 | 16,957 | 4,112 | 2,985 | 3,732 |
| 1991 | 13,545 | 4,102 | 447 | 63 | 18,157 | 4,331 | 3,133 | 3,892 |
| 1992 | 14,292 | 4,227 | 438 | 77 | 19,034 | 4,452 | 3,252 | 3,964 |
| 1993 | 14,872 | 4,393 | 430 | 90 | 19,785 | 4,521 | 3,346 | 3,974 |
| 1994 | 15,403 | 4,587 | 431 | 91 | 20,512 | 4,574 | 3,423 | 3,967 |
| 1995 | 15,832 | 4,601 | 411 | 106 | 20,950 | 4,593 | 3,439 | 3,802 |
| 1996 | 16,433 | 4,636 | 398 | 104 | 21,571 | 4,663 | 3,458 | 3,956 |
| 1997 | 16,944 | 4,710 | 393 | 106 | 22,153 | 4,715 | 3,453 | 3,935 |
| 1998 | 17,470 | 4,810 | 386 | 109 | 22,775 | 4,779 | 3,517 | 3,964 |
| 1999 | 17,903 | 4,894 | 388 | 99 | 23,284 | 4,819 | 3,567 | 3,990 |
| 2000 | 18,669 | 5,019 | 389 | 89 | 24,166 | 4,937 | 3,682 | 4,087 |
| 2001 | 19,508 | 5,160 | 390 | 95 | 25,153 | 5,065 | 3,795 | 4,205 |
| 2002 | 20,318 | 5,417 | 397 | 99 | 26,231 | 5,179 | 3,858 | 4,326 |
| 2003 | 21,217 | 5,710 | 411 | 97 | 27,435 | 5,306 | 3,937 | 4,473 |
| 2004 | 21,923 | 5,954 | 453 | 104 | 28,434 | 5,376 | 4,015 | 4,885 |
| 2005 | 22,701 | 6,334 | 469 | 104 | 29,608 | 5,453 | 4,182 | 4,978 |
| 2006 | 23,737 | 6,800 | 497 | 97 | 31,131 | 5,570 | 4,399 | 5,287 |
| 2007 | 24,711 | 7,346 | 513 | 112 | 32,682 | 5,665 | 4,649 | 5,457 |
| 2008 | 25,925 | 7,425 | 531 | 120 | 34,001 | 5,789 | 4,687 | 5,692 |
| 2009 | 27,149 | 7,708 | 523 | 121 | 35,501 | 5,898 | 4,831 | 5,814 |
| 2010 | 27,984 | 7,807 | 550 | 126 | 36,467 | 5,913 | 4,837 | 5,999 |
| 2011 | 29,528 | 8,434 | 539 | 134 | 38,635 | 6,053 | 5,074 | 5,964 |
| 2012 | 31,423 | 9,029 | 570 | 131 | 41,153 | 6,190 | 5,309 | 6,365 |
| 2013 | 32,893 | 9,349 | 532 | 130 | 42,904 | 6,251 | 5,379 | 6,319 |
| 2014 | 34,506 | 9,538 | 530 | 149 | 44,723 | 6,347 | 5,475 | 6,640 |
| 2015 | 36,167 | 10,240 | 512 | 159 | 47,078 | 6,462 | 5,695 | 6,692 |
| 2016 | 37,780 | 10,657 | 534 | 173 | 49,144 | 6,558 | 5,728 | 7,279 |
| 2017 | 39,693 | 11,528 | 536 | 209 | 51,966 | 6,678 | 5,983 | 7,408 |
| 2018 | 41,784 | 12,174 | 560 | 226 | 54,744 | 6,790 | 6,132 | 7,659 |
|
||||||||
| Year | Expenditures ($ million) | Average Annual Benefit ($)Table 8 - Footnote 2 | ||||||
|---|---|---|---|---|---|---|---|---|
| OAS | GIS | Allowance | Administrative Expenses |
Total | OAS | GIS | Allowance | |
| 2019 | 43,945 | 12,902 | 547 | 230 | 57,624 | 6,907 | 6,287 | 7,706 |
| 2020 | 46,270 | 13,695 | 628 | 242 | 60,835 | 6,994 | 6,187 | 6,526 |
| 2021 | 48,842 | 14,671 | 712 | 257 | 64,482 | 7,106 | 6,361 | 7,376 |
| 2022 | 51,704 | 15,577 | 731 | 272 | 68,284 | 7,244 | 6,474 | 7,532 |
| 2023 | 54,699 | 16,507 | 752 | 288 | 72,246 | 7,386 | 6,585 | 7,680 |
| 2024 | 57,794 | 17,450 | 774 | 304 | 76,322 | 7,532 | 6,692 | 7,818 |
| 2025 | 61,030 | 18,397 | 797 | 321 | 80,545 | 7,681 | 6,804 | 7,941 |
| 2026 | 64,387 | 19,384 | 818 | 338 | 84,927 | 7,835 | 6,915 | 8,064 |
| 2027 | 67,784 | 20,396 | 836 | 356 | 89,372 | 7,991 | 7,028 | 8,191 |
| 2028 | 71,325 | 21,451 | 853 | 375 | 94,004 | 8,152 | 7,142 | 8,313 |
| 2029 | 74,902 | 22,525 | 866 | 393 | 98,686 | 8,316 | 7,255 | 8,440 |
| 2030 | 78,418 | 23,501 | 874 | 411 | 103,204 | 8,484 | 7,392 | 8,557 |
| 2031 | 81,737 | 24,389 | 877 | 428 | 107,431 | 8,654 | 7,532 | 8,706 |
| 2032 | 84,879 | 25,231 | 877 | 444 | 111,431 | 8,828 | 7,669 | 8,841 |
| 2033 | 87,988 | 26,055 | 875 | 460 | 115,378 | 9,005 | 7,809 | 8,979 |
| 2034 | 91,123 | 26,873 | 874 | 475 | 119,345 | 9,187 | 7,952 | 9,117 |
| 2035 | 94,304 | 27,694 | 874 | 491 | 123,363 | 9,372 | 8,099 | 9,255 |
| 2036 | 97,497 | 28,507 | 875 | 508 | 127,387 | 9,562 | 8,250 | 9,394 |
| 2037 | 100,558 | 29,284 | 877 | 523 | 131,242 | 9,754 | 8,405 | 9,542 |
| 2038 | 103,547 | 30,035 | 880 | 538 | 135,000 | 9,950 | 8,564 | 9,694 |
| 2039 | 106,538 | 30,768 | 883 | 553 | 138,742 | 10,149 | 8,727 | 9,848 |
| 2040 | 109,609 | 31,493 | 890 | 568 | 142,560 | 10,353 | 8,894 | 10,002 |
| 2041 | 112,706 | 32,158 | 897 | 583 | 146,344 | 10,561 | 9,084 | 10,292 |
| 2042 | 115,827 | 32,812 | 907 | 598 | 150,144 | 10,774 | 9,260 | 10,453 |
| 2043 | 118,991 | 33,455 | 919 | 613 | 153,978 | 10,991 | 9,439 | 10,618 |
| 2044 | 122,280 | 34,097 | 933 | 629 | 157,939 | 11,214 | 9,623 | 10,782 |
| 2045 | 125,733 | 34,749 | 950 | 646 | 162,078 | 11,441 | 9,812 | 10,944 |
| 2046 | 129,313 | 35,403 | 969 | 663 | 166,348 | 11,674 | 10,004 | 11,108 |
| 2047 | 132,994 | 36,052 | 990 | 680 | 170,716 | 11,911 | 10,199 | 11,274 |
| 2048 | 136,799 | 36,704 | 1,011 | 698 | 175,212 | 12,152 | 10,399 | 11,440 |
| 2049 | 140,746 | 37,367 | 1,035 | 717 | 179,865 | 12,399 | 10,603 | 11,607 |
| 2050 | 144,830 | 38,042 | 1,059 | 736 | 184,667 | 12,650 | 10,810 | 11,779 |
| 2055 | 167,474 | 41,435 | 1,190 | 840 | 210,939 | 13,979 | 12,041 | 12,940 |
| 2060 | 195,531 | 45,604 | 1,329 | 970 | 243,434 | 15,438 | 13,340 | 13,889 |
|
||||||||
4.4. Cost Ratios
Since the program is financed from general revenues on a pay-as-you-go basis, it is useful to express its annual expenditures in relative terms rather than in absolute dollar terms. For this reason, the expenditures are presented as cost ratios using two different measurement bases. The two bases used are total employment earnings and GDP. The details regarding how these measurement bases are projected and adjusted for COVID-19 are provided in section 4 of Appendix D of this report.
Prior to any adjustments for COVID-19, the total employment earnings basis is derived from CPP total employment earnings as projected under the 30th CPP Actuarial Report as at 31 December 2018, adjusted to account for Québec's total employment earnings. The adjustment to account for Québec is determined by using the historical relationship between total employment earnings as published by Statistics Canada and total employment earnings applicable to Canada less Québec for the purpose of the CPP. Adjustments to the job creation rates and unemployment rates were then made over the period 2020 to 2024 to account for the COVID-19 pandemic. Table 11 and Table 12 present the historical and projected annual expenditures as a percentage of total employment earnings.
Prior to any adjustments for COVID-19, the GDP basis is derived from projected total employment earnings using the historical relationship between the two. Table 9 and Table 10 present the historical and projected annual expenditures as a percentage of GDP. Similar adjustments, as done for the total employment earnings basis, were made over the period 2020 to 2024 to account for the COVID-19 pandemic.
The ratio of program expenditures to the GDP is projected to be 2.77% in 2020 compared to 2.50% in 2019. This substantial year-over-year increase is mainly due to the estimated negative impact of COVID-19 on the GDP. The retirement of the baby boomers over the next few decades is projected to increase the expenditures of the program and the ratio is projected to reach a high of 3.1% between 2030 and 2037. Thereafter, although the impacts of TFSAs reduce the amount of income for benefit calculation purposes and tend to increase this ratio over the long term, the growth in additional CPP and QPP benefits and the fact that OAS benefits are indexed to inflation as opposed to wages drive down the cost of the OAS program relative to the GDP over the long term. As a result, annual expenditures are expected to gradually fall to 2.63% of GDP by 2060 which is comparable to the historical levels of the early 1990s.
The projected expenditures shown in Table 10 and Table 12 reflect the eligible ages for program benefits, that is, age 65 and over for the OAS basic pension and GIS, and ages 60 to 64 for the Allowance benefit. The OAS basic pension expenditures also account for voluntary deferrals, which became effective 1 July 2013.
| Year | Gross Domestic Product ($ billion) |
Expenditures as % of Gross Domestic Product Table 9 - Footnote 1 | ||||||
|---|---|---|---|---|---|---|---|---|
| OAS | GIS | Allowance | Administrative Expenses |
Total | ||||
| 1966 | 67 | 1.51 | - | - | 0.01 | 1.52 | ||
| 1970 | 93 | 1.73 | 0.29 | - | 0.01 | 2.03 | ||
| 1975 | 178 | 1.62 | 0.50 | 0.01 | 0.01 | 2.14 | ||
| 1980 | 323 | 1.59 | 0.55 | 0.05 | 0.01 | 2.21 | ||
| 1985 | 500 | 1.74 | 0.66 | 0.06 | 0.01 | 2.47 | ||
| 1986 | 527 | 1.77 | 0.65 | 0.09 | 0.01 | 2.52 | ||
| 1987 | 574 | 1.75 | 0.62 | 0.08 | 0.01 | 2.47 | ||
| 1988 | 627 | 1.72 | 0.59 | 0.08 | 0.01 | 2.40 | ||
| 1989 | 672 | 1.72 | 0.57 | 0.07 | 0.01 | 2.38 | ||
| 1990 | 696 | 1.79 | 0.57 | 0.06 | 0.01 | 2.44 | ||
| 1991 | 702 | 1.93 | 0.58 | 0.06 | 0.01 | 2.59 | ||
| 1992 | 718 | 1.99 | 0.59 | 0.06 | 0.01 | 2.65 | ||
| 1993 | 747 | 1.99 | 0.59 | 0.06 | 0.01 | 2.65 | ||
| 1994 | 792 | 1.94 | 0.58 | 0.05 | 0.01 | 2.59 | ||
| 1995 | 832 | 1.90 | 0.55 | 0.05 | 0.01 | 2.52 | ||
| 1996 | 860 | 1.91 | 0.54 | 0.05 | 0.01 | 2.51 | ||
| 1997 | 907 | 1.87 | 0.52 | 0.04 | 0.01 | 2.44 | ||
| 1998 | 941 | 1.86 | 0.51 | 0.04 | 0.01 | 2.42 | ||
| 1999 | 1,008 | 1.78 | 0.49 | 0.04 | 0.01 | 2.31 | ||
| 2000 | 1,106 | 1.69 | 0.45 | 0.04 | 0.01 | 2.18 | ||
| 2001 | 1,145 | 1.70 | 0.45 | 0.03 | 0.01 | 2.20 | ||
| 2002 | 1,194 | 1.70 | 0.45 | 0.03 | 0.01 | 2.20 | ||
| 2003 | 1,255 | 1.69 | 0.46 | 0.03 | 0.01 | 2.19 | ||
| 2004 | 1,336 | 1.64 | 0.45 | 0.03 | 0.01 | 2.13 | ||
| 2005 | 1,422 | 1.60 | 0.45 | 0.03 | 0.01 | 2.08 | ||
| 2006 | 1,497 | 1.59 | 0.45 | 0.03 | 0.01 | 2.08 | ||
| 2007 | 1,578 | 1.57 | 0.47 | 0.03 | 0.01 | 2.07 | ||
| 2008 | 1,657 | 1.56 | 0.45 | 0.03 | 0.01 | 2.05 | ||
| 2009 | 1,571 | 1.73 | 0.49 | 0.03 | 0.01 | 2.26 | ||
| 2010 | 1,666 | 1.68 | 0.47 | 0.03 | 0.01 | 2.19 | ||
| 2011 | 1,774 | 1.66 | 0.48 | 0.03 | 0.01 | 2.18 | ||
| 2012 | 1,827 | 1.72 | 0.49 | 0.03 | 0.01 | 2.25 | ||
| 2013 | 1,902 | 1.73 | 0.49 | 0.03 | 0.01 | 2.26 | ||
| 2014 | 1,995 | 1.73 | 0.48 | 0.03 | 0.01 | 2.24 | ||
| 2015 | 1,990 | 1.82 | 0.51 | 0.03 | 0.01 | 2.37 | ||
| 2016 | 2,026 | 1.87 | 0.53 | 0.03 | 0.01 | 2.43 | ||
| 2017 | 2,141 | 1.85 | 0.54 | 0.03 | 0.01 | 2.43 | ||
| 2018 | 2,224 | 1.88 | 0.55 | 0.03 | 0.01 | 2.46 | ||
|
||||||||
| Year | Gross Domestic Product ($ billion) |
Expenditures as % of Gross Domestic ProductTable 10 - Footnote 1 | ||||||
|---|---|---|---|---|---|---|---|---|
| OAS | GIS | Allowance | Administrative Expenses |
Total | ||||
| 2019 | 2,304 | 1.91 | 0.56 | 0.02 | 0.01 | 2.50 | ||
| 2020 | 2,193 | 2.11 | 0.62 | 0.03 | 0.01 | 2.77 | ||
| 2021 | 2,357 | 2.07 | 0.62 | 0.03 | 0.01 | 2.74 | ||
| 2022 | 2,486 | 2.08 | 0.63 | 0.03 | 0.01 | 2.75 | ||
| 2023 | 2,587 | 2.11 | 0.64 | 0.03 | 0.01 | 2.79 | ||
| 2024 | 2,700 | 2.14 | 0.65 | 0.03 | 0.01 | 2.83 | ||
| 2025 | 2,794 | 2.18 | 0.66 | 0.03 | 0.01 | 2.88 | ||
| 2026 | 2,890 | 2.23 | 0.67 | 0.03 | 0.01 | 2.94 | ||
| 2027 | 2,990 | 2.27 | 0.68 | 0.03 | 0.01 | 2.99 | ||
| 2028 | 3,094 | 2.31 | 0.69 | 0.03 | 0.01 | 3.04 | ||
| 2029 | 3,201 | 2.34 | 0.70 | 0.03 | 0.01 | 3.08 | ||
| 2030 | 3,312 | 2.37 | 0.71 | 0.03 | 0.01 | 3.12 | ||
| 2031 | 3,429 | 2.38 | 0.71 | 0.03 | 0.01 | 3.13 | ||
| 2032 | 3,552 | 2.39 | 0.71 | 0.02 | 0.01 | 3.14 | ||
| 2033 | 3,679 | 2.39 | 0.71 | 0.02 | 0.01 | 3.14 | ||
| 2034 | 3,812 | 2.39 | 0.71 | 0.02 | 0.01 | 3.13 | ||
| 2035 | 3,950 | 2.39 | 0.70 | 0.02 | 0.01 | 3.12 | ||
| 2036 | 4,087 | 2.39 | 0.70 | 0.02 | 0.01 | 3.12 | ||
| 2037 | 4,231 | 2.38 | 0.69 | 0.02 | 0.01 | 3.10 | ||
| 2038 | 4,382 | 2.36 | 0.69 | 0.02 | 0.01 | 3.08 | ||
| 2039 | 4,539 | 2.35 | 0.68 | 0.02 | 0.01 | 3.06 | ||
| 2040 | 4,700 | 2.33 | 0.67 | 0.02 | 0.01 | 3.03 | ||
| 2041 | 4,869 | 2.32 | 0.66 | 0.02 | 0.01 | 3.01 | ||
| 2042 | 5,044 | 2.30 | 0.65 | 0.02 | 0.01 | 2.98 | ||
| 2043 | 5,227 | 2.28 | 0.64 | 0.02 | 0.01 | 2.95 | ||
| 2044 | 5,416 | 2.26 | 0.63 | 0.02 | 0.01 | 2.92 | ||
| 2045 | 5,610 | 2.24 | 0.62 | 0.02 | 0.01 | 2.89 | ||
| 2046 | 5,809 | 2.23 | 0.61 | 0.02 | 0.01 | 2.86 | ||
| 2047 | 6,016 | 2.21 | 0.60 | 0.02 | 0.01 | 2.84 | ||
| 2048 | 6,228 | 2.20 | 0.59 | 0.02 | 0.01 | 2.81 | ||
| 2049 | 6,445 | 2.18 | 0.58 | 0.02 | 0.01 | 2.79 | ||
| 2050 | 6,667 | 2.17 | 0.57 | 0.02 | 0.01 | 2.77 | ||
| 2055 | 7,870 | 2.13 | 0.53 | 0.02 | 0.01 | 2.68 | ||
| 2060 | 9,255 | 2.11 | 0.49 | 0.01 | 0.01 | 2.63 | ||
|
||||||||
| Year | Total Employment Earnings ($ billion) |
Expenditures as % of Total Employment EarningsTable 11 - Footnote 1 | ||||||
|---|---|---|---|---|---|---|---|---|
| OAS | GIS | Allowance | Administrative Expenses |
Total | ||||
| 1966 | 31 | 3.21 | - | - | 0.02 | 3.22 | ||
| 1970 | 46 | 3.53 | 0.60 | - | 0.02 | 4.15 | ||
| 1975 | 89 | 3.24 | 1.01 | 0.01 | 0.01 | 4.27 | ||
| 1980 | 156 | 3.29 | 1.13 | 0.11 | 0.02 | 4.55 | ||
| 1985 | 232 | 3.75 | 1.41 | 0.13 | 0.03 | 5.32 | ||
| 1986 | 247 | 3.78 | 1.38 | 0.19 | 0.02 | 5.37 | ||
| 1987 | 269 | 3.75 | 1.33 | 0.18 | 0.02 | 5.28 | ||
| 1988 | 295 | 3.65 | 1.26 | 0.16 | 0.02 | 5.10 | ||
| 1989 | 319 | 3.63 | 1.21 | 0.15 | 0.02 | 5.01 | ||
| 1990 | 333 | 3.74 | 1.19 | 0.14 | 0.02 | 5.09 | ||
| 1991 | 339 | 4.00 | 1.21 | 0.13 | 0.02 | 5.36 | ||
| 1992 | 343 | 4.17 | 1.23 | 0.13 | 0.02 | 5.55 | ||
| 1993 | 347 | 4.28 | 1.27 | 0.12 | 0.03 | 5.70 | ||
| 1994 | 356 | 4.33 | 1.29 | 0.12 | 0.03 | 5.76 | ||
| 1995 | 366 | 4.32 | 1.26 | 0.11 | 0.03 | 5.72 | ||
| 1996 | 376 | 4.37 | 1.23 | 0.11 | 0.03 | 5.74 | ||
| 1997 | 398 | 4.26 | 1.18 | 0.10 | 0.03 | 5.57 | ||
| 1998 | 421 | 4.15 | 1.14 | 0.09 | 0.03 | 5.41 | ||
| 1999 | 445 | 4.02 | 1.10 | 0.09 | 0.02 | 5.23 | ||
| 2000 | 486 | 3.84 | 1.03 | 0.08 | 0.02 | 4.98 | ||
| 2001 | 504 | 3.87 | 1.02 | 0.08 | 0.02 | 4.99 | ||
| 2002 | 521 | 3.90 | 1.04 | 0.08 | 0.02 | 5.04 | ||
| 2003 | 541 | 3.92 | 1.06 | 0.08 | 0.02 | 5.07 | ||
| 2004 | 571 | 3.84 | 1.04 | 0.08 | 0.02 | 4.98 | ||
| 2005 | 605 | 3.75 | 1.05 | 0.08 | 0.02 | 4.90 | ||
| 2006 | 645 | 3.68 | 1.05 | 0.08 | 0.02 | 4.83 | ||
| 2007 | 685 | 3.61 | 1.07 | 0.07 | 0.02 | 4.77 | ||
| 2008 | 716 | 3.62 | 1.04 | 0.07 | 0.02 | 4.75 | ||
| 2009 | 705 | 3.85 | 1.09 | 0.07 | 0.02 | 5.03 | ||
| 2010 | 728 | 3.85 | 1.07 | 0.08 | 0.02 | 5.01 | ||
| 2011 | 767 | 3.85 | 1.10 | 0.07 | 0.02 | 5.04 | ||
| 2012 | 800 | 3.93 | 1.13 | 0.07 | 0.02 | 5.15 | ||
| 2013 | 829 | 3.97 | 1.13 | 0.06 | 0.02 | 5.18 | ||
| 2014 | 861 | 4.01 | 1.11 | 0.06 | 0.02 | 5.19 | ||
| 2015 | 884 | 4.09 | 1.16 | 0.06 | 0.02 | 5.32 | ||
| 2016 | 880 | 4.29 | 1.21 | 0.06 | 0.02 | 5.58 | ||
| 2017 | 922 | 4.30 | 1.25 | 0.06 | 0.02 | 5.64 | ||
| 2018 | 966 | 4.33 | 1.26 | 0.06 | 0.02 | 5.67 | ||
|
||||||||
| Year | Total Employment Earnings ($ billion) |
Expenditures as % of Total Employment Earnings Table 12 - Footnote 1 | ||||||
|---|---|---|---|---|---|---|---|---|
| OAS | GIS | Allowance | Administrative Expenses |
Total | ||||
| 2019 | 1,000 | 4.39 | 1.29 | 0.05 | 0.02 | 5.76 | ||
| 2020 | 976 | 4.74 | 1.40 | 0.06 | 0.02 | 6.24 | ||
| 2021 | 1,037 | 4.71 | 1.41 | 0.07 | 0.02 | 6.22 | ||
| 2022 | 1,085 | 4.77 | 1.44 | 0.07 | 0.03 | 6.29 | ||
| 2023 | 1,128 | 4.85 | 1.46 | 0.07 | 0.03 | 6.41 | ||
| 2024 | 1,173 | 4.93 | 1.49 | 0.07 | 0.03 | 6.51 | ||
| 2025 | 1,213 | 5.03 | 1.52 | 0.07 | 0.03 | 6.64 | ||
| 2026 | 1,255 | 5.13 | 1.54 | 0.07 | 0.03 | 6.77 | ||
| 2027 | 1,298 | 5.22 | 1.57 | 0.06 | 0.03 | 6.88 | ||
| 2028 | 1,343 | 5.31 | 1.60 | 0.06 | 0.03 | 7.00 | ||
| 2029 | 1,390 | 5.39 | 1.62 | 0.06 | 0.03 | 7.10 | ||
| 2030 | 1,438 | 5.45 | 1.63 | 0.06 | 0.03 | 7.17 | ||
| 2031 | 1,489 | 5.49 | 1.64 | 0.06 | 0.03 | 7.21 | ||
| 2032 | 1,542 | 5.50 | 1.64 | 0.06 | 0.03 | 7.22 | ||
| 2033 | 1,598 | 5.51 | 1.63 | 0.05 | 0.03 | 7.22 | ||
| 2034 | 1,655 | 5.51 | 1.62 | 0.05 | 0.03 | 7.21 | ||
| 2035 | 1,715 | 5.50 | 1.61 | 0.05 | 0.03 | 7.19 | ||
| 2036 | 1,775 | 5.49 | 1.61 | 0.05 | 0.03 | 7.18 | ||
| 2037 | 1,837 | 5.47 | 1.59 | 0.05 | 0.03 | 7.14 | ||
| 2038 | 1,903 | 5.44 | 1.58 | 0.05 | 0.03 | 7.09 | ||
| 2039 | 1,971 | 5.41 | 1.56 | 0.04 | 0.03 | 7.04 | ||
| 2040 | 2,041 | 5.37 | 1.54 | 0.04 | 0.03 | 6.98 | ||
| 2041 | 2,114 | 5.33 | 1.52 | 0.04 | 0.03 | 6.92 | ||
| 2042 | 2,191 | 5.29 | 1.50 | 0.04 | 0.03 | 6.85 | ||
| 2043 | 2,270 | 5.24 | 1.47 | 0.04 | 0.03 | 6.78 | ||
| 2044 | 2,352 | 5.20 | 1.45 | 0.04 | 0.03 | 6.72 | ||
| 2045 | 2,436 | 5.16 | 1.43 | 0.04 | 0.03 | 6.65 | ||
| 2046 | 2,523 | 5.13 | 1.40 | 0.04 | 0.03 | 6.59 | ||
| 2047 | 2,612 | 5.09 | 1.38 | 0.04 | 0.03 | 6.53 | ||
| 2048 | 2,704 | 5.06 | 1.36 | 0.04 | 0.03 | 6.48 | ||
| 2049 | 2,799 | 5.03 | 1.34 | 0.04 | 0.03 | 6.43 | ||
| 2050 | 2,895 | 5.00 | 1.31 | 0.04 | 0.03 | 6.38 | ||
| 2055 | 3,418 | 4.90 | 1.21 | 0.03 | 0.02 | 6.17 | ||
| 2060 | 4,019 | 4.87 | 1.13 | 0.03 | 0.02 | 6.06 | ||
|
||||||||
5. Reconciliation with Previous Triennial Report
5.1. Introduction
The results presented in this report differ from those presented in the previous triennial report, the 14th Actuarial Report on the OAS program, for a variety of reasons. Differences between the actual experience from 2016 through 2018 and that projected in the 14th Actuarial Report on the OAS program are addressed in subsection 5.2 below. Since historical results provide the starting point for the projections shown in this report, these historical differences between actual and projected experience have an effect on the projections. Detailed reconciliations of the projected expenditures are presented in Appendix C.
5.2. Experience Update – 2016 to 2018
The components of change in the program expenditures from 31 December 2015 to 31 December 2018 are summarized in Table 13 .
| Actual | Expected Table 13 - Footnote 2 | Difference Actual less Expected |
% Change Difference/ Expected |
|||||
|---|---|---|---|---|---|---|---|---|
| Expenditures: | ||||||||
| OAS | 119,257 | 119,907 | (650) | (0.5%) | ||||
| GIS | 34,360 | 34,465 | (105) | (0.3%) | ||||
| Allowance | 1,630 | 1,660 | (30) | (1.8%) | ||||
| Administrative Expenses | 608 | 542 | 66 | 12.2% | ||||
| Total Expenditures | 155,855 | 156,574 | (719) | (0.5%) | ||||
| Gross Domestic Product | 6,391,000 | 6,273,000 | 118,000 | 1.9% | ||||
| Expenditures as % of GDP | 2.44 | 2.50 | (0.06) | (2.4%) | ||||
|
||||||||
OAS basic pension expenditures during the period were $650 million (or 0.5%) lower than projected. For the most part, this is because there were about 0.4% fewer beneficiaries than expected. GIS and Allowance expenditures were $135 million (or 0.4%) lower than projected mainly due to lower average benefits (about 0.4% lower) than projected. Administrative expenses were $66 million or 12.2% higher than expected over the period.
Total GDP over the period was 1.9% higher than projected. As a result, overall expenditures relative to the GDP were about 2.4% lower than projected, being 2.44% of GDP instead of 2.50%.
5.3. Changes in Expenditures as a Percentage of the GDP
Table 14 presents the main elements of all changes in the expenditures expressed as a percentage of the GDP since the 14th Actuarial Report on the OAS program, including the changes that have arisen over the period 2016 to 2018 from amendments to the program, which were reflected in the 15th Actuarial Report on the OAS program.
The amendments which increase, starting 1 July 2020, the GIS and Allowance income exemption increase the projected expenditures by 0.01% of GDP by 2030. Update in economic assumptions (especially lower real wage growth) also lead to increase the cost ratio. These increases are offset by the update in experience and changes to demographic and benefit assumptions. The net result is lower expenditures relative to the GDP over the projection period as compared to the previous 14th Actuarial Report on the OAS program.
| 2019 | 2030 | 2060 | ||||||
|---|---|---|---|---|---|---|---|---|
| 14th Actuarial Report on the OAS Program | 2.63 | 3.21 | 2.65 | |||||
| Legislated Amendments: 15th OAS Program Actuarial Report |
||||||||
| · increase, 1 July 2020, the income exemption for GIS and Allowance Benefits | 0.00 | 0.01 | 0.00 | |||||
| Total Amendments | 0.00 | 0.01 | 0.00 | |||||
| Improvements in Methodology | 0.00 | (0.01) | 0.00 | |||||
| Experience Update (2016 to 2018) | (0.16) | (0.10) | (0.20) | |||||
| Changes in Demographic Assumptions | (0.01) | (0.03) | 0.00 | |||||
| Changes in Economic Assumptions | 0.01 | 0.08 | 0.22 | |||||
| Changes in Benefit Assumptions | 0.03 | (0.03) | (0.02) | |||||
| Changes in additional CPP and QPP assumptionsTable 1 - Footnote 1 | 0.00 | (0.01) | (0.02) | |||||
| 16th Actuarial Report on the OAS Program | 2.50 | 3.12 | 2.63 | |||||
|
||||||||
6. Conclusion
The ratio of program expenditures to the GDP is projected to be 2.77% in 2020 compared to 2.50% in 2019. This substantial year-over-year increase is mainly due to the estimated negative impact of COVID-19 on the GDP. The retirement of the baby boomers reaching age 65 over the next few decades is projected to increase the expenditures of the program and the ratio is projected to reach a high of 3.1% between 2030 and 2037. Thereafter, although the impacts of TFSAs reduce the amount of income for benefit calculation purposes and tend to increase this ratio over the long term, the growth in additional CPP and QPP benefits and the fact that benefits are indexed to inflation as opposed to wages drive down the cost of the OAS program relative to the GDP over the long term. As a result, annual expenditures are expected to gradually fall to 2.63% of GDP by 2060 which is comparable to the historical levels of the early 1990s.
In comparison with the previous triennial (14th) Actuarial Report on the OAS program, the amendments which increase, starting 1 July 2020, the GIS and Allowance income exemption increase the projected expenditures by 0.01% of GDP by 2030. Update in economic assumptions (especially lower real wage growth) also lead to increase the cost ratio. These increases are offset by the update in experience and changes to demographic and benefit assumptions. The net result is lower expenditures relative to the GDP over the projection period as compared to the previous 14th Actuarial Report on the OAS program.
To measure the sensitivity of the long-term projections of the program to changes in the future demographic and economic outlook, a number of sensitivity tests were performed. These tests focused on varying the key best-estimate assumptions individually in order to measure the potential impact on the cost ratio of program expenditures to GDP. These tests show that the cost ratio could deviate significantly from its projected best‑estimate values if other than best-estimate assumptions were to be realized.
For example, if life expectancies at age 65 were to increase by about two more years than the best estimates of this report, then the ratio in 2060 would increase from 2.63% to 2.80%. As another example, if benefit rates were increased to partially reflect the growth in real wages, then the ratio in 2060 would increase from 2.63% to 3.42%.
Scenario tests were also performed regarding the future economic growth and aging of the population, and how they may differ from the best-estimate projection. Two alternative economic scenarios were developed that portray higher and lower economic growth, and two demographically based scenarios were developed that portray generally younger and older populations. The economic scenarios produced cost ratios of program expenditures to GPD in 2060 of 1.85% (higher economic growth) and 3.78% (lower economic growth), while the demographic scenarios produced cost ratios of program expenditures to the GDP in 2060 of 2.40% (younger population) and 2.80% (older population).
The actuarial review of the OAS program presented in this report is based on the assumed demographic and economic outlook over the long term. Therefore, it remains important to review the program's long-term projected costs on a regular basis by producing periodic actuarial reports. For this purpose, as required by the Public Pensions Reporting Act, the next such review will be as at 31 December 2021.
7. Actuarial Opinion
In our opinion, considering that this 16th Actuarial Report on the Old Age Security program was prepared pursuant to the Public Pensions Reporting Act:
- the data on which this report is based are sufficient and reliable for the purposes of this report;
- the assumptions used are, individually and in aggregate, reasonable and appropriate for the purposes of this report; and
- the methods employed are appropriate for the purposes of this report.
This report has been prepared, and our opinions given, in accordance with accepted actuarial practice in Canada, in particular, the General Standards and the Practice-Specific Standards for Social Security Programs of the Standards of Practice of the Canadian Institute of Actuaries.
As of the date of the signing of this report, we have not learned of any events, other than the events already accounted for in this report, that would have a material impact on the actuarial review of the OAS program as at 31 December 2018.
Assia Billig, FCIA, FSA, PhD
Chief Actuary
Michel Montambeault, FCIA, FSA
Senior Actuary
Ottawa, Canada
26 June 2020
Appendix A ― Uncertainty of Results
A.1 Introduction
This actuarial report on the Old Age Security program is based on the projection of its expenditures over a long period of time. The information required by statute, which is presented in the Results section 4 of this report, has been derived using best-estimate assumptions regarding future demographic and economic trends. The key best-estimate assumptions, i.e. those for which changes within a reasonable range have the most significant impact on the long-term financial results, are described in Appendix D. Both the length of the projection period and the number of assumptions required ensure that actual future experience will not develop precisely in accordance with the best-estimate assumptions. The objective of this Appendix of the report is to illustrate the sensitivity of the long-term projections of the OAS program to changes in the future demographic and economic outlooks.
The future expenditures of the OAS program depend on many demographic and economic factors, including fertility, mortality, migration, the labour force, average earnings, inflation, recipient rates, and indexation of benefits. The expenditures will depend on how these factors affect the size and composition of the beneficiary population and the general level of benefits.
Expenditures are measured relative to two cost measurement bases: total employment earnings and GDP. These bases will depend on how the aforementioned factors affect the size and composition of the working-age population, and the level and distribution of earnings.
A.2 Individual Sensitivity Tests
The key best-estimate assumptions used for the projections in this report are described in Table 1 . Individual sensitivity tests have been performed that consist of using alternative assumptions to illustrate a reasonable range of how experience could vary from the best-estimate projections. All tests except for migration use purely deterministic models based on judgment. The migration assumption sensitivity tests was developed using a combination of judgment and stochastic modeling techniques. All of the tests are described in the subsections below.
The sensitivity tests were performed by varying most of the key assumptions individually in a manner consistent with the results of the stochastic analysis or by judgment and by keeping the remaining assumptions at their best-estimate levels. Each sensitivity test was categorized as either a lower-cost scenario or a higher-cost scenario. In the lower-cost scenarios, the alternative assumptions have the effect of reducing the cost ratios expressed as a percentage of GDP. Conversely, the assumptions for the higher-cost scenarios increase the cost ratios expressed as a percentage of GDP. The alternative assumptions selected are intended to represent a wide range of potential long-term experience. However, the individual results cannot simply be combined, because a change in any one particular assumption may have an impact on other assumptions to various degrees.
Table 15 summarizes the alternative assumptions used in the individual sensitivity tests. It is followed by a brief discussion of each assumption and the impact that the variation in each assumption has on the results.
| Canada | Lower-Cost | Best-Estimate | Higher-Cost | |||||
|---|---|---|---|---|---|---|---|---|
| 1 | Total fertility rate | 1.92 | 1.62 | 1.32 | ||||
| 2 | Mortality: Canadian life expectancy at age 65 in 2050 with future improvements |
Males 21.0 | Males 23.3 | Males 25.8 | ||||
| Females 23.4 | Females 25.6 | Females 28.0 | ||||||
| 3 | Net migration rateTable 15 - Footnote 1 | 0.68% | 0.62% | 0.57% | ||||
| 4 | GIS and Allowance Recipient rates | 2050 | 2050 | 2050 | ||||
| GIS: 24.7% | GIS: 30.0% | GIS: 35.3% | ||||||
| Allowance: 2.5% | Allowance: 3.1% | Allowance: 3.7% | ||||||
| 5 | Benefit indexation | CPI less 1% | CPI | CPI plus 60% of the real wage increase |
||||
|
||||||||
A.2.1 Fertility Rate
The best-estimate assumption for the total fertility rate for Canada is that it will increase slightly from its 2017 level of 1.55 to an ultimate level of 1.62 in 2027. A deterministic approach based on the experience of countries somewhat similar to Canada was used to generate the lower- and higher-cost scenarios over the projection period.
It was projected that the average total fertility rate over projection period will be in the range 1.32 to 1.92, which corresponds to the lowest and highest fertility rates experienced in recent years by the Group of 7 (G7) countries (Canada, France, Germany, Italy, Japan, the United Kingdom, and the United States).
The lower-cost assumption has the total fertility rate increasing to an ultimate level of 1.92 in 2027, which is lower than the national population replacement rate. This is similar to the recent total fertility rate of France. The total fertility rate for Canada has not been above 1.92 since 1972. Under this scenario, the population grows to a level in 2050 that is 5.5% higher than under the best-estimate assumption. In addition, a higher ultimate total fertility rate leads to a slightly younger population. Under this scenario the expenditures as a percentage of GDP in 2060 decreases to 2.46%.
The higher-cost assumption has the total fertility rate decreasing to an ultimate level of 1.32 in 2027. This is similar to the recent total fertility rate of Italy. Under this scenario, the population grows much more slowly, to a level in 2050 that is 5.4% lower than under the best estimate assumption. A lower ultimate total fertility rate leads to a slightly older population. Under this scenario, the expenditures as a percentage of GDP in 2060 increases to 2.82%.
A.2.2 Mortality
The calendar year life expectancies (without assumed future mortality improvements) at age 65 in 2019 are 20.0 years for males and 22.6 years for females. The best-estimate scenario provides for future mortality improvements (i.e. reductions in mortality rates), such that the cohort life expectancy at age 65 in 2019 is projected to be 21.4 years for males and 23.9 years for females (which are 1.4 years and 1.3 years higher, respectively, than the calendar year life expectancies). In 2050, the best-estimate cohort life expectancy at age 65 is projected to be 23.3 years for males and 25.6 years for females.
The best-estimate ultimate values of the mortality improvement rates are reached in 2035 and are 0.8% per year for ages below 90, 0.5% for ages 90 to 94, and 0.2% for ages 95 and above. The following two sensitivity tests represent alternatives for the assumed mortality improvement rates.
Under the lower-cost scenario, mortality is assumed to improve at a slower rate than under the best-estimate scenario, reflecting that the assumed level of mortality improvements might not be sustainable. The ultimate values of the mortality improvement rates are gradually reduced to 0% for all ages in 2035. As a result, life expectancies decrease. In 2050, the cohort life expectancy at age 65 decreases to 21.0 years for males and 23.4 years for females, or 2.3 and 2.2 years lower for males and females, respectively, compared to the best-estimate scenario. Lower life expectancies lead to the population growing to a level in 2050 that is 1.4% lower than under the best-estimate scenario. Lower mortality improvements lead to a slightly younger population. Under the lower-cost scenario the expenditures as a percentage of GDP in 2060 decrease to 2.46%.
Under the higher-cost scenario, mortality is assumed to improve at a faster pace than under the best-estimate scenario. The ultimate values of the mortality improvement rates are doubled compared to their best-estimate values and correspond to 1.6%, 1.0%, and 0.4% for the age groups below 90, 90 to 94, and 95 and above, respectively. As a result, life expectancies increase relative to the best-estimate scenario. In 2050, the cohort life expectancy at age 65 increases to 25.8 years for males and 28.0 years for females, or 2.5 and 2.4 years higher for males and females, respectively compared to the best-estimate scenario. Higher life expectancies lead to the population growing to a level in 2050 that is 1.4% higher than under the best-estimate scenario. Higher mortality improvements lead to a slightly older population. Under the higher-cost scenario the expenditures as a percentage of GDP in 2060 increase to 2.80%. Table 16 presents the life expectancies that would result in 2050 from the different rates of improvement.
| Lower-Cost | Best-Estimate | Higher-Cost | ||
|---|---|---|---|---|
| At Birth | Males | 82.2 | 89.1 | 95.4 |
| Females | 85.6 | 91.8 | 97.4 | |
| At Age 65 | Males | 21.0 | 23.3 | 25.8 |
| Females | 23.4 | 25.6 | 28.0 | |
|
||||
If no future mortality improvements are assumed at all after 2015, projected life expectancies would remain at their 2015 calendar year values for all future years, which would cause the expenditures as a percentage of GDP to decrease. The expenditures as a percentage of GDP in 2060 would decrease from the best-estimate value of 2.63% to 2.31%. The difference of 0.32% from the best estimate represent the projected cost of increasing longevity for the OAS in 2060.
A.2.3 Net Migration Rate
Under the best-estimate assumption, the net migration rate is expected to decrease from its current (2018) level of 1.11% of the population to 0.86% in 2019, 0.73% in 2020, and reach an ultimate level of 0.62% of the population in 2021.
A stochastic approach was used to generate lower- and higher-cost scenarios over the projection period based on the net migration experience of the last 47 years (1972 to 2018) excluding the net increase in the number of non-permanent residents. It is projected that average net migration throughout the entire projection period will be in the range of 0.57% to 0.68% of the population with 80% probability. If a 15 year projection period were considered, then the average net migration would be in the range of 0.53% to 0.73% of the population.
The lower-cost assumption has net migration reaching a level of 0.68% of the population in 2021 and remaining at that level thereafter. This is close to the average net migration rate over the three-year period ending in 2018, excluding the net increase in non-permanent residents. Under this scenario, the population grows to a level in 2050 that is 2.2% higher than under the best-estimate assumption. This scenario results in a slightly younger population.
The higher-cost assumption has net migration reaching a level of 0.57% of the population in 2021 and remaining at that level thereafter. This is close to the average net migration rate experienced during the 1990s, excluding the net increase in non-permanent residents. Under this scenario, the population grows more slowly, to a level in 2050 that is 1.8% lower than under the best-estimate assumption. This scenario results in a slightly older population.
Under the lower-cost scenario (higher migration) the expenditures as a percentage of GDP in 2060 decreases to 2.57% while under the higher-cost scenario (low migration) the expenditures as a percentage of GDP in 2060 increase to 2.68%.
A.2.4 GIS and Allowance Recipient Rates
The impacts of COVID-19 on recipient rates were not measured under the best-estimate assumptions of this report. However, the amplitude of the higher-cost scenario presented in this section is assumed to cover the possible increases in recipient rates that may occur in the early years of the projection period due to the impacts of COVID-19 on seniors' incomes.
For the lower-cost scenario, the best-estimates recipient rates for the GIS and Allowance are reduced by 20%. The reduction is phased in over five years (2020 to 2024) and is maintained thereafter. It results in total GIS and Allowance benefits that are about 20% lower than in the best‑estimate scenario.
For the higher-cost scenario, the recipient rates for GIS and Allowance benefits are increased by 20%. The increase is phased in over five years (2020 to 2024) and is maintained thereafter. It results in total GIS and Allowance benefits that are about 20% higher than in the best‑estimate scenario. Under this scenario, the increase in recipient rates of 8% for year 2021 is assumed to more than cover for the potential impact of COVID-19 on seniors' income in 2020. In 2021, this scenario results in GIS and Allowance benefits that are $1.2 billion higher (increase of 0.05 percentage points in the expenditures to GDP ratio) than under the best-estimate assumption.
Under the lower-cost scenario the cost in percentage of GDP decreases to 2.53% of GDP in 2060 while under the higher-cost scenario this ratio increases to 2.73%.
A.2.5 Benefit Indexation
The best-estimate projections are based on the program provision for benefit rates to be indexed quarterly in accordance with price increases. Over time, indexing benefit rates more slowly than the rate of growth in average employment earnings means that benefits will replace a decreasing share of individuals' pre-retirement earnings. In the past, this issue has been addressed through occasional legislation providing ad hoc increases in the benefit rates.
For the lower-cost scenario, the benefit indexation is assumed at CPI minus 1%.
For the higher-cost scenario, the benefit rates are increased to partially reflect the growth in real wages. The assumption made for this test is that benefit rates would be indexed at rates equal to the assumed rate of growth in prices plus 60% of the assumed real wage increase. Accordingly, the ultimate annual benefit indexation rate is assumed to be 2.6% instead of 2.0% under the best-estimate assumptions. Over the medium term, about 30 years, the overall impact of this indexation formula on costs is roughly comparable to the indexation basis inherent in the CPP and QPP, which provide benefits based on wage increases prior to retirement and price increases thereafter.
Under the lower-cost scenario, the cost in percentage of GDP decreases to 1.68% of GDP in 2060 while under the higher-cost scenario, this ratio increases to 3.42%.
A.2.6 Results
Table 17 summarizes the projected impact on the expenditures-to-GDP cost ratio under each of the alternative sets of assumptions.
| Assumption | Scenario Best-Estimate |
Expenditures as a Percentage of GDP | |||
|---|---|---|---|---|---|
| 2019 | 2030 | 2060 | |||
| 2.50 | 3.12 | 2.63 | |||
| 1 | Total Fertility Rate | Lower-Cost | 2.50 | 3.11 | 2.46 |
| Higher-Cost | 2.50 | 3.12 | 2.82 | ||
| 2 | Mortality Rates | Lower-Cost | 2.50 | 3.11 | 2.46 |
| Higher-Cost | 2.50 | 3.13 | 2.80 | ||
| 3 | Net Migration Rate | Lower-Cost | 2.50 | 3.10 | 2.57 |
| Higher-Cost | 2.50 | 3.13 | 2.68 | ||
| 4 | GIS and Allowance Recipient Rates | Lower-Cost | 2.50 | 2.97 | 2.53 |
| Higher-Cost | 2.50 | 3.26 | 2.73 | ||
| 5 | Benefit Indexation | Lower-Cost | 2.50 | 2.75 | 1.68 |
| Higher-Cost | 2.50 | 3.32 | 3.42 | ||
A.3 Higher and Lower Economic Growth
Even without the uncertainty related to the COVID-19 pandemic, the current local and global economic environments pose a series of challenges for Canada to sustain consistent economic growth. Persistent low interest rates, slow productivity growth, as well as demographic pressures from an aging population could adversely affect the Canadian economy. While under the best-estimate scenario, moderate and sustainable economic growth is assumed, different scenarios of higher and lower economic growth were considered.
In respect of the labour market, employment levels are reflected in the actuarial projection model through the assumptions made regarding the level of labour force participation and job creation rates by year, age and sex. These rates vary not only with the rate of unemployment, but also reflect trends in increased workforce participation by women, longer periods of formal education among young adults, and trends in the retirement patterns of older workers.
Under the best-estimate scenario, the job creation rate assumption is determined on the basis of expected moderate economic growth. The unemployment rate is expected to increase from 5.9% in 2019 to 10.5% in 2020 as a result of the COVID-19 pandemic. It is then expected to decrease to its pre-pandemic projected level of 6.0% by 2024 before gradually increasing to an ultimate rate of 6.2% by 2030. Furthermore, the participation rates for all age groups are expected to increase due to the attractive employment opportunities resulting from labour shortages and the aging of cohorts with stronger labour attachments, especially for women and individuals with higher education attainment. The assumed increase in participation rates of those aged 55 and over is even more significant, given that it is also affected by the expected continued trend toward delayed retirement. Under the best-estimate scenario, the participation rate of those aged 18 to 69 for Canada is expected to increase from 75.9% in 2018 to 79.2% in 2035.
For cohorts reaching age 60 in 2021 and thereafter, the CPP retirement benefit take-up rates at age 60 are assumed to be 27.0% and 29.5% in 2021 and thereafter for males and females, respectively, and the take-up rates at age 65 are assumed to be 46.4% in 2021 and thereafter for both males and females. These rates result in a projected average age at retirement pension take-up of 63.2 years in 2040.
The best-estimate assumption for the real-wage increase is that it reaches an ultimate level of 1.0% by the year 2025. The ultimate real-wage increase assumption together with the price increase assumption of 2.0% leads to an ultimate nominal-wage increase of 3.0% for 2025 and thereafter.
A deterministic model (instead of a stochastic model) was used to generate the higher and lower economic growth scenarios for these assumptions, since a stochastic model would not accurately reflect the assumed future trends in labour force participation, unemployment, and real wage increases. The labour shortages and the trend toward delayed retirement are unlike any labour situation experienced in the past, and thus the historical data do not reflect any substantial shifts like the one being projected. Therefore, it was decided to use judgment in determining the higher and lower economic growth assumptions for the participation rates, unemployment and retirement pension take-up rates, and real wage increases.
A.3.1 Higher Economic Growth
Under the higher economic growth scenario, for the labour market, the job creation rate is robust resulting in a lower unemployment level, higher labour force participation rates, and later retirement pension take-up due to the availability of employment and unwillingness to incur early retirement penalties. In addition to the assumed labour market changes, the real-wage increase is assumed to be higher than the best estimate.
For this higher economic growth scenario, the job creation rate is assumed to increase at a faster pace than under the best-estimate scenario, resulting in an unemployment rate of 4.2% in 2030 and thereafter. In addition, the assumed ultimate participation rates in 2035 are set to increase to higher levels than the best estimates. Despite the above and as a result of the uncertainty surrounding the COVID-19 pandemic, the unemployment rates and labour force participation rates for the first 5 years of the projection (2019 to 2023) were not changed from the best-estimate assumptions. Furthermore, the assumed ultimate gap between male and female participation rates in 2035 for those aged 18 to 69 is set equal to 3.8% as opposed to 7.3% under the best-estimate scenario. This results in an overall participation rate of 84.6% for those aged 18 to 69 in 2035. Finally, the ultimate real-wage increase assumption is assumed to be 1.7% compared to 1.0% in the best-estimate scenario, and it is assumed to be reached 3 years later (in 2028 compared to 2025).
The lower unemployment rate, higher participation rate and higher real wages are assumed to encourage individuals to ask for their CPP retirement pension at a later age. Therefore, by 2038, retirement pension take-up rates at age 60 are assumed to gradually decrease to levels that are 20 percentage points lower than the best estimates, i.e. to 7.0% and 9.5% for males and females, respectively. This results in an increase in the projected average age at retirement pension take-up, from 63.2 years to 64.2 years in 2040. The proportions of working beneficiaries were adjusted to reflect the shift in retirement pension take-up to later ages.
Under the higher economic growth scenario, the total employment earnings in 2035 are 18% higher compared to the best estimate and the cost expressed in percentage of GDP decrease to 1.85% in 2060.
A.3.2 Lower Economic Growth
Under the lower economic growth scenario, for the labour market, the job creation rate increases at a slower pace, resulting in a higher unemployment level and lower labour force participation rates. Insufficient employment opportunities are likely to cause individuals to ask for their CPP retirement pension at an earlier age regardless of the early retirement reduction. In addition to the assumed labour market changes, the real wage increase is assumed to be lower than the best estimate.
For this lower economic growth scenario, the job creation rate is assumed to increase at a slower pace than the best estimate, resulting in an unemployment rate of 8.2% in 2030 and thereafter. However, as a result of the uncertainty surrounding the COVID-19 pandemic, the unemployment rates for the first 5 years of the projection (2019 to 2023) were not changed from the best-estimate assumptions. In addition, male and female participation rates are assumed to remain constant at their 2018 levels. This results in an overall participation rate of 76.2% for those aged 18 to 69 in 2035. Finally, the real-wage increase assumption is assumed to be 0.3% compared to 1.0% in the best-estimate scenario.
The higher unemployment rate, lower participation rate and real wages are assumed to encourage individuals to ask for their CPP retirement pension at an earlier age. Therefore, retirement pension take-up rates at age 60 are assumed to gradually increase to levels in 2035 that are 20 percentage points higher than the best estimates, i.e. to 47.0% and 49.5% for males and females, respectively. This results in a decrease in the projected average age at retirement pension take-up from 63.2 years to 62.3 years in 2040. The proportions of working beneficiaries were adjusted to reflect the shift in retirement pension take-up to earlier ages.
Under the lower economic growth scenario described above, the total employment earnings in 2035 are 15% lower compared to the best estimate and the cost expressed in percentage of GDP increase to 3.78% in 2060.
A.3.3 Results
Table 18 presents a summary of the assumptions used in the sensitivity analysis of economic growth and the resulting cost of the program expressed as a percentage of GDP in 2060.
| Canada | Higher Economic Growth |
Best-Estimate | Lower Economic Growth |
|---|---|---|---|
| Changes to Labour Market and Real Wage Increase | |||
| Participation Rate (age group 18-69) (2035) | 84.6% | 79.2% | 76.2% |
| Unemployment Rate (2030) | 4.2% | 6.2% | 8.2% |
| Average CPP Retirement Benefit Take-up Age (2040) | 64.2 years | 63.2 years | 62.3 years |
| Real Wage Increase | 1.7% (2028) | 1.0% (2025) | 0.3% (2019) |
| Expenditures as % of GDP | 1.85% (2060) | 2.63% (2060) | 3.78% (2060) |
A.4 Younger and Older Populations
Demographic and labour force assumptions are modified in this section with the purpose of projecting younger and older populations compared to the best estimate. However, these alternative populations do not necessarily reflect probable scenarios. Using the demographic assumptions of the individual sensitivity tests, two alternative scenarios were examined. The first scenario is classified as the younger population scenario, since the ratio of retirees to workers is lower than under the best-estimate assumptions. The second scenario has a ratio of retirees to workers that is higher than the best estimate and is referred to as the older population scenario. Once the two populations were created, the labour force participation rates were modified to align with the new populations.
The demographic assumptions anticipated in these scenarios were determined using the lower- and higher-cost assumptions regarding fertility, mortality, and migration rates, as well as the labour force participation rates pertaining to the higher and lower economic growth scenarios.
The choice of assumptions will always remain subjective to a certain extent and one could always argue that the range of possible projected outcomes presented herein is not realistic. However, one must keep in mind that these alternative scenarios are only presented to provide a reasonable range of possible future outcomes for the cost of the OAS program.
A.4.1 Younger Population
Under the younger population scenario, it is assumed that the ultimate total fertility rate is 1.92 per woman for Canada. Mortality improvement rates are assumed to increase at a much slower pace than under the best-estimate scenario. The result is that life expectancies at age 65 decrease from their projected best estimates by 2.3 and 2.4 years for males and females, respectively, by 2050. Finally, net migration to Canada is assumed to reach a level of 0.68% of the population in the year 2021.
The combination of these younger population assumptions results in a dependency ratio of those aged 65 and over to the working-age population (20-64) of about 0.41 (or 2.4 workers per retiree) for Canada in 2050. This is 8.8% lower than under the best-estimate scenario where the ratio reaches a level of 0.45 (or 2.2 workers per retiree) in 2050. Under this younger population scenario, the population grows more rapidly, to a level in 2050 that is 6.5% higher compared to the best-estimate scenario. It is assumed that, under a younger demographic scenario, labour shortages would be less severe. As a result, it is assumed that labour force participation rates would be lower, especially at the younger and older ages. Under this scenario the cost in percentage of GDP decreases to 2.40% of GDP in 2060.
A.4.2 Older Population
Under the older population scenario, it is assumed that the ultimate total fertility rate is 1.32 per woman for Canada. Mortality improvement rates are assumed to increase at a faster pace than under the best-estimate scenario. The result is that life expectancies at age 65 increase from their projected best-estimate levels by 2.5 and 2.4 years for males and females, respectively, by 2050. Finally, net migration to Canada is assumed to fall to a level of 0.57% of the population in the year 2021. The combination of these older population assumptions results in a dependency ratio of those aged 65 and over to the working-age population (20-64) of about 0.50 (or 2.0 workers per retiree) for Canada in 2050. This is 9.4% higher than under the best estimate scenario where the dependency ratio reaches a level of 0.45 (or 2.2 workers per retiree) in 2050. Under this older population scenario, the population grows more slowly, to a level in 2050 that is 5.8% lower compared to the best estimate scenario.
It is assumed that, under an older demographic scenario, labour shortages would be more severe. For this purpose, it is assumed that labour force participation rates would be higher, especially at the older ages. Under this scenario the cost in percentage of GDP increases to 2.80% of GDP in 2060.
A.4.3 Results
Table 19 presents a summary of the assumptions used in this sensitivity analysis and the resulting OAS program expenditures as a percentage of GDP. The expenditures as a percentage of GDP are 2.40% and 2.80% for the younger and older population scenarios, respectively.
| Canada | Younger Population | Best-Estimate | Older Population | |||
|---|---|---|---|---|---|---|
| Total fertility rate | 1.92 | 1.62 | 1.32 | |||
| Mortality: Canadian life expectancy at age 65 in 2050 with future improvements |
Males | 21 .0 | Males | 23.3 | Males | 25.8 |
| Females | 23.4 | Females | 25.6 | Females | 28.0 | |
| Net migration rate | 0.68% | 0.62% | 0.57% | |||
| Participation rate (age group 18-69) | 76.2% (2035) | 79.2% (2035) | 84.6% (2035) | |||
| Expenditures as % of GDP | 2.40 (2060) | 2.63 (2060) | 2.80 (2060) | |||
Appendix B ― Summary of Program Provisions
B.1 Introduction
The Old Age Security Act came into force on 1 January 1952. Benefits provided under the Old Age Security Act include the basic pension, the Guaranteed Income Supplement, and the Allowance, which started being paid in 1952, 1967, and 1975, respectively. The Allowance for the survivor benefit started in 1985.
Since the inception of the Old Age Security program, the Old Age Security Act has been amended several times. The Old Age Security Act was most recently amended by the Budget Implementation Act, 2019, No. 1 (Bill C-97), which received Royal Assent on 21 June 2019.
Division 7 of Part 4 of Bill C-97 amends the Old Age Security Act to enhance, beginning 1 July 2020, the income exemption for the Guaranteed Income Supplement (GIS) and Allowance benefits by:
- Extending eligibility for the income exemption to self-employment income;
- Increasing the amount of the full income exemption from the first $3,500 of annual employment income to $5,000 of annual employment and self-employment income for each GIS or Allowance recipient and their spouse or common-law partner; and
- Introducing a partial income exemption of 50 per cent to apply to annual employment and self-employment income greater than the new full income exemption amount of $5,000 but not exceeding $15,000 for each GIS or Allowance recipient and their spouse or common-law partner, for a maximum partial income exemption of $5,000. In combination, the full and partial income exemption can result in a maximum total income exemption of $10,000.
The 15th Actuarial Report Supplementing the Actuarial Report on the Old Age Security program as at 31 December 2015 was prepared in accordance with the Public Pensions Reporting Act to show the effect of these amendments on the OAS program. The 15th Actuarial Report on the OAS program was tabled in the House of Commons on 21 August 2019.
This Appendix B is meant only to provide a summary of the provisions of the OAS program. The legislation shall prevail if there is a discrepancy between it and this summary.
B.2 Financing
All benefits provided under the Old Age Security Act are financed from federal general tax revenues.
B.3 Basic Pension
The OAS basic pension is a monthly benefit available, on application, to anyone age 65 or over who meets the residence and legal status requirements specified in the Old Age Security Act.
B.3.1 Eligibility Conditions
To qualify for an OAS basic pension, a person must be 65 years of age or older, and
- must be a Canadian citizen or a legal resident of Canada on the day preceding the approval of his or her application; or
- if the person no longer lives in Canada, must have been a Canadian citizen or a legal resident of Canada on the day preceding the day he or she stopped living in Canada.
A minimum of 10 years of residence in Canada after reaching age 18 is required to receive an OAS basic pension in Canada. To receive the OAS pension outside the country, a person must have lived in Canada for a minimum of 20 years after reaching age 18. An international social security agreement may assist a person to meet the 10‑ and 20‑year requirements. As of 1 January 2011, the OAS basic pension is not payable to incarcerated individuals in accordance with the provisions of the Eliminating Entitlements for Prisoners Act.
B.3.2 Amount of Benefits
The amount of a person's pension is determined by how long he or she has lived in Canada, according to the following rules:
- A person who has lived in Canada, after reaching age 18, for periods that total at least 40 years may qualify for a full OAS pension.
- A person who has not lived in Canada for 40 years after reaching age 18 may still qualify for a full pension if, on 1 July 1977, he or she was 25 years of age or over, and
- lived in Canada on that date, or
- had lived in Canada before that date and after reaching age 18, or
- possessed a valid immigration visa on that date.
In such cases, the individual must have lived in Canada for the 10 years immediately prior to the approval of the application for the pension. Absences during this 10-year period may be offset if, after reaching age 18, the applicant was present in Canada before those 10 years for a total period that was at least three times the length of absence. In this instance, however, the applicant must also have lived in Canada for at least one year immediately prior to the date of the approval of the application. For example, an absence of two years between the ages of 60 and 62 could be offset by six years of presence in Canada after age 18 and before reaching age 55.
- A person who cannot meet the requirements for the full OAS pension may qualify for a partial pension. A partial pension is earned at the rate of 1/40th of the full monthly pension for each complete year of residence in Canada after reaching age 18. Once a partial pension has been approved, it may not be increased as a result of additional years of residence in Canada. As an example, an individual with 20 complete years of residence in Canada at the time of application for the OAS pension would be entitled to 50% (or 20/40) of the maximum monthly OAS pension for the remainder of his/her lifetime.
Effective 1 July 2013, individuals may opt to defer receiving the OAS basic pension by up to five years after the eligible age (i.e. age 65 or older for those meeting the minimum residency requirement after age 65) in exchange for a higher pension. The deferred pensions are actuarially adjusted upward by 0.6% per month for each month after the eligible age until the month in which the application for the pension is approved (the deferral period) but in no case later than age 70. For those eligible for a basic pension at age 65, the maximum pension adjustment is 36% at age 70. In the case where an individual, who is entitled to a partial pension, chooses to defer receipt of the pension, the pension amount paid is the greater of the actuarially adjusted pension over the individual's deferral period and the higher pension resulting from accruing additional years of residency over that period.
The OAS basic pension is subject to income tax. The maximum monthly pension payable at age 65 was $613.53 during the second quarter of 2020. The OAS basic pension is adjusted quarterly in line with changes in the CPI, as described in subsection 6.
The amount of the pension paid to persons with high incomes is reduced through a provision of the Income Tax Act often referred to as the "OAS Recovery Tax". For benefits payable in 2020, the reduction applies to individuals whose total net annual income exceeds $79,054 in that calendar year. For this purpose, an individual's total net annual income is after pension income splitting, if that option is elected by OAS beneficiaries who are married or common-law partners.
OAS Recovery Tax deductions are withheld at source. The deductions are estimates of the tax owed and are recalculated in July of each year based on the OAS recipient's previous year's net income. The Recovery Tax actually owed for a given year is determined the following year and compared to the deductions made, with the given year's tax liability adjusted accordingly.
The income threshold for the Recovery Tax is indexed upward in accordance with increases in the CPI. For every dollar of income above this limit, the amount of the basic pension is reduced by 15 cents. Income earned within a TFSA or withdrawals made from a TFSA are excluded from total net annual income for the purpose of determining the amount of the OAS Recovery Tax, which could then result in a higher basic pension payable.
As an example, an OAS recipient with a net annual income of $81,054 in 2020 would incur a Recovery Tax of $300 in 2020. The full 2020 annual OAS basic pension is thus eliminated when a pensioner's net annual income is $128,137 or above in 2020 (estimated as of the second quarter of 2020 based on annualized OAS benefits of $7,362.36).
B.4 Guaranteed Income Supplement
The GIS is a monthly benefit paid to residents of Canada who receive an OAS basic pension (either the full amount or a partial amount) and who have little or no other income.
Payment of the GIS may begin in the same month as payment of the basic pension. The amount of the benefit varies according to income (see below). Most individuals receiving the GIS can continue to do so by filing their income tax returns, rather than making a new application each year. The amount of monthly payments may increase or decrease according to reported changes in a person's yearly income. Any income earned within a TFSA or withdrawals made from a TFSA are not considered as income for the purpose of determining the level of GIS benefit entitlement.
Unlike the OAS basic pension, the GIS is not subject to income tax. The GIS is not payable outside Canada beyond a period of six months following the month of departure from Canada, regardless of how long the person previously lived in Canada.
B.4.1 Eligibility Conditions
To receive the GIS, a person must be receiving an OAS basic pension. Eligibility for the GIS is determined every year based on the previous year's income. Income (as defined for purposes of the GIS and Allowance benefits under the Old Age Security Act) received in the previous year is used to calculate the amount of benefits paid during the period starting on 1 July of a calendar year and ending on 30 June of the following calendar year. However, if an individual or an individual's spouse or common-law partner has retired or has suffered a loss of income, an estimate of income may be substituted for the income of the preceding year.
In general, income as defined under the Income Tax Act is included subject to certain exemptions. Exemptions from income include any payments received under the OAS program (basic pension, GIS, and Allowance benefits) and employment income up to $3,500 prior to 1 July 2020.
Effective 1 July 2020 eligibility for the employment income exemption is extended to self employment income and,
- the amount of the full employment income exemption is increased from the first $3,500 of annual employment income to $5,000 of annual employment and self-employment income for each GIS or Allowance recipient and their spouse or common-law partner; and
- a partial employment income exemption of 50 per cent to apply to annual employment and self-employment income greater than the new full employment income exemption amount of $5,000 but not exceeding $15,000 for each GIS or Allowance recipient and their spouse or common-law partner, for a maximum partial employment income exemption of $5,000. In combination, the full and partial employment income exemption can result in a maximum total employment income exemption of $10,000.
The resulting estimated income of an individual (or, the combined income of the individual and his or her spouse or common-law partner) cannot exceed certain limits as described later.
Persons admitted to Canada as sponsored immigrants after 6 March 1996 and qualifying for benefits after January 2001 are not eligible, generally speaking, to receive the GIS for the duration of a sponsorship, up to a maximum of ten years. Exceptions are made, however, if an immigrant's sponsor dies, is incarcerated for a period of more than six months, is convicted of a criminal offence relating to the sponsored individual, or undergoes personal bankruptcy. A spouse or common-law partner who becomes involuntarily separated due to, for example, incarceration or institutionalization of his or her spouse or partner, is considered to be single in regard to applying for the GIS benefit.
Since a person may only receive the GIS if also in receipt of the OAS basic pension, the GIS is not payable to incarcerated individuals as per the provisions of the Eliminating Entitlements for Prisoners Act.
B.4.2 Amount of Benefits
The amount of the GIS to which a person is entitled depends on his or her length of residence in Canada, marital status, and income. If the person is married or living in a common‑law relationship, the combined income of the person and his or her spouse or common-law partner is taken into consideration when the amount of the GIS benefit is calculated.
To be entitled to a full GIS benefit, applicants must have resided in Canada for at least 10 years after reaching age 18. For applicants who are admitted to Canada after 6 March 1996 and qualify for OAS benefits after January 2001, and who have less than 10 years of residence in Canada after age 18, a partial benefit is payable provided, as noted in the previous section, that the person is not a sponsored immigrant who is still in the period of sponsorship. The partial benefit is calculated at the rate of 1/10th of the amount of the full benefit for each complete year of residence in Canada after age 18. The proportion payable is recalculated each year, taking into account additional residence in Canada during the previous year, building gradually to a full benefit after 10 years.
There are two rates of payment for a GIS benefit. The single rate applies to single individuals – including widowed, divorced or separated persons as well as individuals who have never married and to persons for whom their spouses or common-law partners do not receive either the OAS pension or the Allowance. The single rate also applies to spouses or common-law partners who become involuntarily separated from their spouses or partners as mentioned above. During the second quarter of 2020 the maximum monthly GIS single benefit (including the top-up, discussed below) is $916.38.
The married rate applies both to married couples and to couples living in common‑law relationships, where either both spouses are OAS pensioners or where one spouse is eligible for the Allowance benefit. During the second quarter of 2020, the maximum monthly GIS married benefit (including the top-up, discussed below) is $551.63.
The single rate is higher than the married rate, reflecting the higher cost of living alone. However, each member of a married or common-law couple is entitled to his or her own benefit, so the combined benefits for a couple are higher than those for a single person.
As of 1 July 2011, top-up benefits are payable to GIS recipients who receive benefits at the single rate, as described above, and to couples that include a GIS recipient. As of 1 July 2016, the single rate of the GIS top-up for the lowest-income pensioners was increased by up to $947 annually or $78.92 monthly. For the second quarter of 2020, the top-up benefits are $141.94 and $40.22 per month for single-rate recipients and each spouse or common-law partner of a couple, respectively, and are adjusted quarterly in line with changes in the CPI, as described in subsection 6.
The top-ups are reduced by 25 cents for every dollar of income in excess of $2,000 for GIS single recipients and $4,000 of combined income for couples. In the second quarter of 2020, the income limits for the top-ups are $8,816 for GIS single recipients, $17,632 for couples where the GIS recipient's spouse or common law partner does not receive a basic pension or Allowance, and $7,936 for couples where the GIS recipient's spouse or common law partner is either an OAS pensioner or Allowance recipient.
A special provision applies to persons who receive a partial OAS pension. In this case, the supplement is increased by the difference between the maximum OAS pension and the partial OAS pension in order to provide the same combined monthly pension and supplement to beneficiaries with the same level of income. The additional amount may result in the supplement exceeding the maximum GIS payable.
As an example, during the second quarter of 2020, a single person with no income who is entitled to a partial pension of $153.38 (25% of the maximum monthly OAS pension of $613.53) would be entitled to an additional supplement of $460.15 for a total supplement of $1,376.53 (i.e. $916.38 plus $460.15, including the top-up).
For a single, widowed, divorced or separated person, the maximum monthly GIS benefit is reduced by 50 cents for every dollar of monthly income (i.e. annual income divided by 12). This reduction is in addition to any reduction to the top-up. For example, a monthly income of $800 would reduce the maximum monthly GIS payable by $541.84 to $374.44 in the second quarter of 2020. In this case, the maximum allowable annual income before GIS stops being paid is $18,600 in the second quarter of 2020.
If both spouses or common-law partners are receiving the OAS basic pension, the maximum monthly GIS of each person is reduced by 25 cents for every dollar of other combined monthly income (i.e. annual income divided by 12), which is in addition to any reduction applied to the top-up. For example, a combined monthly income of $1,400 for a couple would reduce the maximum monthly GIS benefit payable to each spouse or common-law partner by $390.22 to $161.41 in the second quarter of 2020. In this case, the maximum allowable annual income before the GIS stops being paid is $24,576 in the first quarter of 2020.
A special provision applies in the case of a couple in which only one spouse or common-law partner is a pensioner and the other is not eligible for either the OAS pension or the Allowance. In this instance, the pensioner can receive the GIS at the higher rate paid to those who are single. Moreover, the maximum monthly GIS is reduced by 25 cents for every dollar of the couple's combined monthly income (i.e. annual income divided by 12), and the reduction of 25 cents is applied only when the combined monthly income of the couple exceeds the maximum monthly OAS pension, where that amount, if not a multiple of $4, is rounded to the next higher multiple of $4 (i.e. $616 in the second quarter of 2020). This reduction is in addition to any reduction applied to the top-up benefit. As an example, a couple with a combined monthly income of $2,000 would see their maximum monthly GIS benefit reduced by $487.94 to $428.44 in the second quarter of 2020. In this case, the maximum allowable annual income before GIS stops being paid is $44,592 in the second quarter of 2020.
In the case of a couple in which one spouse or common-law partner receives the GIS and the other receives the Allowance, the GIS is paid at the rate paid to those who are married, and the maximum monthly GIS is reduced by 25 cents for every dollar of the couple's combined monthly income (i.e. annual income divided by 12). The reduction of 25 cents is applied only when the combined monthly income of the couple exceeds four-thirds times the maximum monthly OAS pension, where that pension, if not a multiple of $3, is rounded to the next higher multiple of $3 (i.e. income above $820, in the second quarter of 2020). This reduction is in addition to any reduction applied to the top-up. As an example, a couple with a combined monthly income of $1,400 would see the pensioner's maximum monthly GIS benefit at the married rate reduced by $145.00 to $ 366.41 in the second quarter of 2020. In this case, for the second quarter of 2020, the maximum allowable annual income before the GIS stops being paid is $ 44,592.
GIS recipients whose spouse or common-law partner is incarcerated are considered to be single recipients for the purpose of determining the amount of the GIS benefit.
All GIS benefits including top-ups are adjusted quarterly in line with changes in the CPI, as described in subsection 6. No actuarial adjustment is applied to GIS benefits payable to OAS pensioners who defer receiving their basic pensions in exchange for actuarially-adjusted higher pensions.
B.5 Allowance
The Allowance monthly benefit is designed to recognize the difficult circumstances faced by couples living on the pension of only one spouse as well as by many widowed persons. Since 1999, most of those receiving the Allowance can continue to do so by filing their income tax returns, rather than making a new application each year. Effective 1 July 1999, income (as defined for purposes of the GIS and the Allowance benefits under the Old Age Security Act) received in the previous calendar year is used to calculate the amount of benefits paid during the period starting on 1 July of a calendar year and ending on 30 June of the following calendar year.
Like the GIS, Allowance benefits are not subject to income tax. In addition, also like the GIS benefit, Allowance benefits are not payable outside Canada beyond a period of six months following the month of departure from Canada, regardless of how long the person previously lived in Canada.
B.5.1 Eligibility Conditions
The Allowance may be paid to the spouse or common-law partner of a senior receiving OAS and GIS benefits, or to a survivor, who, in each case, is between the ages of 60 and 64 and who has lived in Canada for at least 10 years after reaching age 18. An applicant must also be a Canadian citizen or a legal resident of Canada on the day preceding the approval of the application. The same income exclusions and deductions that apply to the GIS also apply to the Allowance benefit.
The Allowance stops being paid when the person becomes eligible for a basic pension at age 65, leaves Canada for more than six months, or dies. For a couple, the Allowance stops being paid if the older spouse or common-law partner ceases to be eligible for the GIS, or if the spouses separate, divorce, or dissolve their common-law partnership. In addition, in the case of survivors, the Allowance ceases if the person remarries. Sponsored immigrants are subject to the same conditions regarding eligibility as are described in the preceding section regarding the GIS. As of 1 January 2011, the Allowance is not payable to any individual incarcerated in an institution in accordance with the provisions of the Eliminating Entitlements for Prisoners Act. However, Allowance benefits to spouses or common-law partners of incarcerated individuals remain payable.
B.5.2 Amount of Benefits
The Allowance is an income tested benefit. Like the GIS, if the recipient is married or living in a common law relationship, the combined income of the recipient and his or her spouse or common-law partner is taken into account in determining the amount of the Allowance. In addition, to be entitled to the full or partial Allowance benefits, the same rules apply as for GIS benefits regarding admittance to and years of residence in Canada and the recalculation of benefits, described above in section B.4.2.
As of 1 July 2011, top-up benefits are payable to Allowance recipients for both the regular benefit (i.e. Allowance spouses and common-law partners of GIS recipients) and the survivor benefit. As of 1 July 2016, the single rate of the GIS top-up for the lowest-income pensioners was increased by up to $947 annually or $78.92 monthly. In the second quarter of 2020, the top-up benefits are $40.22 and $141.94 for the regular and survivor Allowance benefits, respectively, and are adjusted quarterly in line with changes in the CPI, as described in subsection 6. The top-ups are reduced by 25 cents for every dollar of income in excess of $2,000 for Allowance (survivor) recipients and $4,000 of combined income for couples. In the second quarter of 2020, the income limits for the top-ups are $7,936 for the regular Allowance benefit and $8,816 for the survivor Allowance benefit.
The maximum amount payable to the spouse of a pensioner under the regular Allowance benefit is equal to the combination of a full OAS pension and the maximum GIS at the married rate. This amount was $1,165.16 (including the top-up) during the second quarter of 2020. The maximum amount payable for the survivor Allowance benefit is higher than the regular Allowance benefit, recognizing the higher cost of living alone. The maximum monthly survivor Allowance amount was $1,388.92 during the second quarter of 2020.
The OAS‑equivalent portion of the maximum monthly Allowance benefit (regular and survivor) is reduced at a rate of 75 cents for every dollar of the person's or couple's monthly income (i.e. annual income divided by 12) until this portion is reduced to zero, which in the second quarter of 2020 corresponds to monthly income reaching $820. Up to this level of income the GIS portion remains payable at the maximum. For the regular Allowance benefit, both the GIS‑equivalent portion of the Allowance and the pensioner's GIS are then reduced by 25 cents for every additional dollar of the couple's combined monthly income, i.e., in this case no regular Allowance benefit becomes payable if the annual income exceeds $34,416 in the second quarter of 2020. For the survivor Allowance benefit, the GIS‑equivalent portion is reduced by 50 cents for every additional dollar of monthly income, i.e., in this case, for the second quarter of 2020, no survivor Allowance benefit becomes payable if annual income exceeds $25,056. The reductions to the Allowance benefits are in addition to any applied to the top-ups.
As examples, for a couple including a GIS recipient and Allowance recipient, with a combined monthly income of $1,400, the maximum monthly Allowance benefit would be reduced by $798.75 to $366.41 in the second quarter of 2020. For a survivor Allowance recipient with a monthly income of $800, the maximum benefit would be reduced by $741.94 to $646.98 in the second quarter of 2020.
In the case where a pensioner of a spouse of common-law partner is incarcerated, the couple's monthly income for the purpose of determining the spousal Allowance benefit is the monthly income of the spouse or common-law partner only.
All Allowance benefits including top-ups are adjusted quarterly in line with changes in the CPI, as described in subsection 6. No actuarial adjustment is applied to Allowance benefits payable to spouses or common-law partners of OAS pensioners who defer receiving their basic pensions in exchange for actuarially-adjusted higher pensions.
B.6 Inflation Adjustments
All benefit amounts under the Old Age Security Act are adjusted at the beginning of each calendar quarter in line with changes in the CPI. However, if the CPI decreases, benefit amounts do not decrease, but are held constant until the CPI exceeds its previous peak.
Appendix C ― Detailed Reconciliations with Previous Triennial Report
The ratio of expenditures to GDP in a given year is an important measure of the cost of the program. One way of understanding the differences between the best-estimate projections in this report and those presented in the 14th Actuarial Report on the OAS program as at 31 December 2015 is by looking at the effects of various factors on this cost ratio. The most significant effects are identified in the reconciliation presented in Table 20 and the discussion below.
The results presented in this report differ from those previously projected for a variety of reasons. Differences between the actual experience from 2016 through 2018 and that projected in the 14th Actuarial Report on the OAS program for the same period were addressed in the section 5.2 of this report. Since historical results provide the starting point for the projections shown in this report, these historical differences between actual and projected experience have an effect on the projections. The impact of the experience update and changes in the assumptions and methodology that have significantly changed the projected results are addressed in this Appendix.
The recent amendments made to the Old Age Security Act, namely the increase in the income exemption (effective 1 July 2020) for GIS and Allowance benefits lead to an increase in the cost ratio over the long term. The amendments lead to an absolute increase in the ratio of 0.01% in 2030.
Overall, the experience update had the effect of reducing the cost ratio by 0.10% in 2030 and 0.20% ultimately in 2060. This was mainly due to higher than expected GDP at the end of 2018.
Key assumptions and changes made from the previous triennial report are outlined in Table 1 of this report. The effects of these changes are also shown in Table 20 and are summarized below:
- The assumed total fertility rate is lower than assumed in the previous triennial report, and as such, has the impact of slightly increasing the cost ratio in the long term.
- The assumed level of net migration in the early years of the projection is higher than in the previous triennial report, and this lowers the cost ratio.
- The mortality assumptions slightly decrease the cost ratio in the short term, because mortality rates are assumed to be higher in the short term as compared to the previous report.
- The change in the assumed labour force participation and employment rates decreases the cost ratios, since it results in projected higher total earnings and GDP relative to projected expenditures.
- The lower real wage increase assumption causes the cost ratios to rise due to the resulting projected lower increase in total earnings and GDP compared to the previous triennial report.
- Changes to assumptions used in the projection of the GDP cause the cost ratios to increase over the long term.
- The inflation rate has a very small effect on the cost ratios. The reason for this is twofold. First, expenditures increase at a slower rate due to lower benefit indexation. Second, although nominal GDP continues to increase, its rate of growth slows to the same extent, since its rate of growth depends on the real wage increase, inflation, and the price differential between nominal GDP and total employment earnings.
- Changes to the recipient rates assumptions decrease the cost ratios over the long term.
- Changes in assumptions regarding the additional CPP and the introduction of QPP additional benefits result in gradual reductions in the cost ratios.
Some other assumptions, which are described in Appendix D, were also changed. For example, the experience adjustment factors used in the projection of benefits were revised to reflect more recent experience. Overall, the changes in these other assumptions had the effect of increasing the cost ratios over the long term.
| 2019 | 2030 | 2060 | |
|---|---|---|---|
| 14th Actuarial Report on the OAS Program | 2.63 | 3.21 | 2.65 |
| I. Legislated Amendments: | |||
|
15th OAS Program Actuarial Report on the OAS Program
|
0.00 | 0.01 | 0.00 |
| Total Amendments | 0.00 | 0.01 | 0.00 |
| II. Improvements in Methodology | 0.00 | (0.01) | 0.00 |
| III. Experience Update (2016 to 2018) | |||
| Demographic | (0.05) | (0.04) | (0.05) |
| Economic | (0.08) | (0.10) | (0.16) |
| Benefits | (0.03) | 0.04 | 0.01 |
| Subtotal: | (0.16) | (0.10) | (0.20) |
| IV. Changes in Assumptions | |||
| Fertility | 0.00 | 0.00 | 0.02 |
| Net Migration | (0.01) | (0.01) | (0.02) |
| Mortality | 0.00 | (0.02) | 0.00 |
| Employment | (0.02) | (0.01) | (0.01) |
| Real-wage differential | 0.03 | 0.11 | 0.18 |
| GDP | 0.00 | (0.02) | 0.06 |
| Price increases | 0.00 | 0.00 | (0.01) |
| Recipient rates | 0.02 | (0.06) | (0.03) |
| Other assumptions | 0.01 | 0.03 | 0.01 |
| Additional CPP and QPPTable 20 Footnote 1 | 0.00 | (0.01) | (0.02) |
| Subtotal: | 0.03 | 0.01 | 0.18 |
| Total of I to IV | (0.13) | (0.09) | (0.02) |
| 16th Actuarial Report on the OAS Program | 2.50 | 3.12 | 2.63 |
|
|||
Appendix D ― Data, Assumptions and Methodology
D.1 Introduction
This Appendix describes the data, assumptions, and methods that underlie the financial projections in the Results section 4 of this report.
Future expenditures and cost ratios are projected over a long period of time, i.e. up to the year 2060, and depend on assumptions such as those regarding fertility, mortality, migration, labour force participation, job creation, unemployment, inflation, and employment earnings. These assumptions form the basis for the projections of future expenditures of the program and cost measurement bases.
The impacts of the COVID-19 pandemic on the two-cost measurement bases used in this report i.e., total employment earnings and the Gross Domestic Product (GDP) have been taken into account in the development of the assumptions. It is important to note that the COVID-19 pandemic is a very fluid situation that will likely continue to evolve for some time. We have estimated the impacts based on the information known at the time the report was prepared. The final impacts of this health and economic crisis will likely generate some differences in the future.
Although the demographic and economic assumptions have been developed using the available information, the resulting estimates should be interpreted with caution. These estimates are not intended to be predictions, but rather projections of the costs of the program. To the extent applicable, and with the exception of certain adjustments resulting from the impacts of the COVID-19 pandemic, these assumptions are generally consistent with the best-estimate assumptions used in the 30th CPP Actuarial Report as at 31 December 2018.
D.2 Data
The data used for this report is the same as for the 30th CPP Actuarial Report (see Table 36 of that report). In addition, historical data on OAS program beneficiaries were obtained from Service Canada and the Canada Revenue Agency provided income tax return information.
D.3 Demographic Projections
The historical and projected populations of Canada are required for the calculation of future benefits. The population of Canada as at 1 July 2018 is used as a starting point. The population is then projected by age and sex from one year to the next by adding births and net migrants and subtracting deaths. Applying the fertility, migration, and mortality assumptions to the starting population develops the annual numbers of births, net migrants, and deaths.
D.3.1 Initial Population as at 1 July 2018
The starting point for the demographic projections is based on the most recent Statistics Canada population estimates as at 1 July 2018 for Canada, by age and sex. The estimates are based on the 2016 Census. The estimates are adjusted by ungrouping ages 100 and older into individual ages using the observed distribution of OAS program beneficiaries by age for ages 100 and older.
D.3.2 Fertility Rates
There are two definitions for the fertility rate: the total fertility rate and the cohort fertility rate. The total fertility rate corresponds to the average number of children born in a given calendar year. Specifically, it is the sum of fertility rates by age group for women aged 15 to 49. In comparison, the cohort fertility rate is the average number of children born to a woman in her lifetime, for women born in a specific year. It gives an idea of trends and variations between different generations over time.
Fertility rates are affected by many factors, including social attitudes, reproductive technologies, and economic conditions. It is assumed for this report that the most recent economic downturn has caused a temporary downward effect on total fertility rates, with couples choosing to postpone having any or more children until economic conditions improve. This effect was taken into consideration along with historical trends in age-specific fertility rates over the last 15 years.
The total fertility rate in Canada has declined significantly since the baby boom period, when the rate peaked at nearly 4.0 per woman in the late 1950s. The baby bust period that followed in the mid-1960s initiated a decline in total fertility rates, resulting in a record low of 1.6 children per woman by the mid-1980s. The total fertility rate rose slightly in the early 1990s, but then generally declined to a level of 1.5 by the late 1990s. Canada is one of many industrialized countries that saw their total fertility rates increase starting in the 2000s. By 2008, the total fertility rate for Canada had reached 1.68. However, in some industrialized countries, including Canada, the total fertility rate has decreased since 2008, which could be attributable to the economic downturn experienced in recent years. In 2017, the total fertility rate for Canada was 1.55Footnote 8.
To determine the ultimate total fertility rate for Canada, the historical fertility rate of each age group was studied and projected independently. As a result, it is assumed that the total fertility rate from 2027 onward for Canada will be 1.62 children per woman, which is lower than the ultimate rate of 1.65 assumed for the 14th Actuarial Report on the OAS. The ultimate rate corresponds to the average experience over the last 15 years, which captures the pre- and post-recession trends.
Although the historical total fertility rates, based on age-group rates, are used to set the assumption for the future, it is nonetheless useful and informative to consider the historical progression of the cohort fertility rates. Over time, the cohort fertility rate will converge to the total fertility rate assumption as shown in Table 21. Historically, the cohort fertility rates in Canada have steadily declined for the last 50 years. For females born in 1941, who reached the end of their childbearing years (turned age 49) in 1990, the cohort rate was 2.61. However, for females reaching the end of their childbearing years in 2017 (born in 1968), the cohort fertility rate was 1.78.
Finally, in accordance with the average experience over the last 10, 20, and 30 years, the assumed ratio of male to female newborns is 1.053, which is essentially the same as for the 14th Actuarial Report on the OAS.
| Year of Birth of Woman Table 21 - Footnote 1 |
Annual Fertility Rates by Age Group (per 1,000 women) |
Cohort Fertility Rates per WomanTable 21 - Footnote 2 |
||||||
|---|---|---|---|---|---|---|---|---|
| 15-19 | 20-24 | 25-29 | 30-34 | 35-39 | 40-44 | 45-49 | ||
| 1960 | 31.3 | 91.3 | 117.5 | 86.1 | 32.6 | 6.2 | 0.4 | 1.83 |
| 1965 | 26.0 | 76.8 | 121.2 | 84.9 | 36.4 | 7.9 | 0.5 | 1.77 |
| 1970 | 22.7 | 76.5 | 104.7 | 91.3 | 48.5 | 10.6 | 0.8 | 1.78 |
| 1975 | 25.6 | 64.6 | 97.9 | 106.1 | 53.4 | 11.7 | 0.9 | 1.80 |
| 1980 | 20.0 | 54.2 | 101.9 | 107.7 | 57.0 | 13.9 | 1.0 | 1.78 |
| 1985 | 14.9 | 52.6 | 96.3 | 107.8 | 64.2 | 16.2 | 1.0 | 1.77 |
| 1990 | 13.9 | 44.6 | 87.0 | 114.1 | 71.5 | 16.2 | 1.0 | 1.74 |
| 1995 | 12.1 | 37.0 | 84.8 | 120.4 | 71.5 | 16.2 | 1.0 | 1.71 |
| 2000 | 7.7 | 32.3 | 82.5 | 120.4 | 71.5 | 16.2 | 1.0 | 1.66 |
| 2005 | 6.2 | 27.6 | 82.5 | 120.4 | 71.5 | 16.2 | 1.0 | 1.63 |
| 2006 | 5.9 | 27.6 | 82.5 | 120.4 | 71.5 | 16.2 | 1.0 | 1.63 |
| 2007 | 5.5 | 27.6 | 82.5 | 120.4 | 71.5 | 16.2 | 1.0 | 1.62 |
| 2008 | 5.2 | 27.6 | 82.5 | 120.4 | 71.5 | 16.2 | 1.0 | 1.62 |
| 2009 | 4.9 | 27.6 | 82.5 | 120.4 | 71.5 | 16.2 | 1.0 | 1.62 |
| 2010+ | 4.6 | 27.6 | 82.5 | 120.4 | 71.5 | 16.2 | 1.0 | 1.62 |
|
||||||||
Table 22 shows the projected age-specific and total fertility rates by calendar year for Canada. Chart 3 shows the historical and projected total and cohort fertility rates for Canada.
| Year | Annual Fertility Rates by Age Group (per 1,000 women) |
Total | ||||||
|---|---|---|---|---|---|---|---|---|
| 15-19 | 20-24 | 25-29 | 30-34 | 35-39 | 40-44 | 45-49 | ||
| 2019 | 7.1 | 35.1 | 86.1 | 110.3 | 59.9 | 12.6 | 0.8 | 1.56 |
| 2020 | 6.8 | 34.2 | 85.7 | 111.6 | 61.3 | 13.0 | 0.9 | 1.57 |
| 2021 | 6.5 | 33.2 | 85.2 | 112.8 | 62.8 | 13.5 | 0.9 | 1.57 |
| 2022 | 6.2 | 32.3 | 84.8 | 114.1 | 64.2 | 13.9 | 0.9 | 1.58 |
| 2023 | 5.9 | 31.4 | 84.3 | 115.4 | 65.7 | 14.4 | 0.9 | 1.59 |
| 2024 | 5.5 | 30.4 | 83.9 | 116.6 | 67.1 | 14.8 | 0.9 | 1.60 |
| 2025 | 5.2 | 29.5 | 83.4 | 117.9 | 68.6 | 15.3 | 1.0 | 1.60 |
| 2026 | 4.9 | 28.5 | 83.0 | 119.2 | 70.0 | 15.7 | 1.0 | 1.61 |
| 2027+ | 4.6 | 27.6 | 82.5 | 120.4 | 71.5 | 16.2 | 1.0 | 1.62 |
Chart 3 - Historical and Projected Total and Cohort Fertility Rates for CanadaFootnote 1
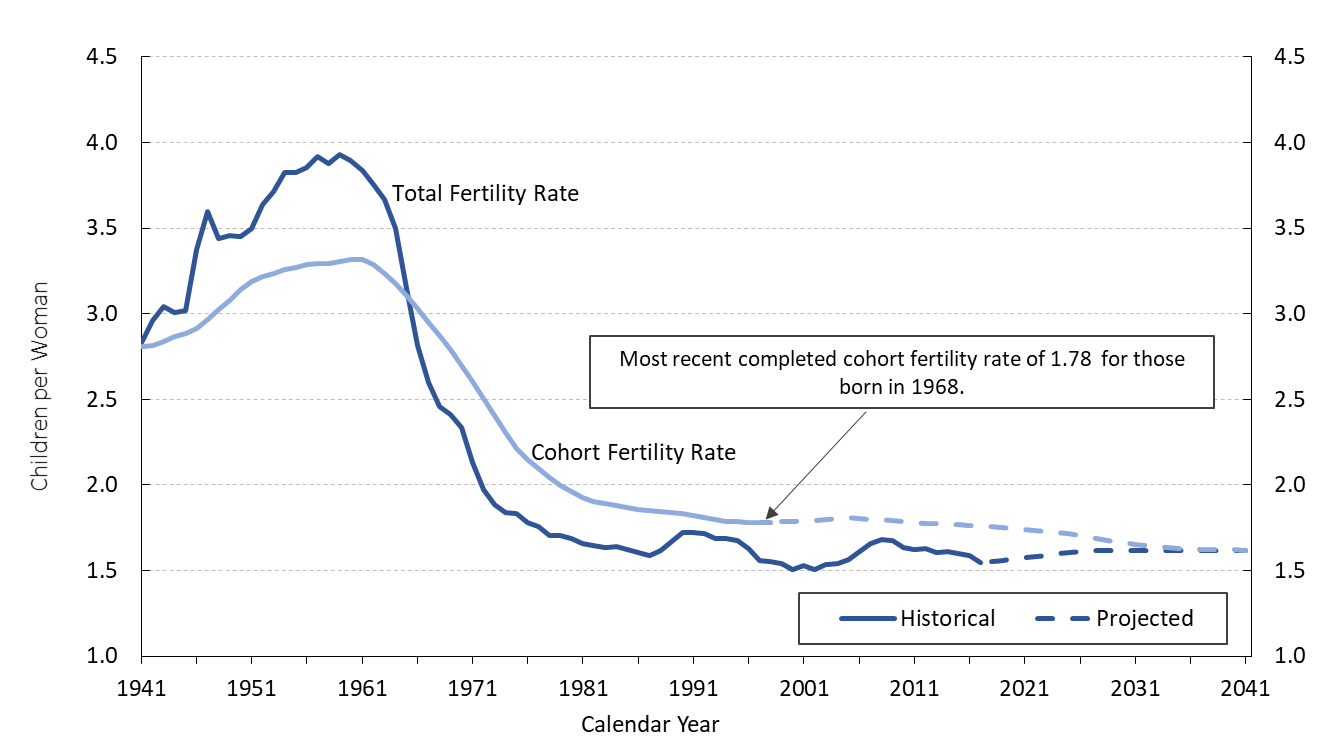
Chart 3 - Description
Line chart showing the historical and projected total and cohort fertility rates for Canada, where the cohort fertility rates are based on a woman being age 30 in a given calendar year. Y axis represents the rate in number of children per women. X axis represents the year.
The Total Fertility Rate is 2.8 children per woman in 1941, increases overall to reach its highest point of 3.9 in 1959, and then decreases significantly to 1.6 by the mid-1980s. From the mid-1980s until 2017, the Total Fertility Rate has periods of growth and decline, fluctuating between 1.5 and 1.7, with a value of 1.55 in 2017. After 2017, the rate is projected to gradually increase to reach 1.62 in 2027 and remain at that level thereafter.
The cohort fertility rate is 2.8 children per woman in 1941, increases to its highest point of 3.3 in 1960, then decreases thereafter, reaching a projected value of 1.62 by 2041.
The most recent completed cohort fertility rate of 1.78 in 1998 is for those born in 1968.
- Chart 3 footnote 1
-
Cohort fertility rates are based on the age of a woman being 30 in a given calendar year. For instance, the cohort fertility rate for the year 2016 pertains to women born in 1986.
D.3.3 Mortality
For this report, the mortality rate projections start from the year 2015 mortality rates of Statistics Canada (CLT 2014-2016 Tables). According to Statistics Canada, life expectancies at birth in 2015 without any assumed future improvements in mortality (i.e. reductions in mortality) for males and females in Canada were 79.9 and 84.0 years, respectively, compared to 80.5 and 84.3 years projected under the 14th Actuarial Report on the OAS. At age 65 in 2015, life expectancies were 19.3 and 22.1 years according to Statistics Canada Tables compared to 19.7 and 22.3 years projected under the 14th Actuarial Report on the OAS for males and females, respectively.
The average annual mortality improvement rates experienced in Canada over the 15 year period from 2000 to 2015 by age and sex were used as the basis for projecting annual mortality improvement rates from 2016 onward. For ages 65 and over, the annual mortality improvement rates for 2016 to 2017 were projected using the trends derived from the administrative data on Old Age Security (OAS) program beneficiaries, representing 98% of the general population. Improvement rates by age and sex for years 2016 to 2034 (2018 to 2034 for ages 65 and over) were determined by cubical interpolation between:
- the improvement rates of year 2015 (2017 for ages 65 and over), and
- the ultimate improvement rates described below in respect of the period 2035 and thereafter.
For the year 2035 and thereafter for Canada, the ultimate annual rates of mortality improvement vary by age only and not by sex or calendar year. The ultimate mortality improvement rates are derived using a combination of backward and forward looking approaches. The analysis of the Canadian experience over the period from 1925 to 2015, including the recent slowdown trends observed in mortality improvement rates for OAS beneficiaries, was combined with an analysis of the possible drivers of future mortality improvements. Mortality improvement rates for males at most ages are currently higher than those for females but are assumed to decrease to the same level as female rates from 2035 onward.
The ultimate rate for both sexes for ages 0 to 89 is set at 0.8% per year from 2035 onward for Canada. For ages above 89, the ultimate improvement rate is set to reduce from 0.5% for the age group 90 94 to 0.2% for those aged 95 and older.
Table 23 shows the initial (2016‑2017), intermediate (2018-2034) and ultimate (2035+) assumed annual mortality improvement rates for Canada. The mortality improvement rates shown for 2016‑2017 and 2018‑2034 represent the average rates over these periods.
| Males | Females | |||||||
|---|---|---|---|---|---|---|---|---|
| Age | 2016-2017Table 23 - Footnote 1 | 2018-2034Table 23 - Footnote 1 | 2035+ | 2016-2017Table 23 - Footnote 1 | 2018-2034Table 23 - Footnote 1 | 2035+ | ||
| 0 | 1.1 | 1.0 | 0.8 | 0.7 | 0.8 | 0.8 | ||
| 1-14 | 3.3 | 2.0 | 0.8 | 1.6 | 1.2 | 0.8 | ||
| 15-44 | 1.9 | 1.3 | 0.8 | 1.0 | 0.9 | 0.8 | ||
| 45-64 | 1.9 | 1.4 | 0.8 | 1.4 | 1.1 | 0.8 | ||
| 65-74 | 2.3 | 1.5 | 0.8 | 1.6 | 1.2 | 0.8 | ||
| 75-84 | 2.3 | 1.5 | 0.8 | 1.6 | 1.2 | 0.8 | ||
| 85-89 | 2.1 | 1.5 | 0.8 | 1.8 | 1.3 | 0.8 | ||
| 90-94 | 1.5 | 1.1 | 0.5 | 1.4 | 1.0 | 0.5 | ||
| 95+ | 0.5 | 0.4 | 0.2 | 0.5 | 0.4 | 0.2 | ||
|
||||||||
The resulting projected mortality rates in Table 24 indicate a continuous decrease in mortality rates over the long term. For example, the mortality rate at age 65 for males is expected to decrease from about 10 deaths per thousand people in 2019 to 7 deaths per thousand people by 2060. The gap in mortality rates between males and females at each age is also expected to decrease over the projection period.
| Males | Females | |||||
|---|---|---|---|---|---|---|
| Age | 2019 | 2030 | 2060 | 2019 | 2030 | 2060 |
| 0 | 4.56 | 4.09 | 3.21 | 4.13 | 3.79 | 2.98 |
| 10 | 0.08 | 0.06 | 0.05 | 0.08 | 0.07 | 0.06 |
| 20 | 0.56 | 0.44 | 0.34 | 0.27 | 0.25 | 0.19 |
| 30 | 0.86 | 0.77 | 0.60 | 0.41 | 0.38 | 0.30 |
| 40 | 1.18 | 1.02 | 0.80 | 0.73 | 0.64 | 0.50 |
| 50 | 2.79 | 2.42 | 1.90 | 1.89 | 1.71 | 1.34 |
| 60 | 6.51 | 5.40 | 4.22 | 4.28 | 3.68 | 2.89 |
| 65 | 10.34 | 8.59 | 6.72 | 6.81 | 5.86 | 4.60 |
| 70 | 16.77 | 14.05 | 11.00 | 11.19 | 9.77 | 7.67 |
| 75 | 27.47 | 23.02 | 18.03 | 18.78 | 16.47 | 12.92 |
| 80 | 45.68 | 38.23 | 29.94 | 32.13 | 27.97 | 21.94 |
| 85 | 77.33 | 64.83 | 50.77 | 56.24 | 48.30 | 37.87 |
| 90 | 134.88 | 115.70 | 95.67 | 102.53 | 88.97 | 73.61 |
| 100 | 341.45 | 323.69 | 297.49 | 298.22 | 281.83 | 258.99 |
Chart 4 show the historical and projected life expectancies at birth and age 65, since 1966, based on each given year's mortality rates (i.e. without future mortality improvements).
Chart 4 - Life Expectancies at Age 65 for Canada, without improvements after the year shownFootnote 1
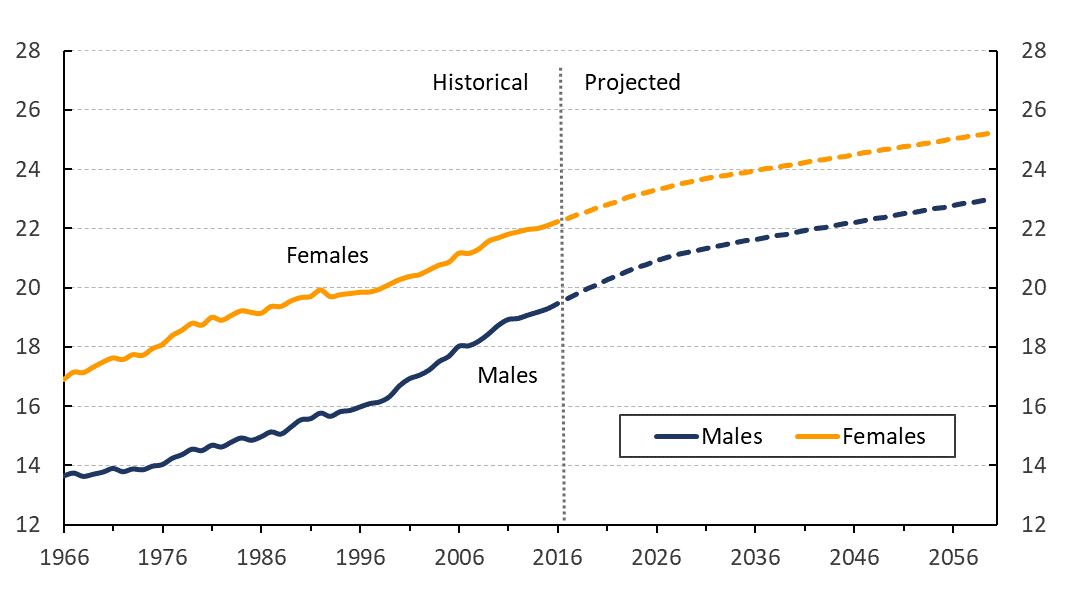
Chart 4 - Description
Line chart showing the historical and projected life expectancies at age 65 for Canada, without improvements after the year shown. Y axis represents the life expectancy in number of years. X axis represents the year.
Life expectancy at age 65 for males is 13.6 years in 1966, increases to 19.5 in 2016, and is projected to increase to 23 years in 2060.
Life expectancy at age 65 for females is 16.9 years in 1966, increases to 22.2 in 2016, and is projected to increase to 25.2 years in 2060.
- Chart 4 footnote 1
-
These are calendar year life expectancies based on the mortality rates of the given attained year.
Table 25 shows projected Canadian life expectancies at various ages for the specified calendar years, also based on each given year's mortality rates (without future improvements). Table 26 is similar to Table 25, the only difference being that it takes into account the assumed mortality improvements after the specified calendar years (with future improvements). Given the continuing trend in increased longevity, Table 26 is considered to be more realistic than Table 25, especially for the older ages. At the same time, the extended length of the projection period increases the uncertainty of the results presented in Table 26 for younger ages.
From 2019 to 2060, Canadian life expectancy at age 65 (with assumed future mortality improvements) is projected to grow from 21.4 to 23.9 years for males and from 23.9 to 26.1 years for females, as shown in Table 26 . The yearly increase in life expectancies at age 65 in the early years of the projection reflects the significant increase observed over the last decades. Thereafter, there is a projected slowdown in the increase in life expectancies consistent with the lower rate of improvement in mortality assumed for 2035 and thereafter.
| Males | Females | |||||||
|---|---|---|---|---|---|---|---|---|
| Age | 2019 | 2030 | 2060 | 2019 | 2030 | 2060 | ||
| 0 | 80.8 | 82.6 | 84.9 | 84.6 | 85.9 | 88.0 | ||
| 10 | 71.3 | 73.0 | 75.3 | 75.0 | 76.3 | 78.3 | ||
| 20 | 61.4 | 63.1 | 65.4 | 65.2 | 66.4 | 68.4 | ||
| 30 | 51.8 | 53.5 | 55.7 | 55.4 | 56.6 | 58.5 | ||
| 40 | 42.3 | 43.9 | 46.0 | 45.6 | 46.8 | 48.7 | ||
| 50 | 32.9 | 34.5 | 36.5 | 36.1 | 37.3 | 39.1 | ||
| 60 | 24.1 | 25.5 | 27.4 | 26.9 | 28.0 | 29.8 | ||
| 65 | 20.0 | 21.3 | 23.0 | 22.6 | 23.6 | 25.2 | ||
| 70 | 16.1 | 17.3 | 18.9 | 18.4 | 19.4 | 20.9 | ||
| 75 | 12.6 | 13.6 | 15.0 | 14.6 | 15.4 | 16.8 | ||
| 80 | 9.4 | 10.3 | 11.5 | 11.1 | 11.8 | 13.0 | ||
| 85 | 6.8 | 7.4 | 8.3 | 8.0 | 8.6 | 9.5 | ||
| 90 | 4.6 | 5.0 | 5.6 | 5.5 | 5.9 | 6.5 | ||
| 100 | 2.2 | 2.3 | 2.4 | 2.5 | 2.6 | 2.7 | ||
|
||||||||
| Males | Females | |||||||
|---|---|---|---|---|---|---|---|---|
| Age | 2019 | 2030 | 2060 | 2019 | 2030 | 2060 | ||
| 0 | 86.9 | 87.7 | 89.8 | 89.9 | 90.6 | 92.4 | ||
| 10 | 76.7 | 77.5 | 79.5 | 79.8 | 80.4 | 82.2 | ||
| 20 | 66.1 | 66.9 | 68.9 | 69.2 | 69.9 | 71.7 | ||
| 30 | 55.7 | 56.5 | 58.6 | 58.8 | 59.5 | 61.3 | ||
| 40 | 45.5 | 46.3 | 48.3 | 48.4 | 49.1 | 50.9 | ||
| 50 | 35.4 | 36.2 | 38.2 | 38.3 | 39.0 | 40.7 | ||
| 60 | 25.9 | 26.7 | 28.5 | 28.5 | 29.2 | 30.9 | ||
| 65 | 21.4 | 22.1 | 23.9 | 23.9 | 24.5 | 26.1 | ||
| 70 | 17.2 | 17.9 | 19.5 | 19.4 | 20.0 | 21.5 | ||
| 75 | 13.4 | 14.0 | 15.4 | 15.3 | 15.9 | 17.2 | ||
| 80 | 10.0 | 10.6 | 11.7 | 11.6 | 12.1 | 13.3 | ||
| 85 | 7.1 | 7.6 | 8.5 | 8.3 | 8.8 | 9.7 | ||
| 90 | 4.7 | 5.1 | 5.7 | 5.6 | 6.0 | 6.6 | ||
| 100 | 2.2 | 2.3 | 2.5 | 2.5 | 2.6 | 2.8 | ||
|
||||||||
D.3.4 Net Migration
The net migration rate refers to the net effect of the number of immigrants less the number of emigrants, plus the number of returning Canadians and the net increase in the number of non-permanent residents.
Immigration and emigration are generally recognized as being volatile parameters of future population growth since they are subject to a variety of demographic, economic, social, and political factors. During the period from 1972 to 2018, annual immigration to Canada varied between 84,000 and 320,000, annual emigration from Canada fluctuated between 40,000 and 97,000, and the annual number of returning Canadians fluctuated between 14,000 and 41,000.
Over the same period, the annual net increase in the number of non-permanent residents fluctuated between -71,000 and 166,000. Since 2014, the federal government has introduced several modifications to the Temporary Foreign Workers Program making it more difficult for employers to hire temporary foreign workers. The federal government also improved its monitoring of the Temporary Foreign Workers Program in 2018. It is expected that these changes will moderate the increase in the number of non-permanent residents.
However, in the most recent years, the largest group of non-permanent residents has been international students, accounting for almost half of non-permanent residents. It is expected that the number of foreign students will stabilize over the next three years. Given the government's policies and the expected stabilization of the number of foreign students, the annual net increase in the number of non-permanent residents is projected to fall gradually to reach zero in 2021 and to remain at that level thereafter.
The actual 2018 net migration rate of 1.11% is assumed to decrease to 0.86% in 2019, 0.73% in 2020, and 0.62% in 2021, and to remain at that level thereafter. The ultimate net migration rate of 0.62% corresponds to the average rate experienced over the ten-year period 2009-2018, excluding the net increase in non-permanent residents during that period. The assumed short-term net migration rate is higher than the ultimate rate of 0.62%, due to starting from a higher rate in 2018, the federal government's short-term targets, and the assumed gradual decrease to zero for the net increase in the number of non-permanent residents from 2019 through 2021.
Chart 5 shows the net migration experience since 1972 and the projected rates. The distributions of immigrants, emigrants, and returning Canadians by age and sex used for the demographic projections were derived from Statistics Canada data averaged over the period 2009 to 2018.
Chart 5 - Net Migration Rate (Canada)
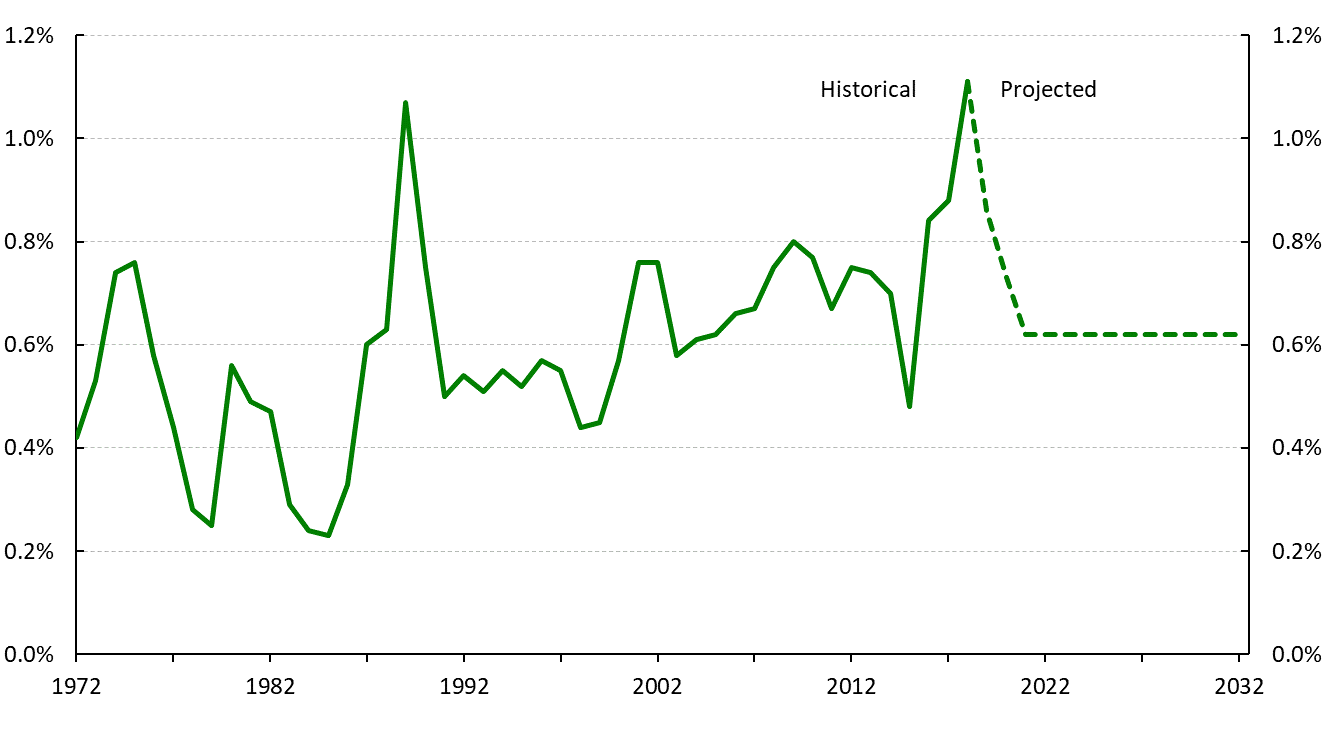
Chart 5 - Description
Line chart showing the historical and projected net migration rate for Canada, including non-permanent residents. Y axis represents the net migration rate as a percentage of the population. X axis represents the year.
The net migration rate for Canada is 0.4% in 1972, and then is shown to fluctuate over time but increase overall, reaching its highest point of 1.1% in 2018. The net migration rate is then projected to decrease between the years 2019 to 2021 to reach a value of 0.62% and to remain at that value thereafter.
D.3.5 Projected Population and its Characteristics
The historical and projected evolution of the Canada population age distribution since 1966 is shown in Chart 6. One can easily observe that the triangular shape of the 1960s has become more rectangular over time. This is projected to continue and indicates an aging population. The effects of the baby boom, baby bust, and echo generations can be seen. The chart also reveals that the number of people aged 85 and over is expected to increase dramatically over the coming decades.
Chart 6 - Age Distribution of the Canadian Population (thousands)
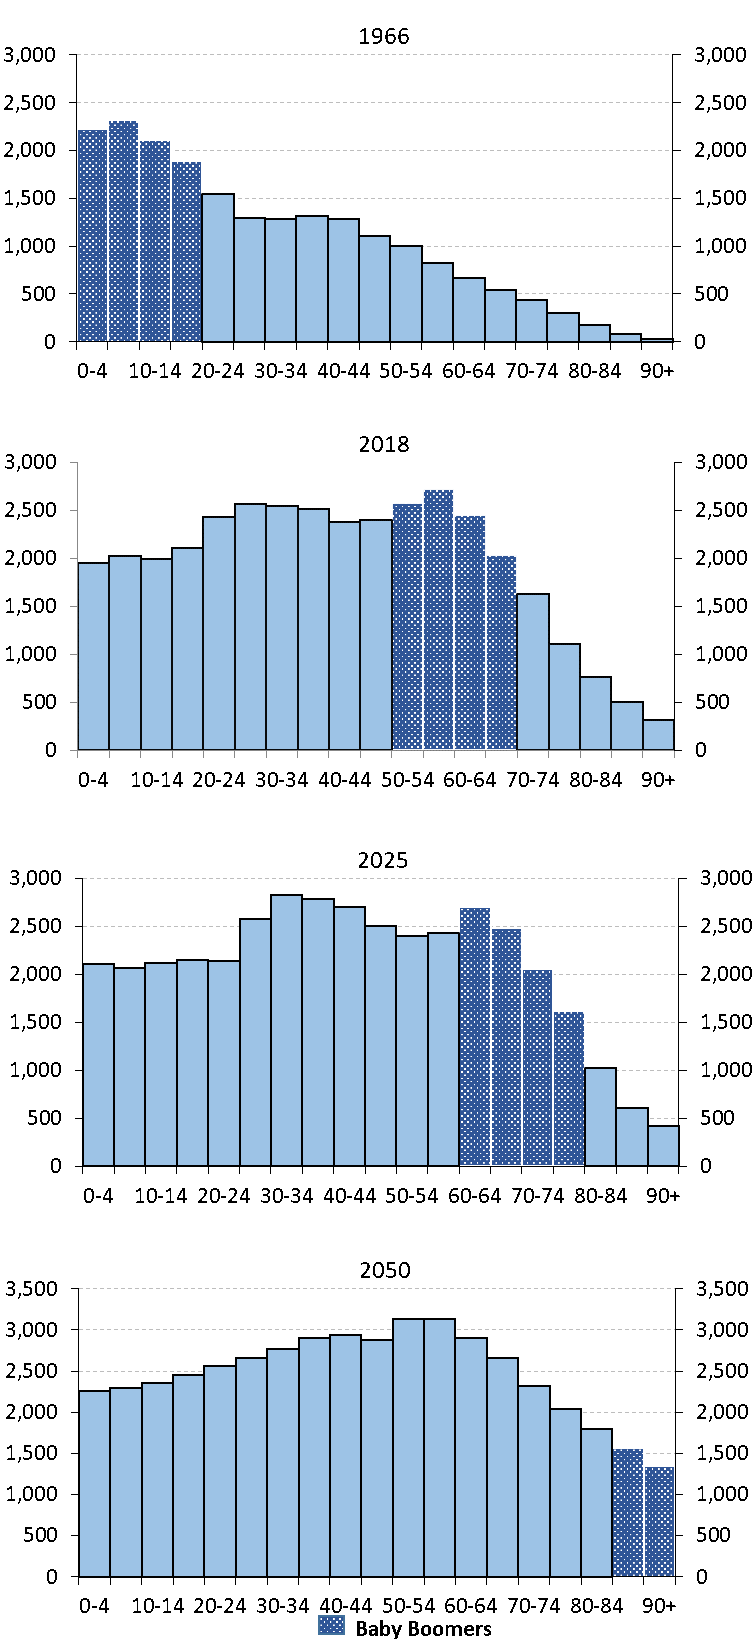
Chart 6 - Description
Succession of four bar charts showing the evolution of the age distribution of the population of Canada. Y axis represents the number of individuals in thousands. X axis represents quinquennial age groups.
The first bar chart represents the age distribution of the population in 1966. For age groups below age 20, the baby-boom generation, the population of each group is between 1.8 and 2.4 million, with the age group 5 to 9 years being the largest. For age groups above age 19, the population gradually decreases from about 1.6 million to almost zero for the age group 90 and older.
The second bar chart represents the age distribution of the population in 2018. For age groups 50 to 54 up to 65 to 69, the baby boomers, the population of each group is between 2.0 and 2.8 million, with the age group 55 to 59 being the largest. For ages below 50, the effects of the baby bust and echo generation are seen. The population increases from 2 to 2.6 million for groups 0 to 4 up to 25 to 29, remains at 2.6 million for group 30 to 34, and then decreases somewhat before rising again for the baby boomers. For age groups above 69 (older than the baby boomers), the population gradually decreases from 1.6 million to about 317,000 for the age group 90 and older.
The third bar chart represents the age distribution of the population in 2025. For age groups 60 to 79, the baby boomers, the population decreases from 2.7 to 1.6 million. For age groups below age 60, the effects of the baby bust and echo generation are seen. The population increases from about 2.1 to 2.8 million for groups 0 to 4 up to 30 to 34 and then decreases to 2.4 million before rising again for the baby boomers. For age groups above age 79 (older than the boomers), the population gradually decreases from about 1 million to 424,000 for the age group 90 and older.
Lastly, the fourth bar chart represents the age distribution of the population in 2050. For age groups 85 and over, the baby boomers, the population decreases from 1.6 and 1.3 million. The population increases from 2.3 to 3.1 million for age groups 0 to 4 up to 50 to 54, and then decreases to 1.8 million for the age group 80 to 84.
The population of Canada as at 1 July 2018 is 37.1 million. Table 27 presents the projected population of Canada as at 1 July for selected age groups and years. The number of people reaching age 65 is a good indicator of the number of new OAS basic pension beneficiaries coming into pay each year. This population is expected to increase from 475,000 in 2020 to 523,000 by 2030. Chart 7 shows the evolution of the total population of Canada and of the age groups below 20, 20 to 64, and 65 and older from 1970 to 2060.
Table 28 shows the variations in the relative proportions of various age groups for Canada throughout the projection period. The proportion of people aged 65 and over is expected to increase significantly from 17.6% of the total population in 2019 to 26.3% by 2060. The number of people aged 65 and older as a proportion of the number of people aged 20 to 64 increases by 70% over the same period, from 29.0% in 2019 to 48.9% by 2060. This proportion significantly affects the ratio of OAS program benefit expenditures to GDP.
| Year | 0-17 | 18-69 | 70+ | 0-19 | 20-64 | 65+ | Total | Reaching Age 65 |
|---|---|---|---|---|---|---|---|---|
| 2019 | 7,235 | 25,757 | 4,507 | 8,115 | 22,780 | 6,604 | 37,499 | 457 |
| 2020 | 7,292 | 25,912 | 4,694 | 8,144 | 22,892 | 6,862 | 37,899 | 475 |
| 2021 | 7,346 | 26,028 | 4,885 | 8,175 | 22,961 | 7,122 | 38,259 | 482 |
| 2022 | 7,405 | 26,138 | 5,079 | 8,226 | 23,005 | 7,390 | 38,621 | 496 |
| 2023 | 7,471 | 26,232 | 5,283 | 8,292 | 23,031 | 7,663 | 38,986 | 507 |
| 2024 | 7,536 | 26,315 | 5,500 | 8,361 | 23,054 | 7,937 | 39,351 | 513 |
| 2025 | 7,594 | 26,395 | 5,728 | 8,437 | 23,065 | 8,215 | 39,717 | 525 |
| 2030 | 7,838 | 26,762 | 6,901 | 8,726 | 23,248 | 9,528 | 41,502 | 523 |
| 2035 | 8,061 | 27,063 | 7,984 | 8,957 | 23,828 | 10,323 | 43,108 | 475 |
| 2040 | 8,212 | 27,764 | 8,536 | 9,157 | 24,520 | 10,836 | 44,512 | 471 |
| 2045 | 8,274 | 28,667 | 8,828 | 9,265 | 25,258 | 11,245 | 45,769 | 511 |
| 2050 | 8,362 | 29,517 | 9,069 | 9,357 | 25,864 | 11,727 | 46,948 | 554 |
| 2055 | 8,544 | 30,140 | 9,440 | 9,534 | 26,308 | 12,282 | 48,124 | 604 |
| 2060 | 8,785 | 30,632 | 9,946 | 9,790 | 26,585 | 12,988 | 49,362 | 623 |
Chart 7 - Population of Canada (millions)
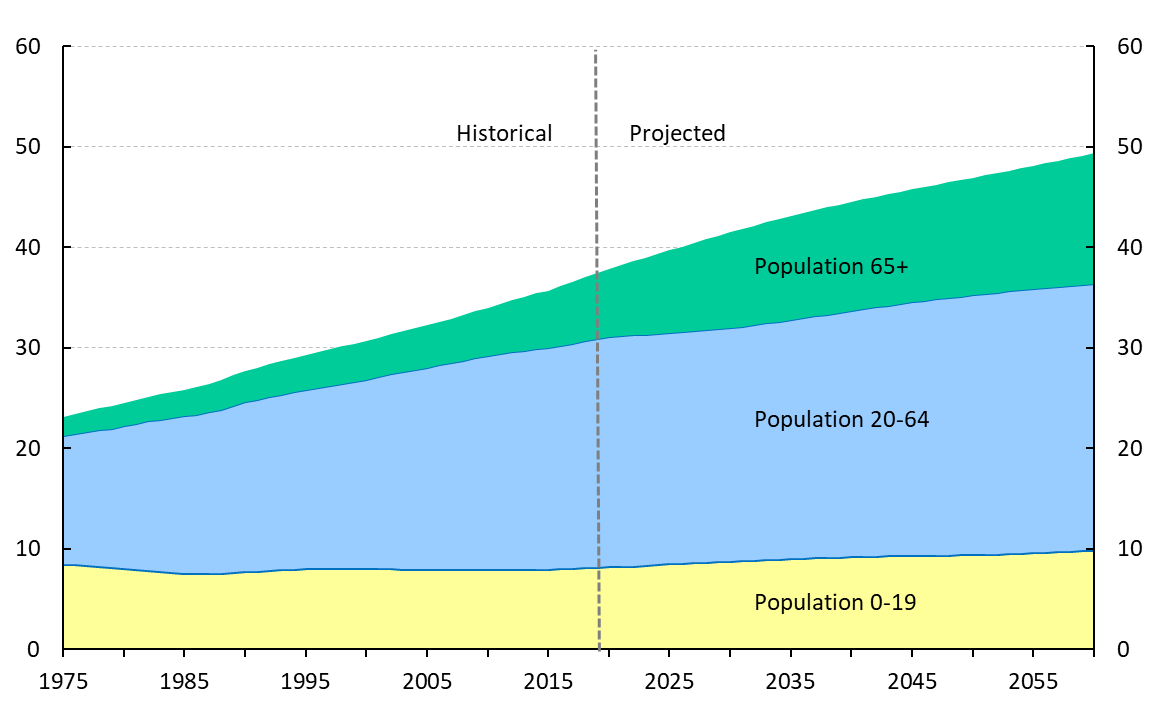
Chart 7 - Description
Stacked area chart showing the historical and projected population of Canada by age group. Y axis represents the number of individuals in millions. X axis represents the year.
The population aged 0 to 19 years is 8.4 million in 1975, reaches 8.1 in 2018, and is projected to increase to 9.8 million in 2060. The population aged 0 to 19 represents 36% of the total population in 1975, 22% in 2018, and 20% in 2060.
The population aged 20 to 64 is 12.8 million in 1975, reaches 22.6 in 2018, and is projected to increase to 26.6 million in 2060. The population aged 20 to 64 represents 55% of the total population in 1975, 61% in 2018, and 54% in 2060.
The population aged 65 and over is 2 million in 1975, reaches 6.4 in 2018, and is projected to increase to 13 million in 2060. The population aged 65 and over represents 8% of the total population in 1975, 17% in 2018, and 26% in 2060.
| Year | % of Total Population Table 28 - Footnote 1 | % of Total Population | Age 65+ As % of Age 20-64 |
|||||
|---|---|---|---|---|---|---|---|---|
| 0-17 | 18-69 | 70+ | 0-19 | 20-64 | 65+ | |||
| 2019 | 19.3 | 68.7 | 12.0 | 21.6 | 60.7 | 17.6 | 29.0 | |
| 2020 | 19.2 | 68.4 | 12.4 | 21.5 | 60.4 | 18.1 | 30.0 | |
| 2021 | 19.2 | 68.0 | 12.8 | 21.4 | 60.0 | 18.6 | 31.0 | |
| 2022 | 19.2 | 67.7 | 13.1 | 21.3 | 59.6 | 19.1 | 32.1 | |
| 2023 | 19.2 | 67.3 | 13.5 | 21.3 | 59.1 | 19.7 | 33.3 | |
| 2024 | 19.2 | 66.9 | 14.0 | 21.2 | 58.6 | 20.2 | 34.4 | |
| 2025 | 19.1 | 66.5 | 14.4 | 21.2 | 58.1 | 20.7 | 35.6 | |
| 2030 | 18.9 | 64.5 | 16.6 | 21.0 | 56.0 | 23.0 | 41.0 | |
| 2035 | 18.7 | 62.8 | 18.5 | 20.8 | 55.3 | 23.9 | 43.3 | |
| 2040 | 18.4 | 62.4 | 19.2 | 20.6 | 55.1 | 24.3 | 44.2 | |
| 2045 | 18.1 | 62.6 | 19.3 | 20.2 | 55.2 | 24.6 | 44.5 | |
| 2050 | 17.8 | 62.9 | 19.3 | 19.9 | 55.1 | 25.0 | 45.3 | |
| 2055 | 17.8 | 62.6 | 19.6 | 19.8 | 54.7 | 25.5 | 46.7 | |
| 2060 | 17.8 | 62.1 | 20.1 | 19.8 | 53.9 | 26.3 | 48.9 | |
|
||||||||
Table 29 shows the components of population growth, which is defined as the projected number of births plus net migrants less the projected number of deaths from 2019 to 2060, and Chart 8 presents these figures graphically. The number of births is projected to exceed deaths until 2041. Thereafter, all population growth is projected to come from migration.
Over the period 2019 to 2025, the population of Canada is projected to grow at about 1% per year. The annual growth slows to about 0.7% between the late 2030s and early 2040s and to 0.6% thereafter. The population of Canada is expected to reach 49 million by 2060.
| Year | Population 1st July |
Births | Net Migrants |
Deaths | Change in Population |
Annual Percentage Change (%) | ||
|---|---|---|---|---|---|---|---|---|
| 20-64 | 65+ | Total | ||||||
| 2019 | 37,499 | 389 | 323 | 272 | 440 | 0.70 | 3.86 | 1.19 |
| 2020 | 37,899 | 399 | 278 | 277 | 400 | 0.49 | 3.91 | 1.07 |
| 2021 | 38,259 | 404 | 237 | 281 | 360 | 0.30 | 3.78 | 0.95 |
| 2022 | 38,621 | 409 | 240 | 286 | 363 | 0.19 | 3.76 | 0.95 |
| 2023 | 38,986 | 414 | 242 | 291 | 364 | 0.11 | 3.70 | 0.94 |
| 2024 | 39,351 | 419 | 244 | 297 | 366 | 0.10 | 3.57 | 0.94 |
| 2025 | 39,717 | 423 | 246 | 303 | 366 | 0.05 | 3.50 | 0.93 |
| 2030 | 41,502 | 429 | 258 | 340 | 346 | 0.27 | 2.54 | 0.84 |
| 2035 | 43,108 | 423 | 268 | 386 | 304 | 0.51 | 1.39 | 0.71 |
| 2040 | 44,512 | 425 | 277 | 434 | 267 | 0.60 | 0.83 | 0.60 |
| 2045 | 45,769 | 434 | 284 | 476 | 243 | 0.55 | 0.79 | 0.53 |
| 2050 | 46,948 | 447 | 292 | 506 | 233 | 0.42 | 0.88 | 0.50 |
| 2055 | 48,124 | 462 | 299 | 522 | 238 | 0.23 | 1.11 | 0.50 |
| 2060 | 49,362 | 475 | 307 | 527 | 255 | 0.20 | 1.16 | 0.52 |
Chart 8 - Projected Components of Population Growth for Canada (thousands)
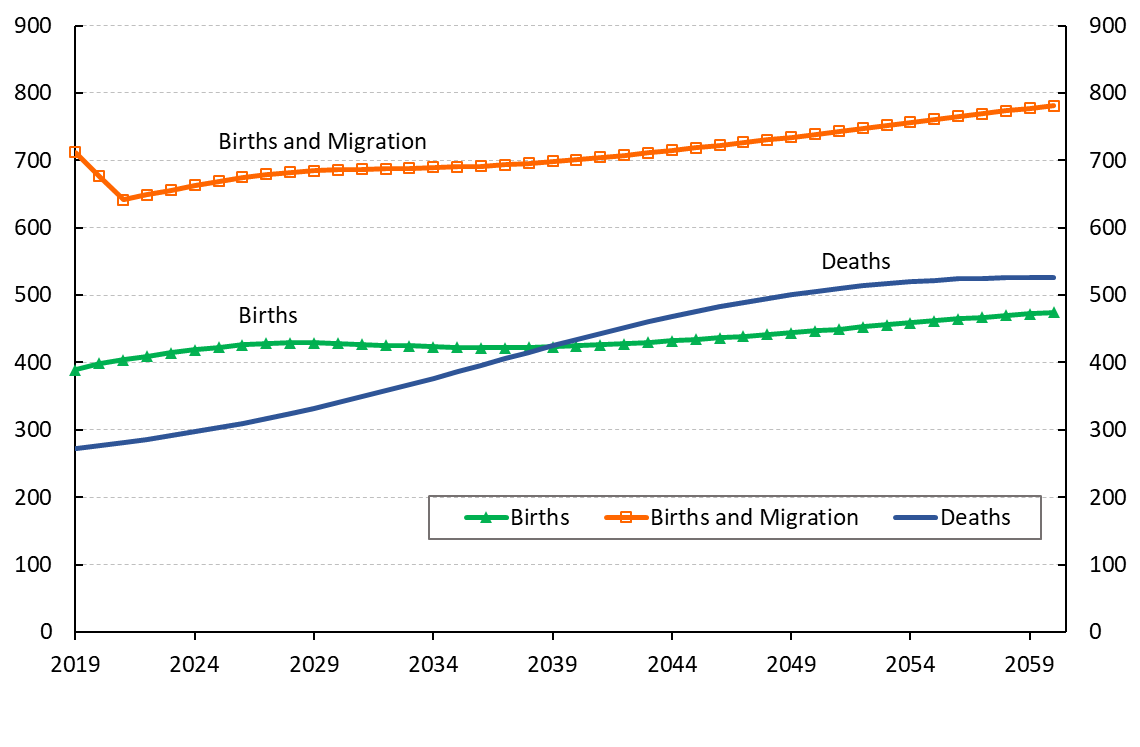
Chart 8 - Description
Line chart showing the projected components of population growth for Canada. Y axis represents the number of individuals in thousands. X axis represents the year.
Births are projected to start at approximately 389,000 in 2019 and to increase to 475,000 in 2060.
Deaths are projected to start at approximately 272,000 in 2019, to increase to a value (425,000) higher than births (424,000) in 2039, and to continue increasing to 527,000 in 2060.
Births and Migration are projected to start at approximately 712,000 in 2019, to decrease somewhat until 2021 and then increase thereafter to reach 781,000 in 2060.
D.4 Economic Projections
The list of assumptions required to project the various economic indices, benefit expenditures, and cost measurement bases is quite extensive. The following subsections cover the more important assumptions.
The economic outlook rests on the assumed evolution of the labour market, that is, labour force participation, employment, unemployment, inflation, and the increase in average employment earnings, as well as the increase in GDP. All of these factors must be considered together and form part of an overall economic perspective.
The projected expenditures presented in this report are also expressed as cost ratios relative to two different measurement bases, namely total employment earnings and the GDP. For this purpose, average employment earnings and the proportion of persons with earnings are required. Assumptions from the 30th CPP Actuarial Report were used, with adjustments to account for the impacts of COVID-19 where appropriate.
For calculation purposes, the labour force assumptions (proportion of earners and average employment earnings) of Canada less Québec are applied to the total Canadian population to obtain estimates of total Canada employment earnings. These are then adjusted to reflect the historical difference with published Statistics Canada data on total Canada employment earnings. The GDP is then simply projected using the historical relationship between total employment earnings and GDP, with further short-term adjustments to reflect the impacts of COVID-19.
D.4.1 Economic Perspective
The future expenditures of the OAS program and cost measurement bases depend on many demographic and economic factors. It is important to define the individual economic assumptions in the context of a long-term overall economic perspective.
For this report, it is assumed that, despite an uncertain economic outlook in the short to medium term due to COVID-19 for major economies, a moderate and sustainable growth in the Canadian economy will persist throughout the projection period.
The actuarial examination of the OAS program involves the projection of its expenditures as well as cost measurement bases over a long period of time. Although best judgment is used regarding future economic trends, it is nonetheless difficult to anticipate all economic changes that may occur during the projection period. There will always be some degree of uncertainty. The projected aging of the population combined with the continued retirement of the baby boom generation over the next few decades will certainly create significant social and economic changes. It is possible that the evolution of the working-age population, especially the active population, will be quite different from what has been historically observed and what has been assumed for the purpose of this report.
D.4.2 Labour Market
Chart 9 shows the main components of the labour market that are used to determine the number of earners to calculate the total employment earnings shown in Table 12.
Chart 9 - Components of the Labour Market
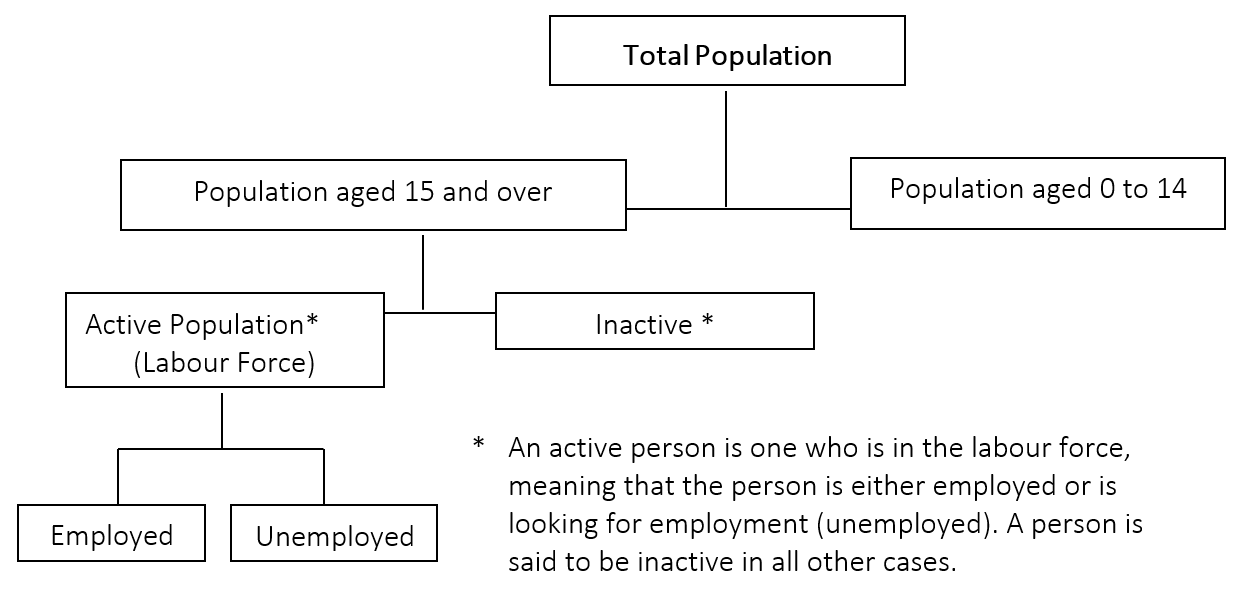
Chart 9 - Description
Flow chart showing the main components of the labour market that are used to determine the number of earners and contributors by age, sex, and calendar year.
The top box is the total population. This box splits into two boxes, the first one is the population aged 15 and over and the second box is the population 0 to 14.
The box of the population aged 15 and over is then split into two boxes, the first box is the active population or labour force, which represents those who are either employed or looking for employment. The second box is the inactive population.
The active population box is split into two boxes. The first box is for the employed and the second box is for the unemployed.
The number of earners is defined as the number of persons who had earnings during a given calendar year. The proportion of earners assumption relies on the projected active population given in this report.
D.4.2.1 Active Population
The overall labour force participation rates in Canada (the active population expressed as a proportion of the population aged 15 and over) from 1976 to 2018 clearly show a narrowing of the gap between male and female rates. Although the increase in participation rates of females aged 18 to 69 has slowed down since the mid-2000s, the increase was significant over the previous decades. Furthermore, participation rates for those aged 55 and older have increased significantly over the last decade for both men and women.
In 1976, overall male participation (ages 15 and over) was about 78% compared to only 46% for females, which represents a gap of 32%. This gap has narrowed to 8.3% in 2018 (participation rates of 69.6% for males, 61.3% for females). It is assumed that females will continue to narrow the gap in participation rates but at a slower pace, with the gap gradually reducing to about 8.1% by 2035 (67.1% for males vs. 59.0% for females). In addition, over the next two decades, it is assumed that the participation of males and females aged 55 to 69 will continue to increase.
Table 30, Table 31 and Table 32 provide projections of the active and employed populations and associated participation, employment, and unemployment rates for Canada.
| Population Table 30 - Footnote 1 | Active Population | Employed | |||||||
|---|---|---|---|---|---|---|---|---|---|
| Year | Males | Females | Both Sexes |
Males | Females | Both Sexes |
Males | Females | Both Sexes |
| 2019 | 15,155 | 15,568 | 30,723 | 10,533 | 9,505 | 20,038 | 9,862 | 8,994 | 18,856 |
| 2020 | 15,318 | 15,736 | 31,054 | 10,630 | 9,575 | 20,205 | 9,426 | 8,657 | 18,084 |
| 2021 | 15,464 | 15,890 | 31,354 | 10,712 | 9,635 | 20,347 | 9,789 | 8,930 | 18,720 |
| 2022 | 15,615 | 16,048 | 31,663 | 10,795 | 9,696 | 20,491 | 9,981 | 9,075 | 19,056 |
| 2023 | 15,769 | 16,211 | 31,980 | 10,875 | 9,757 | 20,632 | 10,115 | 9,176 | 19,291 |
| 2024 | 15,924 | 16,373 | 32,297 | 10,954 | 9,818 | 20,772 | 10,246 | 9,276 | 19,522 |
| 2025 | 16,077 | 16,534 | 32,611 | 11,031 | 9,877 | 20,907 | 10,314 | 9,328 | 19,642 |
| 2030 | 16,799 | 17,298 | 34,097 | 11,339 | 10,215 | 21,554 | 10,586 | 9,632 | 20,218 |
| 2035 | 17,450 | 17,994 | 35,444 | 11,706 | 10,615 | 22,321 | 10,928 | 10,009 | 20,937 |
| 2040 | 18,077 | 18,664 | 36,741 | 12,052 | 10,919 | 22,970 | 11,250 | 10,296 | 21,546 |
| 2045 | 18,653 | 19,287 | 37,940 | 12,393 | 11,221 | 23,614 | 11,567 | 10,582 | 22,149 |
| 2050 | 19,163 | 19,831 | 38,994 | 12,676 | 11,478 | 24,153 | 11,831 | 10,825 | 22,656 |
| 2055 | 19,642 | 20,323 | 39,965 | 12,894 | 11,686 | 24,580 | 12,035 | 11,021 | 23,056 |
| 2060 | 20,140 | 20,821 | 40,960 | 13,093 | 11,883 | 24,976 | 12,221 | 11,206 | 23,427 |
|
|||||||||
| Year | Labour Force Participation Rate |
Employment Rate | Unemployment Rate | ||||||
|---|---|---|---|---|---|---|---|---|---|
| Males | Females | Both Sexes |
Males | Females | Both Sexes |
Males | Females | Both Sexes |
|
| 2019 | 69.5 | 61.1 | 65.2 | 65.1 | 57.8 | 61.4 | 6.4 | 5.4 | 5.9 |
| 2020 | 69.4 | 60.8 | 65.1 | 61.5 | 55.0 | 58.2 | 11.3 | 9.6 | 10.5 |
| 2021 | 69.3 | 60.6 | 64.9 | 63.3 | 56.2 | 59.7 | 8.6 | 7.3 | 8.0 |
| 2022 | 69.1 | 60.4 | 64.7 | 63.9 | 56.5 | 60.2 | 7.5 | 6.4 | 7.0 |
| 2023 | 69.0 | 60.2 | 64.5 | 64.1 | 56.6 | 60.3 | 7.0 | 6.0 | 6.5 |
| 2024 | 68.8 | 60.0 | 64.3 | 64.3 | 56.7 | 60.4 | 6.5 | 5.5 | 6.0 |
| 2025 | 68.6 | 59.7 | 64.1 | 64.2 | 56.4 | 60.2 | 6.5 | 5.6 | 6.1 |
| 2030 | 67.5 | 59.1 | 63.2 | 63.0 | 55.7 | 59.3 | 6.6 | 5.7 | 6.2 |
| 2035 | 67.1 | 59.0 | 63.0 | 62.6 | 55.6 | 59.1 | 6.6 | 5.7 | 6.2 |
| 2040 | 66.7 | 58.5 | 62.5 | 62.2 | 55.2 | 58.6 | 6.7 | 5.7 | 6.2 |
| 2045 | 66.4 | 58.2 | 62.2 | 62.0 | 54.9 | 58.4 | 6.7 | 5.7 | 6.2 |
| 2050 | 66.1 | 57.9 | 61.9 | 61.7 | 54.6 | 58.1 | 6.7 | 5.7 | 6.2 |
| 2055 | 65.6 | 57.5 | 61.5 | 61.3 | 54.2 | 57.7 | 6.7 | 5.7 | 6.2 |
| 2060 | 65.0 | 57.1 | 61.0 | 60.7 | 53.8 | 57.2 | 6.7 | 5.7 | 6.2 |
| Age Group | Males | Females | ||||||
|---|---|---|---|---|---|---|---|---|
| 2019 | 2025 | 2035 | 2050 | 2019 | 2025 | 2035 | 2050 | |
| 15-19 | 48.8 | 50.0 | 52.0 | 52.0 | 50.9 | 52.0 | 54.0 | 54.0 |
| 20-24 | 76.1 | 79.0 | 80.0 | 80.0 | 74.2 | 76.0 | 78.0 | 78.0 |
| 25-29 | 89.3 | 91.0 | 92.0 | 92.0 | 83.7 | 84.0 | 87.0 | 87.0 |
| 30-34 | 92.4 | 93.0 | 94.0 | 94.0 | 81.7 | 83.0 | 85.0 | 85.0 |
| 35-39 | 92.7 | 94.0 | 94.0 | 94.0 | 82.6 | 84.0 | 86.0 | 86.0 |
| 40-44 | 92.9 | 93.0 | 94.0 | 94.0 | 84.8 | 86.0 | 87.0 | 87.0 |
| 45-49 | 90.9 | 93.0 | 93.0 | 93.0 | 85.1 | 86.0 | 87.0 | 87.0 |
| 50-54 | 88.2 | 90.0 | 91.0 | 91.0 | 82.4 | 83.0 | 85.0 | 85.0 |
| 55-59 | 80.0 | 82.0 | 84.0 | 84.0 | 71.7 | 73.0 | 76.0 | 76.0 |
| 60-64 | 62.5 | 63.0 | 65.0 | 65.0 | 50.9 | 52.0 | 54.0 | 54.0 |
| 65-69 | 31.9 | 34.0 | 35.0 | 35.0 | 21.8 | 22.0 | 24.0 | 24.0 |
| 70 and Over | 11.2 | 12.0 | 13.0 | 13.0 | 5.5 | 6.0 | 6.5 | 6.5 |
| 55-69 | 60.4 | 59.6 | 61.8 | 62.9 | 50.1 | 48.7 | 51.8 | 52.4 |
| 55 and Over | 43.0 | 40.3 | 37.0 | 38.7 | 32.7 | 30.1 | 27.8 | 28.6 |
| 18-69 | 79.8 | 81.0 | 82.8 | 82.0 | 72.1 | 72.7 | 75.6 | 74.9 |
| 15 and Over | 69.5 | 68.6 | 67.1 | 66.1 | 61.1 | 59.7 | 59.0 | 57.9 |
Given that participation rates start to decline mostly after age 50, the aging of the population will exert downward pressure on the overall labour force participation rate in Canada. If current participation rates by age and sex were to apply throughout the projection period, the effect of population aging alone would cause the overall participation rate from Table 31 to fall from 65.2% in 2019 to 59.3% in 2050, instead of 61.9% as projected under the best-estimate assumptions. However, it is expected that a number of factors will contribute toward partially offsetting the decline that results from population aging.
The main assumption underlying the future overall participation rate is a significant increase in participation rates for age groups 55 and over as a result of an expected continued trend toward longer working lives. The participation rates for those aged 55 to 59 are assumed to increase from 80.0% to 84.0% for males and from 71.7% to 76.0% for females over the period 2018 to 2050. Over the same period, the participation rates for those aged 60 to 64 are assumed to increase from 62.5% to 65.0% and from 50.9% to 54.0% for males and females, respectively, and the participation rates for those aged 65 to 69 are assumed to increase from 31.9% to 35.0% and from 21.8% to 24.0% for males and females, respectively.
Chart 10 shows the historical and projected participation rates for the three age groups 55 to 59, 60 to 64, and 65 to 69. Government policies aimed at increasing participation rates of older workers, the removal of the work cessation test to receive the CPP retirement pension prior to age 65, the increase in life expectancy, and possible insufficient retirement savings are assumed to encourage older workers to delay their retirement and exit the labour force at a later age.
Chart 10 - Labour Force Participation Rates (Canada)
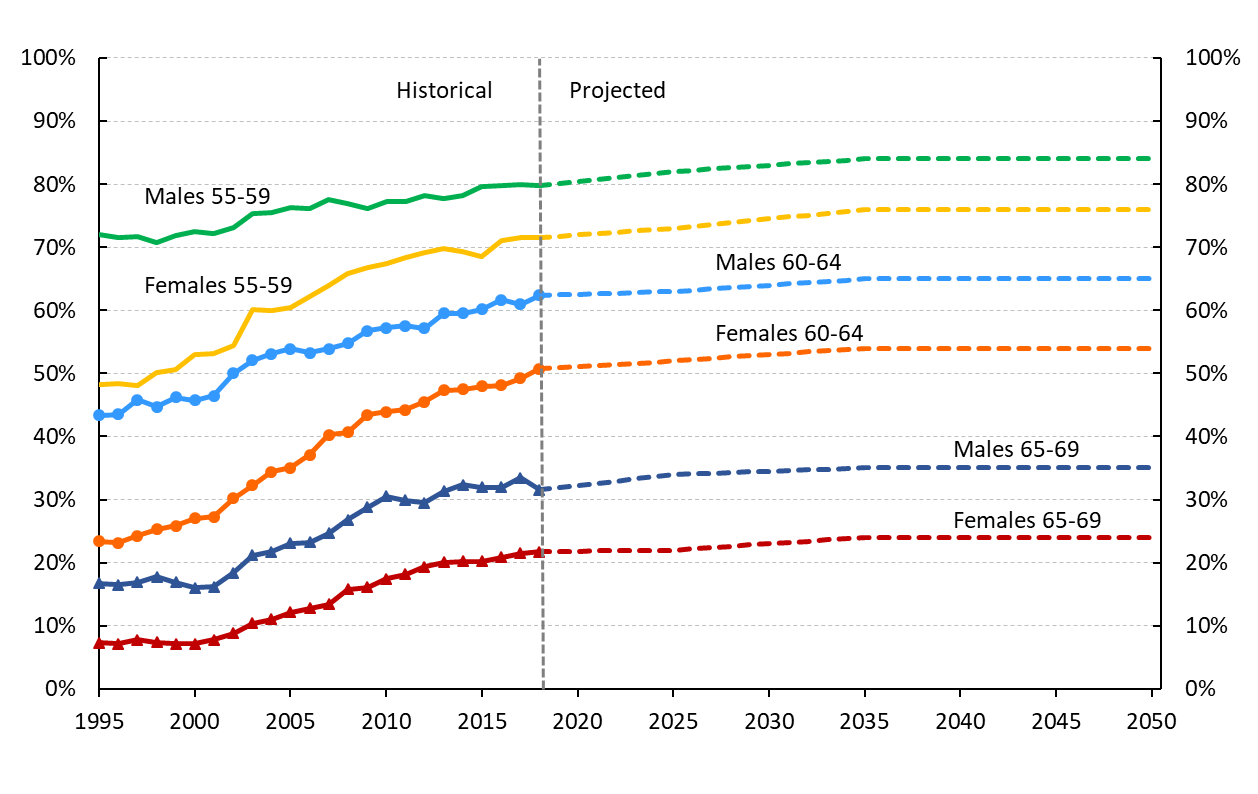
Chart 10 - Description
Line chart showing the historical and projected labour force participation rates for Canada for specific age groups. Y axis represents the labour force participation rate. X axis represents the year.
The labour force participation rate of males aged 55 to 59 is 72.1% in 1995, increases to 79.7% in 2018, and is projected to increase to 84% in 2050.
The participation rate of females aged 55 to 59 is 48.3% in 1995, increases to 71.5% in 2018, and is projected to increase to 76% in 2050.
The participation rate of males aged 60 to 64 is 43.4% in 1995, increases to 62.4% in 2018, and is projected to increase to 65% in 2050.
The participation rate of females aged 60 to 64 is 23.4% in 1995, increases to 50.7% in 2018, and is projected to increase to 54% in 2050.
The participation rate of males aged 65 to 69 is 16.7% in 1995, increases to 31.5% in 2018, and is projected to increase to 35% in 2050.
The participation rate of females aged 65 to 69 is 7.3% in 1995, increases to 21.7% in 2018, and is projected to increase to 24% in 2050.
However, despite the assumed future increase in participation rates of older workers and a reliance on skilled immigrant workers, it is still expected that there will be moderate labour shortages in the future as the working-age population expands at a slower pace and as baby boomers continue to retire and exit the labour force. The participation rates for all age groups are expected to increase due to the attractive employment opportunities resulting from labour shortages.
It is also expected that future participation rates will increase with the aging of current young cohorts that have a stronger labour force attachment compared to previous cohorts. The stronger labour force attachment of later cohorts is attributable to different reasons, including higher attained education. The aging of more educated workers with higher labour force attachment, and the exit from the workforce of less educated older workers is expected to create upward pressure on participation rates. Over the shorter term, the participation rates of younger age groups are assumed to gradually increase to their pre-recession levels. Finally, although historical increases in participation rates for women are not expected to continue in the future, their participation rates are expected to increase faster than the participation rates for men.
Based on the foregoing, the participation rates of both men and women are expected to increase over the projection period from their 2018 levels for all age groups, especially for those aged 55 and over. Nonetheless, these increases in participation rates are not sufficient to offset the decrease in the overall participation rate (ages 15 and over) due to the demographic shift.
For the purpose of projecting the participation rates, the projection period has been divided into three periods: 2019 to 2025, 2025 to 2035, and from 2035 onward. From 2019 to 2025, and from 2025 to 2035, the projected participation rates are based on the expected impact of the abovementioned factors through time for each age group and sex. From 2035 onward, the participation rates are held constant. This long-term assumption combined with a slow growth in the working-age population, results in a low rate of growth of approximately 0.5% for the Canadian active population (that is, the labour force) after 2035.
D.4.2.2 Employment
In Canada, the annual job creation rate (i.e. the change in the number of persons employed) has been on average about 1.6% since 1976. However, this rate has varied over the years. It is assumed that the job creation rate will be 1.1% in 2019 corresponding to the unemployment rate of 5.9%, based on the most recent experience and various economic forecasts. As a result of the COVID-19 pandemic, the unemployment rate is expected to increase significantly in 2020, and to revert to its pre-pandemic projected levels by 2024 before reaching its ultimate level in 2030. The unemployment rate is expected to increase from 5.9% in 2019 to 10.5% in 2020. It is then expected to decrease to 6.0% by 2024, before gradually increasing to an ultimate level of 6.2% by 2030. The resulting expected job creation rate in 2020 is -4.1%, compared to an annual average of 1.9% from 2021 to 2024 and 0.6% from 2025 to 2030.
Over the long term, the job creation rate is assumed to be the same as the labour force growth of 0.5%. This results in the projected unemployment rate of 6.2%, which is in line with various economic forecasts and reflects moderate economic growth. The assumed ultimate unemployment rate of 6.2% is the same as for the 14th Actuarial Report on the OAS program but is assumed to be reached by year 2030 instead of 2025.
Table 33 shows the projected number of employed persons, aged 18 to 69, in Canada.
| Year | Population | Employed | Employment Rate | |||
|---|---|---|---|---|---|---|
| Males | Females | Males | Females | Males | Females | |
| (thousands) | (thousands) | % | ||||
| 2019 | 12,911 | 12,846 | 9,440 | 8,648 | 73.1 | 67.3 |
| 2020 | 12,987 | 12,925 | 9,033 | 8,337 | 69.5 | 64.5 |
| 2021 | 13,042 | 12,985 | 9,363 | 8,587 | 71.8 | 66.1 |
| 2022 | 13,095 | 13,043 | 9,533 | 8,716 | 72.8 | 66.8 |
| 2023 | 13,140 | 13,092 | 9,645 | 8,802 | 73.4 | 67.2 |
| 2024 | 13,180 | 13,135 | 9,753 | 8,886 | 74.0 | 67.6 |
| 2025 | 13,218 | 13,177 | 9,802 | 8,924 | 74.2 | 67.7 |
| 2030 | 13,392 | 13,370 | 9,987 | 9,179 | 74.6 | 68.6 |
| 2035 | 13,537 | 13,526 | 10,243 | 9,506 | 75.7 | 70.3 |
| 2040 | 13,890 | 13,874 | 10,519 | 9,761 | 75.7 | 70.4 |
| 2045 | 14,349 | 14,318 | 10,814 | 10,026 | 75.4 | 70.0 |
| 2050 | 14,780 | 14,737 | 11,067 | 10,260 | 74.9 | 69.6 |
| 2055 | 15,087 | 15,054 | 11,249 | 10,445 | 74.6 | 69.4 |
| 2060 | 15,315 | 15,317 | 11,397 | 10,612 | 74.4 | 69.3 |
D.4.2.3 Number of Earners
The number of earners for any given year, namely anyone who had employment earnings during the year, is always more than the employed population and sometimes even close to the labour force because it includes all individuals who had earnings at any time during the year, whereas the employed population only indicates the average number of employed in any given year. The projected number of earners is obtained by a regression based on a highly correlated historical relationship between the number of employed persons and the number of earners over the period 1976 to 2016.
D.4.3 Annual Increase in Prices (Inflation Rate)
The increase in prices (inflation rate) assumption is needed to determine the indexation of benefits for any given calendar year. It is also used in the determination of the annual nominal increase in average employment earnings.
Price increases, as measured by changes in the CPI, tend to fluctuate from year to year. Over the last 50 years, the trend was generally upward through the early 1980s and then downward until the introduction of the inflation-control targets in the early 1990s, at which point inflation began to stabilize. The average annual increases in the CPI over the 50, 20 and 10-year periods ending in 2018 were 3.7%, 1.9% and 1.6%, respectively.
In 2016, the Bank of Canada and the Government renewed their commitment to keep the inflation rate within a control range of 1% to 3%, with a target of 2%, until the end of 2021. The Senior Deputy Governor of the Bank of Canada indicated in November 2018 that the Bank was undergoing an extensive review of its monetary policy framework. A number of variants to replace the inflation target are being explored. The Bank is also looking at a possible dual mandate of targeting inflation as well as GDP growth or employmentFootnote 9. Nevertheless, given the success of the 2% inflation target, it is considered very likely that the Bank will renew its inflation target commitment or at least that it will constitute an important part of its future mandate.
In Canada, inflation was 2.3% in 2018. Price increase forecasts from various economists indicate an average increase in prices of 2.0% for the period 2019 to 2040. To reflect these forecasts and the expectation that the Bank of Canada will renew its inflation target, the price increase assumption is set at 2.0% for the year 2019, 1.0% for 2020 (to reflect impacts of COVID-19) and 2.0% for 2021 and thereafter. The ultimate assumption of 2.0% for 2021 and thereafter is equal to the assumption for the 30th CPP Actuarial Report.
D.4.4 Real Wage Increases
The real wage increase can be measured using the difference between the increase in the nominal average wage and the CPI. In this case, the nominal average wage is defined as the ratio of the total nominal earnings to total civilian employment in the Canadian economy as a whole.
The real wage increase is related to the growth in total labour productivity as follows:
Real Wage Increase = Growth in Labour Productivity +
Growth in Compensation Ratio +
Growth in Earnings Ratio +
Growth in Average Hours Worked +
Growth in Price Differential.
Historically, the nominal average wage increase has been similar to the nominal average annual employment earnings ("AAE") increase, and therefore it is assumed that they can be used interchangeably.
The assumed increase in AAE is used to project the total employment earnings, while the assumed increase in Average Weekly Earnings (AWE) is used to project the increase in the YMPE from one year to the next. The difference between real increases in the AWE and the AAE (net of inflation) has been relatively small over the period from 1966 to 2017, that is, a difference of approximately 0.01% per year. For several years in the 1980s and the 1990s, this difference was more pronounced; however, the real increases in AAE and AWE have shown a tendency to converge toward each other over time. Taking these factors into consideration, the real increases in AWE and AAE are assumed to be the same for the year 2018 and thereafter.
In addition to the factors included in the equation above, labour demand has a significant impact on real wage increases. Real wages are subject to downward pressure as the demand for workers decreases. On the other hand, one could expect upward pressure on wages if the size of the labour force fails to keep pace with a growing economy.
Labour productivity in the above equation is defined as the ratio of the real Gross Domestic Product (GDP) to total hours worked in the Canadian economy. The average annual growth in labour productivity was 1.59% for the 55-year period ending in 2017, 1.18% for the 25-year period and 0.83% for the 15-year period ending in 2017. Long-term productivity is expected to increase as a result of labour shortages and the federal government's policies aimed at enhancing productivity growth. At the same time, increasing labour force participation rates of older workers and a reliance on immigration for future labour force growth are expected to moderate the labour shortage and its impact on productivity. Labour productivity growth of 1.10% is assumed for the long term.
The compensation ratio is the ratio of the total compensation received by workers to the nominal GDP. Changes in the compensation ratio reflect the extent to which changes in productivity are shared between labour and capital. The compensation ratio has decreased on average by 0.11% per year for the 55-year period ending in 2017 with a more significant decrease between 1992 and 2005 (an average decrease of 0.7% per year). Over the last 25 and 15 years periods ending in 2017 the compensation ratio has decreased on average by 0.28% and 0.06% respectively. It is assumed that there will be no change in the compensation ratio over the long term.
The earnings ratio is the ratio of total workers' earnings to total compensation. The total workers' earnings is defined as the sum of total wages, salary disbursements, and total self-employment earnings. Changes in the earnings ratio reflect changes in the compensation structure offered to employees. The historical decline in the earnings ratio of 0.20% per year from 1962 to 2017 has been primarily due to the faster growth in supplementary labour income, such as employer contributions to pension plans, health benefit plans, the CPP, and the Employment Insurance program, compared to earnings. Given that a significant portion of the historical decrease in the earnings ratio can be explained by the increase in CPP contributions resulting from the increase in the contribution rate from 3.6% in 1986 to 9.9% in 2003, the earnings ratio is not expected to decline as fast as it has in the past. However, the increase in CPP contributions resulting from the new additional Plan as of 2019 is expected to reduce the earnings ratio. As well, as a result of the aging of the population, it is expected that the cost of pension plans and health programs will continue to increase in the future and exert downward pressure on the earnings ratio. Based on the foregoing, it is assumed that the long-term earnings ratio will decline by 0.05% per year.
The average hours worked is defined as the ratio of total hours worked to total employment in the Canadian economy. The average annual growth rate for average hours worked was -0.34% over the 55-year period ending in 2017. There was a significant decrease in the average hours worked between 1965 and 1983, with an average annual decrease over that period of 0.7% per year. Despite short-term fluctuations, the average hours worked stabilized after 1983, with an average decrease of 0.1% per year between 1984 and 2017. In the future, the assumed steady increases in productivity and the higher participation rates of older workers, who generally work fewer hours, could continue to apply negative pressure on the average hours worked. It is assumed that in the long term, the average hours worked will decline by 0.05% per year.
Finally, the price differential or "labour's terms of trade" is the ratio of the GDP deflator (defined as the ratio of nominal to real GDP) to the CPI. Including this ratio is necessary because labour productivity is expressed in real terms by using real GDP, while current dollar earnings are converted to real earnings using the CPI. The average annual growth in the price differential was 0.09% between 1962 and 2017. However, during this period, the price differential experienced significant fluctuations. It increased at an average rate of 1.2% per year between 1962 and 1976 and decreased at an average rate of 0.6% per year between 1977 and 2002. In more recent years, the decline has reversed, such that between 2002 and 2017 the price differential increased by 0.27% per year. This recent trend is partially due to Canada's improving international terms of trade. However, it is not clear for how long such growth could be sustained. It is assumed that the long term price differential will remain stable in the long term.
The result of the foregoing discussion is that the assumed real wage increase is 1.0% per year over the long term.
Table 34 summarizes the historical information and the assumptions described above.
| 1962-2017 Average |
1992-2017 Average |
2002-2017 Average |
Ultimate Assumption |
|
|---|---|---|---|---|
| Labour Productivity Growth | 1.59% | 1.18% | 0.83% | 1.10% |
| + Compensation Ratio Growth | (0.11%) | (0.28%) | (0.06%) | 0.00% |
| + Earnings Ratio Growth | (0.20%) | (0.16%) | (0.20%) | (0.05%) |
| + Average Hours Worked Growth | (0.34%) | (0.14%) | (0.23%) | (0.05%) |
| + Price Differential Growth | 0.09% | 0.11% | 0.27% | 0.00% |
| Real Wage Increase | 1.01% | 0.71% | 0.62% | 1.00% |
|
||||
The average annual and weekly earnings are assumed to increase at the same pace, with real wage increases projected to gradually rise from 0.3% in 2019 to an ultimate value of 1.0% by 2025. This is consistent with the assumed moderate economic growth implicitly reflected in the assumption on the unemployment rate.
Table 35 shows the assumptions regarding the annual increases in prices, real AAE, and real AWE.
| Year | Price Increases | Real Increases Average Annual Earnings (AAE) |
Average Weekly Earnings (AWE), (YMPE) |
|---|---|---|---|
| 2019 | 2.00 | 0.30 | 0.30 |
| 2020 | 1.00 | 0.50 | 0.50 |
| 2021 | 2.00 | 0.60 | 0.60 |
| 2022 | 2.00 | 0.70 | 0.70 |
| 2023 | 2.00 | 0.80 | 0.80 |
| 2024 | 2.00 | 0.90 | 0.90 |
| 2025+ | 2.00 | 1.00 | 1.00 |
D.4.5 Total Employment Earnings
Total employment earnings were obtained by applying the Canada less Québec proportion of earners and average employment earnings to the entire population of Canada. For this purpose, the proportion of earners from the 30th CPP Actuarial Report were adjusted to reflect the impacts of the COVID-19 pandemic on the labour force, whereas the average employment earnings are as determined in the 30th CPP Actuarial Report. The adjustments to the labour force assumptions from the 30th CPP Actuarial Report are consistent with those made in the context of the best-estimate assumptions of this report (i.e. higher unemployment rates from 2020 to 2023 inclusively).
The estimated total employment earnings were then compared with historical statistics on total employment earnings for Canada, as published by Statistics Canada. In 2018, the estimates are about 6% lower than the corresponding experience data. The projected employment earnings for Canada based on the methodology described in the preceding paragraph were therefore multiplied by an experience adjustment factor of 106% throughout the projection period.
D.4.6 Gross Domestic Product
The GDP is perhaps the most suitable basis for a comparison of costs since benefits are financed through general revenues and not on the basis of employment earnings. Historical GDP was compared to historical total employment earnings from 1966 to 2018. Based on this, the GDP has been, on average, 2.3 times higher than total employment earnings over the 25, 15 and 5 year periods ending in 2018.
The GDP was projected as total employment earnings multiplied by an ultimate experience factor of 2.3. Given that the price differential for this report is assumed to be 0%, no further adjustment is required to reflect differences between the CPI (used to express total earnings in nominal terms) and the GDP deflator (used to express GDP in nominal terms). However, further adjustments to the experience factor of 2.3 were applied for years 2020 to 2023 inclusively to reflect different short-term expected growth rates between GDP and total employment earnings resulting from the COVID-19 pandemic. In 2020, the GDP is expected to be more adversely affected by the pandemic than total employment earnings. The GDP is then expected to rebound to its pre-pandemic projected levels at a faster pace than total employment earnings between 2020 and 2024.
Based on the foregoing, the experience factor used to express the GDP as a multiplier of total employment earnings for 2020 is 2.24, and it is expected to gradually increase to its ultimate level of 2.30 in 2024.
D.5 Recipient Rates and Distribution by Level of Benefit
The recipient rate for an OAS program benefit refers to the proportion of the Canadian population that has received, receives, or is projected to receive that benefit. Since benefits are computed for age-sex cohorts as opposed to individuals, recipient rates by age, sex, type and level of benefit are required. Data from Service Canada for each type of benefit consist of the number of beneficiaries as at June of each year (1983 to 2019) by sex, age, and six levels of benefit as a percentage of the maximum benefit (0-19%, 20-39%, 40-59%, 60-79%, 80‑99%, and 100% and over). The highest level of benefit (100% of the maximum and over) includes those GIS beneficiaries with partial OAS pensions, who consequently see their supplement increased by the difference between the maximum OAS pension payable and the partial pension. The additional amount may result in the supplement exceeding the maximum GIS payable.
Service Canada also provided statistics on beneficiaries as at 31 December for each year from 2001 to 2018 and as at 31 July for 2019. The actual recipient rates in each of the cells described above are obtained by dividing the number of beneficiaries in each cell by the relevant population of Canada. The data include benefits paid outside Canada.
D.5.1 OAS Basic Pension
The historical recipient rates of sex-distinct cohorts for the basic pension were studied to determine the best-estimate assumptions. The ultimate OAS basic pension recipient rates are set equal to the projected recipient rates for the cohort reaching age 65 in 2020.
The assumed age 65 recipient rates in 2020 are set equal to the historical rates in 2019, and the assumed evolution of recipient rates from age 66 to ages 90 and above for the cohort aged 65 in 2020 is based on historical trends in the increase in recipient rates. Each cohort reaching age 65 after 2020 is assumed to experience the same recipient rates by age as those assumed for the cohort aged 65 in 2020. Recipient rates for cohorts aged 66 and over in 2020 are projected by linearly interpolating the rates for each age between the year 2019 and the year pertaining to the cohort aged 65 in 2020.
As the assumed recipient rates are based on historical experience that already includes voluntary deferrals (effective 1 July 2013), no adjustment is applied to the recipient rates for deferrals. However, voluntary deferrals are assumed in order to develop assumed distributions of the ages of pension take-up for each attained age. These distributions are used in turn to determine the assumed increase in pension applicable at an attained age from the greater effect of actuarial adjustment or the accumulation of additional years of residence (for partial pensions).
Table 36 presents the deferral assumptions applied to the distributions of ages at take-up by attained age, for cohorts reaching age 65 in 2019 and thereafter, for males and females. The assumptions represent the percentages of the cohorts who defer pension take-up to a given age.
It is important to note that deferrals also occur after age 70 for various reasons including waiting to accumulate more years of residence for those with partial pensions or not applying for the pension due to unawareness of the benefit. However, with increased auto-enrollments by ESDC of those eligible for the pension, it is expected that the number of deferrals to ages above 70 will decrease over time.
For those individuals who start their pension at age 65, most are assumed to start at exact age 65, while 3% of males and 2.1% of females are assumed to start mid-year at age 65.5. For ages 66 to 69, all new beneficiaries who had deferred are assumed to start at mid-year. For ages 70 and older, all new beneficiaries are assumed to start at the exact age.
| Age (mid-year) | Males | Females |
|---|---|---|
| 65 | 3.00 | 2.10 |
| 66 | 2.00 | 1.20 |
| 67 | 1.30 | 0.90 |
| 68 | 0.90 | 0.60 |
| 69 | 0.60 | 0.30 |
| 70+Table 36 footnote 1 | 0.20 | 0.10 |
| Total | 8.00 | 5.20 |
|
||
The basic pension recipient rates for cohorts reaching age 65 in 2020 and thereafter are assumed to increase from 83.2% at age 65 to 101.1% at ages 90 and over for males and from 85.9% at age 65 to 100.4% at ages 90 and over for females. It is worth noting that basic pension recipient rates include benefits paid outside Canada under international social security agreements, and as such, can exceed 100%. Table 37 presents the projected OAS basic pension recipient rates by age and sex for cohorts reaching age 65 in 2020 and thereafter.
| Age | Cohort Reaching Age 65 in 2020 and Thereafter | |
|---|---|---|
| Males | Females | |
| 65 | 83.2 | 85.9 |
| 66 | 88.2 | 91.0 |
| 67 | 91.2 | 93.2 |
| 68 | 93.2 | 94.7 |
| 69 | 94.6 | 95.5 |
| 70 | 95.8 | 97.4 |
| 75 | 98.8 | 99.4 |
| 80 | 99.8 | 100.2 |
| 85 | 100.6 | 100.4 |
| 90+ | 101.1 | 100.4 |
|
||
The basic pension recipient rates by age and sex were further broken down by level of benefit using distributions of recipient rates by level of benefit, expressed as a percentage of the maximum benefit (based on the number of years of residence in Canada). The historical distributions by level of benefit were derived from OAS beneficiary data as at 31 December of each year over the period 2010 to 2018. The historical data include the year 2017, which is the year that the introduction of partial benefits in 1977 had full effect (after 40 years). The age 65 distribution in 2018 is assumed to apply for all years thereafter, and the corresponding cohort distributions for ages 66 and above are assumed to apply for years 2019 and thereafter.
For any given cohort reaching age 65 in 2018 or after, the distributions by level of benefit for ages 66 and over are projected based on historical data that reveal that, for any given cohort, there is a large proportion of beneficiaries coming into pay who have a small number of years of residence and thus receive partial benefits. Recent experience has shown a significant increase of those with partial pensions and decrease of those with full pensions, compared to the projections of the previous (14th) triennial valuation report. As such, it is assumed that as a cohort progresses in age, the proportion of beneficiaries receiving a full pension will decrease while the proportion of beneficiaries receiving a partial benefit will increase, both to a greater extent than previously projected. Table 38 shows the evolution of male and female basic pension recipient rates by age, calendar year and level of benefit.
| Age | Calendar Year | ||||||||
|---|---|---|---|---|---|---|---|---|---|
| 2020 Level of Benefit |
2030 Level of Benefit |
2060 Level of Benefit |
|||||||
| Partial | Full | Total | Partial | Full | Total | Partial | Full | Total | |
| Males | |||||||||
| 65 | 9.6 | 73.6 | 83.2 | 9.6 | 73.6 | 83.2 | 9.6 | 73.6 | 83.2 |
| 66 | 12.6 | 75.6 | 88.2 | 12.7 | 76.1 | 88.7 | 12.7 | 76.1 | 88.7 |
| 67 | 14.0 | 76.7 | 90.7 | 14.1 | 77.6 | 91.7 | 14.1 | 77.6 | 91.7 |
| 68 | 13.7 | 78.5 | 92.2 | 15.1 | 78.7 | 93.7 | 15.1 | 78.7 | 93.7 |
| 69 | 13.4 | 80.7 | 94.1 | 15.7 | 79.2 | 94.8 | 15.7 | 79.2 | 94.8 |
| 70 | 13.2 | 82.6 | 95.8 | 16.2 | 79.6 | 95.8 | 16.2 | 79.6 | 95.8 |
| 75 | 11.9 | 86.9 | 98.8 | 18.1 | 80.7 | 98.8 | 18.1 | 80.7 | 98.8 |
| 80 | 12.2 | 87.6 | 99.8 | 17.9 | 81.9 | 99.8 | 19.6 | 80.2 | 99.8 |
| 85 | 12.0 | 88.6 | 100.6 | 16.9 | 83.8 | 100.6 | 20.7 | 79.9 | 100.6 |
| 90+ | 13.0 | 88.2 | 101.1 | 17.1 | 84.0 | 101.1 | 22.5 | 78.6 | 101.1 |
| All Ages | 12.4 | 83.2 | 95.6 | 16.3 | 80.1 | 96.4 | 17.8 | 79.2 | 97.0 |
| Females | |||||||||
| 65 | 10.3 | 75.6 | 85.9 | 10.3 | 75.6 | 85.9 | 10.3 | 75.6 | 85.9 |
| 66 | 13.4 | 77.6 | 91.0 | 13.5 | 77.9 | 91.4 | 13.5 | 77.9 | 91.4 |
| 67 | 14.6 | 78.5 | 93.0 | 14.6 | 78.8 | 93.4 | 14.6 | 78.8 | 93.4 |
| 68 | 14.2 | 80.4 | 94.6 | 15.4 | 79.5 | 94.8 | 15.4 | 79.5 | 94.8 |
| 69 | 13.7 | 81.7 | 95.4 | 15.9 | 79.7 | 95.5 | 15.9 | 79.7 | 95.5 |
| 70 | 13.4 | 84.0 | 97.4 | 16.5 | 80.9 | 97.4 | 16.5 | 80.9 | 97.4 |
| 75 | 11.8 | 87.6 | 99.4 | 18.1 | 81.3 | 99.4 | 18.1 | 81.3 | 99.4 |
| 80 | 12.2 | 88.0 | 100.2 | 17.7 | 82.5 | 100.2 | 19.3 | 80.9 | 100.2 |
| 85 | 11.8 | 88.6 | 100.4 | 16.4 | 84.0 | 100.4 | 20.2 | 80.2 | 100.4 |
| 90+ | 10.3 | 90.1 | 100.4 | 14.7 | 85.7 | 100.4 | 20.4 | 80.0 | 100.4 |
| All Ages | 12.4 | 84.7 | 97.1 | 16.3 | 81.3 | 97.5 | 17.9 | 80.1 | 98.0 |
|
|||||||||
The OAS Recovery Tax reduces the amount of the basic pension payable for high-income pensioners (see section 3 of Appendix B) through a repayment amount. The projected Recovery Tax amounts and number of beneficiaries affected by it presented in this report reflect that various factors may have an impact. These include: pension income splitting, TFSA utilization, and future sources of additional income such as the new additional CPP and QPP benefits, which started being payable in 2019.
The projections included in the 30th CPP Actuarial Report as well as micro-modelling based on OAS program beneficiaries data as of July 2019, provided by Service Canada, have been used to estimate the projected impact of additional CPP and QPP benefits on the Recovery TaxFootnote 10. Given the absence of experience data for the additional CPP and QPP and limited data regarding the TFSAs (introduced in 2009), the results presented in Table 39 and Table 40 should be interpreted with caution. Over time it is expected that these estimates will be further improved upon as data become available.
For the year 2019, the number of beneficiaries who are fully or partially affected by the OAS Recovery Tax were estimated from Service Canada and Canada Revenue Agency (CRA) data. In 2019, 94.7% of beneficiaries affected by a full repayment of their pensions were receiving a full basic pension and 5.3% were receiving a partial basic pension. For beneficiaries affected by a partial repayment, in 2019, 96.5% were receiving a full basic pension while 3.5% were receiving a partial basic pension.
The proportions of beneficiaries affected (fully or partially) by the Recovery Tax in 2020 and thereafter is projected by assuming that initial retirement income will increase in line with wage growth, while the Recovery Tax income limits increase in line with inflation. To simulate this, a formula was developed that is a function of each cohort's average career employment earnings (over the ages of 18 to 65) and the inflation rate. The link with inflation is required since the income limit above which the Recovery Tax applies has moved in line with inflation since 2001.
Table 39 presents the projected number and percentage of OAS beneficiaries affected by the Recovery Tax. The percentage of beneficiaries affected by the OAS Recovery Tax is projected to increase from 8.0% in 2020 (2.8% full and 5.2% partial) to 9.9% (3.2% full and 6.7% partial) by 2060.
As shown in Chart 11, over the short term the effect of additional CPP and QPP benefits on the number of recipients affected by the Recovery Tax is expected to be small given that additional CPP and QPP benefits only started in 2019. However, it is expected that as an increasing number of individuals receive a growing amount of additional CPP and QPP benefits over time, the impact of the additional CPP and QPP benefits will increase. It is estimated that additional CPP and QPP benefits will increase the number of recipients affected by the Recovery Tax by 10,000 (i.e. from 768,000 to 778,000) or 1.3% in 2040 and by 117,000 (from 1,134,000 to 1,251,000) or 10.3% in 2060. In 2060, due to additional CPP and QPP benefits, the number of individuals subject to a full repayment of their pensions is projected to increase by 27,000 (i.e. from 373,000 to 400,000) or 7.2% and the number of individuals subject to a partial repayment is projected to increase by 90,000 (from 761,000 to 851,000) or 11.8%.
| Year | Full Repayment of OAS Pension | Partial Repayment of OAS Pension | Total | ||||
|---|---|---|---|---|---|---|---|
| Number (thousands) |
% All OAS Beneficiaries |
Number (thousands) |
% All OAS Beneficiaries |
Number (thousands) Table 39 footnote 1 |
% All OAS Beneficiaries |
All OAS Beneficiaries (thousands) |
|
| 2019 | 177 | 2.8 | 333 | 5.2 | 510 | 8.0 | 6,362 |
| 2020 | 183 | 2.8 | 344 | 5.2 | 527 | 8.0 | 6,616 |
| 2021 | 189 | 2.8 | 355 | 5.2 | 545 | 7.9 | 6,874 |
| 2022 | 196 | 2.7 | 367 | 5.1 | 562 | 7.9 | 7,137 |
| 2023 | 202 | 2.7 | 378 | 5.1 | 579 | 7.8 | 7,406 |
| 2024 | 208 | 2.7 | 388 | 5.1 | 596 | 7.8 | 7,673 |
| 2025 | 214 | 2.7 | 398 | 5.0 | 612 | 7.7 | 7,945 |
| 2030 | 241 | 2.6 | 441 | 4.8 | 682 | 7.4 | 9,244 |
| 2035 | 260 | 2.6 | 469 | 4.7 | 729 | 7.2 | 10,062 |
| 2040 | 272 | 2.6 | 506 | 4.8 | 778 | 7.3 | 10,587 |
| 2045 | 294 | 2.7 | 568 | 5.2 | 861 | 7.8 | 10,989 |
| 2050 | 319 | 2.8 | 642 | 5.6 | 962 | 8.4 | 11,449 |
| 2055 | 350 | 2.9 | 734 | 6.1 | 1,085 | 9.1 | 11,980 |
| 2060 | 400 | 3.2 | 851 | 6.7 | 1,251 | 9.9 | 12,665 |
|
|||||||
Chart 11 - Impact of Additional CPP and QPP on OAS Beneficiaries Affected by Recovery Tax
(number in 000s and % affected)
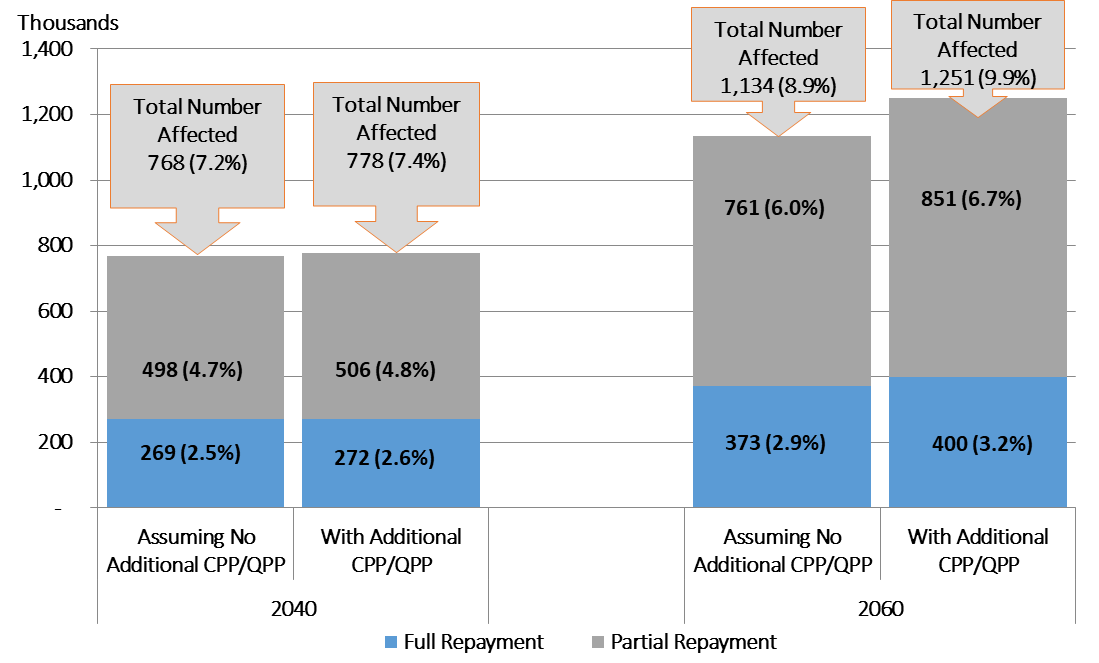
Chart 11 - Description
Stacked clustered column chart showing the total number and percentage of OAS beneficiaries affected by the Recovery Tax before and after the impact of the additional CPP and QPP. Y axis represents the number of beneficiaries in thousands. X axis represents the year. Each year has a cluster of two stacked columns, one stacked column for before the impact of the additional CPP and QPP, and the other for after the impact of the additional CPP and QPP. Each stacked column has two blocks, one showing the number and percentage of beneficiaries affected by a partial repayment of their basic pension due to the Recovery Tax, and the other showing the number and percentage of those affected by a full repayment due to the Recovery Tax.
In 2040, it is projected that, before the impact of the additional CPP and QPP, 768,000 or 7.2% of all OAS beneficiaries will be affected by the Recovery Tax. This group consists of a projected 498,000 or 4.7% of all beneficiaries affected by a partial repayment, and 269,000 or 2.5% of all beneficiaries affected by a full repayment. After the impact of the additional CPP and QPP, it is projected that 778,000 or 7.4% of all OAS beneficiaries will be affected by the Recovery Tax. This group consists of a projected 506,000 or 4.8% of all beneficiaries affected by a partial repayment, and 272,000 or 2.6% of all beneficiaries affected by a full repayment.
In 2060, it is projected, that before the impact of the additional CPP and QPP, 1,134,000 or 8.9% of all OAS beneficiaries will be affected by the Recovery Tax. This group consists of a projected 761,000 or 6.0% of all beneficiaries affected by a partial repayment, and 373,000 or 2.9% of all beneficiaries affected by a full repayment. After the impact of the additional CPP and QPP, it is projected that 1,251,000 or 9.9% of all OAS beneficiaries will be affected by the Recovery Tax. This group consists of a projected 851,000 or 6.7% of all beneficiaries affected by a partial repayment, and 400,000 or 3.2% of all beneficiaries affected by a full repayment.
The impact of the OAS Recovery Tax on total benefits payable is obtained using the projected number of beneficiaries who are affected and the assumed reduction in their average benefit (100% reduction for those with a full repayment and a 35.3% reduction in benefit for those with a partial repayment). It is estimated that, in 2020, the Recovery Tax will have the effect of reducing the total amount of basic pensions payable by about $2.1 billion or 4.4%. Table 40 presents the projected repayment amounts.
As shown in Chart 12, over the short term the effect of additional CPP and QPP benefits on the repayment amounts is expected to be small given that additional CPP and QPP benefits only started being payable in 2019. As an increasing number of individuals receive additional CPP and QPP benefits over time, the projected impact of the additional CPP and QPP benefits on repayment amounts will likewise increase. In 2040, additional CPP and QPP benefits are expected to increase the amount of the Recovery Tax by $45 million (i.e. from $4,468 million to $4,513 million) or a 1.0% increase. In 2060, additional CPP and QPP benefits are expected to increase the amount of the Recovery Tax by $837 million (from $9,526 million to $10,363 million) or 8.8%. In 2060, due to additional CPP and QPP benefits, the amount of full repayments of the basic pension is projected to increase by $298 million (from $5,834 million to $6,132 million) or 5.1% and the amount of partial repayments is projected to increase by $539 million (from $3,691 million to $4,230 million) or 14.6%.
| Year | Repayment for Those Subject to Full Repayments |
Repayment for Those Subject to Partial Repayments |
Total Repayment | |||
|---|---|---|---|---|---|---|
| Amount ($ million) |
% of Total OAS Pensions |
Amount ($ million) |
% of Total OAS Pensions |
Amount ($ million) Table 40 footnote 1 |
% of Total OAS Pensions |
|
| 2019 | 1,232 | 2.8 | 721 | 1.6 | 1,953 | 4.4 |
| 2020 | 1,295 | 2.8 | 755 | 1.6 | 2,050 | 4.4 |
| 2021 | 1,362 | 2.8 | 793 | 1.6 | 2,155 | 4.4 |
| 2022 | 1,436 | 2.8 | 835 | 1.6 | 2,271 | 4.4 |
| 2023 | 1,511 | 2.8 | 877 | 1.6 | 2,388 | 4.4 |
| 2024 | 1,588 | 2.7 | 919 | 1.6 | 2,507 | 4.3 |
| 2025 | 1,668 | 2.7 | 962 | 1.6 | 2,629 | 4.3 |
| 2030 | 2,075 | 2.6 | 1,175 | 1.5 | 3,250 | 4.1 |
| 2035 | 2,474 | 2.6 | 1,386 | 1.5 | 3,860 | 4.1 |
| 2040 | 2,856 | 2.6 | 1,657 | 1.5 | 4,513 | 4.1 |
| 2045 | 3,401 | 2.7 | 2,064 | 1.6 | 5,465 | 4.3 |
| 2050 | 4,069 | 2.8 | 2,595 | 1.8 | 6,664 | 4.6 |
| 2055 | 4,895 | 2.9 | 3,292 | 2.0 | 8,186 | 4.9 |
| 2060 | 6,132 | 3.1 | 4,230 | 2.2 | 10,363 | 5.3 |
|
||||||
Chart 12 - Impact of Additional CPP and QPP on Amount of OAS Recovery Tax
(amounts and % of total pensions payable)
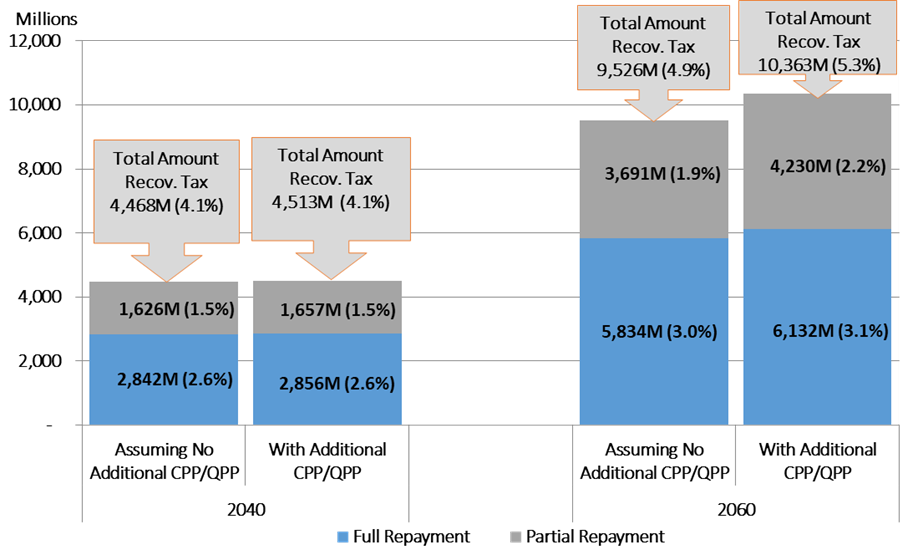
Chart 12 - Description
Stacked clustered column chart showing the total amount and percentage of repayment amounts due to the OAS Recovery Tax before and after the impact of the additional CPP and QPP. Y axis represents the amount of the Recovery Tax in millions of dollars. X axis represents the year. Each year has a cluster of two stacked columns, one stacked column for before the impact of the additional CPP and QPP, and the other stacked column for after the impact of the additional CPP and QPP. Each stacked column has two blocks, one showing the amount and percentage of partial repayments, and the other showing the amount and percentage of full repayments.
In 2040, it is projected that, before the impact of the additional CPP and QPP, the total Recovery Tax paid will be $4,468 million or 4.1% of total OAS pensions payable. This amount consists of projected partial repayments of $1,626 million (or 1.5% of total pensions payable) and full repayments of $2,842 million (or 2.6% of total pensions payable). After the impact of the additional CPP and QPP, it is projected that the total Recovery Tax paid will be $4,513 million or 4.1% of total pensions payable. This amount consists of projected partial repayments of $1,657 million (or 1.5% of total pensions payable) and full repayments of $2,856 million (or 2.6% of total pensions payable).
In 2060, it is projected that, before the impact of the additional CPP and QPP, the total Recovery Tax paid will be $9,526 million or 4.9% of total OAS pensions payable. This amount consists of projected partial repayments of $3,691 million (or 1.9% of total pensions payable) and full repayments of $5,834 million (or 3.0% of total pensions payable). After the impact of the additional CPP and QPP, it is projected that the total Recovery Tax paid will be $10,363 million or 5.3% of total pensions payable. This amount consists of projected partial repayments of $4,230 million (or 2.2% of total pensions payable) and full repayments of $6,132 million (or 3.1% of total pensions payable).
D.5.2 GIS and Allowance
The actual recipient rates as at July 2019 for the GIS and Allowance benefits for each age, sex, type and level of benefit are used as the starting point for determining the best-estimate assumptions.
The formulas used in the projection of the GIS and Allowance recipient rates take into account the assumption that, for each cohort of individuals who may become eligible for these benefits, the initial retirement income will consist mainly of CPP and QPP benefit (including the additional benefits starting in 2019) that reflect increases in line with wage growth prior to retirement. At the same time, it is assumed that the income limits for the GIS and Allowance will have increased in line with inflation prior to retirement. Together this would lead to a smaller percentage of individuals expected to become GIS or Allowance beneficiaries over the projection period. However, this decline in eligibility is slightly offset by the projected effect of TFSAs over time; that is, the projections also take into account that TFSA-related income is excluded from the determination of GIS and Allowance benefits, which leads to an increase in both the number of GIS and Allowance beneficiaries and amount of benefits.
For this report, experience adjustment factors were developed to adjust the projection formula so that characteristics and trends of historical recipient rates by age, sex, type and level of benefit observed over the last five years would be reproduced more closely, while simultaneously incorporating the assumed future impacts of additional CPP and QPP benefits and TFSAs. The factors were used for the first five years of the projection period. Given the additive nature of the experience adjustment factors, minimum values for recipient rates were set in order to eliminate the possibility of negative recipient rates. Minimum recipient rates were set by type of benefit in relation to the lowest prevailing recipient rates in the year 2019 at the benefit level category for a given type of benefit. The changes in the assumed distributions by level of benefit are also automatically taken into account by the formulas as are the increasing patterns of recipient rates by age.
These rates were further adjusted for year 2020 and thereafter to account for the amendments of Bill C-97 that, effective 1 July 2020, increases the income exemption.
Table 41 presents the projected GIS and Allowance recipient rates for cohorts reaching the ages 60 and 65 by age, sex, type and level of benefit, while Charts 13 through 16 present the recipient rates by year of birth for GIS singles and Allowances.
| Age | Cohort Reaching Age 65 in | ||||||||
|---|---|---|---|---|---|---|---|---|---|
| 2019 Level of Benefit |
2030 Level of Benefit |
2060 Level of Benefit |
|||||||
| Partial | Full | Total | Partial | Full | Total | Partial | Full | Total | |
| GIS - Males | |||||||||
| 65 | 13.0 | 3.5 | 16.5 | 17.8 | 4.8 | 22.6 | 13.4 | 4.0 | 17.4 |
| 70 | 22.3 | 5.2 | 27.5 | 21.2 | 4.9 | 26.1 | 15.8 | 4.0 | 19.8 |
| 75 | 25.2 | 5.1 | 30.3 | 23.0 | 4.7 | 27.7 | 16.3 | 3.7 | 20.0 |
| 80 | 26.6 | 5.7 | 32.3 | 23.9 | 5.2 | 29.1 | 16.1 | 4.0 | 20.1 |
| 85 | 27.0 | 5.7 | 32.6 | 24.6 | 5.1 | 29.8 | 15.2 | 3.9 | 19.2 |
| 90+ | 21.2 | 4.6 | 25.8 | 19.6 | 4.1 | 23.7 | 10.8 | 3.1 | 13.9 |
| All Ages | 23.6 | 5.2 | 28.7 | 22.1 | 4.9 | 26.9 | 15.0 | 3.8 | 18.8 |
| GIS - Females | |||||||||
| 65 | 14.6 | 4.0 | 18.6 | 18.6 | 5.2 | 23.8 | 13.7 | 4.3 | 17.9 |
| 70 | 25.2 | 5.9 | 31.1 | 25.3 | 5.9 | 31.2 | 18.6 | 4.8 | 23.4 |
| 75 | 30.4 | 6.2 | 36.6 | 29.0 | 6.1 | 35.1 | 20.8 | 5.0 | 25.8 |
| 80 | 33.5 | 7.6 | 41.1 | 31.4 | 7.3 | 38.7 | 21.9 | 6.0 | 27.9 |
| 85 | 36.0 | 7.6 | 43.6 | 33.1 | 7.2 | 40.3 | 21.8 | 5.8 | 27.6 |
| 90+ | 41.1 | 7.9 | 48.9 | 37.1 | 7.3 | 44.4 | 23.2 | 5.8 | 29.0 |
| All Ages | 30.9 | 6.7 | 37.5 | 29.5 | 6.5 | 36.1 | 20.5 | 5.3 | 25.8 |
| Age | Cohort Reaching Age 60 in | ||||||||
| 2019 Level of Benefit |
2030 Level of Benefit |
2060 Level of Benefit |
|||||||
| Partial | Full | Total | Partial | Full | Total | Partial | Full | Total | |
| Allowances - Males | |||||||||
| 60 | 0.3 | - | 0.3 | 0.7 | - | 0.7 | 0.5 | - | 0.5 |
| 61 | 0.7 | - | 0.8 | 0.9 | - | 0.9 | 0.6 | - | 0.7 |
| 62 | 1.0 | 0.1 | 1.1 | 1.2 | 0.1 | 1.2 | 0.8 | - | 0.9 |
| 63 | 1.4 | 0.1 | 1.4 | 1.5 | 0.1 | 1.6 | 1.1 | - | 1.1 |
| 64 | 1.8 | 0.1 | 1.9 | 1.9 | 0.1 | 2.0 | 1.4 | 0.1 | 1.5 |
| All Ages | 1.0 | 0.1 | 1.1 | 1.2 | 0.1 | 1.3 | 0.9 | - | 0.9 |
| Allowance - Females | |||||||||
| 60 | 2.0 | 0.1 | 2.1 | 3.8 | 0.2 | 4.0 | 3.0 | 0.2 | 3.2 |
| 61 | 4.6 | 0.2 | 4.8 | 5.1 | 0.3 | 5.4 | 3.9 | 0.2 | 4.1 |
| 62 | 5.8 | 0.3 | 6.2 | 6.4 | 0.3 | 6.8 | 4.9 | 0.2 | 5.1 |
| 63 | 7.3 | 0.4 | 7.7 | 7.9 | 0.4 | 8.3 | 6.0 | 0.3 | 6.3 |
| 64 | 8.6 | 0.4 | 9.0 | 9.3 | 0.4 | 9.7 | 7.1 | 0.3 | 7.4 |
| All Ages | 5.6 | 0.3 | 6.0 | 6.5 | 0.3 | 6.8 | 5.0 | 0.2 | 5.2 |
|
|||||||||
Chart 13 - GIS Single Recipient Rates (Males)
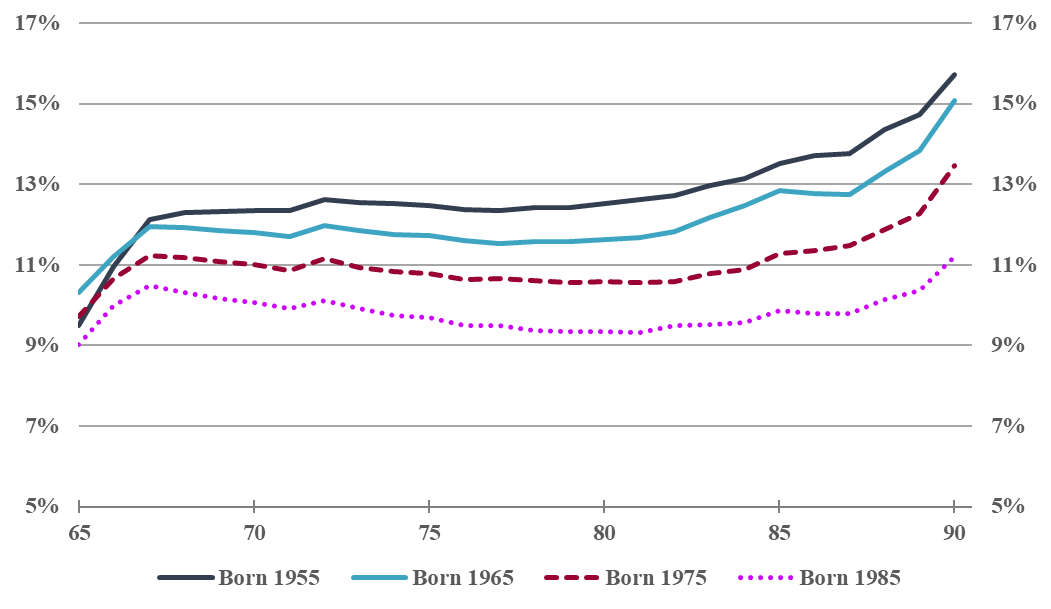
Chart 13 - Description
Line chart showing the male GIS Single recipient rates for specific birth cohorts. Y axis represents the percentage of the male Canadian population receiving the benefit. X axis represents age.
The GIS Single recipient rate of males born in 1955 is 9.5% at age 65, increases to 12.1% by age 67, and stays relatively stable until age 80, reaching 12.6%. After age 80, the rate slowly increases to reach 15.8% by age 90.
The GIS Single recipient rate of males born in 1965 is 10.3% at age 65, increases to 12% by age 67, and stays relatively stable until age 80, reaching 11.6%. After age 80, the rate slowly increases to reach 15.1% by age 90.
The GIS Single recipient rate of males born in 1975 is 9.7% at age 65, increases to 11.2% by age 67, and stays relatively stable until age 80, reaching 10.6%. After age 80, the rate slowly increases to reach 13.5% by age 90.
The GIS Single recipient rate of males born in 1985 is 9.0% at age 65, increases to 10.5% by age 67, and stays relatively stable until age 80, reaching 9.3%. After age 80, the rate slowly increases to reach 11.2% by age 90.
Chart 14 - GIS Single Recipient Rates (Females)
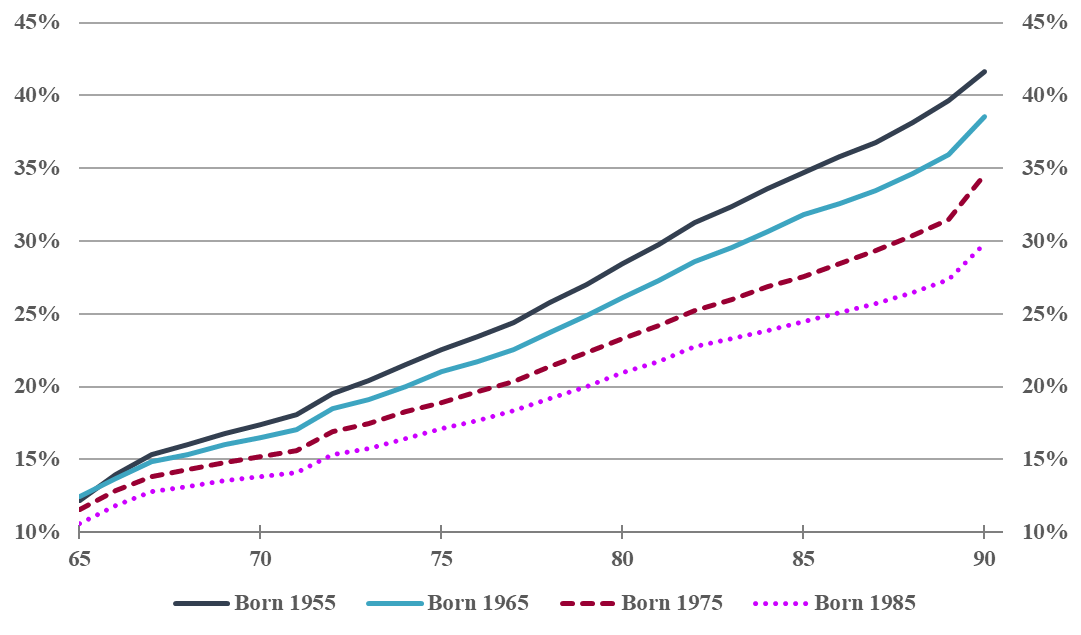
Chart 14 - Description
Line chart showing the female GIS Single recipient rates for specific birth cohorts. Y axis represents the percentage of the female Canadian population receiving the benefit. X axis represents age.
The GIS Single recipient rate of females born in 1955 is 12.2% at age 65, increases to 28.4% at age 80, and then further increases to 41.6% by age 90.
The GIS Single recipient rate of females born in 1965 is 12.5% at age 65, increases to 28.4% at age 80, and then further increases to 38.5% by age 90.
The GIS Single recipient rate of females born in 1975 is 11.5% at age 65, increases to 23.3% at age 80, and then further increases to 34.6% by age 90.
The GIS Single recipient rate of females born in 1985 is 10.6% at age 65, increases to 21% at age 80, and then further increases to 29.9% by age 90.
Chart 15 - Allowance Recipient Rates (Males)
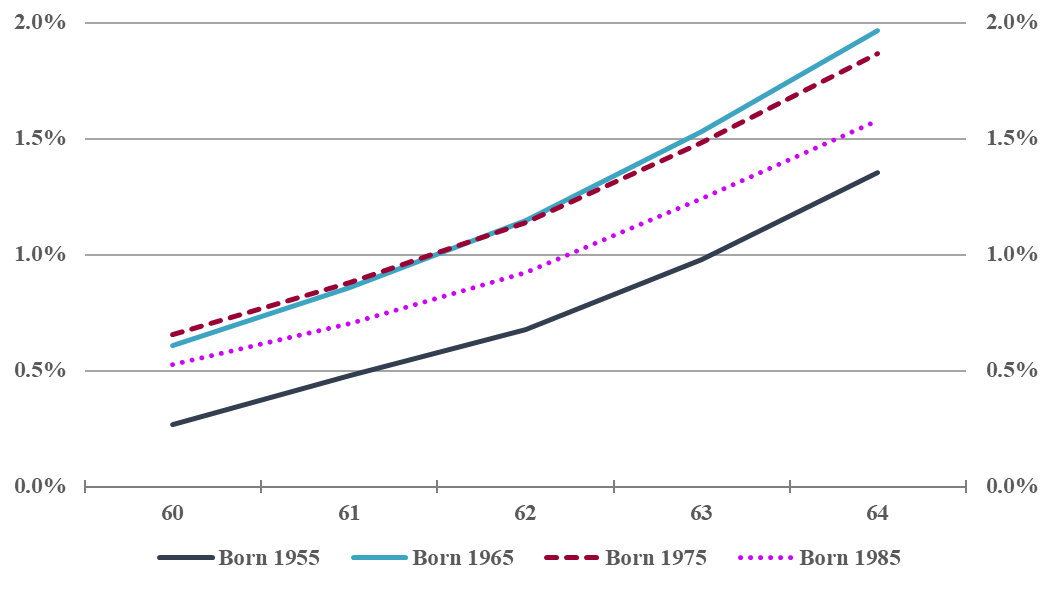
Chart 15 - Description
Line chart showing the male Allowance recipient rates for specific birth cohorts. Y axis represents the percentage of the male Canadian population receiving the benefit. X axis represents age.
The Allowance recipient rate of males born in 1955 is 0.3% at age 60, increases to 0.7% at age 62, and then further increases to 1.4% by age 64.
The Allowance recipient rate of males born in 1965 is 0.6% at age 60, increases to 1.1% at age 62, and then further increases to 2.0% by age 64.
The Allowance recipient rate of males born in 1975 is 0.7% at age 60, increases to 1.1% at age 62, and then further increases to 1.9% by age 64.
The Allowance recipient rate of males born in 1985 is 0.5% at age 60, increases to 0.9% at age 62, and then further increases to 1.6% by age 64.
Chart 16 - Allowance Recipient Rates (Females)
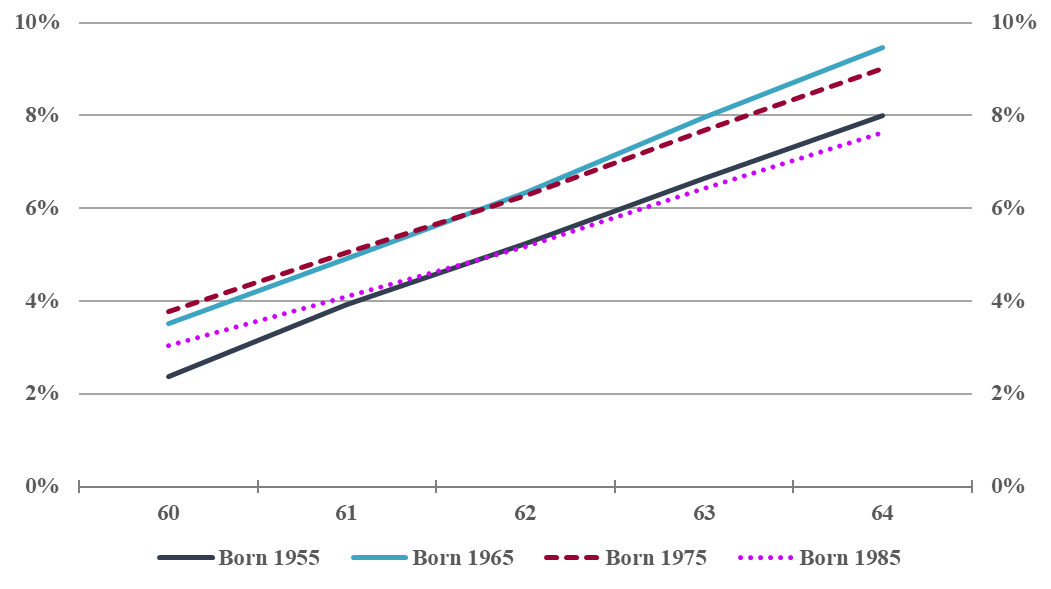
Chart 16 - Description
Line chart showing the female Allowance recipient rates for specific birth cohorts. Y axis represents the percentage of the female Canadian population receiving the benefit. X axis represents age.
The Allowance recipient rate of females born in 1955 is 2.4% at age 60, increases to 5.2% at age 62, and then further increases to 8.0% by age 64.
The Allowance recipient rate of females born in 1965 is 3.5% at age 60, increases to 6.3% at age 62, and then further increases to 9.5% by age 64.
The Allowance recipient rate of females born in 1975 is 3.8% at age 60, increases to 6.3% at age 62, and then further increases to 9.0% by age 64.
The Allowance recipient rate of females born in 1985 is 3.0% at age 60, increases to 5.2% at age 62, and then further increases to 7.6% by age 64.
Chart 17 and Table 42 show the impact of the additional CPP and QPP on GIS benefits. Given that the additional CPP and QPP benefits only started in 2019Footnote 11, the results presented should be interpreted with caution. Over time it is expected that these estimates will be further improved as additional CPP and QPP data become available. Over the near term, the effect of additional CPP and QPP benefits on the GIS recipient rates is expected to be small, since additional CPP and QPP benefits only started being payable in 2019. However, it is expected that as an increasing number of individuals receive a growing amount of additional CPP and QPP benefits over time, the impact on GIS recipient rates will likewise increase.
Table 42 shows that, in 2040, additional CPP and QPP benefits are estimated to decrease the projected number of GIS recipients by 60,000 (from 3,601,000 to 3,541,000, a relative decrease of 1.7%). By 2060, the projected decrease in the number of GIS recipients is 390,000 (from 3,808,000 to 3,419,000, a relative decrease of 10.2%). Although not shown, lower reductions (a relative decrease of 8.5%, from 104,600 to 95,700) are projected for the overall number of Allowance recipients in 2060.
As shown in Table 42 , as more individual receive additional CPP and QPP benefits over time, the projected impact on GIS benefits will likewise increase. In 2040, additional CPP and QPP benefits are estimated to decrease the amount of GIS benefits by $700 million (from $32.2 billion to $31.5 billion, a decrease of 2.2%). By 2060, GIS benefits are projected to be $4.8 billion lower (from $50.4 billion to $45.6 billion, a decrease of 9.6%). Although not shown, a higher relative reduction (a decrease of 15.5%, from $1.57 billion to $1.33 billion) is projected for overall Allowance benefits in 2060.
| Year | Number of GIS beneficiaries (thousands) |
Change | GIS Expenditures ($ billion) |
Change | ||||
|---|---|---|---|---|---|---|---|---|
| Assuming No Additional CPP/QPP |
With Additional CPP/QPP |
(thousands) | (percentages) | Assuming No Additional CPP/QPP |
With Additional CPP/QPP |
($ billion) | (percentages) | |
| 2030 | 3,187 | 3,179 | (8) | (0.3%) | 23.6 | 23.5 | (0.1) | (0.4%) |
| 2040 | 3,601 | 3,541 | (60) | (1.7%) | 32.2 | 31.5 | (0.7) | (2.2%) |
| 2050 | 3,688 | 3,519 | (169) | (4.6%) | 40.2 | 38.0 | (2.1) | (5.3%) |
| 2060 | 3,808 | 3,419 | (390) | (10.2%) | 50.4 | 45.6 | (4.8) | (9.6%) |
Chart 17 shows that, in 2040, additional CPP and QPP benefits are estimated to decrease the projected overall GIS recipient rate by 0.5 percentage points (pp) for both males and females, from 28.3% to 27.8%, a relative decrease of 1.8% for males, and from 37.5% to 37.0%, a relative decrease of 1.3% for females. By 2060, the projected decrease in the overall GIS recipient rate is 2.4 pp (from 24.6% to 22.2%, a relative decrease of 9.8%) for males and 3.5 pp for females (from 33.5% to 30.0%, a relative decrease of 10.5%). Although not shown, a lower reduction (8.5%) is projected for the overall Allowance recipient rate in 2060.
Chart 17 - Impact of Additional CPP and QPP on GIS Recipient Rates by Level of Benefit
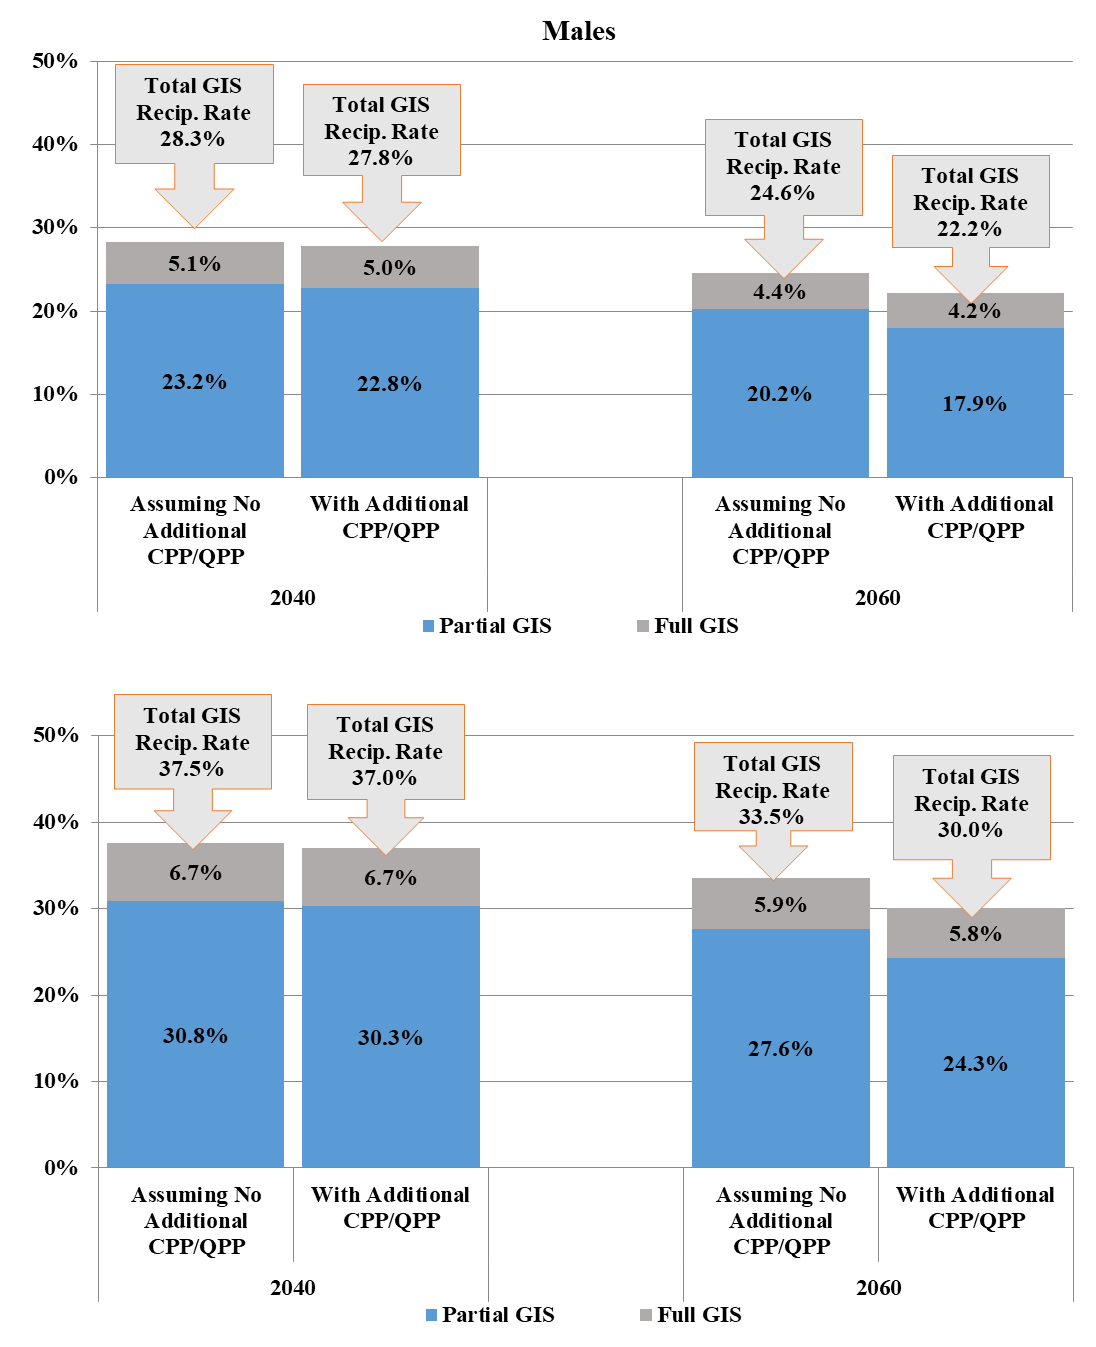
Chart 17 - Description
Two stacked clustered column charts, one for males and the other for females, showing the GIS recipient rates before and after the impact of the additional CPP and QPP. Y axis represents GIS recipient rates as a percentage. X axis represents the year. Each year has a cluster of two stacked columns, one stacked column for before the impact of the additional CPP and QPP, and the other for after the impact of the additional CPP and QPP. Each stacked column has two blocks, one showing the recipient rates for a partial GIS, and the other showing the recipient rates for the full GIS.
For males, in 2040, it is projected that, before the impact of the additional CPP and QPP, the total GIS recipient rate will be 28.3%. This consists of a 23.2% partial GIS recipient rate and 5.1% full GIS recipient rate. After the impact of the additional CPP and QPP, it is projected that the total GIS recipient rate will be 27.8%, which consists of a 22.8% partial GIS recipient rate and 5.0% full GIS recipient rate.
For males, in 2060, it is projected that, before the impact of the additional CPP and QPP, the total GIS recipient rate will be 24.6%, which consists of a 20.2% partial GIS recipient rate and 4.4% full GIS recipient rate. After the impact of the additional CPP and QPP, it is projected that the total GIS recipient rate will be 22.2%, which consists of a 17.9% partial GIS recipient rate and 4.2% full GIS recipient rate.
For females, in 2040, it is projected that, before the impact of the additional CPP and QPP, the total GIS recipient rate will be 37.5%, which consists of a 30.8% partial GIS recipient rate and 6.7% full GIS recipient rate. After the impact of the additional CPP and QPP, it is projected that the total GIS recipient rate will be 37.0%, which consists of a 30.3% partial GIS recipient rate and 6.7% full GIS recipient rate.
For females, in 2060, it is projected that, before the impact of the additional CPP and QPP, the total GIS recipient rate will be 33.5%, which consists of a 27.6% partial GIS recipient rate and 5.9% full GIS recipient rate. After the impact of the additional CPP and QPP, it is projected that the total GIS recipient rate will be 30.0%, which consists of a 24.3% partial GIS recipient rate and 5.8% full GIS recipient rate.
D.5.3 Maximum Benefits
Table 43 show the projected maximum monthly amount of benefits applicable for July of the given year. The amounts presented include the GIS and Allowance top-up amounts.
| 1 July of Year |
OASTable 43 footnote 1 | GISTable 43 footnote 2 | AllowanceTable 43 footnote 2 | ||
|---|---|---|---|---|---|
| Single | Married | Regular | Survivor | ||
| 2019 | 607 | 907 | 546 | 1,154 | 1,375 |
| 2020 | 616 | 919 | 553 | 1,169 | 1,393 |
| 2021 | 626 | 935 | 563 | 1,188 | 1,417 |
| 2022 | 638 | 953 | 574 | 1,212 | 1,445 |
| 2023 | 651 | 972 | 585 | 1,236 | 1,474 |
| 2024 | 664 | 992 | 597 | 1,261 | 1,503 |
| 2025 | 677 | 1,012 | 609 | 1,286 | 1,533 |
| 2030 | 748 | 1,117 | 672 | 1,420 | 1,693 |
| 2035 | 826 | 1,233 | 742 | 1,568 | 1,869 |
| 2040 | 912 | 1,362 | 820 | 1,731 | 2,064 |
| 2045 | 1,007 | 1,503 | 905 | 1,912 | 2,279 |
| 2050 | 1,111 | 1,660 | 999 | 2,111 | 2,516 |
| 2055 | 1,227 | 1,833 | 1,103 | 2,330 | 2,778 |
| 2060 | 1,355 | 2,023 | 1,218 | 2,573 | 3,067 |
|
|||||
D.5.4 Average Benefits in Relation to Maximum Benefits
The average benefits in relation to maximum benefits are the results of a two steps process. In the first step, for each cell, determined by age, sex, type and level of benefit, the average benefit paid was compared to the maximum benefit rate for each of the past five years ending in 2019. The average levels over those five years are then assumed to remain constant over the projection period.
In the second step, the assumed effects of TFSAs, additional CPP and QPP and voluntary deferrals are introduced and this results in individuals moving to different benefit levels. This has the effect of changing the distribution of beneficiaries by level and of increasing the aforementioned averages for the combined partial levels over time. The resulting assumed average benefits as a percentage of their maximum amounts by level (partial, full, and overall average level of benefit) and type are presented in Table 44 .
For the OAS and the GIS, it is possible for a beneficiary to receive more than 100% of the maximum benefit. For the OAS, this situation can happen for cases where there is a voluntary deferral and an actuarial adjustment factor is applied making the benefit higher than the maximum. For GIS, the situation happens if the person is receiving a partial OAS basic pension. In these cases, the maximum GIS benefit is increased by the difference between the full and partial basic pension.
| Males | ||||||
|---|---|---|---|---|---|---|
| 2019 Level of Benefit |
2060 Level of Benefit |
|||||
| Partial | FullTable 44 footnote 1 | All | Partial | FullTable 44 footnote 1 | All | |
| OAS | 49.9 | 101.1 | 94.8 | 61.3 | 102.6 | 95.0 |
| GIS-Single | 57.4 | 126.2 | 66.6 | 49.1 | 127.5 | 60.2 |
| GIS-Spouse a pensioner | 41.9 | 162.5 | 67.2 | 37.2 | 164.7 | 64.9 |
| GIS-Spouse not a pensioner | 42.0 | 123.4 | 58.8 | 38.0 | 125.4 | 53.0 |
| GIS-Spouse with Allowance | 60.2 | 132.1 | 92.0 | 56.2 | 133.6 | 91.9 |
| Allowance-Regular | 42.0 | 100.0 | 44.7 | 39.0 | 100.0 | 40.9 |
| Allowance-Survivor | 54.0 | 100.0 | 60.0 | 52.3 | 100.0 | 60.7 |
| Females | ||||||
| 2019 Level of Benefit |
2060 Level of Benefit |
|||||
| Partial | FullTable 44 footnote 1 | All | Partial | FullTable 44 footnote 1 | All | |
| OAS | 48.4 | 101.1 | 94.7 | 61.0 | 102.5 | 94.9 |
| GIS-Single | 53.5 | 133.2 | 67.6 | 48.1 | 134.3 | 63.8 |
| GIS-Spouse a pensioner | 42.1 | 159.0 | 65.9 | 37.2 | 160.7 | 64.1 |
| GIS-Spouse not a pensioner | 58.7 | 125.9 | 72.0 | 57.1 | 127.0 | 69.5 |
| GIS-Spouse with Allowance | 59.4 | 118.0 | 82.3 | 55.9 | 120.9 | 81.1 |
| Allowance-Regular | 44.7 | 100.0 | 46.9 | 41.5 | 100.0 | 43.4 |
| Allowance-Survivor | 52.3 | 100.0 | 58.4 | 50.8 | 100.0 | 58.0 |
|
||||||
D.6 Expenditures
D.6.1 Benefits
The expenditure for each year for a given type of benefit was computed as the sum, over all relevant population cells, of the product of:
- the population as at 1 July (by age and sex);
- the recipient rates (that vary by type of benefit, level of benefit, age, sex, and calendar year);
- the average benefit of those in the level-of-benefit cell as a percentage of the maximum benefit (varies by type of benefit, age, sex, and calendar year); and
- 12 times the maximum benefit as at 1 July.
As part of the methodology validation process, the number of beneficiaries and amounts of total annual benefits computed as above were compared to the actual results for 1983 through 2018 by type of benefit. Based on these comparisons, adjustments were made to the projected results, as described below.
The numbers of beneficiaries projected as described above were multiplied by experience adjustment factors. Furthermore, after adjusting the projected numbers of beneficiaries, the calculated total annual benefits tended to be lower than the actual benefits. Therefore, the projected amounts of benefits were also multiplied by experience adjustment factors.
The resulting experience adjustment factors by type of benefit are presented in Table 45 and correspond to the ratio required to reflect as closely as possible actual results for 2019. Detailed tables for the projected number of beneficiaries and total expenditures by sex, type and level of benefit are presented in Appendix E.
| OAS | GIS | Allowance | |||||
|---|---|---|---|---|---|---|---|
| Single | Spouse a Pensioner |
Spouse not a Pensioner |
Spouse has Allowance |
Regular | Survivor | ||
| Beneficiaries | 1.000 | 1.028 | 1.019 | 1.042 | 1.035 | 1.000 | 1.063 |
| Benefits | 1.010 | 1.011 | 1.020 | 1.012 | 1.016 | 1.106 | 1.128 |
D.6.2 Administrative Expenses
Based on experience over the last five years, annual administrative expenses have averaged about 0.4% of total annual benefit payments. This has been assumed to continue throughout the projection period.
Appendix E ― Detailed Projections of Beneficiaries and Expenditures
The following tables present detailed projections of the number of beneficiaries and amounts of expenditures for the OAS basic pension, GIS, and Allowance benefits. All figures shown include benefits paid outside of Canada.
The tables providing OAS basic pension projections account for voluntary deferrals, effective 1 July 2013. The tables providing GIS projections account for the increase in the supplement paid to individuals receiving partial OAS pensions. For these individuals, the GIS is increased by the difference between the full and partial OAS pension.
| Year | Males Level of Benefit: |
Females Level of Benefit: |
Both Sexes Level of Benefit: |
||||||
|---|---|---|---|---|---|---|---|---|---|
| Partial | Full | TotalTable 46 footnote 2 | Partial | Full | TotalTable 46 footnote 2 | Partial | Full | TotalTable 46 footnote 2 | |
| 2019 | 356 | 2,543 | 2,898 | 417 | 3,047 | 3,464 | 773 | 5,589 | 6,362 |
| 2020 | 393 | 2,630 | 3,023 | 458 | 3,135 | 3,593 | 851 | 5,765 | 6,616 |
| 2021 | 429 | 2,721 | 3,150 | 498 | 3,226 | 3,724 | 927 | 5,947 | 6,874 |
| 2022 | 465 | 2,814 | 3,280 | 537 | 3,321 | 3,858 | 1,002 | 6,135 | 7,137 |
| 2023 | 501 | 2,911 | 3,411 | 576 | 3,419 | 3,995 | 1,076 | 6,329 | 7,406 |
| 2024 | 535 | 3,006 | 3,541 | 614 | 3,518 | 4,132 | 1,149 | 6,524 | 7,673 |
| 2025 | 569 | 3,104 | 3,673 | 651 | 3,621 | 4,272 | 1,221 | 6,725 | 7,945 |
| 2030 | 726 | 3,574 | 4,300 | 824 | 4,120 | 4,944 | 1,549 | 7,694 | 9,244 |
| 2035 | 831 | 3,848 | 4,679 | 945 | 4,438 | 5,383 | 1,776 | 8,286 | 10,062 |
| 2040 | 898 | 4,008 | 4,906 | 1,029 | 4,652 | 5,681 | 1,927 | 8,660 | 10,587 |
| 2045 | 941 | 4,133 | 5,074 | 1,087 | 4,828 | 5,916 | 2,028 | 8,962 | 10,989 |
| 2050 | 979 | 4,309 | 5,288 | 1,131 | 5,030 | 6,161 | 2,109 | 9,339 | 11,449 |
| 2055 | 1,024 | 4,537 | 5,561 | 1,173 | 5,247 | 6,420 | 2,197 | 9,783 | 11,980 |
| 2060 | 1,088 | 4,839 | 5,927 | 1,229 | 5,510 | 6,738 | 2,317 | 10,349 | 12,665 |
|
|||||||||
| Year | Males Level of Benefit: |
Females Level of Benefit: |
Both Sexes Level of Benefit: |
||||||
|---|---|---|---|---|---|---|---|---|---|
| Partial | Full | TotalTable 47 Footnote 2 | Partial | Full | TotalTable 47 Footnote 2 | Partial | Full | TotalTable 47 Footnote 2 | |
| 2019 | 1,295 | 18,733 | 20,028 | 1,471 | 22,446 | 23,917 | 2,766 | 41,179 | 43,945 |
| 2020 | 1,507 | 19,645 | 21,151 | 1,712 | 23,407 | 25,119 | 3,218 | 43,052 | 46,270 |
| 2021 | 1,725 | 20,666 | 22,391 | 1,957 | 24,494 | 26,451 | 3,681 | 45,161 | 48,842 |
| 2022 | 1,952 | 21,812 | 23,765 | 2,212 | 25,727 | 27,939 | 4,164 | 47,539 | 51,704 |
| 2023 | 2,185 | 23,018 | 25,203 | 2,472 | 27,023 | 29,495 | 4,658 | 50,041 | 54,699 |
| 2024 | 2,422 | 24,260 | 26,682 | 2,737 | 28,376 | 31,112 | 5,158 | 52,636 | 57,794 |
| 2025 | 2,662 | 25,564 | 28,226 | 3,006 | 29,799 | 32,804 | 5,668 | 55,363 | 61,030 |
| 2030 | 3,900 | 32,599 | 36,499 | 4,385 | 37,534 | 41,919 | 8,285 | 70,133 | 78,418 |
| 2035 | 5,006 | 38,877 | 43,882 | 5,649 | 44,773 | 50,422 | 10,654 | 83,650 | 94,304 |
| 2040 | 6,003 | 44,832 | 50,835 | 6,836 | 51,939 | 58,774 | 12,838 | 96,771 | 109,609 |
| 2045 | 6,954 | 51,147 | 58,101 | 7,997 | 59,635 | 67,632 | 14,951 | 110,783 | 125,733 |
| 2050 | 7,984 | 58,965 | 66,948 | 9,185 | 68,697 | 77,882 | 17,168 | 127,662 | 144,830 |
| 2055 | 9,227 | 68,559 | 77,786 | 10,519 | 79,169 | 89,689 | 19,746 | 147,728 | 167,474 |
| 2060 | 10,838 | 80,727 | 91,565 | 12,174 | 91,792 | 103,966 | 23,012 | 172,519 | 195,531 |
|
|||||||||
| Year | Males Level of Benefit: |
Females Level of Benefit: |
Both Sexes Level of Benefit: |
||||||
|---|---|---|---|---|---|---|---|---|---|
| Partial | Full | TotalTable 48 Footnote 1 | Partial | Full | TotalTable 48 Footnote 1 | Partial | Full | TotalTable 48 Footnote 1 | |
| 2019 | 663 | 154 | 816 | 1,007 | 229 | 1,236 | 1,669 | 383 | 2,052 |
| 2020 | 736 | 169 | 905 | 1,065 | 243 | 1,309 | 1,801 | 412 | 2,214 |
| 2021 | 772 | 177 | 949 | 1,105 | 252 | 1,357 | 1,877 | 430 | 2,306 |
| 2022 | 809 | 186 | 995 | 1,149 | 262 | 1,411 | 1,958 | 448 | 2,406 |
| 2023 | 847 | 193 | 1,040 | 1,195 | 272 | 1,467 | 2,042 | 465 | 2,507 |
| 2024 | 883 | 201 | 1,084 | 1,242 | 281 | 1,524 | 2,125 | 482 | 2,607 |
| 2025 | 916 | 207 | 1,123 | 1,290 | 291 | 1,581 | 2,206 | 498 | 2,704 |
| 2030 | 1,074 | 238 | 1,311 | 1,531 | 338 | 1,868 | 2,604 | 575 | 3,179 |
| 2035 | 1,133 | 249 | 1,382 | 1,670 | 368 | 2,038 | 2,803 | 617 | 3,420 |
| 2040 | 1,149 | 252 | 1,401 | 1,754 | 386 | 2,140 | 2,903 | 638 | 3,541 |
| 2045 | 1,131 | 251 | 1,382 | 1,766 | 393 | 2,159 | 2,898 | 644 | 3,542 |
| 2050 | 1,120 | 251 | 1,370 | 1,756 | 392 | 2,148 | 2,876 | 643 | 3,519 |
| 2055 | 1,095 | 253 | 1,348 | 1,702 | 391 | 2,093 | 2,797 | 644 | 3,441 |
| 2060 | 1,096 | 259 | 1,355 | 1,668 | 396 | 2,064 | 2,764 | 655 | 3,419 |
|
|||||||||
| Year | Males Level of Benefit: |
Females Level of Benefit: |
Both Sexes Level of Benefit: |
||||||
|---|---|---|---|---|---|---|---|---|---|
| Partial | Full | TotalTable 49 Footnote 1 | Partial | Full | TotalTable 49 Footnote 1 | Partial | Full | TotalTable 49 Footnote 1 | |
| 2019 | 3,047 | 1,790 | 4,838 | 5,046 | 3,018 | 8,064 | 8,094 | 4,808 | 12,902 |
| 2020 | 3,280 | 1,931 | 5,211 | 5,288 | 3,196 | 8,484 | 8,568 | 5,127 | 13,695 |
| 2021 | 3,566 | 2,101 | 5,667 | 5,613 | 3,392 | 9,005 | 9,179 | 5,493 | 14,671 |
| 2022 | 3,814 | 2,245 | 6,060 | 5,928 | 3,589 | 9,517 | 9,742 | 5,834 | 15,577 |
| 2023 | 4,065 | 2,389 | 6,454 | 6,259 | 3,794 | 10,053 | 10,324 | 6,183 | 16,507 |
| 2024 | 4,310 | 2,529 | 6,839 | 6,606 | 4,005 | 10,610 | 10,916 | 6,534 | 17,450 |
| 2025 | 4,546 | 2,666 | 7,211 | 6,964 | 4,222 | 11,186 | 11,509 | 6,888 | 18,397 |
| 2030 | 5,769 | 3,387 | 9,156 | 8,924 | 5,422 | 14,345 | 14,692 | 8,809 | 23,501 |
| 2035 | 6,585 | 3,953 | 10,539 | 10,590 | 6,565 | 17,155 | 17,175 | 10,519 | 27,694 |
| 2040 | 7,236 | 4,459 | 11,695 | 12,131 | 7,667 | 19,798 | 19,368 | 12,126 | 31,493 |
| 2045 | 7,757 | 4,930 | 12,687 | 13,394 | 8,667 | 22,062 | 21,152 | 13,597 | 34,749 |
| 2050 | 8,402 | 5,436 | 13,838 | 14,625 | 9,579 | 24,204 | 23,027 | 15,015 | 38,042 |
| 2055 | 9,106 | 6,046 | 15,152 | 15,725 | 10,559 | 26,284 | 24,831 | 16,604 | 41,435 |
| 2060 | 10,014 | 6,827 | 16,841 | 16,992 | 11,771 | 28,763 | 27,006 | 18,599 | 45,604 |
|
|||||||||
| Year | Males Level of Benefit: |
Females Level of Benefit: |
Both Sexes Level of Benefit: |
||||||
|---|---|---|---|---|---|---|---|---|---|
| Partial | Full | TotalTable 50 Footnote 1 | Partial | Full | TotalTable 50 Footnote 1 | Partial | Full | TotalTable 50 Footnote 1 | |
| 2019 | 310 | 48 | 358 | 712 | 152 | 864 | 1,022 | 200 | 1,222 |
| 2020 | 336 | 53 | 389 | 745 | 159 | 904 | 1,081 | 212 | 1,293 |
| 2021 | 355 | 56 | 411 | 769 | 164 | 934 | 1,124 | 221 | 1,345 |
| 2022 | 373 | 59 | 433 | 796 | 170 | 966 | 1,170 | 229 | 1,399 |
| 2023 | 391 | 62 | 453 | 825 | 176 | 1,000 | 1,216 | 238 | 1,454 |
| 2024 | 407 | 65 | 472 | 854 | 181 | 1,036 | 1,262 | 246 | 1,508 |
| 2025 | 423 | 67 | 490 | 886 | 187 | 1,073 | 1,308 | 254 | 1,563 |
| 2030 | 494 | 77 | 571 | 1,046 | 217 | 1,262 | 1,540 | 294 | 1,834 |
| 2035 | 527 | 81 | 608 | 1,150 | 237 | 1,387 | 1,677 | 318 | 1,995 |
| 2040 | 542 | 84 | 625 | 1,227 | 253 | 1,479 | 1,768 | 336 | 2,105 |
| 2045 | 544 | 85 | 629 | 1,256 | 262 | 1,518 | 1,800 | 347 | 2,147 |
| 2050 | 551 | 87 | 638 | 1,268 | 265 | 1,533 | 1,818 | 352 | 2,171 |
| 2055 | 550 | 89 | 639 | 1,239 | 267 | 1,506 | 1,789 | 356 | 2,145 |
| 2060 | 557 | 92 | 649 | 1,215 | 269 | 1,485 | 1,773 | 361 | 2,134 |
|
|||||||||
| Year | Males Level of Benefit: |
Females Level of Benefit: |
Both Sexes Level of Benefit: |
||||||
|---|---|---|---|---|---|---|---|---|---|
| Partial | Full | TotalTable 51 Footnote 1 | Partial | Full | TotalTable 51 Footnote 1 | Partial | Full | TotalTable 51 Footnote 1 | |
| 2019 | 1,941 | 657 | 2,598 | 4,150 | 2,205 | 6,356 | 6,091 | 2,862 | 8,953 |
| 2020 | 2,096 | 721 | 2,817 | 4,344 | 2,317 | 6,662 | 6,441 | 3,039 | 9,479 |
| 2021 | 2,276 | 788 | 3,064 | 4,589 | 2,444 | 7,034 | 6,865 | 3,233 | 10,098 |
| 2022 | 2,442 | 849 | 3,292 | 4,836 | 2,577 | 7,414 | 7,279 | 3,427 | 10,705 |
| 2023 | 2,605 | 909 | 3,514 | 5,096 | 2,717 | 7,812 | 7,701 | 3,626 | 11,327 |
| 2024 | 2,761 | 965 | 3,726 | 5,367 | 2,862 | 8,230 | 8,128 | 3,827 | 11,956 |
| 2025 | 2,909 | 1,018 | 3,927 | 5,653 | 3,016 | 8,669 | 8,562 | 4,034 | 12,596 |
| 2030 | 3,674 | 1,298 | 4,972 | 7,220 | 3,865 | 11,085 | 10,893 | 5,163 | 16,057 |
| 2035 | 4,201 | 1,524 | 5,725 | 8,592 | 4,700 | 13,292 | 12,793 | 6,224 | 19,017 |
| 2040 | 4,632 | 1,750 | 6,381 | 9,913 | 5,553 | 15,466 | 14,545 | 7,303 | 21,848 |
| 2045 | 4,998 | 1,981 | 6,979 | 11,046 | 6,366 | 17,411 | 16,044 | 8,346 | 24,390 |
| 2050 | 5,474 | 2,233 | 7,708 | 12,168 | 7,117 | 19,285 | 17,642 | 9,351 | 26,993 |
| 2055 | 5,997 | 2,520 | 8,517 | 13,146 | 7,887 | 21,033 | 19,143 | 10,407 | 29,550 |
| 2060 | 6,641 | 2,848 | 9,488 | 14,206 | 8,779 | 22,985 | 20,847 | 11,627 | 32,473 |
|
|||||||||
| Year | Males Level of Benefit: |
Females Level of Benefit: |
Both Sexes Level of Benefit: |
||||||
|---|---|---|---|---|---|---|---|---|---|
| Partial | Full | TotalTable 52 Footnote 1 | Partial | Full | TotalTable 52 Footnote 1 | Partial | Full | TotalTable 52 Footnote 1 | |
| 2019 | 267 | 71 | 338 | 269 | 69 | 338 | 536 | 140 | 676 |
| 2020 | 287 | 75 | 362 | 287 | 75 | 362 | 574 | 149 | 724 |
| 2021 | 301 | 78 | 379 | 301 | 78 | 379 | 602 | 157 | 758 |
| 2022 | 316 | 82 | 398 | 316 | 82 | 398 | 632 | 164 | 797 |
| 2023 | 332 | 86 | 418 | 332 | 86 | 418 | 665 | 172 | 836 |
| 2024 | 349 | 89 | 439 | 349 | 89 | 439 | 699 | 179 | 877 |
| 2025 | 365 | 93 | 457 | 365 | 93 | 457 | 729 | 185 | 914 |
| 2030 | 442 | 109 | 551 | 442 | 109 | 551 | 884 | 218 | 1,102 |
| 2035 | 477 | 119 | 596 | 477 | 119 | 595 | 954 | 237 | 1,191 |
| 2040 | 484 | 121 | 605 | 484 | 121 | 605 | 968 | 243 | 1,211 |
| 2045 | 467 | 119 | 586 | 467 | 119 | 586 | 934 | 238 | 1,172 |
| 2050 | 445 | 115 | 560 | 445 | 115 | 560 | 890 | 230 | 1,120 |
| 2055 | 420 | 112 | 532 | 420 | 112 | 532 | 839 | 224 | 1,064 |
| 2060 | 409 | 114 | 523 | 409 | 114 | 523 | 818 | 227 | 1,046 |
|
|||||||||
| Year | Males Level of Benefit: |
Females Level of Benefit: |
Both Sexes Level of Benefit: |
||||||
|---|---|---|---|---|---|---|---|---|---|
| Partial | Full | TotalTable 53 Footnote 1 | Partial | Full | TotalTable 53 Footnote 1 | Partial | Full | TotalTable 53 Footnote 1 | |
| 2019 | 734 | 755 | 1,489 | 742 | 719 | 1,460 | 1,476 | 1,473 | 2,949 |
| 2020 | 772 | 794 | 1,566 | 772 | 776 | 1,548 | 1,544 | 1,570 | 3,114 |
| 2021 | 839 | 855 | 1,694 | 838 | 836 | 1,674 | 1,677 | 1,691 | 3,368 |
| 2022 | 896 | 915 | 1,810 | 896 | 894 | 1,789 | 1,791 | 1,809 | 3,600 |
| 2023 | 956 | 975 | 1,931 | 956 | 953 | 1,909 | 1,912 | 1,928 | 3,840 |
| 2024 | 1,020 | 1,035 | 2,055 | 1,020 | 1,012 | 2,032 | 2,040 | 2,047 | 4,087 |
| 2025 | 1,081 | 1,094 | 2,175 | 1,081 | 1,069 | 2,150 | 2,162 | 2,163 | 4,325 |
| 2030 | 1,415 | 1,423 | 2,838 | 1,414 | 1,390 | 2,804 | 2,829 | 2,812 | 5,642 |
| 2035 | 1,664 | 1,723 | 3,386 | 1,663 | 1,680 | 3,343 | 3,327 | 3,403 | 6,730 |
| 2040 | 1,839 | 1,959 | 3,797 | 1,837 | 1,908 | 3,745 | 3,676 | 3,867 | 7,542 |
| 2045 | 1,926 | 2,127 | 4,053 | 1,924 | 2,071 | 3,995 | 3,850 | 4,198 | 8,048 |
| 2050 | 1,994 | 2,261 | 4,255 | 1,992 | 2,203 | 4,195 | 3,986 | 4,464 | 8,450 |
| 2055 | 2,072 | 2,443 | 4,515 | 2,073 | 2,382 | 4,455 | 4,145 | 4,825 | 8,971 |
| 2060 | 2,223 | 2,734 | 4,957 | 2,227 | 2,667 | 4,894 | 4,450 | 5,401 | 9,850 |
|
|||||||||
| Year | Males Level of Benefit: |
Females Level of Benefit: |
Both Sexes Level of Benefit: |
||||||
|---|---|---|---|---|---|---|---|---|---|
| Partial | Full | TotalTable 54 Footnote 1 | Partial | Full | TotalTable 54 Footnote 1 | Partial | Full | TotalTable 54 Footnote 1 | |
| 2019 | 60 | 16 | 76 | 22 | 5 | 27 | 82 | 21 | 103 |
| 2020 | 76 | 15 | 91 | 26 | 5 | 32 | 103 | 20 | 123 |
| 2021 | 80 | 16 | 96 | 28 | 5 | 33 | 108 | 21 | 129 |
| 2022 | 84 | 16 | 100 | 29 | 6 | 34 | 113 | 22 | 135 |
| 2023 | 87 | 17 | 104 | 30 | 6 | 36 | 117 | 23 | 140 |
| 2024 | 90 | 17 | 107 | 31 | 6 | 37 | 121 | 23 | 144 |
| 2025 | 91 | 18 | 109 | 32 | 6 | 38 | 123 | 24 | 147 |
| 2030 | 96 | 19 | 115 | 35 | 7 | 41 | 131 | 26 | 157 |
| 2035 | 90 | 18 | 109 | 35 | 7 | 42 | 125 | 25 | 151 |
| 2040 | 86 | 18 | 104 | 36 | 7 | 43 | 122 | 25 | 147 |
| 2045 | 84 | 17 | 102 | 36 | 8 | 43 | 120 | 25 | 145 |
| 2050 | 86 | 18 | 104 | 36 | 8 | 43 | 122 | 25 | 147 |
| 2055 | 87 | 18 | 105 | 35 | 8 | 43 | 122 | 26 | 148 |
| 2060 | 88 | 18 | 107 | 36 | 8 | 43 | 124 | 26 | 150 |
|
|||||||||
| Year | Males Level of Benefit: |
Females Level of Benefit: |
Both Sexes Level of Benefit: |
||||||
|---|---|---|---|---|---|---|---|---|---|
| Partial | Full | TotalTable 55 Footnote 1 | Partial | Full | TotalTable 55 Footnote 1 | Partial | Full | TotalTable 55 Footnote 1 | |
| 2019 | 274 | 209 | 483 | 139 | 74 | 213 | 413 | 283 | 696 |
| 2020 | 293 | 213 | 507 | 150 | 75 | 225 | 443 | 289 | 731 |
| 2021 | 310 | 214 | 524 | 157 | 77 | 234 | 467 | 292 | 758 |
| 2022 | 332 | 227 | 559 | 166 | 81 | 248 | 498 | 309 | 807 |
| 2023 | 354 | 240 | 594 | 176 | 86 | 262 | 530 | 326 | 855 |
| 2024 | 374 | 252 | 625 | 185 | 90 | 276 | 559 | 342 | 901 |
| 2025 | 392 | 263 | 655 | 195 | 95 | 290 | 588 | 358 | 945 |
| 2030 | 481 | 314 | 796 | 249 | 117 | 366 | 730 | 432 | 1,162 |
| 2035 | 516 | 336 | 851 | 293 | 136 | 428 | 808 | 471 | 1,280 |
| 2040 | 553 | 360 | 913 | 338 | 153 | 492 | 892 | 513 | 1,405 |
| 2045 | 603 | 394 | 997 | 378 | 172 | 550 | 981 | 566 | 1,547 |
| 2050 | 671 | 444 | 1,115 | 412 | 191 | 603 | 1,083 | 635 | 1,718 |
| 2055 | 739 | 499 | 1,238 | 447 | 211 | 658 | 1,185 | 710 | 1,896 |
| 2060 | 813 | 560 | 1,373 | 493 | 236 | 729 | 1,306 | 796 | 2,102 |
|
|||||||||
| Year | Males Level of Benefit: |
Females Level of Benefit: |
Both Sexes Level of Benefit: |
||||||
|---|---|---|---|---|---|---|---|---|---|
| Partial | Full | TotalTable 56 Footnote 1 | Partial | Full | TotalTable 56 Footnote 1 | Partial | Full | TotalTable 56 Footnote 1 | |
| 2019 | 25 | 20 | 44 | 4 | 3 | 7 | 29 | 22 | 51 |
| 2020 | 36 | 26 | 63 | 7 | 4 | 11 | 43 | 30 | 73 |
| 2021 | 36 | 27 | 63 | 7 | 4 | 11 | 43 | 31 | 74 |
| 2022 | 36 | 28 | 63 | 7 | 4 | 12 | 43 | 32 | 75 |
| 2023 | 36 | 28 | 64 | 8 | 5 | 12 | 44 | 33 | 77 |
| 2024 | 37 | 29 | 66 | 8 | 5 | 13 | 44 | 34 | 78 |
| 2025 | 38 | 30 | 67 | 8 | 5 | 13 | 46 | 35 | 80 |
| 2030 | 41 | 33 | 74 | 9 | 5 | 14 | 50 | 38 | 87 |
| 2035 | 39 | 31 | 70 | 8 | 5 | 13 | 47 | 36 | 82 |
| 2040 | 37 | 30 | 67 | 8 | 4 | 12 | 44 | 34 | 79 |
| 2045 | 36 | 30 | 66 | 7 | 4 | 12 | 43 | 34 | 77 |
| 2050 | 38 | 31 | 69 | 8 | 5 | 12 | 46 | 36 | 82 |
| 2055 | 39 | 33 | 72 | 8 | 5 | 13 | 47 | 38 | 84 |
| 2060 | 41 | 35 | 76 | 8 | 5 | 13 | 49 | 40 | 89 |
|
|||||||||
| Year | Males Level of Benefit: |
Females Level of Benefit: |
Both Sexes Level of Benefit: |
||||||
|---|---|---|---|---|---|---|---|---|---|
| Partial | Full | TotalTable 57 Footnote 1 | Partial | Full | TotalTable 57 Footnote 1 | Partial | Full | TotalTable 57 Footnote 1 | |
| 2019 | 98 | 170 | 267 | 16 | 20 | 35 | 113 | 189 | 303 |
| 2020 | 119 | 202 | 321 | 22 | 27 | 49 | 141 | 229 | 370 |
| 2021 | 141 | 243 | 384 | 28 | 34 | 63 | 170 | 277 | 447 |
| 2022 | 145 | 254 | 398 | 30 | 37 | 66 | 174 | 290 | 465 |
| 2023 | 149 | 265 | 415 | 31 | 39 | 70 | 181 | 304 | 485 |
| 2024 | 155 | 278 | 433 | 33 | 40 | 73 | 188 | 318 | 506 |
| 2025 | 163 | 291 | 454 | 34 | 42 | 77 | 197 | 333 | 530 |
| 2030 | 199 | 352 | 551 | 41 | 49 | 90 | 240 | 401 | 641 |
| 2035 | 205 | 371 | 576 | 41 | 50 | 91 | 247 | 421 | 668 |
| 2040 | 213 | 390 | 603 | 43 | 53 | 95 | 256 | 443 | 698 |
| 2045 | 230 | 428 | 658 | 47 | 59 | 106 | 277 | 487 | 764 |
| 2050 | 263 | 498 | 760 | 53 | 68 | 121 | 316 | 566 | 882 |
| 2055 | 298 | 584 | 882 | 59 | 78 | 138 | 357 | 662 | 1,019 |
| 2060 | 337 | 686 | 1,023 | 66 | 90 | 156 | 403 | 776 | 1,178 |
|
|||||||||
| Year | Males Level of Benefit: |
Females Level of Benefit: |
Both Sexes Level of Benefit: |
||||||
|---|---|---|---|---|---|---|---|---|---|
| Partial | Full | TotalTable 58 Footnote 1 | Partial | Full | TotalTable 58 Footnote 1 | Partial | Full | TotalTable 58 Footnote 1 | |
| 2019 | 9 | 1 | 9 | 58 | 3 | 62 | 67 | 4 | 71 |
| 2020 | 13 | 1 | 14 | 78 | 4 | 82 | 91 | 5 | 96 |
| 2021 | 14 | 1 | 14 | 78 | 4 | 82 | 92 | 5 | 97 |
| 2022 | 14 | 1 | 15 | 78 | 4 | 82 | 92 | 5 | 97 |
| 2023 | 14 | 1 | 15 | 79 | 4 | 83 | 93 | 5 | 98 |
| 2024 | 15 | 1 | 15 | 79 | 4 | 84 | 94 | 5 | 99 |
| 2025 | 15 | 1 | 16 | 80 | 4 | 85 | 95 | 5 | 100 |
| 2030 | 15 | 1 | 16 | 82 | 4 | 86 | 97 | 5 | 102 |
| 2035 | 14 | 1 | 14 | 76 | 4 | 80 | 90 | 4 | 94 |
| 2040 | 13 | 1 | 14 | 72 | 3 | 75 | 85 | 4 | 89 |
| 2045 | 13 | 1 | 14 | 70 | 3 | 73 | 83 | 4 | 87 |
| 2050 | 13 | 1 | 14 | 72 | 3 | 76 | 86 | 4 | 90 |
| 2055 | 14 | 1 | 14 | 74 | 3 | 78 | 88 | 4 | 92 |
| 2060 | 14 | 1 | 14 | 78 | 4 | 81 | 91 | 4 | 96 |
|
|||||||||
| Year | Males Level of Benefit: |
Females Level of Benefit: |
Both Sexes Level of Benefit: |
||||||
|---|---|---|---|---|---|---|---|---|---|
| Partial | Full | TotalTable 59 Footnote 1 | Partial | Full | TotalTable 59 Footnote 1 | Partial | Full | TotalTable 59 Footnote 1 | |
| 2019 | 61 | 10 | 70 | 417 | 60 | 477 | 478 | 69 | 547 |
| 2020 | 75 | 12 | 86 | 474 | 68 | 542 | 549 | 79 | 628 |
| 2021 | 90 | 12 | 102 | 541 | 69 | 610 | 630 | 81 | 712 |
| 2022 | 94 | 13 | 106 | 555 | 70 | 625 | 648 | 83 | 731 |
| 2023 | 98 | 13 | 111 | 570 | 71 | 642 | 668 | 84 | 752 |
| 2024 | 101 | 13 | 114 | 588 | 72 | 660 | 689 | 86 | 774 |
| 2025 | 104 | 14 | 118 | 606 | 73 | 679 | 711 | 86 | 797 |
| 2030 | 114 | 13 | 128 | 675 | 72 | 747 | 789 | 85 | 874 |
| 2035 | 112 | 13 | 125 | 677 | 72 | 749 | 789 | 85 | 874 |
| 2040 | 115 | 14 | 128 | 688 | 74 | 762 | 802 | 88 | 890 |
| 2045 | 125 | 15 | 140 | 731 | 79 | 810 | 856 | 94 | 950 |
| 2050 | 140 | 17 | 157 | 816 | 86 | 902 | 956 | 103 | 1,059 |
| 2055 | 158 | 20 | 177 | 916 | 96 | 1,013 | 1,074 | 116 | 1,190 |
| 2060 | 175 | 22 | 197 | 1,026 | 106 | 1,133 | 1,201 | 128 | 1,329 |
|
|||||||||
| Year | Males Level of Benefit: |
Females Level of Benefit: |
Both Sexes Level of Benefit: |
||||||
|---|---|---|---|---|---|---|---|---|---|
| Partial | Full | TotalTable 60 Footnote 1 | Partial | Full | TotalTable 60 Footnote 1 | Partial | Full | TotalTable 60 Footnote 1 | |
| 2019 | 6 | - | 6 | 41 | 2 | 43 | 48 | 2 | 49 |
| 2020 | 11 | - | 11 | 60 | 2 | 63 | 71 | 3 | 74 |
| 2021 | 11 | - | 11 | 61 | 2 | 63 | 72 | 3 | 74 |
| 2022 | 11 | - | 12 | 61 | 2 | 63 | 73 | 3 | 75 |
| 2023 | 12 | 1 | 12 | 62 | 2 | 64 | 74 | 3 | 77 |
| 2024 | 12 | 1 | 13 | 63 | 2 | 66 | 75 | 3 | 78 |
| 2025 | 12 | 1 | 13 | 65 | 3 | 68 | 77 | 3 | 80 |
| 2030 | 13 | 1 | 14 | 71 | 3 | 74 | 84 | 3 | 87 |
| 2035 | 12 | 1 | 13 | 67 | 3 | 70 | 79 | 3 | 82 |
| 2040 | 12 | - | 12 | 64 | 3 | 67 | 76 | 3 | 79 |
| 2045 | 12 | - | 12 | 63 | 3 | 66 | 75 | 3 | 77 |
| 2050 | 12 | 1 | 13 | 67 | 3 | 69 | 79 | 3 | 82 |
| 2055 | 12 | 1 | 13 | 69 | 3 | 72 | 81 | 3 | 85 |
| 2060 | 13 | 1 | 13 | 73 | 3 | 76 | 86 | 4 | 89 |
|
|||||||||
| Year | Males Level of Benefit: |
Females Level of Benefit: |
Both Sexes Level of Benefit: |
||||||
|---|---|---|---|---|---|---|---|---|---|
| Partial | Full | TotalTable 61 Footnote 1 | Partial | Full | TotalTable 61 Footnote 1 | Partial | Full | TotalTable 61 Footnote 1 | |
| 2019 | 37 | 4 | 41 | 266 | 23 | 289 | 302 | 27 | 330 |
| 2020 | 50 | 6 | 55 | 317 | 30 | 347 | 367 | 36 | 403 |
| 2021 | 63 | 6 | 69 | 378 | 31 | 410 | 441 | 37 | 479 |
| 2022 | 67 | 6 | 73 | 393 | 32 | 425 | 460 | 39 | 498 |
| 2023 | 71 | 6 | 77 | 409 | 34 | 443 | 480 | 40 | 520 |
| 2024 | 74 | 7 | 81 | 428 | 35 | 462 | 502 | 41 | 543 |
| 2025 | 77 | 7 | 84 | 449 | 36 | 485 | 526 | 43 | 569 |
| 2030 | 91 | 7 | 99 | 547 | 41 | 588 | 638 | 48 | 686 |
| 2035 | 91 | 8 | 99 | 565 | 44 | 609 | 657 | 52 | 708 |
| 2040 | 94 | 8 | 102 | 584 | 47 | 631 | 679 | 55 | 734 |
| 2045 | 103 | 9 | 112 | 630 | 52 | 682 | 734 | 61 | 795 |
| 2050 | 118 | 10 | 128 | 720 | 59 | 779 | 838 | 70 | 908 |
| 2055 | 134 | 12 | 146 | 822 | 69 | 892 | 956 | 81 | 1,038 |
| 2060 | 152 | 14 | 166 | 938 | 81 | 1,019 | 1,090 | 95 | 1,185 |
|
|||||||||
| Year | Males Level of Benefit: |
Females Level of Benefit: |
Both Sexes Level of Benefit: |
||||||
|---|---|---|---|---|---|---|---|---|---|
| Partial | Full | TotalTable 62 Footnote 1 | Partial | Full | TotalTable 62 Footnote 1 | Partial | Full | TotalTable 62 Footnote 1 | |
| 2019 | 3 | - | 3 | 17 | 2 | 19 | 20 | 2 | 22 |
| 2020 | 3 | - | 3 | 18 | 2 | 20 | 21 | 2 | 23 |
| 2021 | 3 | - | 3 | 17 | 2 | 19 | 20 | 2 | 22 |
| 2022 | 3 | - | 3 | 17 | 2 | 19 | 20 | 2 | 22 |
| 2023 | 3 | - | 3 | 17 | 2 | 18 | 19 | 2 | 21 |
| 2024 | 3 | - | 3 | 16 | 2 | 18 | 19 | 2 | 21 |
| 2025 | 3 | - | 3 | 16 | 2 | 17 | 18 | 2 | 20 |
| 2030 | 2 | - | 2 | 11 | 1 | 13 | 13 | 2 | 15 |
| 2035 | 2 | - | 2 | 9 | 1 | 10 | 11 | 1 | 12 |
| 2040 | 2 | - | 2 | 8 | 1 | 9 | 9 | 1 | 10 |
| 2045 | 1 | - | 2 | 7 | 1 | 8 | 8 | 1 | 9 |
| 2050 | 1 | - | 2 | 6 | 1 | 7 | 7 | 1 | 8 |
| 2055 | 1 | - | 2 | 5 | 1 | 6 | 7 | 1 | 8 |
| 2060 | 1 | - | 1 | 5 | 1 | 5 | 6 | 1 | 7 |
|
|||||||||
| Year | Males Level of Benefit: |
Females Level of Benefit: |
Both Sexes Level of Benefit: |
||||||
|---|---|---|---|---|---|---|---|---|---|
| Partial | Full | TotalTable 63 Footnote 1 | Partial | Full | TotalTable 63 Footnote 1 | Partial | Full | TotalTable 63 Footnote 1 | |
| 2019 | 24 | 6 | 30 | 152 | 36 | 188 | 176 | 42 | 218 |
| 2020 | 25 | 6 | 31 | 157 | 37 | 194 | 183 | 43 | 226 |
| 2021 | 26 | 6 | 33 | 163 | 38 | 200 | 189 | 44 | 233 |
| 2022 | 27 | 7 | 33 | 162 | 38 | 200 | 189 | 44 | 233 |
| 2023 | 27 | 7 | 33 | 161 | 38 | 199 | 188 | 44 | 232 |
| 2024 | 27 | 7 | 34 | 160 | 37 | 197 | 187 | 44 | 231 |
| 2025 | 27 | 7 | 34 | 157 | 37 | 194 | 184 | 44 | 228 |
| 2030 | 23 | 6 | 29 | 129 | 31 | 159 | 151 | 37 | 188 |
| 2035 | 21 | 6 | 26 | 112 | 28 | 139 | 133 | 33 | 166 |
| 2040 | 20 | 6 | 26 | 103 | 27 | 130 | 124 | 33 | 156 |
| 2045 | 21 | 6 | 28 | 101 | 27 | 128 | 122 | 33 | 156 |
| 2050 | 22 | 7 | 29 | 96 | 27 | 122 | 118 | 34 | 151 |
| 2055 | 24 | 8 | 31 | 94 | 27 | 121 | 118 | 34 | 152 |
| 2060 | 23 | 8 | 31 | 88 | 25 | 113 | 111 | 33 | 144 |
|
|||||||||
Appendix F ― Acknowledgements
Service Canada provided statistics on the Old Age Security program and the Canada Pension Plan.
Statistics Canada provided information on Canadian demographic and economic variables.
The Canadian Human Mortality Database (CHMD) created by the Department of Demography, Université de Montréal was used for the historical mortality data for years up to 2011.
The Canada Life Tables (CLT) created by Statistics Canada were used for the historical mortality data for years 2011 to 2016.
The Canada Revenue Agency provided income tax return information.
The co-operation and able assistance received from the above-mentioned data providers deserve to be acknowledged.
The following people assisted in the preparation of this report:
Shayne Barrow, ACIA, ASA
Yu Cheng, ASA
Maxime Delisle, FCIA, FSA, CERA
Bojan Dimitrijevic
Patrick Dontigny, ASA
Christine Dunnigan, FCIA, FSA
Sari Harrel, FCIA, FSA
Kelly Moore
Louis-Marie Pommainville, FCIA, FSA
Footnotes
- Footnote 1
-
Amendments to the Old Age Security Act regarding payment of income-tested benefits to sponsored immigrants under Bill C-31: Economic Action Plan 2014 Act, No. 1 received Royal Assent on 19 June 2014. As of the time of writing of this report, the coming into force of the amendments is yet to be determined. As such, these amendments are not reflected in this report due to the uncertain timing of their implementation and the estimated non-material impact on the OAS program. Once the coming into force date becomes known, the effects of the amendments will be included in future actuarial reports on the OAS program.
- Footnote 2
-
The amendments to the OAS program under Bill C-97 – Budget Implementation Act, 2019, No. 1, which received Royal Assent on 21 June 2019 (effective 1 July 2020, increase the employment earnings exemption for GIS and Allowance benefits) have also been included in this report. These amendments were covered in the 15th Actuarial Report Supplementing the Actuarial Report on the Old Age Security program as at 31 December 2015, which was tabled in the House of Commons on 21 August 2019.
- Footnote 3
-
Amendments to the Old Age Security Act regarding payment of income-tested benefits to sponsored immigrants under Bill C-31: Economic Action Plan 2014 Act, No. 1 received Royal Assent on 19 June 2014. As of the time of writing of this report, the coming into force of the amendments is yet to be determined. As such, these amendments are not reflected in this report due to the uncertain timing of their implementation and the estimated non-material impact on the OAS program. Once the coming into force date becomes known, the effects of the amendments will be included in future actuarial reports on the OAS program.
- Footnote 4
-
The fertility rate of 1.55 for Canada is an adjusted value provided by Statistics Canada as part of a special tabulation that accounts for its revised population estimates released in January 2019.
- Footnote 5
-
More details are provided in the OCA's September 2018 OAS program Mortality Experience Fact Sheet, which can be found at http://www.osfi-bsif.gc.ca/Eng/oca-bac/fs-fr/Pages/oas_pme_2018.aspx
- Footnote 6
-
Bank of Canada, Toward 2021: Reviewing the Monetary Policy Framework, November 20, 2018.
https://www.bankofcanada.ca/2018/11/choosing-best-monetary-policy-framework-canada/ - Footnote 7
-
Labour's terms of trade measure how shifts in the prices of goods produced by workers (measured by the Gross Domestic Product (GDP) deflator) compare to shifts in the prices of goods consumed by workers (CPI).
- Footnote 8
-
The fertility rate of 1.55 for Canada is an adjusted value provided by Statistics Canada as part of a special tabulation that accounts for its revised population estimates released in January 2019.
- Footnote 9
-
Bank of Canada, Toward 2021: Reviewing the Monetary Policy Framework, November 20, 2018.
https://www.bankofcanada.ca/2018/11/choosing-best-monetary-policy-framework-canada/ - Footnote 10
-
The OAS program beneficiaries and benefits payable as at July 2019 were projected through the year 2060 by assuming that CPP and QPP income would grow in line with wages, while other than CPP and QPP income would grow at a rate halfway between inflation (changes in the CPI) and wage growth. The income limits for the Recovery Tax are assumed to grow in line with inflation. For each projection year, CPP and QPP income is then increased to reflect the projected additional CPP and QPP benefits (based on the 30th CPP Actuarial Report). The projected number of beneficiaries is next adjusted to account for population aging between 2019 and the given projected year, and the impact of the Recovery Tax is revaluated.
- Footnote 11
-
The OAS program beneficiaries and benefits payable as at July 2019 were projected through the year 2060 by assuming that CPP and QPP income would grow in line with wages, while other than CPP and QPP income would grow at a rate halfway between inflation (changes in the CPI) and wage growth. The income limits for the GIS and Allowance benefits are assumed to grow in line with inflation. For each projection year, CPP and QPP income is then increased to reflect the projected additional CPP and QPP benefits (based on the 30th CPP Actuarial Report). The projected number of beneficiaries is next adjusted to account for population aging between 2016 and the given projected year, and the GIS and Allowance benefits are revaluated.