Actuarial Report Highlights (14th) Public Service Death Benefit Account as at 31 March 2020 - Highlights
Accessibility statement
The Web Content Accessibility Guidelines (WCAG) defines requirements for designers and developers to improve accessibility for people with disabilities. It defines three levels of conformance: Level A, Level AA, and Level AAA. This report is partially conformant with WCAG 2.0 level AA. If you require a compliant version, please contact webmaster@osfi-bsif.gc.ca.
Office of the Superintendent of Financial Institutions
Office of the Chief Actuary
Main Findings
| Financial Position ($ millions) |
|
|---|---|
| Account Balance | 3,880 |
| Liabilities (Paid-up Death Benefits and IBNR) | 996 |
| Actuarial Excess | 2,884 |
| Ratio of Actuarial Excess to Annual Benefit Payments | 14.4 |
| Projected Ratio in 2045 | 10.6 |
| Membership | |
|---|---|
| Participants | 522,104 |
| Term Insurance Monthly Cost and Contributions (per $1,000 of Coverage) |
|
|---|---|
| Monthly cost | 19.0 cents |
| Government contributions | 1.8 cents |
| Participants contributions | 15.0 cents |
Message from the Chief Actuary
- The monthly cost is projected to decline over time due to lower mortality rates driven by mortality improvement.
- Persistent actuarial excess is mainly due to large interest credit accumulation.
- We reflected the impacts of the COVID-19 pandemic on the economic assumptions used in this report. The pandemic is a very fluid situation that will continue to evolve for some time. The final impacts will be reflected in future reports.
Key Assumptions
| Current | Previous | |
|---|---|---|
| Ultimate real yield on the Account | 2.1% | 2.7% |
| Life expectancy at age 65 (in years) | 2020 | 2036 |
|---|---|---|
| Male | 22.9 | 23.9 |
| Female | 24.6 | 25.5 |
Periods are from 1 April to 31 March
Chart 1 - Projected Ratio of Actuarial Excess to Annual Benefit Payments
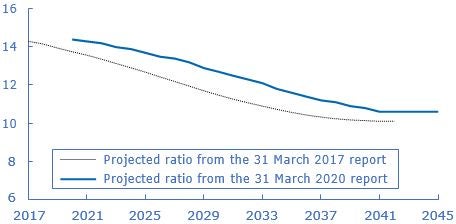
Graphic description - Projected Ratio of Actuarial Excess to Annual Benefit Payments
Line graphs comparing the ratios over time of the projected actuarial excess at the end of the plan year to the annual benefit payments projected for the following plan year between the current and previous valuation reports. Y-axis represents the expected ratio. X‑axis represents the plan year, starting at 31 March 2017 and ending at 31 March 2045.
All projected actuarial excess ratios from the previous report are lower than those in the current report. The actuarial excess ratios from the previous and current reports for plan year 2021 are 13.6 and 14.4, respectively. Costs exceed contributions throughout the period. As a result, the ratios decrease to 10.1 at the end of projection year 2042 in the previous report and 10.6 at the end of projection year 2045 in the current report.
Chart 2 - Projected Monthly Cost (Cents)
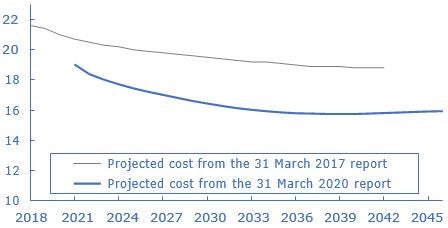
Graphic description - Projected Monthly Cost (Cents)
Line graphs comparing the projected monthly costs over time between the current and previous valuation report. Y-axis represents the monthly cost in cents per thousand dollar of term insurance. X-axis represents the plan year, starting in 2018 and ending in 2045.
The projected monthly cost for plan year 2021 is 19.0 cents per thousand dollar of term insurance compared to 20.7 cents in the previous report. The projected monthly cost decreases over time. As a result, by plan year 2045 the projected monthly cost is 15.9 cents per thousand dollars of term insurance representing a decrease of 2.9 cents from the 18.8 cents projected in the previous report.
Chart 3 - Account's Income Breakdown - 2020
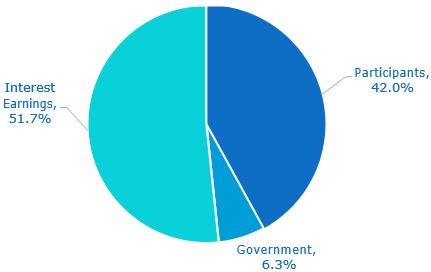
Graphic description - Account's Income Breakdown - 2020
| Interest Earnings | Participants | Government |
|---|---|---|
| 51.7% | 42.0% | 6.3% |
Chart 4 - Account's Income and Expenditures Projection ($ million)
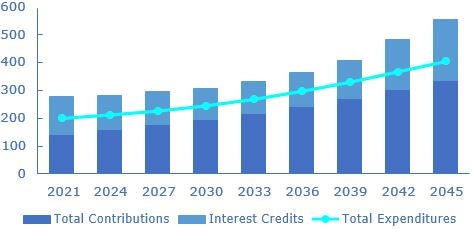
Graphic description - Account's Income and Expenditures Projection ($ million)
| Plan Year | Total Contributions | Interest Credits | Total Expenditures |
|---|---|---|---|
| 2021 | 142 | 135 | 200 |
| 2024 | 160 | 122 | 212 |
| 2027 | 176 | 120 | 226 |
| 2030 | 196 | 112 | 245 |
| 2033 | 218 | 112 | 268 |
| 2036 | 243 | 121 | 297 |
| 2039 | 271 | 137 | 330 |
| 2042 | 303 | 181 | 367 |
| 2045 | 336 | 218 | 404 |