Actuarial Report (14th) Public Service Death Benefit Account as at 31 March 2020
Accessibility statement
The Web Content Accessibility Guidelines (WCAG) defines requirements for designers and developers to improve accessibility for people with disabilities. It defines three levels of conformance: Level A, Level AA, and Level AAA. This report is partially conformant with WCAG 2.0 level AA. If you require a compliant version, please contact webmaster@osfi-bsif.gc.ca.
The Honourable Jean-Yves Duclos, P.C., M.P.
President of Treasury Board
Ottawa, Canada
K1A 0R5
Dear Minister:
Pursuant to Section 59 of the Public Service Superannuation Act, I am pleased to submit the report on the actuarial review as at 31 March 2020 of the Public Service Death Benefit Account established under Part II of this Act.
Yours sincerely,
Assia Billig, FCIA, FSA, PhD
Chief Actuary
Office of the Chief Actuary
Table of contents
List of Tables
- Table 1 - Ultimate Best-Estimate Economic Assumptions
- Table 2 - Demographic Assumptions
- Table 3 - State of the Account
- Table 4 - Financial Position
- Table 5 - Paid-Up Insurance per $10,000 of Coverage for Plan Year 2021
- Table 6 - Monthly Cost and Contributions per $1,000 of Coverage for Plan Year 2021 (cents)
- Table 7 - Projected Monthly Cost
- Table 8 - Reconciliation of Projected Results
- Table 9 - Sensitivity of Valuation Results to Variations in Key Assumptions
- Table 10 - Contribution per $2,000 of Death Benefit
- Table 11 - Legislated Single Premium per $10,000 of Basic Benefit
- Table 12 - Public Service Death Benefit Account
- Table 13 - Rates of Interest
- Table 14 - Reconciliation of Non-Elective Participants
- Table 15 - Reconciliation of Elective Participants
- Table 16 - Non-Elective Participants
- Table 17 - Elective Participants in Receipt of a Disability Pension
- Table 18 - Elective Retired Participants
- Table 19 - Summary of Economic Assumptions
- Table 20 - Sample of Assumed Seniority and Promotional Salary Increases
- Table 21 - Assumed Annual Increases in Number of Contributors
- Table 22 - Sample of Assumed Rates of Retirement - Main Group 1- Male
- Table 23 - Sample of Assumed Rates of Retirement - Main Group 1- Female
- Table 24 - Sample of Assumed Rates of Retirement - Main Group 2 - Male
- Table 25 - Sample of Assumed Rates of Retirement - Main Group 2 - Female
- Table 26 - Sample of Assumed Rates of Retirement - Operational Service
- Table 27 - Sample of Assumed Rates of Pensionable Disability
- Table 28 - Sample of Assumed Rates of Withdrawal - Main Group - Male
- Table 29 - Sample of Assumed Rates of Withdrawal - Main Group - Female
- Table 30 - Sample of Assumed Rates of Withdrawal - Operational Group
- Table 31 - Sample of Assumed Rates of Mortality
- Table 32 - Sample of Assumed Longevity Improvement Factors
- Table 33 - Election Proportions (Non-Elective participants choosing to become elective participants at retirement)
List of Charts
1. Executive Summary
This actuarial report on the Public Service Death Benefit Account (Account) was made pursuant to Section 59 of the Public Service Superannuation Act (PSSA).
This actuarial valuation is as at 31 March 2020 and is in respect of death benefits and contributions defined by Part II of the PSSA.
The previous actuarial report was prepared as at 31 March 2017. The date of the next periodic review is scheduled to occur no later than 31 March 2023.
1.1 Purpose of Actuarial Report
The purpose of this actuarial valuation is to determine the state of the Account as well as to assist the President of the Treasury Board in making informed decisions regarding the financing of the government's death benefit obligation. This report may not be suitable for another purpose.
1.2 Main Findings
As at 31 March 2020, the supplementary death benefit (SDB) plan has an actuarial excess of $2,884 million resulting from the difference between the Account balance of $3,880 million and the liabilities of $996 million.
The actuarial excess is projected to reach $4,413 million at the end of plan yearFootnote 1 2045. Chart 1 shows the ratio of projected actuarial excess at the end of the plan year to annual benefit payments projected for the following plan year. This ratio is expected to decrease from the current level of 14.4 to 10.6 by the end of plan year 2045 as the cost continues to exceed the contributions throughout the period.
Chart 1 - Projected Ratio of Actuarial Excess to Annual Benefit Payments
(Actuarial excess is measured at the end of plan year and annual payments are those of the following plan year.)
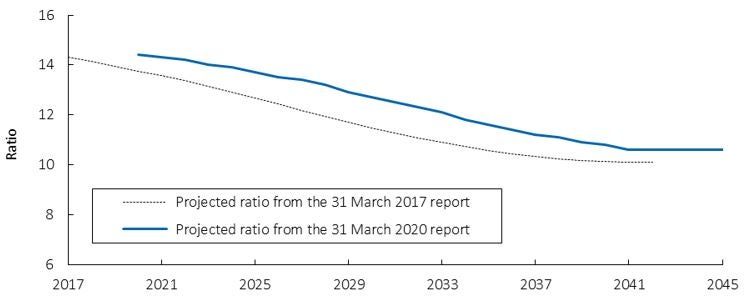
Graphic description - Projected Ratio of Actuarial Excess to Annual Benefit Payments
Line graphs comparing the ratios over time of the projected actuarial excess at the end of the plan year to the annual benefit payments projected for the following plan year between the current and previous valuation reports. Y-axis represents the expected ratio. X‑axis represents the plan year, starting at 31 March 2017 and ending at 31 March 2045.
All projected actuarial excess ratios from the previous report are lower than those in the current report. The actuarial excess ratios from the previous and current reports for plan year 2021 are 13.6 and 14.4, respectively. Costs exceed contributions throughout the period. As a result, the ratios decrease to 10.1 at the end of projection year 2042 in the previous report and 10.6 at the end of projection year 2045 in the current report.
1.3 Valuation Basis
This valuation report is based on the SDB plan provisions enacted by the Legislation, summarized in Appendix A.
There have been no changes to the plan provisions since the last actuarial valuation report.
The financial data on which this valuation is based relate to the Account established to track contributions and benefits under the SDB plan provisions. The Account data is summarized in Appendix B.
The membership data is summarized in Appendix C.
The valuation was prepared using accepted actuarial practice in Canada, methods and assumptions which are summarized in Appendices D to F.
All actuarial assumptions used in this report are best-estimate assumptions. They are independently reasonable and appropriate in aggregate for the purposes of the valuation at the date of this report. The actuarial assumptions used in the previous report were revised based on economic trends and demographic experience. A complete description of the assumptions is shown in Appendices E and F.
The following tables present summaries of the ultimate economic and of the demographic assumptions used in this report and a comparison with those used in the previous report.
| 31 March 2020 | 31 March 2017 | |
|---|---|---|
| Real increase in average earnings | 0.7% | 0.8% |
| Real projected yield on the Public Service Death Benefit Account | 2.1% | 2.7% |
| 31 March 2020 | 31 March 2017 | |
|---|---|---|
| Promotional and seniority rate of increase | ||
| Male | 0.6 - 5.9% | 0.6 - 5.6% |
| Female | 0.7 - 6.1% | 0.7 - 5.7% |
| Life expectancy at age 65 | ||
| Male | 22.9 years | 21.9 years |
| Female | 24.6 years | 23.7 years |
| Average retirement age | ||
| Group 1 | 60.1 years | 59.3 years |
| Group 2 | 62.1 years | 61.6 years |
We have reflected the impacts of the COVID-19 pandemic on the economic assumptions used in this report where relevant. Those impacts are explained in Appendix E. It is important to note that the pandemic is a very fluid situation that will likely continue to evolve for some time. We have estimated the impacts based on the information known at the time the report was prepared. The final impacts of this health and economic crisis will likely generate some differences in the future.
2. Financial Position of the SDB
The state of the Account as at 31 March 2020 was prepared using the Account balance described in Appendix B, the data described in Appendix C, the methodology described in Appendix D, and the assumptions described in Appendices E and F.
In this report Paid-up benefit refers to the $10,000 portion of the benefit for which monthly contributions are no longer required from either the participant or the government.
Table 3 presents the state of the account as at 31 March 2020. The results of the previous valuation are also shown for comparison purposes.
| 31 March 2020 | 31 March 2017 | |
|---|---|---|
| Account Balance | 3,880 | 3,627 |
| Liabilities | ||
| Paid-up Death Benefit | 965 | 771 |
| IBNRTable 3 footnote 1 | 31 | 29 |
| Total Liabilities | 996 | 800 |
| Actuarial Excess | 2,884 | 2,827 |
|
Table 3 Footnote
|
||
The table below presents the financial position as at the valuation date.
| 31 March 2020 | 31 March 2017 | |
|---|---|---|
| Actuarial excess (A) | 2,884 | 2,827 |
| Estimated benefits for next plan year (B) | 200 | 198 |
| Ratio of the actuarial excess over estimated benefits for next plan year (A/B) | 14.4 | 14.3 |
3. Legislated Contribution Rates
The aggregate amount of death benefit payments projected for plan year 2021 is $200.3 million, which is made up of $156.3 million in respect of the term insurance and $44.0 million in respect of the paid‑up insurance. In this report, term insurance means the basic coverage (two times salary) less 10% reduction per year from age 66 and less $10,000 paid-up insurance from age 65.
3.1 Paid-up Insurance
The estimated single premiumsFootnote 2 and the legislated contribution ratesFootnote 3 at age 65 for each $10,000 of paid-up insured benefit are shown in the table below.
| Single Premiums at Age 65 ($) | Legislated Contribution Rate ($) | |
|---|---|---|
| Male | 5,491 | 310 |
| Female | 5,229 | 291 |
The assumed mortality improvements and the projected increase in yield from 3.5% in plan year 2021 to 4.1% ultimately are expected to cause the projected single premium for the paid‑up death benefit to decrease over time. The projected single premium for male and female in plan year 2045 are $4,195 and $3,949, respectively.
3.2 Term Insurance
The total amounts of insurance coverage and benefits payable for plan year 2021 are projected to be $68,431 million and $156 million, respectively.
Non‑elective participants and elective participants in receipt of an immediate annuity or an annual allowance are required to contribute 15 cents per $1,000 of term insurance monthly. As a minimum, the government contribution credited monthly to the Account is equal to one‑twelfth of the total amount of term insurance proceeds payable during the month. Table 6 presents the monthly contribution and the cost rates for plan year 2021. It shows that contributions are 2.2 cents less than the monthly cost.
| Contribution | Total Cost | |||
|---|---|---|---|---|
| Participant | Government | Total | ||
| Monthly Rate | 15 | 1.8 | 16.8 | 19.0 |
As shown in Chart 2 , the projected montly cost in the 31 March 2020 report is significantly lower than in the previous valuation. This is mainly due to:
- a change in the mortality improvement rates,
- changes in demography.
Chart 2 - Projected Monthly Cost
(cents per $1,000 of term insurance)
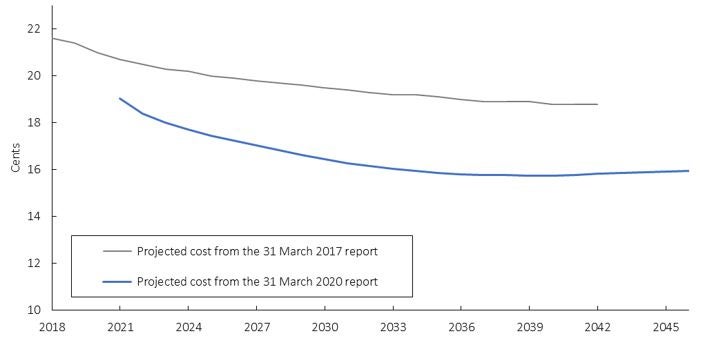
Graphic Description - Projected Monthly Cost
Line graphs comparing the projected monthly costs over time between the current and previous valuation report. Y-axis represents the monthly cost in cents per thousand dollar of term insurance. X-axis represents the plan year, starting in 2018 and ending in 2045.
The projected monthly cost for plan year 2021 is 19.0 cents per thousand dollar of term insurance compared to 20.7 cents in the previous report. The projected monthly cost decreases over time. As a result, by plan year 2045 the projected monthly cost is 15.9 cents per thousand dollars of term insurance representing a decrease of 2.9 cents from the 18.8 cents projected in the previous report.
The following table shows the projected monthly costs per $1,000 of term insurance by participant type for selected plan years.
| Participants | 2021 | 2025 | 2030 | 2035 | 2040 | 2045 |
|---|---|---|---|---|---|---|
| Non-elective | 9.3 | 8.6 | 8.5 | 8.4 | 8.3 | 8.3 |
| Elective | 57.2 | 55.7 | 54.7 | 51.7 | 49.3 | 49.9 |
| All | 19.0 | 17.5 | 16.4 | 15.9 | 15.8 | 15.9 |
The monthly cost per $1,000 of term insurance is projected to gradually decrease to 15.9 cents by plan year 2045 while the total contribution rate is projected to be 16.6 cents (15 cents from the participants and 1.6 cents from the government) in the same plan year. This results mainly from the following two factors:
- Lower mortality rates assumed for plan year 2045 in accordance with the mortality improvement rates shown in Table 32 applied to the current mortality rates shown in Table 31. This has the effect of decreasing the costs.
- Heavier weights at older ages on the distribution of non‑elective participants in plan year 2045 than the current weight. This has the effect of increasing the costs.
Altogether, the increased costs due to heavier weights at older ages is more than offset by the decreased costs due to assumed mortality improvements.
4. Reconciliation as at 31 March 2020
Table 8 illustrates the impact of the updated assumptions, intervaluation economic experience, demographic changes and changes in mortality assumption methodology since the last valuation report as at 31 March 2017.
In the intervaluation period, the non-elective population grew significantly more than expected. The higher proportion of non-elective members compared to the elective group resulted in a lower monthly cost than anticipated.
The main revision to the demographic assumptions is a change to the mortality improvement rates. The main revision to economic assumptions is a reduction of the real interest rates.
| Monthy Cost by $1,000 of term insurance (Cents) |
Actuarial Excess to Benefit Payments in Plan Year (Ratio) |
|
|---|---|---|
| Previous valuation as at 31 March 2017 | 20.7 | 14.3 |
| Change in methodology | 0.1 | 0.5 |
| Retroactive data correction | (0.1) | (0.1) |
| Demographic changes | (1.4) | (0.2) |
| Changes in Assumptions | ||
| Revision of economic assumptions | 0.3 | (0.4) |
| Revision of demographic assumptions | (0.6) | 0.3 |
| Valuation as at 31 March 2020 | 19.0 | 14.4 |
5. Sensitivity of Valuation Results
The following supplementary estimates indicate the degree to which the valuation results depend on some of the key assumptions. The table below presents the the effects on valuation results when key assumptions are varied.
| Actuarial liability ($ million) |
Effect | Actuarial Excess to Benefit Payments in Plan Year (Ratio) |
Effect | |
|---|---|---|---|---|
| Current Basis | 996 | 14.40 | ||
| Projected interest yields | ||||
| +1% | 882 | (114) | 14.96 | 0.56 |
| -1% | 1,134 | 138 | 13.70 | (0.70) |
| Mortality improvement | ||||
| - 0% | 1,016 | 20 | 14.29 | (0.11) |
| - Constant at plan year 2021 rates | 986 | (10) | 14.45 | 0.05 |
Differences between these results and those shown in the valuation can also serve as a basis for approximating the effect of other numerical variations in a key assumption to the extent that such effects are indeed linear.
Chart 3 below shows that lower (no mortality improvement – top dotted line) or higher (2021 constant mortality improvement – bottom continuous line) mortality improvement factors would have a significant impact on the monthly cost by $1,000 of term insurance. The chart also illustrates the smaller impact of population growth on that same ratio.
Chart 3 - Sensitivity of Projected Monthly Cost to Variation in select Demographic Assumptions
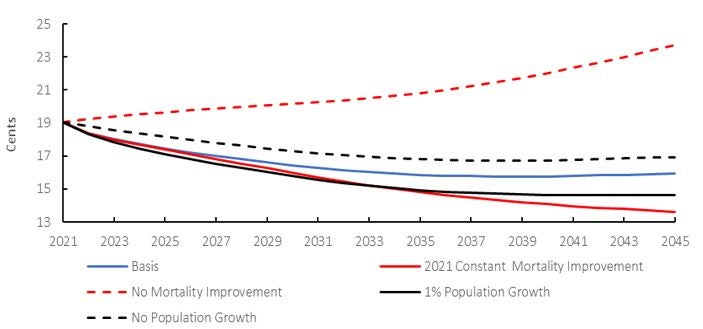
Graphic Description - Sensitivity of Projected Monthly Cost to Variation in select Demographic Assumptions
Line graphs comparing the five curves of monthly cost over time. These curves present the impact of variations in mortality improvement or population growth assumptions on the monthly cost. Y-axis represents the monthly cost in cents per thousand dollars of term insurance. X-axis represents the plan year, starting in 2021 and ending in 2045.
The top line shows a significant increase in the monthly cost when there is no mortality improvement. The bottom line shows a significant reduction in the monthly cost when the mortality improvement rates are held constant at the 2021 level. The second line from the top represents a slight increase in the monthly cost when the population growth assumption is 0%, while the second line from the bottom represents a slight decrease in the monthly cost when the population growth assumption is 1%. The middle line shows the monthly cost over time for the current valuation basis.
6. Actuarial Opinion
In our opinion, considering that this report was prepared pursuant to the Public Pensions Reporting Act,
- the valuation input data on which the valuation is based are sufficient and reliable for the purposes of the valuation;
- the assumptions used are individually reasonable and appropriate in aggregate for the purposes of the valuation; and
- the methods employed are appropriate for the purposes of the valuation; and
This report has been prepared, and our opinions given, in accordance with accepted actuarial practice in Canada. In particular, this report was prepared in accordance with the Standards of Practice (General Standards) published by the Canadian Institute of Actuaries.
We have reflected the impacts of the COVID-19 pandemic on the economic assumptions used in this report. It is important to note that the pandemic is a very fluid situation that will likely continue to evolve for some time. We have estimated the impacts based on the information known at the time the report was prepared. The final impacts of this health and economic crisis will likely generate some differences in the future.
To the best of our knowledge, after discussion with Public Services and Procurement Canada and the Treasury Board of Canada Secretariat, there were no subsequent events between the valuation date and the date of this report that would have a material impact on the results of this valuation.
Assia Billig, FCIA, FSA
Chief Actuary
Véronique Ménard, FCIA, FSA
Yann Bernard, FCIA, FSA
Ottawa, Canada
29 September 2021
Appendix A - Summary of Plan Provisions
The following is a summary description of the main provisions of the SDB plan established for public servants under Part II of the PSSA. This plan supplements benefits payable under the pension plan for the Public Service of Canada (PSPP) by providing a lump sum benefit upon the death of a plan participant.
A.1 Plan Participants
A.1.1 Non-elective Participants
The term non-elective participant means all contributors to the PSPP who are employed in the Public Service except employees of Crown corporations covered under other group life insurance plans.
A.1.2 Elective Participants
The term elective participant means all participants who have ceased to be employed in the Public Service following disability or retirement and have opted to continue their coverage under the SDB plan. Such right is limited to participants who, at the time they cease to be employed in the Public Service, have completed at least two years of continuous service in the Public Service or two years of participation in the SDB plan.
A non-elective participant who ceases employment and becomes entitled to an immediate annuity or annual allowance under the PSPP automatically becomes an elective participant. During the first 30 days as an elective participant, an individual has the right to opt out of the plan, effective on the 31st day.
A.2 Contributions
A.2.1 Non-elective Participants and Elective Participants in Receipt of an Immediate Annuity or an Annual Allowance
For non-elective participants as well as elective participants in receipt of an immediate annuity (disability or retirement) or an annual allowance under the PSPP, the rate of contribution is 15 cents per month for each $1,000 of death benefit. When these participants attain age 65 (or complete two years of service, if later), their contribution is reduced by $1.5 per month in recognition of the fact that $10,000 of basic benefit becomes paid-up (by the government) for the remaining lifetime of the participant.
A.2.2 Elective Participants Entitled to a Deferred Annuity
For elective participants entitled to a deferred annuity under the PSPP, the contribution rate set in the legislationFootnote 4 varies in accordance with the attained age of the participant, and the corresponding contributions become chargeable on the 30th day immediately following cessation of employment.
The contribution rates for selected ages are shown in the following table:
| Age | AnnualTable 10 footnote 1 | MonthlyTable 10 footnote 2 |
|---|---|---|
| 25 | 9.70 | 0.82 |
| 30 | 11.42 | 0.97 |
| 35 | 13.58 | 1.15 |
| 40 | 16.29 | 1.39 |
| 45 | 19.72 | 1.67 |
| 50 | 24.11 | 2.05 |
| 55 | 29.80 | 2.53 |
| 60 | 37.65 | 3.20 |
|
Table 10 Footnotes
|
||
A.2.3 Government
The government credits monthly to the Account an amount equal to one‑twelfth of the total amount of death benefits paid in the month.
Crown corporations and public boards whose employees are participants in the plan contribute at the rate of four cents per month for each $1,000 of death benefit.
When a participant, other than one entitled to a deferred annuity, reaches age 65 (or completes two years of service, if later), the government credits to the Account a single premium for the individual $10,000 paid‑up portion of basic benefit in respect of which contributions are no longer required from the participant.
The legislated amount of single premiumFootnote 5 for each such $10,000 paid‑up portion of basic benefit is shown in the following table and corresponds to one-twentieth of the single premium rate for $10,000 dollars of death benefit, computed on the basis of the Life Tables, Canada, 1950-1952 and interest at 4% per annum.
| Age Nearest Birthday | Male | Female |
|---|---|---|
| 65 | 310 | 291 |
| 66 | 316 | 298 |
| 67 | 323 | 306 |
| 68 | 329 | 313 |
| 69 | 336 | 320 |
| 70 | 343 | 328 |
| 71 | 349 | 335 |
| 72 | 356 | 342 |
| 73 | 362 | 349 |
| 74 | 369 | 356 |
| 75 | 375 | 363 |
Under the statutes, if for whatever reason the Account were to become exhausted, the government would then credit special contributions to the Account in an amount at least equal to the basic benefits then due but not paid by reason of such cash shortfall.
A.3 Amount of Basic Benefit
Subject to the applicable reductions described below, the lump sum benefit payable upon the death of a participant is equal to twice the participant’s current salary, the result being rounded to the next higher multiple of $1,000 if not already equal to such a multiple. For this purpose, the current salary of an elective participant is defined as the annual rate of pay at the time of cessation of employment in the Public Service.
The amount of basic benefit described above is reduced by 10% per year starting at age 66 until it would normally vanish at age 75. However, the amount of basic benefit cannot at any time be reduced below a basic floor value of $10,000 subject to the following exceptions:
- For those elective participants who had, upon cessation of employment prior to 5 October 1992, made an election to reduce their basic benefit to $500 and further had made a second election, within one year thereafter, to keep their basic benefit at $500, the floor value is $500 instead of $10,000. Such election is irrevocable.
- For non-elective participants, the amount of basic benefit cannot be reduced below the multiple of $1,000 equal to or next above one-third of the participant’s annual salary, even if the resulting amount is higher than $10,000.
- All participants aged between 61 and 70 prior to 1 October 1999 may elect to retain the 10% a year reduction schedule starting at age 61.
- For elective participants entitled to a deferred annuity, there is no coverage past age 75.
Upon ceasing to be employed in the Public Service, elective participants in receipt of an immediate annuity or in receipt of an annual allowance under the PSPP may opt to reduce their amount of basic benefit to $10,000.
Appendix B - Account Balance
B.1 Reconciliation of the Public Service Death Benefit Account
The Account, which forms part of the Public Accounts of Canada, records the transactions for the plan. No formal debt instrument has been issued to the Account by the government in recognition of the amounts therein. The Account is:
- credited with all contributions made by participants, Crown corporations and the government;
- credited with interest earnings every three months on the basis of the actual average yield for the same period on the combined Superannuation Accounts of the Public Service, Canadian Forces and Royal Canadian Mounted Police pension plans. These accounts generate interest earnings as though net cash flows were invested quarterly in 20‑year Government of Canada bonds issued at prescribed interest rates and held to maturity; and
- debited with basic benefit payments when they become due.
Table 12 shows the reconciliation of the balance of the Account from the last valuation date to the current valuation date. Since the last valuation, the Account balance has grown by $253 million (a 7% increase) to $3,880 million as at 31 March 2020. The net growth in the Account balance is to a large extent the result of interest credits made.
| Plan Year | 2018 | 2019 | 2020 | 2018-2020 |
|---|---|---|---|---|
| Opening Balance as at 1 April of the previous year | 3,626.9 | 3,714.7 | 3,799.9 | 3,626.9 |
| INCOME | ||||
| Employee Contributions | ||||
| Active members | ||||
| Public Service employees | 70.8 | 76.2 | 80.9 | 227.9 |
| Public Service corporations | 5.8 | 6.0 | 6.1 | 17.9 |
| Retired employees | 26.3 | 27.0 | 27.5 | 80.8 |
| Total Employee Contributions | 102.9 | 109.2 | 114.5 | 326.6 |
| Employer Contributions | ||||
| Public Service corporations | 1.5 | 1.6 | 1.6 | 4.7 |
| Death benefit - general | 11.9 | 12.0 | 12.5 | 36.4 |
| Death benefit - single premium $10,000 | 3.1 | 3.1 | 3.2 | 9.4 |
| Interest | 149.7 | 144.8 | 140.8 | 435.3 |
| Total Income | 269.1 | 270.7 | 272.6 | 812.4 |
| EXPENDITURES | ||||
| Benefits payments | ||||
| General | 142.4 | 143.8 | 149.7 | 435.9 |
| Life coverage for $10,000 | 38.5 | 41.3 | 42.5 | 122.3 |
| Other death benefit payments | 0.4 | 0.4 | 0.0 | 0.8 |
| Total Expenditures | 181.3 | 185.5 | 192.2 | 559.0 |
| Closing Balance as at 31 March of the plan year | 3,714.7 | 3,799.9 | 3,880.2 | 3,880.2 |
B.2 Rates of Interest
The following rates of interest on the Account by plan year were calculated using the foregoing entries.
| Plan Year | Interest |
|---|---|
| 2018 | 4.2% |
| 2019 | 4.0% |
| 2020 | 3.7% |
B.3 Sources of the Financial Data
The Account entries shown previously were taken from the Public Accounts of Canada.
Appendix C - Participant Data
C.1 Source of Participant Data
The valuation input data required in respect of contributors (both active and non-active) and pensioners are extracted from master computer files maintained by the Department of Public Services and Procurement Canada (PSPC).
The main valuation data file supplied by PSPC contained the historical status information on all participants up to 31 March 2020.
C.2 Validation of Participant Data
The participant data were validated with respect to the Actuarial Report on the Pension Plan for the Public Service of Canada as at 31 March 2020. Details of the data validation can be found in Appendix D of that report.
C.3 Participant Data Summary
Tables 14 to 18 on the following pages show the detailed participant data upon which this valuation is based.
| Male | Female | Total | |
|---|---|---|---|
| As at 31 March 2017 | 127,728 | 163,377 | 291,105 |
| Data corrections | 909 | 1,386 | 2,295 |
| Eligibility Change | 38 | 34 | 72 |
| New non-elective from | |||
| New non-elective | 36,137 | 47,373 | 83,510 |
| Rehired from cash-outs | 1,112 | 1,884 | 2,996 |
| Rehired from pensioners | 565 | 951 | 1,516 |
| Subtotal | 37,814 | 50,208 | 88,022 |
| Non-elective terminations | |||
| Disability | (557) | (1,290) | (1,847) |
| Deferred Annuity (DA) | (2,795) | (3,808) | (6,603) |
| Annuity (IA/AA)Table 14 footnote 1 | (11,147) | (14,147) | (25,294) |
| Death (no survivors) | (225) | (206) | (431) |
| Death (with survivors) | (351) | (284) | (635) |
| Contributor ROC or TV | (7,459) | (9,677) | (17,136) |
| Subtotal | (22,534) | (29,412) | (51,946) |
| As at 31 March 2020 | 143,955 | 185,593 | 329,548 |
|
Table 14 Footnote
|
|||
| Male | Female | Total | |
|---|---|---|---|
| As at 31 March 2017 | 96,767 | 83,472 | 180,239 |
| Data Corrections | (33) | (55) | (88) |
| New elective from | |||
| New non-elective | 11,551 | 15,254 | 26,805 |
| Rehired non-elective | - | - | - |
| Subtotal | 11,551 | 15,254 | 26,805 |
| Transfer status to | |||
| Non-elective | (44) | (50) | (94) |
| Terminations | |||
| Death | (9,527) | (4,779) | (14,306) |
| As at 31 March 2020 | 98,714 | 93,842 | 192,556 |
| AgeTable 16 footnote 2 | Number | Basic Benefits ($ thousands) | ||||
|---|---|---|---|---|---|---|
| Male | Female | Total | Male | Female | Total | |
| 15-19 | 64 | 61 | 125 | 6 | 6 | 12 |
| 20-24 | 3,754 | 5,145 | 8,899 | 622 | 839 | 1,461 |
| 25-29 | 11,044 | 16,078 | 27,122 | 2,240 | 3,191 | 5,431 |
| 30-34 | 14,516 | 20,157 | 34,673 | 3,337 | 4,473 | 7,810 |
| 35-39 | 18,857 | 26,078 | 44,935 | 4,778 | 6,307 | 11,085 |
| 40-44 | 20,967 | 29,317 | 50,284 | 5,687 | 7,495 | 13,183 |
| 45-49 | 20,595 | 27,305 | 47,900 | 5,794 | 7,156 | 12,950 |
| 50-54 | 19,946 | 25,484 | 45,430 | 5,718 | 6,637 | 12,355 |
| 55-59 | 19,437 | 21,590 | 41,027 | 5,503 | 5,404 | 10,907 |
| 60-64 | 10,232 | 10,562 | 20,794 | 2,854 | 2,526 | 5,380 |
| 65-69 | 3,507 | 3,038 | 6,545 | 831 | 613 | 1,444 |
| Above 69 | 1,036 | 778 | 1,814 | 5,503 | 69 | 185 |
| Total | 143,955 | 185,593 | 329,548 | 37,486 | 44,715 | 82,201 |
| Average | Male | Female | Total | |
|---|---|---|---|---|
| As at 31 March 2017 | Age | 46.4 | 44.7 | 45.5 |
| ServiceTable 16 footnote 2 | 14.3 | 13.2 | 13.7 | |
| Basic Benefit ($) | 164,040 | 150,011 | 156,166 | |
| As at 31 March 2020 | Age | 46.5 | 44.8 | 45.6 |
| Service | 14.0 | 12.9 | 13.4 | |
| Basic Benefit ($) | 173,733 | 160,719 | 166,386 | |
|
Table 16 Footnotes
|
||||
| Age | Number | Basic Benefits ($ thousands) | ||||
|---|---|---|---|---|---|---|
| Male | Female | Total | Male | Female | Total | |
| To 34 | 5 | 15 | 20 | 1 | 1,733 | 1,733 |
| 35- 39 | 36 | 97 | 133 | 5 | 12,564 | 12,569 |
| 40- 44 | 78 | 280 | 358 | 10,789 | 37,935 | 48,723 |
| 45- 49 | 171 | 549 | 720 | 24,157 | 75,281 | 99,438 |
| 50- 54 | 339 | 896 | 1,235 | 48,743 | 118,985 | 167,728 |
| 55- 59 | 795 | 1,764 | 2,559 | 111,490 | 229,275 | 340,765 |
| 60- 64 | 879 | 2,022 | 2,901 | 109,046 | 231,418 | 340,464 |
| 65- 69 | 901 | 1,513 | 2,414 | 77,135 | 124,457 | 201,592 |
| 70- 74 | 809 | 1,029 | 1,838 | 23,457 | 28,462 | 51,919 |
| 75- 79 | 524 | 575 | 1,099 | 5,240 | 5,750 | 10,990 |
| 80- 84 | 411 | 437 | 848 | 4,110 | 4,370 | 8,480 |
| 85- 89 | 241 | 234 | 475 | 2,410 | 2,340 | 4,750 |
| 90- 94 | 66 | 75 | 141 | 660 | 750 | 1,410 |
| 100-104 | 3 | 3 | 6 | 30 | 30 | 60 |
| 105-109 | 0 | 0 | 0 | 0 | 0 | 0 |
| Total | 5,285 | 9,527 | 14,812 | 417,542 | 873,729 | 1,128,808 |
| Average | Male | Female | Total | |
|---|---|---|---|---|
| As at 31 March 2017 | AgeTable 17 footnote 1 | 59.6 | 57.2 | 58.0 |
| Basic Benefit ($) | 74,815 | 86,873 | 82,278 | |
| As at 31 March 2020 | AgeTable 17 footnote 1 | 59.9 | 58.1 | 58.7 |
| Basic Benefit ($) | 80,020 | 91,711 | 87,539 | |
|
Table 17 Footnote
|
||||
| AgeTable 18 footnote 2 | Number | Basic Benefits ($ thousands) | ||||
|---|---|---|---|---|---|---|
| Male | Female | Total | Male | Female | Total | |
| 45- 49 | 1 | 6 | 7 | 156 | 1,059 | 1,215 |
| 50- 54 | 134 | 217 | 351 | 23,449 | 37,281 | 60,731 |
| 55- 59 | 4,231 | 7,096 | 11,327 | 815,716 | 1,191,882 | 2,007,598 |
| 60- 64 | 13,637 | 18,652 | 32,289 | 2,472,929 | 2,901,597 | 5,374,527 |
| 65- 69 | 20,238 | 22,308 | 42,546 | 2,742,045 | 2,569,637 | 5,311,682 |
| 70- 74 | 21,619 | 17,176 | 38,795 | 1,034,894 | 696,036 | 1,730,930 |
| 75- 79 | 14,985 | 8,910 | 23,895 | 149,850 | 89,100 | 238,950 |
| 80- 84 | 8,684 | 4,673 | 13,357 | 86,840 | 46,730 | 133,570 |
| 85- 89 | 5,949 | 2,900 | 8,849 | 59,490 | 29,000 | 88,490 |
| 90- 94 | 2,881 | 1,565 | 4,446 | 28,810 | 15,650 | 44,460 |
| 95- 99 | 937 | 707 | 1,644 | 9,370 | 7,070 | 16,440 |
| 100-104 | 131 | 97 | 228 | 1,310 | 970 | 2,280 |
| 105-109 | 2 | 8 | 10 | 20 | 80 | 100 |
| Total | 93,429 | 84,315 | 177,744 | 7,424,879 | 7,586,093 | 15,009,757 |
| Average | Male | Female | Total | |
|---|---|---|---|---|
| As at 31 March 2017 | AgeTable 18 footnote 2 | 64.7 | 63.2 | 64.0 |
| Basic Benefit ($) | 84,686 | 92,985 | 88,417 | |
| As at 31 March 2020 | AgeTable 18 footnote 2 | 65.5 | 64.2 | 64.9 |
| Basic Benefit ($) | 79,471 | 89,973 | 84,453 | |
|
Table 18 Footnotes
|
||||
Appendix D - Methodology
D.1 Account Balance
The balance of the Account forms part of the Public Accounts of Canada. The Account records the transactions for the plan, meaning that no debt instrument has been issued to the Account by the government in recognition of the amounts therein. The recorded balance is shown at the book value of the underlying notional bond portfolio described in Appendix B.
The Account balance corresponds to the cumulative historical excess of contributions and interest credits over basic benefit payments. The Account balance is accordingly projected to the end of a given plan year by adding to the Account at the beginning of that plan year the net income (i.e. the excess of contributions and interest credits over benefits) projected as described below for that plan year.
In the projection of the Account, no assumption was made regarding the expenses incurred for the administration of the plan. These expenses, which are not debited to the Account, are commingled with all other government charges.
D.2 Contributions
D.2.1 Participants
Participants' annual contributions are projected for a given plan year by multiplying:
-
the legislated annual contribution rate of $1.8 per $1,000 of coverage (equivalent to the monthly rate of 15 cents per $1,000 of coverage),
by
-
the aggregate of two times the salaries of participants projected for that plan year on an open-group basis,
less
-
10% per year reduction from age 65, and
-
10,000 paid-up coverage after age 65.
Non-elective participants’ salaries are projected for a given plan year using the assumed rates of increase described in Appendix E and the assumed seniority and promotional salary increases described in Table 20. Elective participants’ salaries are frozen at the time of retirement or disability and are not subject to further increases.
D.2.2 Government
The government's annual contribution is projected for a given plan year as the sum of:
-
one-twelfth of the amount of term insurance death benefits projected to be paid during that plan year,
and
-
the legislated single premiums in respect of relevant participants 65 years of age (or participants completing two years of service, if older).
D.2.3 Crown Corporations and Public Boards
Crown corporations’ and public boards’ annual contributions are projected for a given plan year by multiplying:
-
the legislated annual contribution rate of $0.48 per $1,000 of coverage (equivalent to the monthly rate of 4 cents per $1,000 of coverage),
by
-
the aggregate of two times the salaries of each participant who is employed by the Crown corporation or public board projected for that plan year on an open-group basis,
less
-
10% per year reduction from age 65, and
-
10,000 paid-up coverage after age 65.
D.2.4 Interest Credits
Annual interest credits are projected for a given plan year as the product of the yield projected for that plan year (shown in Appendix E) and the projected average Account balance in that plan year.
D.2.5 Basic Benefit Payments
The total amount of basic benefits (term and paid-up insurance) for a given plan year is projected as the total amount of insurance in force during that plan year multiplied by the mortality rates assumed to apply during that plan year. The amount of basic benefit in force depends on the salary projected to time of death. Salaries are projected for this purpose using the assumed rates of increase in salaries and the number of participants is projected on an open-group basis as described in Appendix F.
D.3 Liabilities
D.3.1 Paid-up Reserve
At the end of a given plan year, the liabilities associated with the individual $10,000 paid-up death benefit in force correspond to the amount which, together with interest at the projected yields, is sufficient to pay for each individual $10,000 paid-up death benefit projected payable on the basis of the assumed mortality rates.
D.3.2 IBNR and Pending Claims Reserves
On the basis of the plan's experience, the reserve at the end of a given plan year for claims incurred but not reported (IBNR) and for pending claims is set equal to one-sixth of the projected annual death benefits paid on average during the six previous plan years.
Appendix E - Economic Assumptions
The following economic assumptions are required for valuation purposes:
E.1 Level of Inflation
Price increases, as measured by changes in the Consumer Price Index (CPI), tend to fluctuate from year to year. In 2016, the Bank of Canada and the government renewed their commitment to keep inflation between 1% and 3% until the end of 2021. As a result of the COVID-19 pandemic, a slowdown in inflation is expected during plan year 2021. Based on economic forecasts, the CPI is expected to increase at a rate above 2% for the following two years and to revert to the Bank of Canada’s long-term target thereafter. It is assumed that the Bank of Canada will remain committed to meeting the mid-range 2% target. In this report, it is assumed that the level of inflation will increase from 0.7% in plan year 2021 to 2.3% in plan year 2022 and 2.2% in plan year 2023. The ultimate rate of 2.0% is reached in 2024. It is unchanged from the assumed rate in the previous valuation.
E.2 Employment Earnings Increases
The actual increase in employment earningsFootnote 6 for each plan year is based on recently approved contracts which apply to the majority of non-elective participants. Increases up to plan year 2022 are based on current collective agreements. Subsequent increases are based on average increases over recent rounds of collective bargaining and are assumed to gradually converge to the ultimate level in 2029. Over the long term, the annual increase in pensionable earnings is assumed to be 0.3% lower than the corresponding increase in the YMPE (unchanged from the previous valuation). This correspond to an ultimate value of 2.7% in 2029 and theafter (2.8% in the previous valuation for plan year 2024 and thereafter).
E.3 Investment-Related Assumptions
E.3.1 New Money Rate
The new money rate is the nominal yield on 10-year-plus Government of Canada bonds and is set for each year in the projection period. The real yield on 10-year-plus federal bonds is equal to the new money rate less the assumed rate of inflation.
During the last quarter of plan year 2020, the emerging COVID-19 pandemic marked the beginning of a severe humanitarian and economic shock. Many governments enacted unprecedented measures to support families and workers, and central banks reacted swiftly to support the economy and stabilize financial markets. In Canada, the net effect was a decrease in both short-term and long-term interest rates during the early months of the pandemic. This economic shock occurred in a context where interest rates were already considered low by historical standards and where many were already contemplating the prospects of a “low-for-long” interest rates environment. Consequently, the new money rate is assumed to be lower than in the previous valuation.
The annual nominal yield on 10-year-plus federal bonds is assumed to be 1.2% in plan year 2021. Then it is projected to increase gradually to its ultimate level of 4.1% in plan year 2034. The assumed rates over the short-term (2021-2025) are consistent with the average of private sector forecasts and take into account the recent market conditions. The ultimate level of 4.1% is equivalent to an ultimate real rate of 2.1%. The ultimate real yield was assumed to be 2.7% in 2027 in the previous valuation. The real new money rates over the plan years 2021 to 2033 are on average 1.3% lower than those assumed in the previous valuation over the same period.
E.3.2 Projected Yields on Account
The projected yields assumed for computing the present value of accrued benefits for service prior to 1 April 2000 and to be credited to the Superannuation Account are the projected annual yields on the combined book value of the Superannuation Accounts of the Public Service, Canadian Forces and RCMP pension plans.
The projected Account yields were determined by an iterative process involving the following:
- the combined notional bond portfolio of the three Superannuation Accounts as at the valuation date;
- the assumed future new money interest rates;
- the expected future benefits payable in respect of all pension entitlements accrued up to 31 March 2000;
- the expected future contributions for prior service elections made up to 31 March 2000; and
- the expected future administrative expenses,
taking into account that each quarterly interest credit to a Superannuation Account is calculated as if the principal at the beginning of a quarter remains unchanged during the quarter. The projected yield on the Account is 3.5% in plan year 2021. It is projected to reach a low of 2.4% in 2032 and to reach its ultimate value of 4.1% in 2052.
E.4 Summary of Economic Assumptions
The economic assumptions used in this report are summarized in the Table 19.
| Plan Year | CPI Increase | Average Earnings Increase of Non-Elective Participants |
Projected Yield on Account |
|---|---|---|---|
| 2021 | 0.7 | 1.5 | 3.5 |
| 2022 | 2.3 | 1.5 | 3.3 |
| 2023 | 2.2 | 2.0 | 3.1 |
| 2024 | 2.0 | 2.0 | 3.0 |
| 2025 | 2.0 | 2.0 | 2.9 |
| 2026 | 2.0 | 2.2 | 2.8 |
| 2027 | 2.0 | 2.4 | 2.8 |
| 2028 | 2.0 | 2.6 | 2.7 |
| 2029 | 2.0 | 2.7 | 2.6 |
| 2030 | 2.0 | 2.7 | 2.5 |
| 2035 | 2.0 | 2.7 | 2.4 |
| 2040 | 2.0 | 2.7 | 2.9 |
| 2045 | 2.0 | 2.7 | 3.8 |
| 2052+ | 2.0 | 2.7 | 4.1 |
Appendix F - Demographic and Other Assumptions
All contributors to the pension plan for the Public Service of Canada (PS) are covered by a supplementary death benefit as defined under Part II of the PSSA. Hence, given the size of the population subject to the PSSA, except where otherwise noted, the demographic assumptions are the same as those used in the Actuarial Report on the Pension Plan for the Public Service of Canada as at 31 March 2020. Details on these assumptions can be found in Appendix G of that report.
F.1 Demographic Assumptions
F.1.1 Seniority and Promotional Salary Increases
Seniority means length of service within a classification and promotion means moving to a higher paid classification.
The following table shows a sample of the assumed seniority and promotional salary increases.
| Years of Pensionable Service |
Male | Female |
|---|---|---|
| 0 | 5.9 | 6.1 |
| 1 | 5.5 | 5.7 |
| 2 | 5.0 | 5.2 |
| 3 | 4.4 | 4.6 |
| 4 | 3.8 | 4.0 |
| 5 | 3.3 | 3.5 |
| 6 | 3.0 | 3.1 |
| 7 | 2.7 | 2.9 |
| 8 | 2.5 | 2.7 |
| 9 | 2.3 | 2.5 |
| 10 | 2.1 | 2.4 |
| 15 | 1.5 | 1.7 |
| 20 | 1.2 | 1.4 |
| 25 | 1.0 | 1.2 |
| 30 | 0.9 | 1.0 |
F.1.2 New Participants
As the active population of the plan is expected to grow, new participants are projected to replace members that cease to be active as well as increase the number of participants over time.
The assumed percentage increases in the number of participants for each plan year are shown in the following table:
| Plan Year | Percentage |
|---|---|
| 2021 | 4.5 |
| 2022 | 2.0 |
| 2023 | 1.0 |
| 2024 | 0.7 |
| 2025+ | 0.6 |
New contributors are assumed to share the same characteristics as participants with less than one year of service at the valuation date. In particular they are assumed to have:
- The same average age,
- The same gender distribution, and
- The same average initial salary which is adjusted by the economic salary increase for plan year 2021 and beyond.
F.1.3 Pensionable Retirement
The following tables show a sample of the assumed rates of pensionable retirement.
| AgeTable 22 footnote 1 | Years of Pensionable Service | ||||||
|---|---|---|---|---|---|---|---|
| 2 | 5 | 10 | 20 | 29 | 30 | 35 | |
| 50 | 55 | 35 | 30 | 20 | 15 | 20 | 0 |
| 55 | 60 | 50 | 25 | 20 | 130 | 250 | 315 |
| 60 | 120 | 65 | 110 | 155 | 270 | 295 | 300 |
| 65 | 205 | 165 | 185 | 220 | 255 | 305 | 325 |
| 70 | 215 | 285 | 250 | 290 | 355 | 425 | 410 |
|
Table 22 Footnote
|
|||||||
| AgeTable 23 footnote 1 | Years of Pensionable Service | ||||||
|---|---|---|---|---|---|---|---|
| 2 | 5 | 10 | 20 | 29 | 30 | 35 | |
| 50 | 90 | 45 | 15 | 10 | 15 | 10 | 0 |
| 55 | 90 | 50 | 25 | 35 | 195 | 345 | 490 |
| 60 | 130 | 75 | 125 | 225 | 360 | 390 | 335 |
| 65 | 230 | 215 | 245 | 270 | 245 | 285 | 455 |
| 70 | 195 | 195 | 290 | 380 | 365 | 310 | 490 |
|
Table 23 Footnote
|
|||||||
| AgeTable 24 footnote 1 | Years of Pensionable Service | ||||||
|---|---|---|---|---|---|---|---|
| 2 | 5 | 10 | 20 | 29 | 30 | 35 | |
| 55 | 30 | 40 | 25 | 20 | 20 | 20 | 15 |
| 60 | 95 | 60 | 45 | 55 | 160 | 210 | 345 |
| 65 | 170 | 170 | 220 | 295 | 400 | 455 | 425 |
| 70 | 215 | 285 | 250 | 290 | 355 | 425 | 410 |
|
Table 24 Footnote
|
|||||||
| AgeTable 25 footnote 1 | Years of Pensionable Service | ||||||
|---|---|---|---|---|---|---|---|
| 2 | 5 | 10 | 20 | 29 | 30 | 35 | |
| 55 | 45 | 35 | 25 | 20 | 20 | 20 | 15 |
| 60 | 95 | 75 | 65 | 80 | 210 | 300 | 445 |
| 65 | 195 | 165 | 290 | 380 | 440 | 525 | 425 |
| 70 | 195 | 195 | 290 | 380 | 365 | 310 | 325 |
|
Table 25 Footnote
|
|||||||
| AgeTable 26 footnote 1 | Years of Pensionable Service | ||||||
|---|---|---|---|---|---|---|---|
| 2 | 5 | 10 | 19 | 20 | 30 | 35 | |
| 40 | - | - | - | - | 10 | - | - |
| 45 | - | - | - | - | 5 | 20 | - |
| 50 | 75 | 40 | 25 | 10 | 10 | 130 | 160 |
| 55 | 75 | 50 | 25 | 25 | 25 | 210 | 180 |
| 60 | 125 | 70 | 120 | 155 | 195 | 345 | 320 |
| 65 | 215 | 190 | 210 | 260 | 245 | 295 | 390 |
|
Table 26 Footnote
|
|||||||
F.1.4 Disability Retirement
The following table shows a sample of the assumed rates of disabled retirement.
| Age | Male | Female |
|---|---|---|
| 25 | 0.00 | 0.00 |
| 35 | 0.38 | 0.89 |
| 45 | 1.44 | 2.76 |
| 55 | 4.06 | 7.07 |
| 59 | 4.95 | 7.44 |
| 60 | 8.02 | 10.76 |
| 61 | 9.72 | 12.01 |
| 62 | 11.70 | 13.20 |
| 63 | 13.69 | 14.20 |
| 64 | 14.69 | 15.20 |
|
Table 27 Footnote
|
||
F.1.5 Withdrawal
Withdrawal with less than two years of service includes termination of employment for any reason. Withdrawal with two or more years of service means termination of employment for reasons other than death, disability or retirement with an immediate annuity or an annual allowance. Tables 28 to 30 provide samples of the assumed rates of withdrawal.
| AgeTable 28 footnote 1 | Years of Pensionable Service | ||||||
|---|---|---|---|---|---|---|---|
| 0 | 1 | 5 | 10 | 15 | 20 | 21 + | |
| 20 | 375 | 375 | - | - | - | - | - |
| 25 | 150 | 135 | 35 | - | - | - | - |
| 30 | 115 | 105 | 35 | 20 | - | - | - |
| 35 | 105 | 90 | 25 | 20 | 10 | - | - |
| 40 | 105 | 100 | 45 | 10 | 10 | 5 | - |
| 45 | 115 | 100 | 35 | 25 | 15 | 5 | - |
| 50 | 140 | 125 | 30 | 15 | 10 | 5 | - |
| 54 | 160 | 145 | 31 | 15 | 10 | 5 | - |
| 60 | 226 | 215 | - | - | - | - | - |
|
Table 28 Footnote
|
|||||||
| AgeTable 29 footnote 1 | Years of Pensionable Service | ||||||
|---|---|---|---|---|---|---|---|
| 0 | 1 | 5 | 10 | 15 | 20 | 21 + | |
| 20 | 365 | 365 | - | - | - | - | - |
| 25 | 145 | 130 | 20 | - | - | - | - |
| 30 | 115 | 105 | 20 | 10 | - | - | - |
| 35 | 110 | 95 | 25 | 10 | 5 | - | - |
| 40 | 110 | 100 | 30 | 15 | 10 | 5 | - |
| 45 | 125 | 110 | 25 | 20 | 10 | 5 | - |
| 50 | 160 | 140 | 35 | 15 | 10 | 5 | - |
| 54 | 190 | 165 | 40 | 20 | 15 | 10 | - |
| 60 | 250 | 230 | - | - | - | - | - |
|
Table 29 Footnote
|
|||||||
The assumed rates of withdrawal are the same for actual operational contributors as well as for deemed operational contributors.
| Years of Pensionable Service |
Unisex |
|---|---|
| 0 | 41 |
| 1 | 36 |
| 2 | 30 |
| 3 | 21 |
| 4 | 19 |
| 5 | 16 |
| 10 | 10 |
| 15 | 11 |
| 19 | 8 |
| 20 + | - |
F.1.6 Elective Participants Entitled to a Deferred Annuity
Due to their negligible impact on costs and liabilities, actual and future deferred annuitants are not taken into consideration for the purpose of this valuation.
F.1.7 Mortality
The following table provides samples of the assumed mortality rates.
| AgeTable 31 footnote 1 | Non-Elective Participants and Elective Retired Participants | Elective Disabled Participants | |||||
|---|---|---|---|---|---|---|---|
| Male | Female | Male | Female | ||||
| 30 | 0.3 | 0.2 | 5.6 | 2.3 | |||
| 40 | 0.4 | 0.4 | 10.2 | 4.4 | |||
| 50 | 1.1 | 0.9 | 10.3 | 8.5 | |||
| 60 | 3.9 | 2.8 | 20.0 | 11.8 | |||
| 70 | 11.8 | 9.4 | 36.1 | 23.7 | |||
| 80 | 39.9 | 28.5 | 79.3 | 56.3 | |||
| 90 | 141.9 | 113.9 | 186.5 | 150.9 | |||
| 100 | 358.1 | 323.0 | 412.4 | 423.3 | |||
| 110 | 500.0 | 500.0 | 500.0 | 500.0 | |||
|
Table 31 Footnote
|
|||||||
Mortality rates are expected to reduce over time. A sample of assumed mortality improvement rates is shown in the following table.
| AgeTable 32 footnote 1 | Initial and Ultimate Plan Year Mortality Improvement Rates (%) | |||
|---|---|---|---|---|
| Male | Female | |||
| 2021 | 2037 + | 2021 | 2037 + | |
| 30 | 1.10 | 0.80 | 0.59 | 0.80 |
| 40 | 1.57 | 0.80 | 1.42 | 0.80 |
| 50 | 1.49 | 0.80 | 0.98 | 0.80 |
| 60 | 2.18 | 0.80 | 1.65 | 0.80 |
| 70 | 2.07 | 0.80 | 1.49 | 0.80 |
| 80 | 2.08 | 0.80 | 1.50 | 0.80 |
| 90 | 1.83 | 0.65 | 1.66 | 0.65 |
| 100 | 0.62 | 0.29 | 0.67 | 0.29 |
| 110+ | 0.03 | 0.01 | 0.03 | 0.01 |
|
Table 32 Footnote
|
||||
F.2 Election Proportions
The following table provides a sample of the assumed rates of non-elective participants who opt to continue coverage under the plan at retirement. A non-elective participant who becomes disabled is assumed to always opt to continue the coverage.
| AgeTable 33 footnote 1 | Pensionable RetirementTable 33 footnote 2 | |
|---|---|---|
| Male | Female | |
| 45 | 0.08 | 0.00 |
| 50 | 0.29 | 0.28 |
| 55 | 0.79 | 0.82 |
| 60 | 0.91 | 0.93 |
| 65 | 0.93 | 0.94 |
| 70 | 0.95 | 1.00 |
| 71+ | 1.00 | 1.00 |
|
Table 33 Footnotes
|
||
F.3 Other Assumptions
F.3.1 Option to Reduce Coverage to $10,000
The valuation data indicates that the proportion of elective participants opting to reduce their basic benefit to $10,000 is negligible. Accordingly, no elective participants were assumed to make such an option.
F.3.2 Option to Continue the Annual 10% Reduction from Age 61
Bill C-78 introduced this option to participants effective 1 October 1999. Election of this option by participants would have a positive effect on the plan’s actuarial excess. The valuation data indicates that approximately 2.3% of participants have opted to continue their 10% annual reduction from age 61 instead of age 66. Accordingly, no participants were assumed to make such an election.
Appendix G - Acknowledgements
The Superannuation Directorate of Public Services and Procurement Canada provided the data on plan participants.
The following individuals were instrumental in the preparation of this report:
- Linda Benjauthrit, ACIA, ASA
- Mathieu Desy, FCIA, FSA, CFA
- Christopher Dieterle, FCIA, FSA
- Laurence Frappier, FCIA, FSA
- Guillaume Lépine-Mathieu, ACIA, ASA
- Kelly Moore
- Mieke Steenbakkers Lucuik
Footnotes
- Footnote 1
-
Any reference to a given plan year in this report should be taken as the 12-month period ending 31 March of the given year.
- Footnote 2
-
The single premium is the present value of the paid-up death benefit for a member aged 65.
- Footnote 3
-
The contribution rates are equal to the legislated single premium indicated in the Schedule II of the PSSA.
- Footnote 4
-
Contributions for elective participants entitled to a deferred annuity are disclosed in Schedule I of the Supplementary Death Benefit Regulations.
- Footnote 5
-
The legislated single premiums per $10,000 of Basic Benefit are disclosed in Schedule II of the PSSA.
- Footnote 6
-
Exclusive of seniority and promotional increases.