19th Actuarial Report - Pension plan for the Royal Canadian Mounted Police as at 31 March 2018
Accessibility statement
The Web Content Accessibility Guidelines (WCAG) defines requirements for designers and developers to improve accessibility for people with disabilities. It defines three levels of conformance: Level A, Level AA, and Level AAA. This report is partially conformant with WCAG 2.0 level AA. If you require a compliant version, please contact webmaster@osfi-bsif.gc.ca.
The Honourable Joyce Murray, P.C., M.P.
President of the Treasury Board
Ottawa, Canada
K1A 0R5
Dear Minister:
Pursuant to section 6 of the Public Pensions Reporting Act, I am pleased to submit the report on the actuarial review as at 31 March 2018 of the pension plan for the Royal Canadian Mounted Police. This actuarial review is in respect of pension benefits and contributions which are defined by Parts I, III, and IV of the Royal Canadian Mounted Police Superannuation Act, the Special Retirement Arrangements Act and the Pension Benefits Division Act.
Yours sincerely,
Assia Billig, FCIA, FSA
Chief Actuary
Office of the Chief Actuary
Table of contents
Tables
- Table 1 - Ultimate Best-Estimate Economic Assumptions
- Table 2 - Main Results as at 31 March 2018
- Table 3 - RCMPSA Current Service Cost on a Calendar Year Basis
- Table 4 - RCA Current Service Cost on a Calendar Year Basis
- Table 5 - State of the Superannuation Account
- Table 6 - Financial Position – Pension Fund
- Table 7 - Reconciliation of RCMPSA Financial Position
- Table 8 - Experience Gains and Losses
- Table 9 - Revision of Actuarial Assumptions
- Table 10 - Current Service Cost for Plan Year 2019
- Table 11 - Reconciliation of RCMPSA Current Service Cost
- Table 12 - Member Contribution Rates
- Table 13 - Projection of Current Service Cost on a Plan Year Basis
- Table 14 - Pension Fund Administrative Expenses
- Table 15 - Estimated Contributions for Prior Service Elections
- Table 16 - Sensitivity of Valuation Results to Variations in Longevity Improvement Factors
- Table 17 - Sensitivity of Valuation Results to Variations in Key Economic Assumptions
- Table 18 - State of the RCA Account
- Table 19 - RCA – Current Service Cost
- Table 20 - Estimated Government Cost
- Table 21 - Estimated Government Credit
- Table 22 - Member Contribution Rates
- Table 23 - Reconciliation of Balances in Superannuation Account
- Table 24 - Reconciliation of Balances in Pension Fund
- Table 25 - Reconciliation of Balances in RCA Account
- Table 26 - Interest Earnings/Rates of Return
- Table 27 - Summary of Membership Data
- Table 28 - Reconciliation of Membership
- Table 29 - Reconciliation of Contributors
- Table 30 - Reconciliation of Retirement Pensioners in Pay
- Table 31 - Reconciliation of Disability Pensioners
- Table 32 - Reconciliation of Deferred Pensioners
- Table 33 - Actuarial Value of Pension Fund Assets
- Table 34 - Asset Mix
- Table 35 - Real Rate of Return by Asset Class
- Table 36 - Rates of Return on Assets in Respect of the Pension Fund
- Table 37 - Transfer Value Real Interest Rates
- Table 38 - Economic Assumptions
- Table 39 - Sample of Assumed Seniority and Promotional Salary Increases
- Table 40 - Assumed Annual Increases in Number of Contributors
- Table 41 - Sample of Assumed Rates of Pensionable Retirement – Regular Members
- Table 42 - Sample of Assumed Rates of Pensionable Retirement – Civilian Members
- Table 43 - Sample of Assumed Rates of Pensionable Disability
- Table 44 - Sample of Assumed Withdrawal Rates
- Table 45 - Sample of Assumed Rates of Mortality
- Table 46 - Sample of Assumed Rates of Mortality For Disabled Members
- Table 47 - Sample of Assumed Longevity Improvement Factors
- Table 48 - Life Expectancy of Regular Member Contributors and Healthy Pensioners
- Table 49 - Life Expectancy of Civilian Member Contributors and Healthy Pensioners
- Table 50 - Life Expectancy at Age 60 as at 31 March 2018
- Table 51 - Assumptions for Survivor Spouse Allowances
- Table 52 - Assumptions for Survivor Child Allowances
- Table 53 - Impact of Various Investment Policies
- Table 54 - Median and 10% Downside Returns, Funding Ratio and Contributions for Various Portfolios
- Table 55 - Tail-Event Portfolio Returns
- Table 56 - Sensitivity of the Projected Surplus (Deficit) as at 31 March 2021
- Table 57 - Impact on the Superannuation Account and the Pension Fund of Prolonged Low Bond Yields
- Table 58 - Male Regular Member Contributors
- Table 59 - Female Regular Member Contributors
- Table 60 - Male Civilian Member Contributors
- Table 61 - Female Civilian Member Contributors
- Table 62 - Male Former Regular Member Retirement Pensioners in Pay
- Table 63 - Male Former Regular Member Disabled Pensioners in Pay
- Table 64 - Female Former Regular Member Retirement Pensioners in Pay
- Table 65 - Female Former Regular Member Disabled Pensioners in Pay
- Table 66 - Male Former Civilian Member Retirement Pensioners in Pay
- Table 67 - Male Former Civilian Member Disabled Pensioners in Pay
- Table 68 - Female Former Civilian Member Retirement Pensioners in Pay
- Table 69 - Female Former Civilian Member Disabled Pensioners in Pay
- Table 70 - Female Eligible Spouses
- Table 71 - Male Eligible Spouses
- Table 72 - Children
- Table 73 - Sample of Mortality Rates for the Calculation of Instalments Applicable Before Civilian Members Transfer
- Table 74 - Sample of Mortality Rates for the Calculation of Instalments Applicable After Civilian Members Transfer
- Table 75 - CM Transfer - Projected Actuarial Liabilities as at 21 May 2020
- Table 76 - CM Transfer - RCMPSA Current Service Cost on a Calendar Year Basis before transfer of CMs
- Table 77 - CM Transfer - RCMPSA Current Service Cost on a Calendar Year Basis after transfer of CMs
1. Executive Summary
This actuarial report on the pension plan for the Royal Canadian Mounted Police (RCMP pension plan) was made pursuant to the Public Pensions Reporting Act (PPRA).
This actuarial valuation is as at 31 March 2018 and is in respect of pension benefits and contributions defined by Parts I, III, and IV of the Royal Canadian Mounted Police Superannuation Act (RCMPSA), the Special Retirement Arrangements Act (SRAA), which covers the Retirement Compensation Arrangement (RCA), and by the Pension Benefits Division Act (PBDA).
The previous actuarial report was prepared as at 31 March 2015. The date of the next periodic review is scheduled to occur no later than 31 March 2021.
1.1 Purpose of Actuarial Report
The purpose of this actuarial valuation is to determine the state of the Royal Canadian Mounted Police (RCMP) Superannuation Account and RCA Account, the financial position of the RCMP Pension Fund and the projected current service costs of the RCMP Pension Fund and RCA Account as well as to assist the President of the Treasury Board in making informed decisions regarding the financing of the government's pension benefit obligations. This report may not be suitable for another purpose.
1.2 Valuation Basis
This report is based on pension benefit provisions enacted by legislation, which are summarized in Appendices A and B.
The Royal Canadian Mounted Police Superannuation Act was amended by Bill C-97 which received Royal Assent on 21 June 2019. The amendment modified the rule regarding the non-permitted surplus, increasing the permitted surplus from 10% to 25% of liabilities. This change in legislation has no impact on this actuarial valuation.
The Funding Policy for the Public Sector Pension Plans (Funding Policy) was approved by the Treasury Board in 2018. The policy provides guidance and rules to support prudent governance of the plansFootnote 1 and ensures that sufficient assets are accumulated to meet the cost of the accrued pension benefits. The methods, assumptions and results of this actuarial valuation are consistent with the provisions of the Funding Policy.
As a result of amendments contained in the Economic Action Plan 2014 Act, No. 2, it is expected that active RCMP Civilian Members will become Public Service Employees under the Public Service Employment Act and will join the pension plan for the Public Service of Canada (PS pension plan). All benefits accrued under the RCMP pension plan for the affected members will be transferred to the PS pension plan. Although the date on which active RCMP Civilian Members will be deemed as Public Service Employees is still not known for sure, it is expected to be as at 21 May 2020. With the exception of Appendix M, all numbers shown in this report exclude the impact of the transfer of active RCMP Civilian Members to the PS pension plan. Appendix M shows the impact of the expected transfer on the projected actuarial liabilities and current service costs.
Member contribution rates for calendar years 2019 to 2021 (as approved by Treasury Board) and for calendar years 2022 and beyond (estimated) have been updated since the last valuation and are assumed to be equal to the contribution rates of Group 1 contributors under the pension plan for the Public Service of Canada (PS pension plan).
The financial data on which this valuation is based are composed of:
-
The Pension Fund comprised of invested assets that the government has earmarked for the payment of benefits for service since 1 April 2000;
-
the Superannuation Account established to track the government's pension benefit obligations for service prior to 1 April 2000; and
-
the RCA Account established to track benefits in excess of those that can be provided under the Income Tax Act limits for registered pension plans.
These pension assets and account balances are summarized in Appendix C.
The membership data are provided by the Department of Public Services and Procurement Canada (PSPC). Membership data and tests performed on them are summarized in Appendix D.
The valuation was prepared using accepted actuarial practices in Canada and is based on methods and assumptions summarized in Appendices E to H.
All actuarial assumptions used in this report are best-estimate assumptions and do not include any margin for adverse deviations. They are independently reasonable and appropriate in aggregate for the purposes of the valuation at the date of this report.
Actuarial assumptions used in the previous report were revised based on economic trends and demographic experience. A complete description of the assumptions is shown in Appendices F to H. A summary of the ultimate economic assumptions used in this report and those used in the previous report is shown in the following table.
| 31 March 2018 | 31 March 2015 | |
|---|---|---|
| Assumed level of inflation | 2.0% | 2.0% |
| Real increase in average pensionable earnings | 0.7% | 0.9% |
| Real increase in YMPE and MPETable 1 footnote * | 1.0% | 1.1% |
| Real rate of return on the Pension Fund | 4.0% | 4.1% |
| Real projected yield on the Superannuation Account | 2.6% | 2.8% |
| Real projected yield on the RCA AccountTable 1 footnote ** | 2.6% | 1.4% |
Table 1 Footnotes
|
||
1.3 Main Findings
| Superannuation Account |
Pension Fund | RCA Account | |
|---|---|---|---|
| Financial Position | |||
| Recorded Balance/Actuarial Value of Assets | 13,123 | 10,293 | 70 |
| Actuarial Liability | 14,009 | 9,721 | 54 |
| Actuarial Excess(Shortfall)/Surplus(Deficit) | (886) | 572 | 16 |
| Current Service Costs for Calendar Year 2020 | |||
| Member Contributions | - | 234 | 0.22 |
| Government Current Service Cost | - | 287 | 0.50 |
| Total Current Service Cost/Credit | - | 521 | 0.72 |
| Special Credits/Payments in Plan Year 2020 | 956 | - | - |
Table 2 Footnotes
|
|||
1.3.1 Superannuation Account (Service prior to 1 April 2000)
As at 31 March 2018, the recorded balance of the Superannuation Account is $13,123 million and the actuarial liability for service priorFootnote 2 to 1 April 2000 is $14,009 million. The resulting actuarial shortfall is $886 million.
In accordance with the RCMPSA, the actuarial shortfall could be amortized over a maximum period of 15 years beginning on 31 March 2020. If the shortfall is amortized over the maximum period, 15 equal annual credits of $79 million could be made to the Superannuation Account. The time, manner and amount of such credits are to be determined by the President of the Treasury Board.
It is expected that the government will eliminate the actuarial shortfall of the Superannuation Account by making a one-time credit of $956 million as at 31 March 2020 that takes into account the interest on the shortfall accumulated from 31 March 2018.
1.3.2 Pension Fund (Service since 1 April 2000)
1.3.2.1 Current Service Cost
The RCMPSA total current service cost, borne jointly by the contributors and the government, is $521 million for calendar year 2020. The estimated member contributions are $234 million and the estimated government contributions are $287 million for calendar year 2020. The Pension Fund's expected administrative expenses of $5 million are included in the total current service cost for calendar year 2020.
Table 3 presents the projected current service cost in millions of dollars and expressed as a percentage of the expected pensionable payrollFootnote 3 for the three calendar years following the expected laying date of this report. The ratio of government current service cost to contributor current service cost is also shown. Projected current service costs shown in this table are based on the member contribution rates shown in Section 2.3.2.
| Calendar Year | Current Service Cost ($ millions) |
Current Service Cost (% of pensionable payroll) |
Ratio of Government to Contributor Current Service Cost | ||||
|---|---|---|---|---|---|---|---|
| Contributors | Government | Total | Contributors | Government | Total | ||
| 2020 | 234 | 287 | 521 | 10.43 | 12.81 | 23.24 | 1.23 |
| 2021 | 238 | 294 | 532 | 10.38 | 12.86 | 23.24 | 1.24 |
| 2022 | 242 | 303 | 545 | 10.33 | 12.95 | 23.28 | 1.25 |
1.3.2.2 Financial Position and Amortization of Actuarial Surplus (Deficit)
As at 31 March 2018, the actuarial value of the assets in respect of the Pension Fund is $10,293 million and the actuarial liability is $9,721 million, resulting in an actuarial surplus of $572 million. No special payments are required.
1.3.3 RCA
As at 31 March 2018, the balance of the RCA Account is $70 million and the actuarial liability is $54 million resulting in an actuarial excess of $16 million.
The SRAA does not allow for an adjustment to be made to the RCA Account to track the actuarial liability when there is an actuarial excess.
The RCA total current service cost, borne jointly by the contributors and the government, is $720,000 for calendar year 2020. The estimated member contributions are $220,000 and the estimated government costs are 2.29 times the members' contributions, i.e. $500,000 for calendar year 2020. Table 4 presents the projected current service cost expressed as a percentage of the expected pensionable payroll and in millions of dollars for the three calendar years following the expected laying date of this report. The ratio of government current service cost to contributor current service cost is also shown.
| Calendar Year | Current Service Cost ($ millions) |
Current Service Cost (% of pensionable payroll) |
Ratio of Government to Contributor Current Service Cost Table 4 footnote * |
||||
|---|---|---|---|---|---|---|---|
| Contributors | Government | Total | Contributors | Government | Total | ||
| 2020 | 0.22 | 0.50 | 0.72 | 0.01 | 0.02 | 0.03 | 2.29 |
| 2021 | 0.22 | 0.51 | 0.74 | 0.01 | 0.02 | 0.03 | 2.29 |
| 2022 | 0.23 | 0.53 | 0.75 | 0.01 | 0.02 | 0.03 | 2.29 |
Table 4 Footnotes
|
|||||||
2. Valuation Results
This report is based on pension benefit provisions enacted by legislation, summarized in Appendices A and B, and the financial and membership data, summarized in Appendices C and D. The valuation was prepared using accepted actuarial practices in Canada as well as methods and assumptions summarized in Appendices E to H. Emerging experience differing from the corresponding assumptions will result in gains or losses to be revealed in subsequent reports.
2.1 RCMPSA – Financial Position
Beginning on 1 April 2000, member and government contributions to the RCMP pension plan are no longer credited to the RCMP Superannuation Account. Rather, they are credited to the RCMP Pension Fund, and the total amount of contributions net of benefits paid and administrative expenses is transferred to the Public Sector Pension Investment Board (PSPIB) and invested in the financial markets. The valuation results of this section show the financial position for both RCMPSA financing arrangements as at 31 March 2018. The results of the previous valuation are also shown for comparison.
2.1.1 State of the Superannuation Account
| 31 March 2018 | 31 March 2015 | |
|---|---|---|
| Recorded balance | 13,116 | 13,197 |
| Present value of prior service contributions | 7 | 6 |
| Total Recorded Balance | 13,123 | 13,203 |
| Actuarial Liability | ||
| Regular Members | ||
| Contributors | 1,578 | 2,368 |
| Retirement pensioners | 9,466 | 8,452 |
| Disability pensioners | 1,241 | 1,008 |
| Surviving dependents | 657 | 542 |
| Civilian Members | ||
| Contributors | 136 | 215 |
| Retirement pensioners | 706 | 630 |
| Disability pensioners | 99 | 89 |
| Surviving dependents | 51 | 34 |
| Administrative expenses | 74 | 90 |
| Outstanding payments | 1 | - |
| Total Actuarial Liability | 14,009 | 13,428 |
| Actuarial Excess/(Shortfall) | (886) | (225) |
In accordance with the RCMPSA, the actuarial shortfall of $886 million could be amortized over a maximum period of 15 years beginning on 31 March 2020. If the shortfall is amortized over the maximum period, 15 equal annual credits of $79 million could be made to the Superannuation Account. The time, manner and amount of such credits are to be determined by the President of the Treasury Board.
It is expected that the government will eliminate the actuarial shortfall of the Superannuation Account by making a one-time credit of $956 million as at 31 March 2020 that takes into account the interest on the shortfall accumulated from 31 March 2018.
2.1.2 Financial Position of the Pension Fund
| 31 March 2018 | 31 March 2015 | |
|---|---|---|
| Assets | ||
| Market value of assets | 11,097 | 8,082 |
| Actuarial smoothing adjustment | (821) | (809) |
| Present value of prior service contributions | 17 | 13 |
| Total Actuarial Value of Assets | 10,293 | 7,286 |
| Actuarial Liability | ||
| Regular Members | ||
| Contributors | 5,493 | 4,613 |
| Retirement pensioners | 2,302 | 1,476 |
| Disability pensioners | 644 | 374 |
| Surviving dependents | 50 | 29 |
| Civilian Members | ||
| Contributors | 826 | 715 |
| Retirement pensioners | 308 | 189 |
| Disability pensioners | 78 | 39 |
| Surviving dependents | 9 | 5 |
| Outstanding payments | 11 | - |
| Total Actuarial Liability | 9,721 | 7,440 |
| Actuarial Surplus/(Deficit) | 572 | (154) |
As at 31 March 2018, the actuarial value of the assets in respect of the Pension Fund is $10,293 million and the actuarial liability is $9,721 million, resulting in an actuarial surplus of $572 million. No special payments are required.
If there exists a non permitted surplusFootnote 4 in the Pension Fund, no further government contributions for current service cost are permitted until, in the opinion of the President of the Treasury Board, the non-permitted surplus no longer exists. The Treasury Board can decide to take further action such as a temporary reduction in employee contributions or a transfer of the non-permitted surplus to the Consolidated Revenue FundFootnote 5 based on the recommendation of the President of the Treasury Board after consultation with the Minister. The results of this valuation do not indicate the existence of a non-permitted surplus as at 31 March 2018.
2.2 RCMPSA – Reconciliation of the Changes in Financial Positions
Table 7 presents the reconciliation of the changes in the financial positions of the Superannuation Account and the Pension Fund. Explanations of the elements largely responsible for the changes follow the table.
| Superannuation Account Actuarial Excess/(Shortfall) | Pension Fund Actuarial Surplus/(Deficit) | |
|---|---|---|
| As at 31 March 2015 | (225) | (154) |
| Recognized investment gains as at 31 March 2015 | - | 809 |
| Revised Initial Financial Position as at 31 March 2015 | (225) | 655 |
| Expected interest on financial position | (32) | 94 |
| Special credits / payments | 257 | 100 |
| Data corrections | - | 16 |
| Experience gains and (losses) | (53) | 815 |
| Revision of actuarial assumptions | (833) | (286) |
| Unrecognized investment gains as at 31 March 2018 | - | (821) |
| As at 31 March 2018 | (886) | 572 |
2.2.1 Recognized Investment Gains as at 31 March 2015
An actuarial asset valuation method that minimizes the impact of short-term fluctuations in the market value of assets was used in the previous valuation report, causing the actuarial value of the Pension Fund assets to be $809 million less than their market value.
2.2.2 Expected Interest on Revised Initial Financial Position
The amount of interest expected to accrue during the intervaluation period increased the revised shortfall by $32 million for the Superannuation Account and increased the revised surplus by $94 million for the Pension Fund. These amounts of interest were based on the yields on the Superannuation Account and on the Pension Fund returns projected in the previous report for the three-year intervaluation period.
2.2.3 Special Credits/Payments
In addition to the previously scheduled special credit of $12 million at as 31 March 2016, the shortfall of $225 million reported in the Superannuation Account as at 31 March 2015 was covered by the government making a one-time special credit of $234 million as at 31 March 2017. These special credits resulted in a decrease of $257 million in the Superannuation Account actuarial shortfall after factoring the expected interest.
Deficits were reported in the Pension Fund as at 31 March 2012 and 31 March 2015 which were to be amortized over a period of 15 years in accordance with the legislation. A total of $92 million of special payments was made to the Pension Fund during the intervaluation period that resulted in an increase of $100 million in the Pension Fund revised surplus after factoring the expected interest.
2.2.4 Data Corrections
The data upon which the 2015 report was based was corrected to reflect retroactive salary adjustments. This correction increased the Pension Fund actuarial surplus by $16 million as at 31 March 2018.
2.2.5 Experience Gains (Losses)
Since the previous valuation, experience gains and losses have increased the Superannuation Account actuarial shortfall by $53 million and have increased the Pension Fund actuarial surplus by $815 million. The main items are described in the following table.
| Superannuation Account | Pension Fund | |
|---|---|---|
| Demographic experience (i) | ||
| Seniority and promotional increases | (11) | 9 |
| Mortality of disabled members | (9) | (5) |
| Mortality of healthy members | (24) | (6) |
| Mortality of survivors | (7) | - |
| Withdrawals | (7) | (45) |
| Pensionable retirements | (19) | (23) |
| Disabled retirements | 4 | 5 |
| Proportion married at death | 2 | - |
| New entrants | - | (2) |
| Total impact of demographic experience | (71) | (67) |
| Interest and investment earnings (ii) | (15) | 919 |
| Pension indexation (iii) | 56 | 14 |
| Cost/Contributions difference (iv) | - | (42) |
| PBDA payments (v) | 8 | (12) |
| YMPE and MPE increases | (4) | (13) |
| Administration expenses | - | 1 |
| Economic salary increases | (9) | (25) |
| Miscellaneous | (18) | 40 |
| Net experience gains (losses) | (53) | 815 |
- The demographic experience increased the Superannuation Account shortfall by $71 million and decreased the Pension Fund actuarial surplus by $67 million. The most important items are as follows:
-
Seniority and promotional salary increases were higher than expected for long service members but lower than expected for members with short to medium service. The Superannuation Account shortfall increased by $11 million and the Pension Fund actuarial surplus increased by $9 million.
-
Mortality experience of disabled members was lower than expected. The Superannuation Account shortfall increased by $9 million and the Pension Fund actuarial surplus decreased by $5 million.
-
Mortality experience of healthy members was lower than expected. The Superannuation Account shortfall increased by $24 million and the Pension Fund actuarial surplus decreased by $6 million.
-
The number of withdrawals was more than expected. The Superannuation Account shortfall increased by $7 million and the Pension Fund actuarial surplus decreased by $45 million.
-
The number of retirements was more than expected. The Superannuation Account shortfall increased by $19 million and the Pension Fund actuarial surplus decreased by $23 million.
-
- The interest earnings credited to the Superannuation Account were lower than the corresponding projected Account yields in the previous valuation; consequently the experience loss was $15 million. Despite a low rate of return in 2016, financial markets performed strongly over the three year intervaluation period. The Pension Fund rates of return for plan years 2016, 2017 and 2018 were 0.7%, 12.8% and 9.8% compared to expected returns of 4.1%, 4.6% and 5.0%. Consequently, the Pension Fund experienced an investment gain of $919 million.
- The January 2017 and 2018 pension indexation rates were lower than projected in the previous valuation by 0.1% and 0.4% respectively. As a result, the Superannuation Account gained $56 million and the Pension Fund gained $14 million.
- Lower than expected contributions over the three-year intervaluation period resulted in an decrease of $42 million to the Pension Fund actuarial surplus.
- The underlying assumptions used for the calculation of the payments made under the PBDA being different than those used for funding purposes caused an experience gain of $8 million for the Superannuation Account and an experience loss of $12 million for the Pension Fund.
2.2.6 Revision of Actuarial Assumptions
Actuarial assumptions were revised based on economic trends and demographic experience as described in Appendices F and G. This revision has increased the Superannuation Account actuarial shortfall by $833 million and decreased the Pension Fund actuarial surplus by $286 million. The impact of these revisions is presented in the following table and the most important items are discussed thereafter.
| Assumptions | Superannuation Account | Pension Fund |
|---|---|---|
| Economic assumptions | ||
| Yields and Rates of return | (702) | (341) |
| Increases in average pensionable earnings and YMPE/MPE | 16 | 148 |
| Pension indexation and inflation | (11) | (3) |
| Total | (697) | (196) |
| Mortality rates of healthy pensioners | (42) | (19) |
| Mortality rates of disabled pensioners | (11) | (26) |
| Mortality rates of survivors | 2 | 1 |
| Withdrawal rates | 0 | 7 |
| Pensionable retirement rates | (2) | (12) |
| Disability retirement rates | 2 | 5 |
| Mortality improvement factors | (88) | (40) |
| Seniority and promotional increases | (2) | (12) |
| Proportion opting for a deferred annuity | 0 | (2) |
| Proportion of disabled members that will receive a CPP/QPP disability pension | 1 | 7 |
| Administrative expenses | 5 | 0 |
| Net impact of revisionTable 9 footnote * | (833) | (286) |
Table 9 Footnotes
|
||
The net impact of the revision of the assumptions is largely attributable to the changes in economic assumptions as well as mortality assumptions.
The following revisions were made to the economic assumptions used in the previous report:
- ultimate real rate of return on the Pension Fund decreased from 4.1% to 4.0%;
- ultimate real projected yield on the Superannuation Account decreased from 2.8% to 2.6%;
- real new money rates and real rates of return are lower over the first 10 years of the projection than assumed in the previous valuation for the corresponding years;
- ultimate real increase in average pensionable earnings decreased from 0.9% to 0.7%; and
- ultimate real increase in the Year's Maximum Pensionable Earnings (YMPE) and in the Maximum Pensionable Earnings (MPE) decreased from 1.1% to 1.0%.
Details of the changes in economic assumptions are described in Appendix F.
Details of the changes in demographic assumptions, in particular in mortality rates, are described in Appendix G.
2.2.7 Unrecognized Investment Gains
An actuarial asset valuation method that minimizes the impact of short-term fluctuations in the market value of assets was also used for this valuation. The method, which is described in Appendix E, resulted in an actuarial value of assets that is $821 million less than the market value of the Pension Fund assets as at 31 March 2018.
2.3 RCMPSA – Cost Certificate
2.3.1 Current Service Cost
The details of the current service cost for plan yearFootnote 6 2019 and a reconciliation with the current service cost for plan year 2016 are shown in tables 10 and 11 respectively.
| Member required contributions | 230 |
|---|---|
| Government current service cost | 269 |
| Total current service cost | 499 |
| Expected pensionable payroll | 2,149 |
| Total current service cost as % of expected pensionable payroll | 23.22% |
| For plan year 2016 | 22.96 |
|---|---|
| Expected current service cost change | (0.29) |
| Change in demographics | 0.03 |
| Changes in actuarial assumptions | |
| Economic assumptions | 0.35 |
| Seniority and promotional increases | 0.01 |
| Withdrawal rates | (0.04) |
| Pensionable retirement rates | 0.04 |
| Disability retirement rates | (0.01) |
| Mortality rates of healthy members | 0.04 |
| Mortality rates of disabled members | 0.07 |
| Mortality rates of survivors | (0.01) |
| Mortality improvement factors | 0.10 |
| Proportion of disabled members that will receive a CPP/QPP disability pension | (0.03) |
| Proportion opting for a deferred annuity | 0.01 |
| Other | (0.01) |
| For plan year 2019 | 23.22 |
The RCMPSA current service cost is the weighted average of the separate current service costs for Regular Members and Civilian Members. For plan year 2019, the current service cost of 23.22% of pensionable payroll is composed of 23.62% for Regular Members and 20.94% for Civilian Members. The difference in current service costs is mainly attributable to the more advantageous early retirement provisions available to Regular Members.
2.3.2 Projection of Current Service Cost
The current service cost is borne jointly by the members and the government. The member contribution rates are determined on a calendar year basis and they have been changed since the last valuation. Contribution rates are assumed to be equal to the contribution rates of Group 1 contributors under the pension plan for the Public Service of Canada. The contribution rates are as follows:
| Calendar year | Below YMPE | Above YMPE |
|---|---|---|
| 2018 | 9.83% | 12.13% |
| 2019 | 9.56% | 11.78% |
| 2020 | 9.53% | 11.72% |
| 2021 | 9.49% | 11.67% |
Table 13 shows the RCMPSA current service costs expressed in millions of dollars and as a percentage of the projected pensionable payroll in each given plan year. Members' contributions and the government current service costs are also shown on a calendar year basis in the Executive Summary.
| Plan Year | $ millions | Percentage of Pensionable Payroll | Portion Borne by the Government | ||||
|---|---|---|---|---|---|---|---|
| Contributors | Government | Total | Contributors | Government | Total | ||
| 2020 | 230 | 282 | 512 | 10.46 | 12.80 | 23.26 | 55.0% |
| 2021 | 235 | 289 | 523 | 10.42 | 12.82 | 23.24 | 55.2% |
| 2022 Table 13 footnote * | 239 | 296 | 535 | 10.37 | 12.87 | 23.24 | 55.4% |
| 2023 Table 13 footnote * | 243 | 305 | 548 | 10.32 | 12.98 | 23.30 | 55.7% |
Table 13 Footnotes
|
|||||||
2.3.3 Administrative Expenses
Based upon the assumptions described in Appendix G.2, the Pension Fund administrative expenses are included in the total current service costs. As in the previous report, the expected administrative expenses exclude the PSPIB operating expenses as these are recognized implicitly through a decrease in the real rate of return. The estimated administrative expenses are shown in the following table:
| Plan Year | ($ millions) |
|---|---|
| 2020 | 4 |
| 2021 | 5 |
| 2022 | 5 |
| 2023 | 5 |
The Superannuation Account administrative expenses have been capitalized and increase the liability for service accrued prior to 1 April 2000.
2.3.4 Contributions for Prior Service Elections
Based on the valuation data and the assumptions described in Appendix G.2, member and government contributions for prior service elections were estimated as follows:
| Plan Year | Superannuation Account | Pension Fund | ||
|---|---|---|---|---|
| Contributors | Government | Contributors | Government | |
| 2020 | 0.3 | 0.3 | 0.8 | 1.1 |
| 2021 | 0.3 | 0.3 | 0.8 | 1.0 |
| 2022 | 0.3 | 0.3 | 0.7 | 1.0 |
| 2023 | 0.3 | 0.3 | 0.6 | 0.9 |
2.4 Sensitivity of Valuation Results to Variations in Longevity Improvement Factors
This valuation assumes that the current mortality rates applicable to members of the RCMP pension plan will improve over time. This assumption is based on the longevity improvement assumption contained in the 27th Actuarial Report on the Canada Pension Plan. Table 16 presents the effect of varying the longevity improvement assumptions on the actuarial liabilities as at 31 March 2018 and the plan year 2019 current service cost.
| Current Service Cost as a percentage of pensionable payroll |
Actuarial Liability ($ millions) | Age 65 Life Expectancy as at 31 March 2018 (Age nearest in years)Table 16 footnote * |
||||||
|---|---|---|---|---|---|---|---|---|
| Service prior to April 2000 | Service since April 2000 | |||||||
| Longevity improvement factors | 2019 | Effect | 31 March 2018 | Effect | 31 March 2018 | Effect | Male | Female |
| Current basis | 23.22 | None | 14,009 | None | 9,721 | None | 22.8 | 24.9 |
| - if 0% | 22.38 | (0.84) | 13,467 | (542) | 9,415 | (306) | 21.5 | 23.8 |
| - if ultimate 50% higher | 23.43 | 0.21 | 14,077 | 68 | 9,784 | 63 | 23.0 | 25.1 |
| - if ultimate 50% lower | 23.01 | (0.21) | 13,941 | (68) | 9,657 | (64) | 22.7 | 24.8 |
| - if kept at 2019 level | 23.87 | 0.65 | 14,331 | 322 | 9,944 | 223 | 23.7 | 25.5 |
Table 16 Footnotes
|
||||||||
2.5 Sensitivity to Variations in Key Economic Assumptions
The information required by statute, which is presented in this report, has been derived using best estimate assumptions regarding future demographic and economic trends. The key best estimate assumptions, i.e. those for which changes within a reasonable range have the most significant impact on the long-term financial results, are described in Appendices F and G. Given the length of the projection period and the number of assumptions required, it is unlikely that the actual experience will develop precisely in accordance with best estimate assumptions that underlie the actuarial estimates. Individual sensitivity tests have been performed using alternative assumptions.
The following table presents the effect on the actuarial liabilities as at 31 March 2018 and the plan year 2019 current service cost when key economic assumptions are varied by one percentage point per annum.
| Current Service Cost (%) | Actuarial Liability ($ millions) | |||||
|---|---|---|---|---|---|---|
| Service priorto April 2000 | Service since April 2000 | |||||
| Assumption(s) Varied | 2019 | Effect | 31 March 2018 | Effect | 31 March 2018 | Effect |
| None (i.e. current basis) | 23.22 | None | 14,009 | None | 9,721 | None |
| Investment yield | ||||||
| - if 1% higher | 18.46 | (4.76) | 12,388 | (1,621) | 8,147 | (1,574) |
| - if 1% lower | 29.76 | 6.54 | 16,005 | 1,996 | 11,792 | 2,071 |
| Indexation | ||||||
| - if 1% higher | 26.54 | 3.32 | 15,887 | 1,878 | 11,068 | 1,347 |
| - if 1% lower | 20.54 | (2.68) | 12,447 | (1,562) | 8,622 | (1,099) |
| Salary, YMPE and MPE | ||||||
| - if 1% higher | 25.61 | 2.39 | 46 | 46 | 10,263 | 542 |
| - if 1% lower | 21.17 | (2.05) | (44) | (44) | 9,243 | (478) |
| All economic assumptions | ||||||
| - if 1% higher | 22.76 | (0.46) | (38) | (38) | 9,632 | (89) |
| - if 1% lower | 23.70 | 0.48 | 39 | 39 | 9,814 | 93 |
The differences between the results above and those shown in the valuation can also serve as a basis for approximating the effect of other numerical variations in one of the key assumptions to the extent that such effects are linear.
2.6 RCA Account
This section shows the state of the RCA account as at 31 March 2018 as well as the current service costs. The results of the previous valuation are also shown for comparison.
2.6.1 State of the RCA Account
| 31 March 2018 | 31 March 2015 | |
|---|---|---|
| Recorded account balance | 35 | 33 |
| Refundable tax | 35 | 33 |
| Total Recorded Balance | 70 | 66 |
| Actuarial Liability | ||
| Contributors | 15 | 18 |
| Pensioners | 39 | 37 |
| Total Actuarial Liability | 54 | 55 |
| Actuarial Excess/(Shortfall) | 16 | 11 |
The sum of the recorded balance of the RCA Account and the refundable tax is $70 million; it exceeds the actuarial liability of $54 million by 30% as at 31 March 2018 (20% as at 31 March 2015). The SRAA does not allow for an adjustment to be made to the RCA Account to track the actuarial liability when there is an actuarial excess.
2.6.2 RCA - Current Service Cost
Borne jointly by the contributors and the government, the projected RCA current service cost of 0.03% for plan year 2019 is estimated to remain constant at 0.03% of pensionable payroll for the next three plan years.
| Plan Year | 2020 | 2021 | 2022 | 2023 |
|---|---|---|---|---|
| Total current service cost | ||||
| Pensionable excess earnings Table 19 footnote * | 0.50 | 0.51 | 0.52 | 0.53 |
| Survivor allowance Table 19 footnote * | 0.21 | 0.22 | 0.22 | 0.23 |
| Total | 0.71 | 0.73 | 0.74 | 0.76 |
| Member contributions - pensionable excess earnings | 0.22 | 0.22 | 0.23 | 0.23 |
| Government current service cost | 0.49 | 0.51 | 0.52 | 0.53 |
| Total current service cost as % of pensionable payroll | 0.03% | 0.03% | 0.03% | 0.03% |
Table 19 Footnotes
|
||||
2.7 Summary of Estimated Government Costs and Credits
Table 20 and 21 summarize the estimated total government cost and credit on a plan year basis.
| Plan Year | Current Service Cost Pension Fund | Prior Service Contributions Pension Fund | Total Government Cost |
|---|---|---|---|
| 2020 | 281.7 | 1.1 | 282.8 |
| 2021 | 288.7 | 1.0 | 289.7 |
| 2022 | 296.2 | 1.0 | 297.2 |
| 2023 | 305.4 | 0.9 | 306.3 |
| Plan Year | RCA Account Current Service Cost | Expected Special Credit Superannuation Account | Prior Service Contributions Superannuation Account | Total Government Credit |
|---|---|---|---|---|
| 2020 | 0.49 | 956.4 | 0.3 | 957.2 |
| 2021 | 0.51 | 0.0 | 0.3 | 0.8 |
| 2022 | 0.52 | 0.0 | 0.3 | 0.8 |
| 2023 | 0.53 | 0.0 | 0.3 | 0.8 |
3. Actuarial Opinion
In our opinion, considering that this report was prepared pursuant to the Public Pensions Reporting Act,
-
the valuation data on which the valuation is based are sufficient and reliable for the purposes of the valuation;
-
the assumptions used are individually reasonable and appropriate in the aggregate for the purposes of the valuation;
-
the methods employed are appropriate for the purposes of the valuation; and
-
this report has been prepared, and our opinions given, in accordance with accepted actuarial practice in Canada.
In particular, this report was prepared in accordance with the Standards of Practice (General Standards and Practice – Specific Standards for Pension Plans) published by the Canadian Institute of Actuaries.
As a result of amendments contained in the Economic Action Plan 2014 Act, No. 2, it is expected that active RCMP Civilian Members as at 21 May 2020 will become Public Service Employees under the Public Service Employment Act and will join the pension plan for the Public Service of Canada. The impact of the expected transfer on the projected actuarial liabilities and current service costs is shown in Appendix M of this report. To the best of our knowledge and after discussion with the Royal Canadian Mounted Police, there were no other subsequent events between the valuation date and the date of this report that would have a material impact on the results of this valuation.
Assia Billig, FCIA, FSA
Chief Actuary
Laurence Frappier, FCIA, FSA
Senior Actuary
Christine Dunnigan, FCIA, FSA
Senior Actuary
Ottawa, Canada
23 September 2019
Appendix A - Summary of Pension Benefit Provisions
Pensions for members of the Royal Canadian Mounted Police ("the Force") were provided under the Royal Canadian Mounted Police Act until the Royal Canadian Mounted Police Pension Continuation Act and the Royal Canadian Mounted Police Superannuation Act (RCMPSA) were enacted in 1959. Benefits are also provided to members of the Force under the Special Retirement Arrangements Act. Benefits may be modified in accordance with the Pension Benefits Division Act if there is a breakdown of a spousal union.
The previous valuation report was based on the pension benefit provisions as they stood as at 31 March 2015. There were no changes to the plan provisions since the last valuation.
Summarized in this Appendix are the pension benefits provided under the RCMPSA registered provisions which are in compliance with the Income Tax Act. The portion of the benefits in excess of the Income Tax Act limits for registered pension plans is provided under the retirement compensation arrangements described in Appendix B.
In case of any discrepancy between this summary and the legislation, the legislation shall prevail.
A.1 Membership
Membership in the plan is compulsory for all members of the Force regardless of length of service. Continued membership in the plan became optional for members of the Force who transferred to the Canadian Security Intelligence Service when it was established in 1984.
A.2 Contributions
A.2.1 Members
During the first 35 years of pensionable service, members contribute according to the rates determined by the Treasury Board which must not exceed the contribution rates paid by Group 1 contributors under the Public Service pension plan (PS pension plan). Contribution rates of Group 1 contributors under the PS pension plan are shown in the following table. It is assumed that the RCMP contribution rates will be equal to those of the PS pension plan. More information on the rates assumed under the PS pension plan can be found in the Actuarial Report on the Pension Plan for the Public Service of Canada as at 31 March 2017.
| Calendar Year | 2018 | 2019 | 2020 | 2021 |
|---|---|---|---|---|
| Contribution rates on earnings up to the maximum covered by the Canada Pension Plan | 9.83% | 9.56% | 9.53% | 9.49% |
| Contribution rates on any earnings over the maximum covered by the Canada Pension Plan | 12.13% | 11.78% | 11.72% | 11.67% |
After 35 years of pensionable service, members contribute 1% of pensionable earnings.
A.2.2 Government
A.2.2.1 Current Service
The government determines its ongoing monthly cost as an amount, which when combined with the required contributions by members in respect of current service, is sufficient to cover the cost, as estimated by the President of the Treasury Board, of all future benefits that have accrued in respect of pensionable service during that month and the Pension Fund administrative expenses incurred during that month.
A.2.2.2 Elected Prior Service
The government matches member contributions made under the Superannuation Account for prior service elections. Government credits to the Pension Fund in respect of elected prior service are as described for current service.
A.2.2.3 Actuarial Excess and Surplus
The Public Sector Pension Investment Board Act (S.C. 1999, c. 34), which received Royal Assent on 14 September 1999, amended the RCMPSA to give the government the authority to:
-
debit the excess of the balance of the Superannuation Account over the actuarial liability subject to limitations, and
-
deal with any actuarial surplus, subject to limitations, in the Pension Fund as they occur, either by reducing employee and/or government contributions or by making withdrawals.
A.2.2.4 Actuarial Shortfall and Deficit
In accordance with the RCMPSA, if an actuarial shortfall for the Superannuation Account is identified through a triennial statutory actuarial valuation, the actuarial shortfall can be amortized over a period of up to 15 years through annual credits of an amount that, in the opinion of the President of the Treasury Board will, at the end of the fifteenth fiscal year following the tabling of that report or at the end of the shorter period that the President of the Treasury Board may determine, together with the amount that the President of the Treasury Board estimates will be to the credit of the Superannuation Account at that time, meet the cost of the benefits payable in respect of pensionable service prior to April 2000.
Similarly, if an actuarial deficit for the Pension Fund is identified through a triennial statutory actuarial valuation, the actuarial deficit can be amortized over a period of up to 15 years through annual payments of an amount that, in the opinion of the President of the Treasury Board will, at the end of the fifteenth fiscal year following the tabling of that report or at the end of a shorter period that the President of the Treasury Board may determine, together with the amount that the President of the Treasury Board estimates will be to the credit of the Pension Fund at that time, meet the cost of the benefits payable in respect of pensionable service since April 2000.
A.3 Summary Description of Benefits
The objective of the RCMP pension plan is to provide an employment earnings-related lifetime retirement pension to eligible members. Benefits to members in case of disability and to the spouse and children of members in case of death are also provided.
Subject to coordination with the pensions paid by the Canada Pension Plan (CPP) or the Québec Pension Plan (QPP), the initial rate of retirement pension is equal to 2% of the highest average annual pensionable earnings over any period of five consecutive years, multiplied by the number of years of pensionable service not exceeding 35. Once in pay, the pension is indexed with the Consumer Price Index. Such indexation also applies to deferred pensions during the deferral period. Entitlement to benefits depends on either service in the Force or pensionable service, as defined in notes A.4.3 and A.4.4 below.
Detailed notes on the following overview are provided in section A.4.
A.3.1 Regular Members
| Type of Termination | Service in the Force | Benefit |
|---|---|---|
| Retirement because of age (Note A.4.5) | Under 2 years | Greater of:
|
| 2 years or more | Immediate annuity (Note A.4.8) | |
| Compulsory retirement to promote economy or efficiency in the Force | Under 2 years | Return of contributions |
| 2 years to less than 20 years | Choice of:
|
|
| 20 years or more | Immediate annuity | |
| Compulsory retirement because of misconduct | Any period | At the discretion of the Treasury Board (Note A.4.12) |
| Other voluntary withdrawal or retirement | Under 2 years | Return of contributions |
| 2 years to less than 20 years | Choice of:
|
|
| 20 years to less than 25 years | Annual allowance (Note A.4.13) | |
| 25 years or more | Immediate annuity | |
| Type of Termination | Pensionable Service | Benefit |
| Compulsory retirement because of disability | Under 2 years | Greater of:
|
| 2 years or more | Immediate annuity | |
| Death leaving no eligible survivor | Under 2 years | Return of contributions to nominated beneficiary, otherwise to estate |
| 2 years or more | Minimum death benefit (Note A.4.16) | |
| Death leaving eligible survivor(s) (Notes A.4.14 and A.4.15) | Under 2 years | Greater of:
|
| 2 years or more | Annual allowance to eligible survivor(s) (Note A.4.18) |
A.3.2 Civilian Members
| Type of Termination | Pensionable Service (Unless Stated Otherwise) | Benefit |
|---|---|---|
| Voluntary retirement at age 60 or over | Under 2 years | Return of contributions (Note A.4.6) |
| 2 years or more | Immediate annuity (Note A.4.8) | |
| Compulsory retirement because of misconduct | Any period | At the discretion of the Treasury Board (Note A.4.12) |
| Other voluntary withdrawal or retirement | Under 2 years of service in the Force | Return of contributions |
2 years of service in the Force to less than 35 years of service in the Force:
|
Immediate annuity Choice of:
|
|
| 35 years of service in the Force or more | Immediate annuity | |
| Compulsory retirement because of disability | Under 2 years | Greater of:
|
| 2 years or more | Immediate annuity | |
| Death leaving no eligible survivor | Under 2 years | Return of contributions to nominated beneficiary, otherwise to estate |
| 2 years or more | Minimum death benefit (Note A.4.16) | |
| Death leaving eligible survivor(s) (Notes A.4.14 and A.4.15) | Under 2 years | Greater of:
|
| 2 years or more | Annual allowance to eligible survivor(s) (Note A.4.18) |
A.3.3 Pensioners
| Type of Termination | Benefit |
|---|---|
| Disability | Immediate annuity |
| Death leaving no eligible survivor | Minimum death benefit (Note A.4.16) |
| Death leaving eligible survivor(s) (Notes A.4.14 and A.4.15) |
Annual allowance to eligible survivor(s) (Note A.4.18) |
A.4 Explanatory Notes
A.4.1 Pensionable Earnings and Pensionable Payroll
Pensionable earnings mean the annual employment earnings (excluding overtime but including pensionable allowances such as bilingual bonuses) of a contributor.
Pensionable payroll means the aggregate pensionable earnings of all contributors with less than 35 years of pensionable service.
A.4.2 Indexation
A.4.2.1 Indexation Adjustments
All immediate and deferred annuities (pensions and allowances) are adjusted every January to the extent warranted by the increase, as at 30 September of the previous year, in the 12-month average Consumer Price Index relative to the corresponding figure one year earlier. If the indicated adjustment is negative, annuities are not decreased for that year; however, it is carried-forward and the next positive adjustment is diminished accordingly.
A.4.2.2 First Indexation Adjustment
Indexation adjustments accrue from the end of the month in which employment terminates. The first annual adjustment following termination of employment is prorated accordingly.
A.4.2.3 Commencement of Indexation Payments
The indexation portion of a retirement, disability or survivor pension normally starts being paid when the pension is put into pay. However, regarding a Regular Member retirement pension, indexation payments start only when the pensioner is either
-
at least 55 years old, provided the sum of age and pensionable service is at least 85 years; or
-
at least 60 years old.
A.4.3 Service in the Force
Service in the Force includes any period as a member of the Force and any period of prior service as a police officer that the member purchased under the elective service provisions or through a pension transfer agreement.
A.4.4 Pensionable Service
Pensionable service includes any period of service in the Force in respect of which a contributor either (1) had to make contributions that remain in the plan or (2) elected to contribute. It also includes any period of prior service with another employer in respect of which a contributor has elected to contribute in accordance with the provisions of the RCMPSA.
A.4.5 Retirement Because of Age
Retirement because of age means voluntarily ceasing to be a Regular Member on or after reaching age 60, for a reason other than disability or misconduct. Regular Members who joined the Force before July 1988 may elect to retain the prescribed retirement ages (56 for ranks up to corporal, 57 for sergeants, and 58 for staff sergeants and majors) in effect at that time.
A.4.6 Return of Contributions
Return of contributions means the payment of an amount equal to the accumulated current and prior service contributions paid or transferred by the contributor into the plan. Interest is credited quarterly on returned contributions in accordance with the investment return on the RCMP Pension Fund or in accordance with the interest credited on the Superannuation Account, depending on where contributions were credited.
A.4.7 Cash Termination Allowance
Cash termination allowance means an amount equal to one month's salary, as at the date of termination, multiplied by the number of years of pensionable service, reduced by an amount which takes into consideration the coordination of contributions under the RCMP pension plan with those under the CPP/QPP.
A.4.8 Immediate Annuity
Immediate annuity means an unreduced pension that becomes payable immediately upon a pensionable retirement or pensionable disability. The annual amount is equal to 2% of the highest average annual pensionable earnings of the contributor over any period of fiveFootnote 7 consecutive years, multiplied by the number of years of pensionable service not exceeding 35. For contributors with periods of part-time pensionable service, earnings used in the five-year average salary calculation are based on a full 40 hour work week and the pension benefit is prorated to take periods of part-time service into account.
When a pensioner attains age 65 or becomes entitled to a disability pension from the CPP/QPP, the annual pension amount is reduced by a percentage of the indexed CPP annual pensionable earningsFootnote 8 (or, if lesser, the indexed five-yearFootnote 7 pensionable earnings average on which the immediate annuity is based), multiplied by the years of CPP pensionable serviceFootnote 9. The applicable percentage is 0.625%.
Annuities are payable at the end of month until the month in which the pensioner dies or until the disabled pensioner recovers from disability (the last payment would then be pro-rated). Upon the death of the pensioner, either a survivor allowance (Note A.4.18) or a residual death benefit (Note A.4.17) may be payable.
A.4.9 Deferred Annuity
Deferred annuity means an annuity that normally becomes payable to a former contributor who reaches age 60. The annual payment is determined as for an immediate annuity (Note A.4.8) but is also adjusted to reflect the indexation (Note A.4.2) from the date of termination to the commencement of benefit payments.
The deferred annuity becomes an immediate annuity during any period of disability beginning before age 60. If the disability ceases before age 60, the immediate annuity reverts to the original deferred annuity unless the pensioner elects an annual allowance (Notes A.4.13 and A.4.19) that is the prescribed actuarial equivalent to the deferred annuity.
A.4.10 Transfer Value
Regular Members and Civilian Members who, at their date of termination of pensionable service, are under age 60 and 50 respectively, and who are eligible for a deferred annuity may elect to transfer the commuted value of their benefits, determined in accordance with the regulations, to
-
a locked-in Registered Retirement Savings Plan of the prescribed kind; or
-
another pension plan registered under the Income Tax Act; or
-
a financial institution for the purchase of a locked-in immediate or deferred annuity of the prescribed kind.
A.4.11 Reduced Immediate Annuity
Reduced immediate annuity means an immediate annuity for which the annual amount of annuity determined as described in Note A.4.8 is reduced until age 65 by 5% for each full year, not exceeding six, by which the period of service in the Force is less than 20 years. This type of annuity may be chosen by a Regular Member who has completed between 2 and 20 years of service in the Force upon being compulsorily retired:
-
on account of a reduction in the Force, or
-
to promote economy or efficiency in the force (only at the discretion of the Treasury Board).
A.4.12 Retirement Because of Misconduct
Upon compulsory retirement because of misconduct, a contributor is entitled to
-
a return of contributions, or
-
a greater benefit as specified by the Treasury Board but not exceeding that available in the absence of misconduct.
A.4.13 Annual Allowance for Regular Members
Annual allowance means, for a Regular Member, an immediate annuity reduced by 5% for each full year by which
-
the period of service in the Force is less than 25 years, or
-
the age at retirement is less than the applicable retirement age (as defined in Note A.4.5), whichever is the lesser.
A.4.14 Eligible Surviving Spouse
Eligible surviving spouse means the surviving spouse (includes a common-law or same sex partner recognized under the plan) of a contributor or pensioner except if:
-
the contributor or pensioner died within one year of commencement of the spousal union, unless the Minister is satisfied that the health of the contributor or pensioner at the time of such commencement justified an expectation of surviving for at least one year;
-
the pensioner married at age 60 or over, unless after such marriage the pensioner either:
-
became a contributor again, or
-
made an optional survivor benefit election within 12 months following marriage to accept a reduced pension so that the new spouse would be eligible for a survivor benefit. This reduction is reversed if and when the new spouse predeceases the pensioner or the spousal union is terminated for reason other than death; or
-
the pensioner is a female who retired before 20 December 1975 and did not make an optional survivor benefit election within the one-year period ending 6 May 1995.
-
A.4.15 Eligible Surviving Children
Eligible surviving children include all children of the contributor or pensioner who are under age 18, and any child of the contributor or pensioner who is age 18 or over but under 25, in full-time attendance at a school or university, having been in such attendance substantially without interruption since he or she reached age 18 or the contributor or pensioner died, whichever occurred later.
A.4.16 Minimum Death Benefit
If a contributor or a pensioner dies leaving no eligible survivor, the lump sum normally paid is the amount by which the greater of:
-
a return of contributions; and
-
five times the annual amount of the immediate annuity to which the contributor would have been entitled, or the pensioner was entitled, at the time of death,
exceeds any pension payments already received.
Indexation adjustments are excluded from these calculations.
A.4.17 Residual Death Benefit
The same formula described in Note A.4.16 is used to determine the residual death benefit, which is the lump sum payable upon the death of an eligible survivor but also subtracting all amounts (excluding indexation adjustments) already paid to the survivor.
A.4.18 Annual Allowance for Eligible Survivor(s)
Annual allowance means, for the eligible surviving spouse and children of a contributor or pensioner, an annuity that becomes payable immediately upon the death of that individual. The amount of the allowance is determined with reference to a basic allowance equal to 1% of the highest average annual pensionable earnings of the contributor over five consecutive years, multiplied by the number of years of pensionable service not exceeding 35.
The annual allowance for an eligible surviving spouse is equal to the basic allowance unless the eligible surviving spouse became eligible as a result of an optional survivor benefit election, in which case it is equal to the percentage of the basic allowance specified by the pensioner making the election. The annual allowance for an eligible surviving child is equal to 20% of the basic allowance, subject to a reduction if there are more than four eligible surviving children in the same family. The annuity otherwise payable to an eligible surviving child is doubled if the child is an orphan.
Survivor annual allowances are not coordinated with the CPP/QPP and are payable in equal monthly instalments at the end of month until the month in which the survivor dies or otherwise loses eligibility. If applicable, a residual benefit (Note A.4.17) is payable to the estate upon the death of the last survivor.
A.4.19 Annual Allowance for Civilian Members
Annual allowance means, for a Civilian Member, an annuity payable immediately on retirement, upon attaining age 50 or upon exercising the option, whichever occurs later. The amount of the allowance is equal to the amount of the deferred annuity to which the Civilian Member would otherwise be entitled, reduced by 5% for each year between age 60 and the age when the allowance becomes payable. However, if the Civilian Member is at least 50 years old, and has at least 25 years of pensionable service, then the difference is reduced to the greater of
-
55 minus the age, and
-
30 minus the number of years of pensionable service.
The Treasury Board can waive all or part of the reduction for Civilian Members who are involuntarily retired at ages 55 and over with at least ten years of service in the Force.
If a former Civilian Member entitled to an annual allowance commencing at age 50 becomes disabled before then, the entitlement changes to an immediate annuity (Note A.4.8). If disability ceases before age 60, then the entitlement changes to a deferred annuity (Note A.4.9) unless the pensioner elects an annual allowance that is the prescribed actuarial equivalent to the deferred annuity.
A.4.20 Division of Pension with Former Spouse
In accordance with the Pension Benefits Division Act, upon the breakdown of a spousal union (including common-law), a lump sum can be debited by court order or by mutual consent from the accounts and/or the Pension Fund, as the case may be, to the credit of the former spouse of a contributor or pensioner. The maximum transferable amount is half the value, calculated as at the transfer date, of the retirement pension accrued by the contributor or pensioner during the period of cohabitation. If the member's benefits are not vested, the maximum transferable amount corresponds to half the member's contributions made during the period subject to division, accumulated with interest at the rate applicable on a refund of contributions. The accrued benefits of the contributor or pensioner are then reduced accordingly.
Appendix B - Retirement Compensation Arrangement Benefit Provisions
Retirement compensation arrangements (RCAs) are arrangements for benefits in excess of the benefit limitations of registered pension plans and are less tax-advantageous as the fund must transfer a 50% refundable tax to the Canada Revenue Agency (CRA) immediately. Under the RCMP RCA, a debit is made from the RCA Account such that in total roughly half the recorded balances in the account are held as a tax credit (CRA refundable tax). This Appendix describes the RCMP pension benefits financed through retirement compensation arrangements that have a material impact on this valuation.
B.1 Annual Allowance for Eligible Survivors
If the annual allowance for eligible survivors described in Appendix A.4.18 exceeds the tax-related limits described hereafter for registered pension plans, then the excess in respect of service from 1 January 1992 onwards is debited from the RCA Account.
B.1.1 Tax-Related Limits on Preretirement Survivor Benefits
The total of all preretirement survivor pensions payable in respect of a deceased member may not exceed the member's projected lifetime retirement benefit and the amount of spouse allowance may not exceed two-thirds of the projected lifetime retirement benefit.
The member's projected lifetime retirement benefit is the greater of:
- the deceased member's accrued pension reduced by the CPP coordination offset; and
- the lesser of:
- the member's projected retirement benefit at age 65 based on current salary history, and
- 1.5 times the YMPE in effect during the year of the member's death.
B.1.2 Tax-Related Limits on Postretirement Survivor Benefits
The amount of the spouse allowance provided is limited in any year to a maximum of two-thirds the retirement benefit that would have been payable to the member in that year.
B.2 Excess Pensionable Earnings
Starting in 1995, the highest average of pensionable earnings under the RCMPSA is subject to a prescribed yearly maximum. Because the RCMPSA is coordinated with the pensions paid by the CPP/QPP, the prescribed maximum is derived from both the maximum annual pension benefit accrual ($3,025.56 for calendar year 2019) payable from a registered defined benefit pension plan for each year of pensionable service and the YMPE. The maximum is $169,300 for calendar year 2019. To the extent that a member's average earnings at retirement exceed the prescribed yearly maximum, the corresponding excess pension is debited from the RCA Account.
Appendix C - Assets, Accounts and Rates of Return
C.1 Assets and Account Balances
The government has a statutory obligation to fulfill the pension promise enacted by legislation to RCMP members. Since 1 April 2000, the government has earmarked invested assets (Pension Fund) to meet the cost of pension benefits.
With respect to the unfunded portion of the RCMP pension plan, accounts were established to track government's pension benefit obligations such as the Superannuation Account, for service prior to 1 April 2000, and the RCA Account for benefits in excess of those that can be provided under the Income Tax Act limits for registered pension plans.
C.1.1 RCMP Superannuation Account
RCMPSA member contributions, government costs, and benefits earned up to 31 March 2000 are tracked entirely through the RCMP Superannuation Account, which forms part of the Public Accounts of Canada.
The Superannuation Account was credited with all RCMPSA member contributions and government costs prior to 1 April 2000, as well as with prior service contributions and costs for elections made prior to 1 April 2000. It is charged with both the benefit payments made in respect of service earned under the Superannuation Account and the allocated portion of the plan administrative expenses.
The Superannuation Account is credited with interest earnings as though net cash flows were invested quarterly in 20-year Government of Canada bonds issued at prescribed interest rates and held to maturity. No formal debt instrument is issued to the Superannuation Account by the government in recognition of the amounts therein. Interest is credited every three months on the basis of the average yield for the same period on the combined Superannuation Accounts of the Public Service, Canadian Forces and RCMP pension plans.
| Plan Year | 2016 | 2017 | 2018 | 2016-2018 |
|---|---|---|---|---|
| Opening balance | 13,197 | 13,155 | 13,275 | 13,197 |
| INCOME | ||||
| Investment earnings | 613 | 569 | 541 | 1,723 |
| Employer contributions | - | - | - | - |
| Member contributions | 1 | 1 | - | 2 |
| Transfers from other pension plans | - | - | - | - |
| Actuarial liability adjustments | 12 | 234 | - | 246 |
| Subtotal | 626 | 804 | 541 | 1,971 |
| EXPENDITURES | ||||
| Annuities | 650 | 668 | 683 | 2,001 |
| Pension divisions | 11 | 7 | 8 | 26 |
| Return of contributions and cash allowances | - | - | - | - |
| Pension transfer value payments | 1 | 2 | 3 | 6 |
| Transfers to other pension plans | - | - | - | - |
| Minimum benefits | - | 1 | 1 | 2 |
| Administrative expenses | 6 | 6 | 5 | 17 |
| Subtotal | 668 | 684 | 700 | 2,052 |
| Closing balance | 13,155 | 13,275 | 13,116 | 13,116 |
Table 23 Footnotes
|
||||
Since the last valuation, the Superannuation Account balance has decreased by $81 million (a 0.6% reduction) to reach $13,116 million as at 31 March 2018.
C.1.2 RCMP Pension Fund
The Pension Fund is invested in the financial markets with a view to achieving maximum rates of return without undue risk.
The Pension Fund has been credited with all RCMPSA contributions since 1 April 2000, as well as with prior service contributions in respect of elections made since that date and leave without pay contributions for periods after that date. The Pension Fund is also credited with the net investment returns generated by the capital assets managed by PSPIB. It is debited with both the benefit payments made in respect of service earned and prior service elections made since 1 April 2000 and the allocated portion of the plan administrative expenses.
| Plan Year | 2016 | 2017 | 2018 | 2016-2018 |
|---|---|---|---|---|
| Opening balance | 8,082 | 8,498 | 9,851 | 8,082 |
| INCOME | ||||
| Gross Investment earnings | 102 | 1,154 | 1,046 | 2,302 |
| Employer contributions | 270 | 250 | 270 | 790 |
| Member contributions | 187 | 195 | 226 | 608 |
| Transfers from other pension plans | 9 | 9 | 9 | 27 |
| Actuarial liability adjustments | 74 | 9 | 9 | 92 |
| Subtotal | 642 | 1,617 | 1,560 | 3,819 |
| EXPENDITURES | ||||
| Annuities | 141 | 165 | 190 | 496 |
| Pension divisions | 13 | 10 | 15 | 38 |
| Return of contributions and cash allowances | - | - | - | - |
| Pension transfer value payments | 27 | 32 | 37 | 96 |
| Transfers to other pension plans | 1 | - | 1 | 2 |
| Minimum benefits | - | 1 | 1 | 2 |
| Administrative expenses | 4 | 3 | 4 | 11 |
| PSPIB Investment Expenses | 41 | 53 | 66 | 160 |
| Subtotal | 227 | 264 | 314 | 805 |
| Closing balance | 8,498 | 9,851 | 11,097 | 11,097 |
Table 24 Footnotes
|
||||
Since the last valuation, the Pension Fund balance has increased by $3,015 million (a 37.3% increase) to reach $11,097 million as at 31 March 2018.
C.1.3 RCA Account
The amount in the RCA account is composed of the recorded balance in the Retirement Compensation Arrangements Account, which forms part of the Public Accounts of Canada, and a tax credit (CRA refundable tax). Each calendar year, a debit is made from the RCA Account such that in total roughly half the recorded balances in the Account are held as a tax credit (CRA refundable tax).
No formal debt instrument is issued to the Account by the government in recognition of the amounts therein. Interest earnings are credited every three months on the basis of the average yield for the same period on the combined Superannuation Accounts of the Public Service, Canadian Forces and RCMP pension plans.
| Plan Year | 2016 | 2017 | 2018 | 2016-2018 |
|---|---|---|---|---|
| Opening balance | 33 | 34 | 34 | 33 |
| INCOME | ||||
| Interest earnings | 2 | 1 | 2 | 5 |
| Employer contributions | 0 | 1 | 1 | 2 |
| Member contributions | 0 | 0 | 0 | 0 |
| Transfers from other pension plans | 0 | 0 | 0 | 0 |
| Subtotal | 2 | 2 | 3 | 7 |
| EXPENDITURES | ||||
| Annuities | 1 | 1 | 1 | 3 |
| Amount transfer to CRA | 0 | 1 | 1 | 3 |
| Subtotal | 1 | 2 | 2 | 5 |
| Closing balance | 34 | 34 | 35 | 35 |
| CRA Refundable tax | 33 | 34 | 35 | 35 |
Table 25 Footnotes
|
||||
Since the last valuation, the RCA Account balance has increased by 6.1% to reach $35 million as at 31 March 2018 and the tax credit (CRA refundable tax) has increased by 6.1% to reach $35 million as at 31 March 2018.
C.1.4 Interest Earnings/Rates of Return
The interest earnings in respect of the Superannuation Account were calculated using the foregoing entries. The Account yields are based on book values since the notional bonds are deemed to be held to maturity. The result was computed using the dollar-weighted approach and assumes that cash flows occur in the middle of the plan year (except for actuarial liability adjustments, if any, which occur on 31 March). The Pension Fund rates of return are from the Public Sector Pension Investment Board (PSPIB) Annual Reports.
| Plan Year | Superannuation Account | Pension FundTable 26 footnote * |
|---|---|---|
| 2016 | 4.8% | 0.7% |
| 2017 | 4.4% | 12.8% |
| 2018 | 4.2% | 9.8% |
Table 26 Footnotes
|
||
C.2 Sources of Asset and Accounts Data
The RCMP Superannuation Account, RCA Account and RCMP Pension Fund entries shown in C.1 above were taken from the Public Accounts of Canada and the financial statements of the Public Sector Pension Investment Board.
Appendix D - Membership Data
D.1 Sources and Validation of Membership Data
The individual data in respect of contributors, pensioners, and eligible survivors were provided as at 31 March 2018. The data are extracted from master computer files maintained by the Department of Public Services and Procurement Canada (PSPC). PSPC also provided a listing of pension benefits paid in March 2018 for each pensioner and eligible survivor.
For validation and comparison purposes, individual salaries as at 31 March 2018 were provided by the RCMP Pension Accounting Unit for each active contributor as at that date.
Certain tests of internal consistency, as well as tests of consistency with the data used in the previous valuation, with respect to membership reconciliation, basic information (date of birth, date of hire, date of termination, sex, etc.), pensionable service, salary levels and pensions to retirees and survivors were performed. Based on the omissions and discrepancies identified by these and other tests, appropriate adjustments were made to the basic data after consulting with the data provider.
D.2 Summary of Membership Data
A summary of the valuation data as at 31 March 2018 and the reconciliation of contributors, pensioners, and survivors from 31 March 2015 to 31 March 2018 are shown in this section. Relevant detailed statistics on contributors, pensioners and survivors are shown in Appendix K.
| As at 31 March 2018 | As at 31 March 2015 | |
|---|---|---|
| Contributors | ||
| Number | 22,474 | 22,324 |
| Average Pensionable Earnings | $94,800Table 27 footnote * | $89,200Table 27 footnote ** |
| Average Age | 41.5 | 41.5 |
| Average Pensionable Service | 13.3 | 13.7 |
| Retirement Pensioners in PayTable 27 footnote *** | ||
| Number | 14,997 | 13,885 |
| Average Annual Pension in Pay | $49,000 | $46,300 |
| Average Age | 68.1 | 66.9 |
| Deferred PensionersTable 27 footnote *** | ||
| Number | 419 | 275 |
| Average Annual Deferred Pension | $13,600 | $14,200 |
| Average Age | 43.5 | 43.3 |
| Disability Pensioners | ||
| Number | 3,016 | 2,432 |
| Average Annual Pension | $36,900 | $35,700 |
| Average Age | 59.5 | 59.0 |
| Eligible Surviving Spouse | ||
| Number | 2,646 | 2,281 |
| Average Annual Pension | $21,200 | $19,700 |
| Average Age | 73.3 | 71.7 |
| Eligible Surviving Children | ||
| Number | 144 | 167 |
| Average Annual Pension | $2,900 | $3,000 |
Table 27 Footnotes
|
||
| Contributors | Retirement Pensioners in Pay |
Deferred Pensioners |
Disability Pensioners |
Surviving Spouses |
Surviving Children |
|
|---|---|---|---|---|---|---|
| As at 31 March 2015 | 22,324 | 13,885 | 275 | 2,432 | 2,281 | 167 |
| Data corrections | (2) | 14 | 63 | 3 | 34 | |
| New members | 3,133 | - | - | - | - | |
| Rehired pensioners | 12 | (2) | (9) | (1) | - | |
| Withdrawal - lump sums | (397) | - | (46) | - | - | |
| Deferred annuities | (165) | - | 165 | - | - | |
| Pensionable disabilities | (666) | - | (1) | 667 | - | |
| Pensionable retirements | (1,695) | 1,723 | (28) | - | - | |
| Emerging survivors | - | - | - | - | 521 | |
| Deaths | (70) | (623) | - | (85) | (190) | |
| As at 31 March 2018 | 22,474 | 14,997 | 419 | 3,016 | 2,646 | 144 |
| Former Regular Members | Former Civilian Members | Total | |||
|---|---|---|---|---|---|
| Male | Female | Male | Female | ||
| As at 31 March 2015 | 14,438 | 3,946 | 1,916 | 2,024 | 22,324 |
| Data corrections | 61 | 16 | (62) | (17) | (2) |
| New members | 2,193 | 561 | 163 | 216 | 3,133 |
| Rehired pensioners | 8 | 1 | 2 | 1 | 12 |
| Withdrawal - lump sums | (233) | (62) | (35) | (67) | (397) |
| Deferred annuities | (76) | (17) | (32) | (40) | (165) |
| Pensionable disabilities | (363) | (177) | (31) | (95) | (666) |
| Pensionable retirements | (1,229) | (197) | (144) | (125) | (1,695) |
| Deaths | (40) | (10) | (15) | (5) | (70) |
| As at 31 March 2018 | 14,759 | 4,061 | 1,762 | 1,892 | 22,474 |
| Former Regular Members | Former Civilian Members | Total | |||
|---|---|---|---|---|---|
| Male | Female | Male | Female | ||
| As at 31 March 2015 | 12,046 | 487 | 831 | 521 | 13,885 |
| Data corrections | 37 | 17 | (40) | - | 14 |
| New pensioners | 1,235 | 198 | 150 | 140 | 1,723 |
| Deaths | (533) | (4) | (67) | (19) | (623) |
| Rehired pensioners | (2) | - | - | - | (2) |
| As at 31 March 2018 | 12,783 | 698 | 874 | 642 | 14,997 |
| Former Regular Members | Former Civilian Members | Total | |||
|---|---|---|---|---|---|
| Male | Female | Male | Female | ||
| As at 31 March 2015 | 1,719 | 372 | 108 | 233 | 2,432 |
| Data corrections | 2 | 4 | (2) | (1) | 3 |
| Rehired pensioners | (1) | - | - | - | (1) |
| New pensioners | 364 | 177 | 31 | 95 | 667 |
| Deaths | (62) | (6) | (12) | (5) | (85) |
| As at 31 March 2018 | 2,022 | 547 | 125 | 322 | 3,016 |
| Former Regular Members | Former Civilian Members | Total | |||
|---|---|---|---|---|---|
| Male | Female | Male | Female | ||
| As at 31 March 2015 | 109 | 36 | 45 | 85 | 275 |
| Data corrections | 20 | 7 | 13 | 23 | 63 |
| Deferred annuities | 76 | 17 | 32 | 40 | 165 |
| New pensioners | (6) | (1) | (6) | (15) | (28) |
| Lump sums (previously deferred) | (26) | (8) | (5) | (7) | (46) |
| Pensionable disabilities | (1) | - | - | - | (1) |
| Deaths | - | - | - | - | - |
| Rehired pensioners | (5) | (1) | (2) | (1) | (9) |
| As at 31 March 2018 | 167 | 50 | 77 | 125 | 419 |
Appendix E - RCMPSA Valuation Methodology
E.1 Pension Assets and Accounts
E.1.1 RCMP Superannuation Account (Service prior to 1 April 2000)
The balance of the Superannuation Account forms part of the Public Accounts of Canada. The underlying notional bond portfolio described in Appendix C is shown at the book value.
The only other Superannuation Account-related amount consists of the discounted value of future member contributions and government costs in respect of prior service elections. The discounted value of future member contributions was calculated using the projected Account yields. The government cost is assumed to be equal to these future contributions.
E.1.2 RCMP Pension Fund (Service since 1 April 2000)
For valuation purposes, an adjusted market value method is used to determine the actuarial value of assets in respect of the Pension Fund. The method is unchanged from the previous valuation.
Under the adjusted market value method, the difference between the observed investment returns during a given plan year and the expected investment returns for that year based on the previous report assumptions, is recognized over five years at the rate of 20% per year. The actuarial value is then determined by applying a 10% corridor, such that the actuarial value of assets is within 10% of the market value of assets. As a result, the actuarial value of assets is a five-year smoothed market value where the investment gains or losses are recognized at the rate of 20% per year subject to a 10% corridor to the market value of assets. The value produced by this method is related to the market value of the assets but is more stable than the market value.
The only other Pension Fund-related asset consists of the discounted value of future member and government contributions in respect of prior service elections. The discounted value of future member contributions was calculated using the assumed rates of return on the Pension Fund. The government is assumed to contribute in the same proportion as for the RCMPSA current service cost.
The actuarial value of the assets, determined as at 31 March 2018, under the adjusted market value method is $10,293 million and was determined as follows:
| Plan Year | 2014 | 2015 | 2016 | 2017 | 2018 | |
|---|---|---|---|---|---|---|
| Actual net investment return (A) | 894 | 982 | 61 | 1101 | 980 | |
| Expected investment return (B)Table 33 footnote ** | 291 | 365 | 337 | 396 | 499 | |
| Investment gains (losses) (A-B) | 603 | 618 | (276) | 705 | 481 | |
| Unrecognized percentage | 0% | 20% | 40% | 60% | 80% | |
| Unrecognized investment gains (losses)Table 33 footnote *** | - | 124 | (110) | 423 | 385 | |
| Market value as at 31 March 2018 | 11,097 | |||||
| Less | ||||||
| Total Unrecognized investment gains (losses) | 821 | |||||
| Actuarial value as at 31 March 2018 (before application of corridor) | 10,276 | |||||
| Impact of application of corridorTable 33 footnote **** | 0 | |||||
| Actuarial value as at 31 March 2018 (after application of corridor) | 10,276 | |||||
| Plus | ||||||
| Present value of prior service contributions | 17 | |||||
| Actuarial value as at 31 March 2018 | 10,293 | |||||
Table 33 Footnotes
|
||||||
E.2 Actuarial Cost Method
As benefits earned in respect of current service will not be payable for many years, the purpose of an actuarial cost method is to assign costs over the working lifetime of the members.
As in the previous valuations, the projected accrued benefit actuarial cost method (also known as the projected unit credit method) was used to determine the current service cost and actuarial liability. Consistent with this cost method, pensionable earnings are projected up to retirement using the assumed annual increases in average pensionable earnings (including seniority and promotional increases). The yearly maximum salary cap and other benefit limits under the Income Tax Act described in Appendix B were taken into account to determine the benefits payable under the RCMPSA and those payable under the RCA.
E.2.1 Current Service Cost
Under the projected accrued benefit actuarial cost method, the current service cost, also called the normal cost, computed in respect of a given year is the sum of the value, discounted in accordance with the actuarial assumptions for the Pension Fund, of all future payable benefits considered to accrue in respect of that years of service. The Pension Fund administrative expenses are also included in the total current service cost.
Under this method, the current service cost for an individual member will increase each year as the member approaches retirement. However, all other things being equal, the current service cost for the total population, expressed as a percentage of total pensionable payroll, can be expected to remain stable as long as the average age, service and gender distribution of the total population remain constant.
For a given year, the government current service cost is the total current service cost reduced by the members' contributions during the year. Future members' contribution rates are assumed to be equal to the contribution rates of Group 1 contributors under the PS pension plan; they are estimates only and subject to change. More information on the methodology used to determine the rates assumed under the PS pension plan can be found in the Actuarial Report on the Pension Plan for the Public Service of Canada as at 31 March 2017.
E.2.2 Actuarial Liability
The actuarial liability with respect to contributors corresponds to the value, discounted in accordance with the actuarial assumptions, of all future payable benefits accrued as at the valuation date in respect of all previous service. For pensioners and survivors, the actuarial liability corresponds to the value, discounted in accordance with the actuarial assumptions, of future payable benefits.
E.2.3 Actuarial Excess/(Shortfall) and Surplus(Deficit)
The actuarial excess/(shortfall) or surplus/(deficit) is the difference between the account balance or the total value of assets and the actuarial liability. A new actuarial shortfall/deficit should be amortized over a period not exceeding 15 years through special credits/payments and the disposition of any actuarial excess/surplus is defined in the RCMPSA.
E.2.4 Government Contributions
The recommended government contribution corresponds to the sum of:
- the government current service cost;
- the government contributions for prior service; and
- as applicable, special credits/payments in respect of a shortfall/deficit or as the case may be, actuarial surplus debits.
E.2.5 Hypothetical Wind-Up Valuation
The government is responsible for the payment of accrued pension benefits. As such, the likelihood of the plan being wound-up and its obligations not being fulfilled is practically nonexistent. Additionally, the Act does not define the benefits payable upon wind-up. Therefore, a hypothetical wind-up valuation has not been performed.
E.3 Projected Yields
The projected yields (shown in Appendix F) assumed for computing the present value of accrued benefits to be credited to the Superannuation Account are the projected annual yields on the combined book value of the Superannuation Accounts of the Public Service, Canadian Forces, and RCMP pension plans.
The projected Account yields were determined by an iterative process involving the following:
- the combined notional bond portfolio of the three Accounts as at the valuation date,
- the assumed future new money interest rates (also shown in Appendix F),
- the expected future benefits payable in respect of all pension entitlements accrued up to 31 March 2000,
- the expected future contributions and costs for prior service elections, and
- the expected future administrative expenses.
The quarterly interest credited to an Account is calculated as if the principal at the beginning of a quarter remains unchanged during the quarter.
The projected rates of return (shown in Appendix F) assumed for computing the present value of the benefits accrued or accruing to be credited to the Pension Fund were developed on the basis that the Fund holds a diversified mix of assets.
E.4 Membership Data
For valuation purposes, individual data on each member were used.
The member data shown in Appendices D and K were provided as at 31 March 2018. This valuation is based on the member data as at the valuation date.The information in respect of contributions for elected prior service was provided as at 31 March 2018. Future member contributions in respect of elected prior service take into account only the payment streams that were in effect at 31 March 2018. Only payments due after 31 March 2018 were included.
Appendix F - RCMPSA Economic Assumptions
All of the assumptions used in this report are best-estimate assumptions, i.e., they reflect our best judgement of the future long-term experience of the plan and do not include margins.
F.1 Inflation-Related Assumptions
F.1.1 Level of Inflation
Price increases, as measured by changes in the Consumer Price Index (CPI), tend to fluctuate from year to year. In 2016, the Bank of Canada and the Government renewed their commitment to keep inflation between 1% and 3% until the end of 2021. In this report, to reflect recent experience, it is assumed that the level of inflation will decrease from 2.2% in plan year 2019 to its ultimate rate of 2.0% in 2020. The ultimate rate of 2.0% is unchanged from the assumed rate in the previous valuation.
F.1.2 Pension Indexing
The year's pension indexing factor is required in the valuation process by virtue of its role in maintaining the purchasing power of pensions. It was derived by applying the indexation formula described in Appendix A, which relates to the assumed CPI increases over successive 12-month periods ending on 30 September.
F.2 Employment Earnings Increases
F.2.1 Increase in the Year's Maximum Pensionable Earnings (YMPE)
As described in Appendix A, the plan is coordinated with the Canada Pension Plan and the Quebec Pension Plan. Since the benefit payable under the plan when a pensioner attains age 65Footnote 10 is calculated based on the YMPE, an assumption for the increase in the YMPE is required in the valuation process. The assumed increase in the YMPE for a given calendar year is derived, in accordance with the Canada Pension Plan to correspond to the increase in the average weekly earnings (AWE), as calculated by Statistics Canada, over successive 12 month periods ending on 30 June. The AWE, and thus the YMPE, is deemed to include a component for seniority and promotional increases. The YMPE is equal to $57,400 for calendar year 2019. Future increases in the YMPE correspond to the assumed realFootnote 11 increases in the AWE plus assumed increases in the CPI.
The real-wage differential (real increase in the AWE) is developed by taking into account historical trends, a possible labour shortage and an assumed moderate economic growth for Canada; it is assumed to be 0.3% for plan year 2020, and is expected to gradually increase to the ultimate assumption of 1.0% by 2025 (1.1% in plan year 2022 in the previous valuation). The ultimate real-wage differential assumption combined with the ultimate price increase assumption results in an assumed annual increase in nominal wages of 3.0% in plan year 2026 and thereafter. Thus, the ultimate rate of increase for the YMPE is 3.0%.
F.2.2 Increase in Average Pensionable Earnings
Average pensionable earnings are applicable to plan members only, whereas the YMPE applies to the general working population in Canada. In addition, increases in average pensionable earnings are exclusive of seniority and promotional increases, which are considered under a separate demographic assumption. Thus, the annual increase in average pensionable earnings is assumed to be 0.3% lower than the corresponding increase in the YMPE (0.2% lower in the previous valuation). This corresponds to an ultimate value of 2.7% (2.9% in the previous valuation) in plan year 2026.
F.2.3 Increase in Maximum Pensionable Earnings (MPE)
Since the plan is coordinated with the Canada Pension Plan and the Quebec Pension Plan, the tax-related maximum pensionable earnings were derived from both the maximum annual pension accrual under a registered defined benefit plan and the YMPE. The maximum annual pension accrual of $2,944.44 for 2018 will increase to $3,025.56 for 2019, in accordance with Income Tax Regulations. Thereafter, the maximum annual pension accrual is assumed to increase in accordance with the assumed annual increase in the YMPE.
Beginning with calendar year 2012, the coordination factor is 0.625%. The MPE is equal to $169,300 for calendar year 2019.
F.3 Investment-Related Assumptions
F.3.1 New Money Rate
The new money rate is the nominal yield on 10-year-plus Government of Canada bonds and is set for each year in the projection period. The real yield on 10-year-plus federal bonds is equal to the new money rate less the assumed rate of inflation.
Recognizing recent experience, the annual real yield on 10-year-plus federal bonds is assumed to be 0.2% in plan year 2019, and is predicted to increase gradually to its ultimate level of 2.6% in plan year 2030. The short-term (2019-2023) increase is consistent with the average of private sector forecasts. The ultimate real yield was 2.8% in the previous valuation. The real new money rates over the first ten years of the projection are on average 0.9% lower than assumed for the corresponding years in the previous valuation.
F.3.2 Projected Yields on Superannuation Account
These yields are required for the computation of present values of benefits to determine the liability for service prior to 1 April 2000. The methodology used to determine the projected yields on the Superannuation Account is described in Appendix E.3. However, since the real projected yields are determined based on the real yields on 10-year-plus federal bonds, they are projected to be lower than assumed in the previous valuation (the ultimate projected yield is 0.2% lower than in the previous valuation).
F.3.3 Rate of Return on the Pension Fund
The expected annual nominal rates of return on the Pension Fund are required for the computation of present values of benefits to determine the liability for service since 1 April 2000 and the current service cost. The following sections describe how the rates of return on the Pension Fund are determined.
F.3.3.1 Investment Strategy
Since 1 April 2000, government and employee contributions, net of benefit payments and administrative expenses, are invested in capital markets by the Public Sector Pension Investment Board (PSPIB). PSPIB aims to maximize returns without undue risk of loss according to the investment policy set and approved by its Board of Directors that takes into account the needs of contributors and beneficiaries, as well as financial market constraints. For the purpose of this report, the investments have been grouped into four broad categories: fixed income securities, equities, real assets and credit. Fixed income securities consist of a mix of federal, provincial and real return bonds and cash. Equities consist of public (Canadian and foreign) and private equities. Real assets include real estate, infrastructure and natural resources. Credit is composed of private debt investments.
As at 31 March 2018, PSPIB's assets consisted of 18% fixed income securities (including 2% cash), 48% equity (including 1% complementary investments), 28% real assets and 6% credit. PSPIB has developed a long-term target Policy Portfolio (approved by its Board of Directors in the fall of 2018 and subject to an annual review), which consists of 20% fixed income securities, 43% equity, 30% real assets and 7% credit. The Policy Portfolio asset mix weights represent long-term targets. Therefore, it is assumed that the initial asset mix (derived using the actual investments reported by PSPIB as at 31 March 2018) will slowly converge towards the long-term target Policy Portfolio. The ultimate asset mix is assumed to be reached in plan year 2023.
Net cash flows (contributions less expenditures, disregarding special payments) are expected to become negative during plan year 2030 at which point a portion of investment income will be required to pay benefits. Changes to the assumed asset mix may be required in the future to reduce funding risks and to take into account the maturity of the plan.
Table 34 presents the assumed asset mix for each plan year throughout the projection period.
| Plan Year | Fixed Income SecuritiesTable 34 footnote * |
Cash | Public Equity | Private Equity | Real Assets | Credit |
|---|---|---|---|---|---|---|
| 2019 | 16 | 2 | 34 | 14 | 28 | 6 |
| 2020 | 16 | 2 | 33 | 14 | 28 | 7 |
| 2021 | 17 | 2 | 32 | 13 | 29 | 7 |
| 2022 | 18 | 2 | 31 | 13 | 29 | 7 |
| 2023+ | 18 | 2 | 30 | 13 | 30 | 7 |
Table 34 Footnotes
|
||||||
F.3.3.2 Real Rates of Return by Asset Class
Rates of return are determined for each asset class in which the Pension Fund assets are invested. With the exception of fixed income securities and cash, rates of return are assumed to remain constant for the entire projection period. The expected progression of fixed income securities' rates of return reflects the current context of low yields and the general outlook that yields will increase over the coming years. A constant rate of return is assumed for more volatile asset classes, reflecting the difficulty to predict annual market returns.
The rates of return were developed by looking at historical returns (expressed in Canadian dollars); these returns were then adjusted upward or downward to reflect future expectations. Given the long projection period, future gains and (losses) due to currency variations were expected to offset each other over time. Hence, it was assumed that currency variations will not have an impact on the long-term rates of return.
In the previous valuation, the assumed rates of return of each asset class included an allowance for rebalancing and diversification that is achieved through the rebalancing of the portfolio that keeps the asset mix constant over time. For this valuation, an overall diversification allowance is instead added to the rate of return on the total assets. Details are presented in subsection F.3.3.4.
All rates of return described in this section are shown before reduction for assumed investment expenses; subsection F.3.3.3 describes how the returns are adjusted for investment expenses.
Fixed Income Securities
As at 31 March 2018, PSPIB had 18% of its portfolio invested in fixed income securities, including Canadian fixed income, inflation-linked bonds (mostly US Treasury Inflation-Protected Securities (TIPS)) and cash. It is assumed that the proportion invested in fixed income securities (including cash) will increase to 20% of Pension Fund assets in plan year 2022 and remain at that level for the projection period.
The fixed income securities' ultimate mix (excluding cash) in plan year 2023 is expected to consist of 25% federal bonds, 25% provincial bonds and 50% US TIPS, which reflects PSPIB's long-term target allocation.
As described in subsection F.3.1 above, the assumed real yield on 10-year-plus federal bonds is expected to increase from 0.2% in plan year 2019 to an ultimate rate of 2.6% in plan year 2030. The short-term (2019-2023) increase in real yield is consistent with the average private sector forecasts. The initial spread for long-term provincial bonds over the 10-year-plus federal bond real yield is assumed to be 75 basis points while the ultimate spread is assumed to be 65 basis points (in plan year 2029). The initial spread on inflation-linked bonds is assumed to be 50 basis points and is expected to decrease to 10 basis points in plan year 2029.
Since the current PSPIB policy portfolio and its long-term target Policy Portfolio is composed of universe bonds (long, mid and short terms), it is assumed that fixed income securities are composed of universe bonds for the entire projection period. Due to their overall shorter maturity, the yields on universe bonds are lower than the yields on long-term bonds. The spread between the 10-year-plus federal bonds and the universe of federal bonds is assumed to increase from 20 basis points in plan year 2019 to 70 basis points in plan year 2029. The spread between universe federal bonds and universe provincial bonds is assumed to increase from 65 basis points to 85 basis points between plan year 2019 and plan year 2029. Note that the recent flattening yield curves help to explain the low 2019 spread levels above.
The expected real rates of return for individual bonds take into account the coupons and market value fluctuations due to the expected movement of their respective yield rates. The 10-year-plus federal bonds yield is assumed to increase between plan years 2019 and 2030. Therefore, bond returns are quite low for the first ten years of the projection. The assumed ultimate real rate of return for 10-year-plus federal bonds is 2.6% starting in plan year 2030. An ultimate fixed income real rate of return of 2.5% is assumed for 2030 and thereafter.
Equity
Currently, approximately half of the assets of the Pension Fund are invested in equities (both public and private). In the derivation of the real rates of return for these equity investments, consideration was given to the long-term equity risk premiums. The rates of return also include dividends from the equities and market value fluctuations. No distinction is made between realized and unrealized capital gains and losses.
Consistent with the assumption that risk taking must be rewarded, equity returns are developed by adding an equity risk premium to the 10-year-plus federal bonds' real rate of return. The historical equity risk premium over long-term government bonds' returns for 23 countries, representing about 90% of global stock market value, for the 119-year and 50-year periods ending in 2018 were 3.0% and 0.3% respectively. Historically, the equity risk premium over 119 years was higher than expected due to several non-repeatable factors (mainly diversification and globalization). As a result, the long-term expected equity risk premium is assumed to be lower than what was realized in the past 119 years. However, given the low bond returns over the first ten years of the projection period, the equity risk premium is assumed to be higher initially and to slowly decrease to its ultimate rate of 1.6% for public equities. The equity risk premium for private equities is expected to be 80 basis points higher than for public equities, reflecting the additional risk inherent with investments in the private markets.
As described in the previous section, the 10-year-plus federal bond real rate of return is set at 2.6% for plan years 2030 and thereafter. The real rates of return for public and private equities are thus projected at 4.2% and 5.0% respectively.
Real Assets
Real assets such as real estate, infrastructure and natural resources are considered to be a hybrid of fixed income and equity. They are assumed to share characteristics of both of these asset classes in the proportion of 30% fixed income and 70% public equity, the same as in the previous valuation. Hence, the assumed return on real assets is composed of 30% of the return on fixed income securities and 70% of the return on public equity. Considering the inherent difficulties in modelling short-term returns for volatile assets, real assets are projected to earn 3.7% throughout the projection period.
Credit
Credit is also considered to be a hybrid of fixed income and equity. It is assumed to share characteristics of both of these asset classes in equal proportions. Hence, the assumed return on credit is composed of 50% of the return on fixed income securities and 50% of the return on public equity. Considering the inherent difficulties in modelling short-term returns for volatile assets, credit is projected to earn 3.3% throughout the projection period.
Table 35 summarizes the assumed real rates of return by asset class throughout the projection period, before the allowance for rebalancing and diversification and prior to reduction for investment expenses.
| Plan Year | Fixed Income Securities | Cash | Public Equity | Private Equity | Real Assets | Credit |
|---|---|---|---|---|---|---|
| 2019 | (3.0) | (1.5) | 4.2 | 5.0 | 3.7 | 3.3 |
| 2020 | (3.1) | (1.0) | 4.2 | 5.0 | 3.7 | 3.3 |
| 2021 | (1.6) | (0.5) | 4.2 | 5.0 | 3.7 | 3.3 |
| 2022 | 0.8 | (0.1) | 4.2 | 5.0 | 3.7 | 3.3 |
| 2023 | 0.4 | - | 4.2 | 5.0 | 3.7 | 3.3 |
| 2024 | 0.3 | 0.2 | 4.2 | 5.0 | 3.7 | 3.3 |
| 2025 | 0.7 | 0.3 | 4.2 | 5.0 | 3.7 | 3.3 |
| 2026 | 0.5 | 0.5 | 4.2 | 5.0 | 3.7 | 3.3 |
| 2027 | 1.5 | 0.7 | 4.2 | 5.0 | 3.7 | 3.3 |
| 2028 | 1.5 | 0.8 | 4.2 | 5.0 | 3.7 | 3.3 |
| 2029 | 1.4 | 0.9 | 4.2 | 5.0 | 3.7 | 3.3 |
| 2030+ | 2.5 | 1.0 | 4.2 | 5.0 | 3.7 | 3.3 |
F.3.3.3 Investment Expenses
Over the last three plan years, PSPIB's operating and asset management expenses averaged 0.7% of average net assets. It is assumed that going forward, PSPIB investment expenses will average 0.7% of average net assets. The majority of those investment expenses were incurred through active management decisions.
The active management objective is to generate returns in excess of those from the policy portfolio, after reduction for additional expenses. Thus, the additional returns from a successful active management program should equal at least the cost incurred to pursue active management. In nine of the past ten years, PSPIB's additional returns from active management exceeded related expenses. For the purpose of this valuation, it is assumed that additional returns due to active management will equal additional expenses related to active management. These expenses are assumed to be the difference between total investment expenses of 0.7% and the assumed expenses of 0.2% that would be incurred for passive management of the portfolio.
The next section shows the overall rate of return on the fund net of investment expenses.
F.3.3.4 Overall Rate of Return on Assets of the Pension Fund
The best-estimate rate of return on total assets is derived from the weighted average assumed rate of return on all asset class using the assumed asset mix proportions as weights. The best-estimate rate of return is further increased to reflect additional returns due to active management and reduced to reflect all investment expenses. The ultimate nominal and real rates of return are developed as follows:
| Nominal | Real | |
|---|---|---|
| Weighted average rate of return | 5.7% | 3.7% |
| Additional returns due to active management | 0.5% | 0.5% |
| Allowance for rebalancing and diversificationTable F.3.3.4 footnote * | 0.5% | 0.5% |
| Expected investment expenses | ||
| Expenses due to passive management | (0.2%) | (0.2%) |
| Additional expenses due to active management | (0.5%) | (0.5%) |
| Total expected investment expenses | (0.7%) | (0.7%) |
| Net rate of return | 6.0% | 4.0% |
Table F.3.3.4 Footnotes
|
||
The resulting nominal and real rates of return for each projection year are as follows:
| Plan Year | Nominal | Real |
|---|---|---|
| 2019 | 5.3 | 3.1 |
| 2020 | 5.1 | 3.1 |
| 2021 | 5.3 | 3.3 |
| 2022 | 5.6 | 3.6 |
| 2023 | 5.6 | 3.6 |
| 2024 | 5.6 | 3.6 |
| 2025 | 5.6 | 3.6 |
| 2026 | 5.6 | 3.6 |
| 2027 | 5.8 | 3.8 |
| 2028 | 5.8 | 3.8 |
| 2029 | 5.8 | 3.8 |
| 2030+ | 6.0 | 4.0 |
| 2019-2023 | 5.4 | 3.3 |
| 2019-2028 | 5.5 | 3.5 |
| 2019-2038 | 5.8 | 3.7 |
| Flat Equivalent Rate | 5.8 | 3.8 |
It is assumed that the ultimate real rate of return on investments will be 4.0% in 2030 , net of all investment expenses. This represents a reduction of 0.1% from the previous valuation. The real rates of return over the first ten years of the projection are on average 0.3% lower than assumed for the corresponding years in the previous valuation. The real rate of return on assets takes into account the assumed asset mix as well as the assumed real rate of return for all categories of assets. The nominal returns projected for the Pension Fund are simply the sum of the assumed level of inflation and the real return.
Using the variable real rates of return on assets shown in Table 36 above is equivalent to using a flat real discount rate of 3.8% for purpose of calculating the liability as at 31 March 2018 for service since 1 April 2000.
F.3.4 Transfer Value Real Interest Rate
Commuted values are calculated in accordance with the Standards of Practice published by the Canadian Institute of Actuaries. In particular, the real interest rates to be used for the computation of commuted values as at a particular date are as follows:
First 10 years: r7 + 0.90%
After 10 years: rL + 0.5 × (rL-r7) + 0.90%

rL is the long term real-return Government of Canada bond yield, annualized
iL is the long term Government of Canada benchmark bond yield, annualized and
i7 is the 7-year Government of Canada benchmark bond yield, annualized
The obtained rates of interest are rounded to the next multiple of 0.10%.
For example, for plan year 2020, the assumed real interest rates are 2.0% for the first 10 years and 2.2% thereafter. The rates are derived from the assumed CPI increase, the assumed 10-year-plus Government of Canada benchmark bond yield which corresponds to the new money rate in this valuation and the assumed spreadsFootnote 12 between the new money rate and the long-term real-return Government of Canada bond yield, the long-term Government of Canada benchmark bond yield and the 7-year Government of Canada benchmark bond yield. The following table shows the assumed transfer value real interest rates used in this report:
| Plan Year | rL | iL | i7 | r7 | Real Interest Rates | |
|---|---|---|---|---|---|---|
| First 10 Years | After 10 Years | |||||
| 2019 | 0.87 | 2.42 | 2.26 | 0.81 | 1.7 | 1.8 |
| 2020 | 1.22 | 2.94 | 2.63 | 1.09 | 2.0 | 2.2 |
| 2021 | 1.48 | 3.26 | 2.85 | 1.30 | 2.2 | 2.5 |
| 2022 | 1.58 | 3.46 | 2.99 | 1.36 | 2.3 | 2.6 |
| 2023 | 1.69 | 3.67 | 3.14 | 1.44 | 2.3 | 2.7 |
| 2024 | 1.73 | 3.78 | 3.22 | 1.48 | 2.4 | 2.8 |
| 2025 | 1.83 | 3.99 | 3.37 | 1.55 | 2.4 | 2.9 |
| 2026 | 1.89 | 4.09 | 3.44 | 1.59 | 2.5 | 2.9 |
| 2027 | 1.99 | 4.30 | 3.54 | 1.63 | 2.5 | 3.1 |
| 2028 | 2.18 | 4.50 | 3.74 | 1.81 | 2.7 | 3.3 |
| 2029 | 2.38 | 4.70 | 3.94 | 1.99 | 2.9 | 3.5 |
| 2030+ | 2.48 | 4.80 | 4.04 | 2.09 | 3.0 | 3.6 |
F.3.5 Summary of Economic Assumptions
The economic assumptions used in this report are summarized in the following table.
| Plan Year | Inflation | Employment Earning Increases | Interest | |||||
|---|---|---|---|---|---|---|---|---|
| CPI IncreaseTable 38 footnote 2 | Pension IndexationTable 38 footnote 3 | YMPETable 38 footnote 3 | Average Pensionable EarningsTable 38 footnote 4,Table 38 footnote 5 | Maximum Pensionable EarningsTable 38 footnote 3,Table 38 footnote 6 | New Money Rate | Projected Yield on Account | Projected Return on Fund | |
| 2019 | 2.2 | 2.2 | 2.7 | 2.0 | 2.8 | 2.4 | 4.0 | 5.3 |
| 2020 | 2.0 | 1.9 | 2.3 | 2.0 | 2.3 | 2.7 | 3.8 | 5.1 |
| 2021 | 2.0 | 2.0 | 2.5 | 2.2 | 2.5 | 3.1 | 3.6 | 5.3 |
| 2022 | 2.0 | 2.0 | 2.6 | 2.3 | 2.6 | 3.5 | 3.5 | 5.6 |
| 2023 | 2.0 | 2.0 | 2.7 | 2.4 | 2.7 | 3.6 | 3.4 | 5.6 |
| 2024 | 2.0 | 2.0 | 2.8 | 2.5 | 2.8 | 3.8 | 3.3 | 5.6 |
| 2025 | 2.0 | 2.0 | 2.9 | 2.6 | 2.9 | 3.9 | 3.3 | 5.6 |
| 2026 | 2.0 | 2.0 | 3.0 | 2.7 | 3.0 | 4.1 | 3.2 | 5.6 |
| 2027 | 2.0 | 2.0 | 3.0 | 2.7 | 3.0 | 4.3 | 3.1 | 5.8 |
| 2028 | 2.0 | 2.0 | 3.0 | 2.7 | 3.0 | 4.4 | 3.1 | 5.8 |
| 2029 | 2.0 | 2.0 | 3.0 | 2.7 | 3.0 | 4.5 | 3.0 | 5.8 |
| 2030 | 2.0 | 2.0 | 3.0 | 2.7 | 3.0 | 4.6 | 3.0 | 6.0 |
| 2035 | 2.0 | 2.0 | 3.0 | 2.7 | 3.0 | 4.6 | 3.2 | 6.0 |
| 2040 | 2.0 | 2.0 | 3.0 | 2.7 | 3.0 | 4.6 | 4.2 | 6.0 |
| 2045 | 2.0 | 2.0 | 3.0 | 2.7 | 3.0 | 4.6 | 4.5 | 6.0 |
| 2048+ | 2.0 | 2.0 | 3.0 | 2.7 | 3.0 | 4.6 | 4.6 | 6.0 |
Table 38 Footnotes
|
||||||||
For the period ending December 2017, the following table was prepared based on the Canadian Institute of Actuaries Report on Canadian Economic Statistics 1924 2017.
| Period of Years Ending 2017 | 15 | 25 | 50 |
|---|---|---|---|
| Level of Inflation | 1.7% | 1.8% | 4.0% |
| Real Increases in Average Earnings | 0.8% | 0.4% | 0.7% |
| Real Yield on Long-Term Canada Bonds | 1.7% | 2.9% | 3.1% |
| Real Return on Long-Term Canada Bonds | 4.4% | 5.8% | 4.1% |
| Average Real Return on Diversified Portfolios | 5.7% | 6.4% | 4.7% |
Appendix G - RCMPSA Demographic and Other Assumptions
G.1 Demographic Assumptions
Given the size of the population subject to the RCMPSA, the plan's own experience, except where otherwise noted, was deemed to be the best model to determine the demographic assumptions. Assumptions from the previous valuation were updated to reflect past experience to the extent that it was deemed credible.
G.1.1 Seniority and Promotional Salary Increases
Seniority means length of service and promotion means moving to a higher rank.
Minor adjustments were made to the seniority and promotional salary increase assumption for Regular Members based on the experience during the intervaluation period. The assumed seniority and promotional salary increases for Regular Members were decreased at lower service duration and increased at higher service durations with no material change on average when compared to the previous valuation. The assumption fully recognizes the Service Pay Allowance of 1.5% granted at durations 4, 10, 15, 20, 25, 30 and 35, and the 5% Senior Constable Provisional Allowance granted after seven completed years of service.
The assumed seniority and promotional salary increases for Civilian Members were decreased at all service durations based on experience during the intervaluation period. The resulting assumption is on average 0.25% lower than assumed in the previous valuation.
| Completed Years of ServiceTable 39 footnote * |
Regular Members | Civilian Members |
|---|---|---|
| 0 | 23.0 | 4.6 |
| 1 | 7.8 | 4.1 |
| 2 | 6.8 | 3.4 |
| 3 | 1.7 | 2.9 |
| 4 | 0.2 | 2.7 |
| 5 | 0.2 | 2.1 |
| 6 | 4.6 | 2.0 |
| 7 | 0.6 | 2.0 |
| 8 | 0.6 | 1.8 |
| 9 | 2.1 | 1.8 |
| 10 | 0.6 | 1.4 |
| 15 | 0.8 | 1.2 |
| 20 | 0.9 | 0.9 |
| 25 | 0.8 | 0.8 |
| 30 | 0.5 | 0.7 |
Table 39 Footnotes
|
||
G.1.2 New Contributors
The new contributor assumption was changed from the previous valuation. As in the previous valuation, this assumption recognizes that the proportion of female Regular Members is increasing. As a result of the planned transfer of active Civilian Members to the PS pension plan, it is assumed that no new Civilian Members will be joining the RCMP pension plan in the future.
| Regular Members | ||
|---|---|---|
| Plan Year | Male | Female |
| 2019 | 0.80 | 2.10 |
| 2020 | 0.80 | 2.10 |
| 2021 | 0.60 | 1.90 |
| 2022 | 0.60 | 1.90 |
| 2023 | 0.60 | 1.90 |
| 2028 | 0.60 | 1.90 |
| 2033 | 0.40 | 1.70 |
| 2034+ | 0.70 | 0.70 |
The age distribution of new Regular Members is based on the distribution of actual new contributors during the intervaluation period. As demographic characteristics at entry and qualifications are constantly evolving, short-term experience was deemed a better model to determine the demographics of new entrants.
The initial salary for new Regular Members in a given age-sex cell in plan year 2019 is based on the intervaluation experience. Most new Regular Members (97% of new male members and 98% of new female members) are assumed to be hired at the entry level rank for Constables. Their initial salary for plan year 2019 is therefore assumed to be $55,291Footnote 13. The initial salary for the remaining new contributors is $89,589 to reflect that not all new employees are hired at the entry level rank for Constables. The initial salary is assumed to increase in future plan years in accordance with the assumption for average pensionable earnings increases.
G.1.3 Pensionable Retirement
As in the previous valuations, assumed rates of pensionable retirement for Regular Members were changed for this valuation. Analysis of past experience prior to 2012 showed that Regular Members had been delaying retirementFootnote 14. This trend was not observed in the previous intervaluation period (2012 to 2015) nor in the current intervaluation period (2015 to 2018). The opposite was seen instead, to a moderate degreeFootnote 15.
As a result of the intervaluation experience, pensionable retirement rates were adjusted to generally reflect higher rates for ages below 59 and lower rates for ages 59 and above.
| Age Last BirthdayTable 41 footnote * | Completed Years of Service in the Force | ||||||
|---|---|---|---|---|---|---|---|
| 19 | 20-22 | 23 | 24-28 | 29-33 | 34 | 35+ | |
| 40 | 10 | 10 | - | - | - | - | - |
| 45 | 10 | 10 | 40 | 50 | - | - | - |
| 50 | 20 | 20 | 60 | 60 | 90 | - | - |
| 55 | 40 | 50 | 100 | 100 | 150 | 430 | 400 |
| 60 | 200 | 200 | 300 | 300 | 300 | 500 | 400 |
| 64 | 1,000 | 1,000 | 1,000 | 1,000 | 1,000 | 1,000 | 1,000 |
Table 41 Footnotes
|
|||||||
The retirement experience during the intervaluation period for Civilian Members was very close to expected based on the previous valuation's assumptions. As such, the pensionable retirement assumption for Civilian Members remains unchanged from the previous valuation.
| Age Last BirthdayTable 42 footnote * | Completed Years of Pensionable Service | |||||||
|---|---|---|---|---|---|---|---|---|
| 1-8 | 9-13 | 14-18 | 19-23 | 24-28 | 29-33 | 34 | 35+ | |
| 50 | 10 | 10 | 10 | 10 | 10 | 40 | - | - |
| 55 | 10 | 20 | 30 | 30 | 40 | 100 | 700 | 400 |
| 60 | 100 | 200 | 200 | 200 | 200 | 200 | 700 | 400 |
| 64 | 1,000 | 1,000 | 1,000 | 1,000 | 1,000 | 1,000 | 1,000 | 1,000 |
Table 42 Footnotes
|
||||||||
G.1.4 Disability Retirement
Disability retirement rates for male Regular Members between the ages of 50 and 60 were decreased to reflect the intervaluation experience. The intervaluation experience for male Regular Members under the age of 50 and for female Regular Members was in line with what was expected based on the previous valuation assumptions. As such, no changes were made for these groups.
Disability retirement rates for Civilian Members were changed for this valuation. In the previous valuation, the disability retirement rates were changed to reflect those from the Actuarial Report on the Pension Plan for the Public Service of Canada as at 31 March 2014. The intervaluation experience showed more observed disability retirements than expected. To reflect that Civilian Members have higher disability retirement rates than members of the PS pension plan, it was decided to use an equal weighted blend between disability rates for Regular Members from this report and disability rates for members of the PS pension plan from the Actuarial Report on the Pension Plan for the Public Service of Canada as at 31 March 2017.
Based on the intervaluation experience, it is assumed that 15% of future new Regular Member disability pensioners will receive a CPP/QPP disability pension (10% in the previous valuation). It is further assumed that 75% of future new Civilian Member disability pensioners will receive a CPP/QPP disability pension (unchanged from the previous valuation). The assumption for Civilian Members is in line with the assumption for members of the PS pension plan from the Actuarial Report on the Pension Plan for the Public Service of Canada as at 31 March 2017.
| Age Last BirthdayTable 43 footnote * | Regular Members | Civilian Members | ||
|---|---|---|---|---|
| Male | Female | Male | Female | |
| 30 | 1.0 | 3.0 | 0.57 | 1.71 |
| 40 | 4.0 | 6.0 | 2.41 | 3.92 |
| 50 | 20.0 | 40.0 | 11.54 | 22.69 |
| 59 | 40.0 | 50.0 | 23.59 | 30.15 |
Table 43 Footnotes
|
||||
G.1.5 Withdrawal
Withdrawal means ceasing to be employed for reasons other than death or retirement with an immediate annuity or an annual allowance. A contributor with at least two years of service upon termination can opt for a deferred annuity payable commencing at age 60 or for the commuted value of such a deferred annuity.
Based on the intervaluation experience, there were significantly more withdrawals than expected for both Regular and Civilian Members, especially at higher service durations. The withdrawal rates for this valuation were therefore increased from the previous valuation rates.
In the previous valuation, 50% of all contributors who withdraw with at least five years of service were assumed to choose the deferred annuity option. Based on the experience from the intervaluation period, the proportion of members electing for a deferred annuity option was decreased to 40%. The other contributors who withdraw are assumed to opt for the commuted value of the deferred annuity.
| Completed Years of ServiceTable 44 footnote * | Regular Members | Civilian Members |
|---|---|---|
| 0 | 24 | 26 |
| 1 | 18 | 24 |
| 5 | 6 | 21 |
| 10 | 6 | 18 |
| 15 | 4 | 7 |
| 20+ | - | - |
Table 44 Footnotes
|
||
G.1.6 Mortality
Based on the intervaluation experience, there were fewer deaths than expected for healthy male Regular Members. The mortality rates were therefore decreased for the core age groups (ages 50 to 85). The resulting mortality rates are on average 6% lower than those projected based on the previous valuation assumption.
Mortality rates for healthy female Regular Members were developed on the same basis as the previous valuation. They are based on the combined (public and private) 2014 Canadian Pensioners Mortality Table (CPM2014) published by the Canadian Institute of Actuaries, projected to plan year 2019 with mortality improvement scale CPM Improvement Scale B (CPM-B).
Mortality rates for healthy Civilian Members and surviving spouses are from the most recent actuarial report on the PS pension plan (31 March 2017)Footnote 16 projected to plan year 2019. Although the basis for setting the mortality rates has not changed, the resulting mortality rates are different from those projected from the previous valuation assumptions since they were based on the previous actuarial report on the PS pension plan (31 March 2014).
| Age Last BirthdayTable 45 footnote * | Regular Members | Civilian Members | Surviving Spouses | |||
|---|---|---|---|---|---|---|
| Male | Female | Male | Female | Male | Female | |
| 30 | 0.5 | 0.3 | 0.3 | 0.2 | 1.0 | 0.4 |
| 40 | 0.8 | 0.6 | 0.5 | 0.5 | 2.3 | 0.8 |
| 50 | 1.6 | 1.3 | 1.2 | 1.2 | 3.6 | 1.9 |
| 60 | 3.9 | 3.5 | 3.9 | 3.0 | 9.2 | 4.5 |
| 70 | 11.2 | 8.7 | 12.8 | 9.7 | 18.9 | 12.7 |
| 80 | 43.9 | 27.3 | 42.0 | 32.5 | 58.7 | 38.0 |
| 90 | 133.8 | 105.8 | 153.3 | 122.3 | 162.0 | 119.6 |
| 100 | 272.9 | 325.9 | 361.1 | 299.8 | 366.4 | 305.9 |
| 110 | 500.0 | 534.9 | 499.0 | 499.0 | 500.0 | 500.0 |
Table 45 Footnotes
|
||||||
Mortality rates for disabled male Regular Members are a blend of 50% of the mortality rates for healthy male Regular Member pensioners and 50% of the mortality rates for male disabled pensioners from the most recent actuarial report on the PS pension plan (31 March 2017)Footnote 16 projected to plan year 2019. Although the basis for setting the mortality rates has not changed, the resulting mortality rates are different from those projected from the previous valuation assumptions since the mortality rates for healthy Regular Members were updated and the mortality rates for disabled pensioners were updated from the previous actuarial report on the PS pension plan (31 March 2014).
Due to the small size of the group, there is no credible experience for mortality rates for disabled female Regular Members. Therefore, these rates were changed for this valuation to be the same as for healthy female Regular Members.
Mortality rates for disabled Civilian Members are from the most recent actuarial report on the PS pension plan (31 March 2017)Footnote 16 projected to plan year 2019. Although the basis for setting the mortality rates has not changed, the resulting mortality rates are different from those projected from the previous valuation assumptions since they were based on the previous actuarial report on the PS pension plan (31 March 2014).
| Age Last BirthdayTable 46 footnote * | Regular Members | Civilian Members | ||
|---|---|---|---|---|
| Male | Female | Male | Female | |
| 30 | 3.3 | 0.3 | 6.1 | 4.4 |
| 40 | 4.9 | 0.6 | 9.1 | 5.9 |
| 50 | 7.6 | 1.3 | 13.6 | 8.2 |
| 60 | 12.1 | 3.5 | 20.4 | 12.7 |
| 70 | 23.6 | 8.7 | 36.0 | 22.3 |
| 80 | 61.3 | 27.3 | 78.8 | 55.8 |
| 90 | 160.0 | 105.8 | 186.1 | 153.9 |
| 100 | 345.3 | 325.9 | 417.7 | 465.2 |
| 110 | 499.5 | 534.9 | 500.0 | 500.0 |
Table 46 Footnotes
|
||||
Mortality rates are reduced in the future in accordance with the same longevity improvement assumption used in the 27th Actuarial Report on the Canada Pension Plan. For males, the improvement factors are higher than those used in the previous valuation except at advanced ages. For females, the improvement factors are higher than those used in the previous valuation except at advanced ages and at ages below 59. Factors shown in the 27th Actuarial Report on the Canada Pension Plan are based on calendar years. These factors have been interpolated to obtain longevity improvement factors based on plan years.
A sample of assumed longevity improvement factors is shown in the following table.
| Age Last BirthdayTable 47 footnote * | Initial and Ultimate Plan Year Mortality Reductions (%) | |||
|---|---|---|---|---|
| Male | Female | |||
| 2020 | 2033+ | 2020 | 2033+ | |
| 30 | 1.56 | 0.80 | 0.95 | 0.80 |
| 40 | 1.50 | 0.80 | 1.22 | 0.80 |
| 50 | 1.22 | 0.80 | 0.67 | 0.80 |
| 60 | 1.77 | 0.80 | 1.43 | 0.80 |
| 70 | 2.13 | 0.80 | 1.54 | 0.80 |
| 80 | 2.11 | 0.80 | 1.64 | 0.80 |
| 90 | 1.36 | 0.62 | 1.26 | 0.62 |
| 100 | 0.57 | 0.28 | 0.59 | 0.28 |
| 110 | 0.00 | 0.00 | 0.00 | 0.00 |
Table 47 Footnotes
|
||||
The following tables present the calculated life expectancy for Regular and Civilian contributors and healthy pensioners based on the mortality assumptions described in this section.
| Age Nearest | As at 31 March 2018 | As at 31 March 2033 | ||
|---|---|---|---|---|
| Male | Female | Male | Female | |
| 60 | 27.6 | 29.6 | 28.5 | 30.5 |
| 65 | 22.8 | 24.9 | 23.7 | 25.7 |
| 70 | 18.3 | 20.4 | 19.2 | 21.1 |
| 75 | 14.1 | 16.0 | 14.9 | 16.7 |
| 80 | 10.4 | 12.0 | 11.1 | 12.6 |
| 85 | 7.6 | 8.6 | 8.2 | 9.1 |
| 90 | 5.5 | 5.8 | 5.9 | 6.2 |
| Age Nearest | As at 31 March 2018 | As at 31 March 2033 | ||
|---|---|---|---|---|
| Male | Female | Male | Female | |
| 60 | 26.9 | 28.7 | 27.8 | 29.6 |
| 65 | 22.2 | 24.0 | 23.1 | 24.8 |
| 70 | 17.8 | 19.4 | 18.6 | 20.2 |
| 75 | 13.7 | 15.1 | 14.4 | 15.9 |
| 80 | 10.0 | 11.3 | 10.6 | 11.9 |
| 85 | 7.0 | 8.0 | 7.5 | 8.6 |
| 90 | 4.8 | 5.6 | 5.1 | 6.0 |
In Table 50, life expectancies based on the mortality assumptions of the previous valuation are compared with those based on the mortality assumptions described in this section for both Regular Members (RM) and Civilian Members (CM).
| Current Report | Previous ReportTable 50 footnote * | Increase/(Decrease) | |
|---|---|---|---|
| RM - Healthy Males | 27.6 | 27.1 | 0.5 |
| RM - Healthy Females | 29.6 | 29.4 | 0.2 |
| RM - Disabled Males | 23.4 | 23.5 | (0.1) |
| RM - Disabled Females | 29.6 | 26.3 | 3.3 |
| CM - Healthy Males | 26.9 | 26.4 | 0.5 |
| CM - Healthy Females | 28.7 | 28.7 | 0.0 |
| CM - Disabled Males | 20.3 | 20.6 | (0.3) |
| CM - Disabled Females | 23.6 | 23.8 | (0.2) |
| Male Surviving Spouses | 24.4 | 24.7 | (0.3) |
| Female Surviving Spouses | 27.8 | 27.4 | 0.4 |
Table 50 Footnotes
|
|||
G.1.7 Family Composition
Assumptions for the proportion of members leaving, upon death, a spouse eligible for a survivor pension are unchanged from the previous valuation. The age assumption for new survivors is also unchanged.
| Age Last BirthdayTable 51 footnote ** | Male | Female | ||
|---|---|---|---|---|
| Probability of an Eligible Spouse at Death of Member | Spouse Age Difference | Probability of an Eligible Spouse at Death of Member | Spouse Age Difference | |
| 30 | 0.70 | (1) | 0.50 | 2 |
| 40 | 0.85 | (1) | 0.55 | 2 |
| 50 | 0.85 | (2) | 0.55 | 3 |
| 60 | 0.85 | (3) | 0.50 | 3 |
| 70 | 0.80 | (3) | 0.40 | 2 |
| 80 | 0.65 | (3) | 0.30 | 2 |
| 90 | 0.40 | (5) | 0.10 | - |
| 100 | 0.15 | (8) | 0.00 | (3) |
Table 51 Footnotes
|
||||
All assumptions regarding eligible children are not changed from the previous valuation. As in the previous valuation, to determine the value of pensions payable to eligible children, the rates of pension termination were assumed to be zero prior to age 17 and 15% per annum thereafter until expiry of the benefit on the 25th birthday.
| Age Last Birthday at Death of Member |
Male | Female | ||
|---|---|---|---|---|
| Average Number of Children | Average Age of Children | Average Number of Children | Average Age of Children | |
| 30 | 0.9 | 4 | 0.8 | 3 |
| 40 | 1.3 | 12 | 1.2 | 11 |
| 50 | 0.8 | 19 | 0.6 | 19 |
| 60 | 0.1 | 21 | 0.1 | 23 |
| 70+ | 0.0 | - | 0.0 | - |
G.2 Other Assumptions
G.2.1 Pension Benefits Division / Optional Survivor Benefit / Leave Without Pay
The division of pension benefits has almost no effect on the valuation results because the liability is reduced, on average, by approximately the amount paid to the credit of the former spouse. Consequently, no future pension benefits divisions were assumed in estimating the current service cost and liability. However, past pension benefits divisions were fully reflected in the liability. Two other provisions, namely the optional survivor benefit and the suspension of membership while on leave without pay, were also treated like pension benefits divisions for the same reason.
G.2.2 Minimum Postretirement Death Benefit
This valuation does not take into account the minimum death benefit described in Appendix A.4.16, with respect to deaths occurring after retirement. The resulting understatement of the accrued liability and current service cost is not material since the majority of the relatively few pensioners who die in the early years of retirement leave an eligible survivor.
G.2.3 Administrative Expenses
In the previous report, PSPIB operating expenses were implicitly recognized through a reduction in the real return on the Fund. In this report, the operating expenses of the PSPIB are still recognized implicitly.
Assumed administrative expenses were decreased by 0.05% in this valuation, from 0.5% to 0.45% of pensionable payroll. In plan year 2019, the Account is assumed to be charged with 57% of the total expenses reducing, by 2% each year thereafter. Expenses expected to be debited to the Superannuation Account in the future have been capitalized and are shown as a liability on the balance sheet, whereas the expenses to the Pension Fund are shown on an annual basis as they occur.
G.2.4 Financing of Elected Prior Service
In accordance with the current prior service financing policy, the government credits to the Account in respect of prior service elections are assumed to be 100% of the resulting contributions made by the contributors. The corresponding figure for the Fund is determined in accordance with the allocation of current service cost where the government is assumed to contribute in the same proportions.
G.2.5 Outstanding Terminations
Amounts paid from 1 April 2018 onward for terminations that occurred prior to that date were estimated from actual payments made using information provided in the valuation data at 31 March 2018. For this valuation, after reviewing the information, a total of $1 million and $11 million were added to the liability for the Superannuation Account and the Pension Fund respectively.
G.2.6 Disability Incidence Rates for Pensioners Under Age 60
Both deferred pensioners and pensioners receiving an annual allowance while under age 60 are assumed to have a 0% disability rate. The resulting understatement of liability and current service cost is negligible.
G.2.7 Recovery Rates for Disability Pensioners
No recoveries are assumed for disability pensioners. The resulting overstatement of liability and current service cost is negligible.
G.2.8 Sex of Surviving Spouses
Each eligible surviving spouse is assumed to be of the opposite sex of the member.
Appendix H - RCA Valuation Methodology and Assumptions
H.1 Account Balance
The amount in the RCA account is composed of the recorded balance in the RCA Account, which forms part of the Public Accounts of Canada, and a tax credit (CRA refundable tax).
Interest is credited every three months in accordance with the actual average yield on a book value basis for the same period on the combined Superannuation Accounts of the Public Service, Canadian Forces – Regular Force and Royal Canadian Mounted Police pension plans. The actuarial value of the account is equal to the book value.
H.2 Actuarial Liability
Described in this appendix are the liability valuation methodologies used and any differences in economic assumptions from those used in the RCMPSA valuation.
H.2.1 RCA Postretirement Survivor Benefits
The limit on the amount of spousal annual allowance that can be provided under the RCMPSA decreases at the same time the member's pension is reduced due to the CPP coordination offset, which usually occurs at age 65.
This benefit was valued by assuming the plan limit is always reduced by the CPP coordination offset independent of age. The liability overstatement is minor because the probability of the former contributor dying prior to age 65 is small. This overstatement tends to be offset by the understatement of accrued liability caused by terminally funding the preretirement survivor benefit. The projected accrued benefit cost method was used to estimate the liability and current service cost for this RCA benefit.
H.2.2 Excess Pensionable Earnings
The projected accrued benefit cost method (described in detail in Appendix E.2) was used to estimate the liability and current service cost for retirement benefits in excess of the Maximum Pensionable Earnings.
H.2.3 Administrative Expenses
To compute the liability and current service cost, no provision was made regarding the expenses incurred for the administration of the RCA since these expenses are not debited from the RCA Account.
H.3 Actuarial Assumptions
The valuation economic assumptions are those described in Appendix F and shown in Table 38 without any modifications. This is a change from the last valuation where the interest discount rate used to determine the liability and current service cost in respect of the RCA was one-half of the yield projected on the combined Superannuation Accounts.
The demographic assumptions for the RCA valuation are the same as those used for the RCMPSA valuation as described in Appendix G.
H.4 Valuation Data
Pension benefits in payment to be debited from the RCA were provided as at 31 March 2018. Details on the RCA valuation data for current pensioners are shown in Appendix K.
Appendix I - RCMP Pension Plan Projection
The results of the following projections were computed using the data described in Appendices D and K, the methodology described in Appendix E and the assumptions described in Appendices F and G.
I.1 Projection of the Superannuation Account and the Pension Fund Liabilities
Prior to 1 April 2000, the RCMPSA Superannuation Account tracked all government pension benefit obligations related to the RCMPSA. The Superannuation Account is now debited only with benefit payments made in respect of service earned before that date and administrative expenses; it is credited with prior service contributions related to elections made prior to 1 April 2000 and interest earnings.
Starting 1 April 2000, the RCMPSA is financed through the Pension Fund. The Pension Fund is credited with employer and member contributions as well as investment earnings and prior service contributions for elections made since 1 April 2000. The Pension Fund is debited with benefit payments made in respect of service earned since that date and administrative expenses.
The following graph presents the evolution over time of the Superannuation Account liabilities for service prior to 1 April 2000 and the Pension Fund liabilities for service after 31 March 2000. It is expected that the Pension Fund liabilities will exceed the Superannuation Account liabilities in 2023.
Chart 1 - Evolution of Liabilities of Superannuation Account and Pension Fund over Time
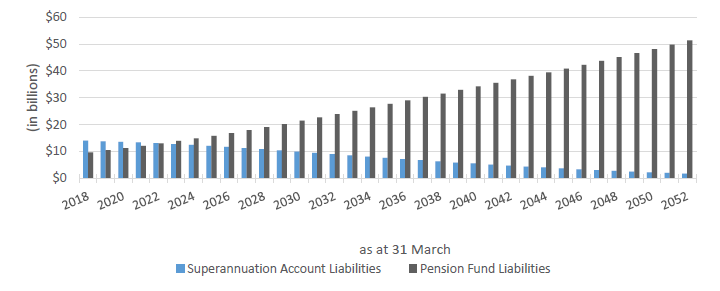
Description
Bar graph showing the evolution of liabilities related to the Superannuation Account and to the Pension Fund over time. Y-axis represents the expected Superannuation Account and Pension Fund liabilities in billions. X-axis represents the year, starting at March 31 2018 and ending at March 31 2052.
At March 31 2018, the Superannuation Account liabilities were approximately $14 billion and the Pension Fund liabilities were approximately $10 billion. The Superannuation Account liabilities are expected to steadily decrease and the Pension Fund liabilities are expected to steadily increase over time. As a result, it is estimated that in 2023 the Pension Fund liabilities of $14 billion will exceed the Superannuation Account liabilities of $13 billion.
From 2023 to 2052, The Superannuation Account liabilities will continue to steadily decrease by an average of $0.4 billion per year resulting in liabilities of $2 billion in 2052. The Pension Fund liabilities will continue to steadily increase, by an average of $1.3 billion each year resulting in liabilities of $51 billion in 2052.
I.2 Evolution of Cash Flows under the Pension Fund
In plan year 2019, contributions to the Pension Fund are expected to reach $502 million, whereas payouts, including benefit payments and administrative expenses, are expected to reach $248 million. Contributions that are higher than payouts ensure that the Pension Fund has sufficient liquidity to cover all the payouts in a year. However, as the population of the Pension Fund matures, the amount of payouts will increase and will eventually exceed the contributions. This will result in negative cash flows to the Pension Fund.
It is expected that the Pension Fund will have negative cash flows from plan year 2030, at which point a portion of the assets will be required to pay benefits. This implies that from plan year 2030, some portion of the Pension Fund's assets must be invested in liquid investments in order to be readily available to cover the excess payouts. Nevertheless, it should be noted that although negative cash flows will begin in the plan year 2030, the Pension Fund's overall assets are expected to grow for the entire duration of the projection presented below when investment incomes are taken into consideration.
Chart 2 - Evolution of Cash Flows over Time
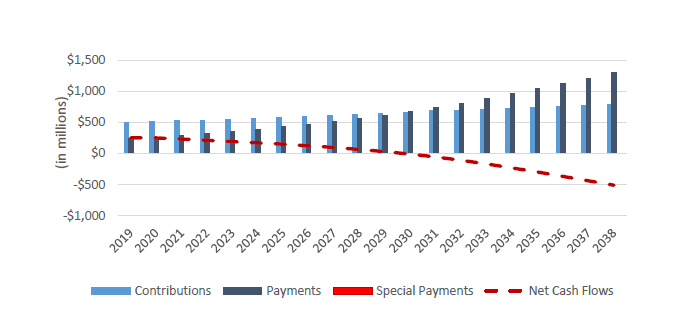
Description
Bar graph showing the evolution of cash flows under the Pension Fund over time. Y-axis represents the expected contributions, payments and resulting net cash flows in millions. X-axis represents the plan year, starting in 2019 and ending in 2038.
In plan year 2019, contributions to the Pension Fund are expected to reach $502 million, whereas payments are expected to reach $248 million resulting in net cash flows of $254 million. Both contributions and payments are expected to increase over time, however payments are expected to increase at a higher rate than the contributions. It is expected that the contributions will be higher than the payments until plan year 2029. In 2030, the expected payments of $675 million will exceed the estimated contributions of $666 million resulting in net cash flows of negative $9 million. From 2030, the Pension Fund is expected to have negative net cash flows. In plan year 2038, contributions to the Pension Fund are expected to reach approximately $791 million, whereas payouts are expected to reach approximately $1,299 million resulting in net cash flows of negative $508 million.
Appendix J - Uncertainty of Results
J.1 Introduction
The projected financial status of the plan depends on many demographic and economic factors, including new contributors, average earnings, inflation, level of interest rates and investment returns. The projected long-term financial status of the plan is based on best-estimate assumptions. The objective of this section is to present alternative scenarios. The alternatives presented illustrate the sensitivity of the long-term projected financial position of the plan to changes in the future economic outlook. Sections J.2 and J.3 relate to the Pension Fund only while Section J.4 relates to both the Pension Fund and the Superannuation Account.
Section J.2 examines the sensitivity of the Pension Fund to different asset allocations. Five alternative investment portfolios are described, along with the volatility of each portfolio and the resulting impact of having the assets invested in each portfolio on the Pension Fund's funding ratio and current service cost. Section J.2 also presents a stochastic projection of the Pension Fund's funding ratio. The impact of financial market volatility on the financial status of the Pension Fund is explored in Section J.3, where severe one-time financial shocks are applied to the three selected investment portfolios with the purpose of quantifying the impact on the surplus/(deficit) over the short-term horizon. Lastly, the impacts of prolonged low bond yields on the Superannuation Account and on the Pension Fund due to slower than expected economic growth are analyzed in Section J.4.
J.2 Sensitivity of Investment Policy – Pension Fund
A major risk all pension plans face is funding risk – the risk that pension assets are insufficient to meet pension obligations. If funding deficiencies or surpluses continue for an extended period of time, risk is transferred from one generation to another and may ultimately take the form of an increase or a decrease in the contribution rate.
Historically, equities have shown greater volatility than fixed income instruments (such as bonds); and long-term bonds have historically shown greater volatility than shorter term fixed income instruments. For instance, in the twenty-five years ending in 2017, the volatility (standard deviation) of Canadian equity returns (indicated by the S&P/TSX Total Return Index) was 16.5%Footnote 17, the volatility of returns of the long-term federal bonds (10+ years) was 9.6% and the volatility of returns of the medium-term federal bonds (5-10 years) was 6.7%. Higher volatility in the returns implies a greater risk due to a wider range of possible outcomes of the returns. Hence, an investment in equities is considered riskier than an investment in bonds and an investment in long-term bonds is riskier than an investment in medium- or short-term bonds.
This also means that investing a greater proportion of assets in equities can provide a wider range of possible returns, with a higher expected return. Conversely, investing in fixed income instruments only provides a narrower range of possible returns, with a lower expected return.
The RCMP pension plan represents a long-term obligation to pay pension benefits. Thus, a long-term approach must be taken to fund these obligations. Long-term Government of Canada bonds are considered risk-freeFootnote 18 and their yields are considered low. The real yield on long-term federal bonds was approximately 0.15% in March 2018. This is significantly below the ultimate best-estimate real return on assets of 4.0% that is currently used to determine the liabilities and current service costs and special payments if applicable.
The government created the PSPIB to actively manage assets consisting of the contributions in excess of the benefits and the administrative expenses with respect to service since 1 April 2000 in order to maximize the investment return on these assets without undue risk of loss. Due to active asset management, the liabilities and current service costs are less than what they would have been if the investment policy had been restricted to solely invest in long-term government bonds.
Although the current service cost is reduced by investing in securities that offer a higher rate of return than the risk-freeFootnote 19 long-term federal bonds, the portfolio is also exposed to a greater degree of risk or volatility. Generally, an investment in riskier assets demands risk premiums to compensate for additional risk. A risk premium is the difference between the expected return on a risky asset (e.g. equities) and the expected return on a risk-free asset, such as the Government of Canada long-term bond mentioned above.
Of course, these higher returns are expected but not guaranteed with the possibility that the market will not perform as expected and liabilities will grow at a faster rate than investments for an extended period of time. Even if investment returns materialize as expected, other assumptions may not, causing the liabilities to grow at a faster rate than the assets. For example, salaries or inflation may increase more than expected. The amount of risk assumed by the plan sponsor depends on many factors, including the current funding status and economic outlook, among other things. Thus, the investment policy must balance the desire for a high real rate of return with the sponsor's ability to take risk and/or tolerance for risk. The Funding Policy for the Public Sector Pension Plans sets out some boundaries for the level of investment risk that is acceptable to the plan sponsor.
Table 53 shows the impacts on the funding ratio, the long-term current service cost and the relative volatility with respect to various asset mixes.
| Portfolio | Asset Mix | Real Rate of Return | 1-year Standard Deviation |
Funding Ratio as at 31 March 2018 |
Long-term Service Cost |
Annual Special Payment ($ millions) |
||||
|---|---|---|---|---|---|---|---|---|---|---|
| Fixed Income |
Equity | Credit | Real Assets | First 5 Years | Ultimate | |||||
| #1 | 100%Table 53 footnote * | 0% | 0% | 0% | (3.1%) | 2.6% | 7.8% | 57% | 36.5% | 540 |
| #2 | 100%Table 53 footnote ** | 0% | 0% | 0% | (2.6%) | 2.8% | 6.6% | 61% | 34.3% | 474 |
| #3 | 55%Table 53 footnote *** | 35% | 5% | 5% | 1.6% | 3.5% | 7.1% | 89% | 26.9% | 118 |
| #4 | 40%Table 53 footnote *** | 40% | 5% | 15% | 2.3% | 3.7% | 8.9% | 96% | 25.3% | 43 |
| Best-Estimate | 20%Table 53 footnote *** | 43% | 7% | 30% | 3.3% | 4.0% | 11.1% | 106% | 23.3% | 0 |
| #5 | 0% | 100% | 0% | 0% | 4.4% | 4.4% | 16.5% | 117% | 21.4% | 0 |
Table 53 Footnotes
|
||||||||||
The last three columns of Table 53 present the funding ratio, annual special payments over 15 years and the long-term current service cost if the investment policy were changed to reflect the asset mix of the alternative portfolios. These deterministic outcomes do not take into account the expected portfolio volatility.
The best-estimate portfolio is invested 20% in fixed-income securities, 43% in equity, 30% in real assets and 7% in credit in the long-term, which is close to PSPIB's current long-term asset-mix objective. Such a portfolio produces an ultimate annual real return of 4.0% net of all investment expenses (assumed 0.20% of total assets) with a standard deviation of 11.1%.
Portfolio #1 is invested in 10-year-plus federal bonds. This portfolio does not result in a feasible scenario due to its prohibitive cost. Other portfolios with lower volatility and higher expected returns are available discrediting this portfolio.
Portfolio #2 is invested in a marketable bond portfolio consisting of long-term federal, provincial and real return bonds. The investment diversification into three bond asset categories that are not perfectly correlated increases the real rate of return and reduces the volatility compared to Portfolio #1. This portfolio produces a higher real rate of return compared to portfolio #1, thus maintaining a lower current service cost. It is also a low risk, low return portfolio which would result in much higher long-term current service cost than the best-estimate portfolio. Greater diversification in various assets is required in order to have lower levels of funding cost.
Portfolios #3 and #4 are more diversified than Portfolios #1 and #2. They are invested in 35% and 40%, respectively, in equity. This diversification in four broad asset categories that are not perfectly correlated, combined with shorter fixed-income maturities, increases the real rate of return earned on these portfolios and keeps their volatilities comparable to Portfolios #1 and #2. Portfolios #3 and #4, because of their higher expected return, have expected current service costs lower than the first two portfolios but higher than the best-estimate portfolio.
Portfolio #5 is considered riskier than all portfolios mentioned above because it is less diversified and has no allocation to fixed income securities. This portfolio is solely invested in equity, which has much more volatile returns than that of bonds. Although Portfolio #5 leads to the highest expected return, the highest funding ratio and the lowest long-term current service cost, its volatility is significantly higher which may lead to significant additional contribution requirements if a tail event were to occur as illustrated in Table 54.
Table 54 presents the expected median and the 10 percent downside real returns over the next three yearsFootnote 20, the resulting funding ratio, and the ensuing expected contributions assuming the plan is fully funded as at 31 March 2018 under each portfolio. It further assumes that the ultimate real rate of return applies to the full projection period (no select period with lower real rate of return).
| Portfolio | 1-year Standard Deviation | Expected Average Annual Real ReturnsTable 54 footnote ** (2019 - 2021) |
Funding Ratio (31 March 2021) |
Contributions (2021-22) % of pensionable payroll ($ millions) |
||||
|---|---|---|---|---|---|---|---|---|
| Downside 10th Pct | Median | Downside 10th Pct | Median | Current Service (downside and median) | Special Payments (downside) | Total (downside) | ||
| #3 | 7.1% | (1.8%) | 3.5% | 94% | 100% | 26% (590) | 4% (81) | 30% (671) |
| #4 | 8.9% | (2.9%) | 3.7% | 91% | 100% | 24% (562) | 5% (115) | 29% (677) |
| Best‑Estimate | 11.1% | (4.3%) | 4.0% | 87% | 100% | 23% (523) | 7% (162) | 30% (685) |
| #5 | 16.5% | (8.0%) | 4.4% | 77% | 100% | 21% (477) | 12% (272) | 33% (749) |
Table 54 Footnotes
|
||||||||
Table 54 highlights the trade-off between risk and return as well as between higher current service cost with low downside risk and lower current service cost with high downside risk. A portfolio (Portfolio #3) exhibiting lower volatility of returns has a higher current service cost, but a lower downside risk. On the other hand, a risky portfolio (Portfolio #5) would produce a lower current service cost; however, the volatility of this portfolio is quite high, resulting in significant downside risk and therefore more total downside contributions compared to Portfolio #3 or the best-estimate portfolio. By investing in a diversified portfolio, a reasonable current service cost can still be achieved along with lower volatility and lower downside risk than Portfolio #5, hence a lower probability of significant losses and unforeseen additional contributions.
The following chart illustrates the range of funding ratio (actuarial value of assets over actuarial liabilities) that could be expected under the best estimate portfolio as well as the probability that the funding ratio drops below 70%Footnote 21. It takes into account that actuarial valuations would occur every three years starting in 2018, that deficits are covered by additional government contributions and that legislated non-permitted surplus (surplus in excess of 25% of liabilities) results in full or partial contribution holiday for the governmentFootnote 22.
As shown in Chart 3, the median expected funding ratio is relatively flat (between 106% and 110%) over the projection. The probability that the funding ratio drops below 70% is lower than 5% over the 10-year period.
Chart 3 - Range of Potential Funding Ratio for the Best-Estimate Portfolio
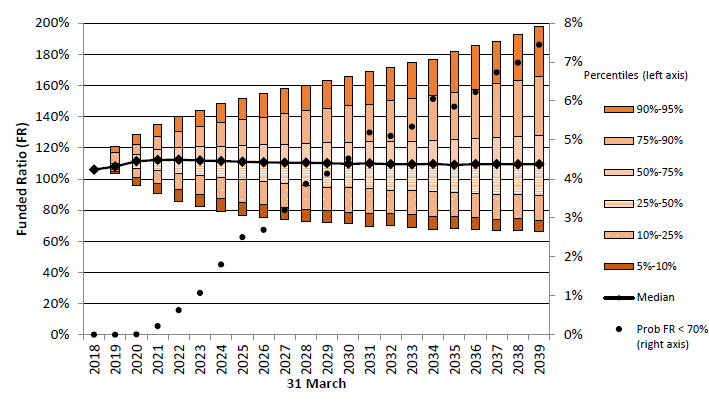
Description
Bar graph showing the range of potential funding ratio of the best-estimate portfolio over time and the probability that the funding ratio drops below 70%. Left Y-axis represents the funded ratio whereas right Y-axis represents the probability that the funding ratio drops below 70%. X-axis shows the year, starting at March 31 2018 and ending at March 31 2039.
The Pension Fund was fully funded (funding ratio of 106%) at March 31 2018. The median expected funding ratio is relatively flat (between 106% and 110%) over the projection period. The funding ratio is expected to be between 104% (5th percentile) and 121% (95th percentile) with a median of 108% at 31 March 2019, between 72% (5th percentile) and 163% (95th percentile) with a median of 110% at 31 March 2029 and between 66% (5th percentile) and 198% (95th percentile) with a median of 109% at 31 March in 2039.
The probability of being less than 70% funded is less than 1% in the first four years after the valuation, the probability increases to approximately 4% in 2028, 6% in 2034 and 7% in 2038.
J.3 Financial Market Tail Events – Pension Fund
This section focuses on the inherent volatility in the best-estimate portfolio and the extreme outcomes that could result. During plan year 2009, the nominal return on Plan assets was negative 22.7% due to the economic slowdown. Such an event could be characterized as low probability (also referred to as a "tail event"). However, when these events do occur, the impact on the funding ratio may be significant. This section analyzes the impacts that tail-event returns would have on the plan's funding ratio. To illustrate this, returns other than the best-estimate are assumed to occur in plan year 2019. Two alternative portfolios were selected from Section J.2 to show the potential variation in tail returns of a less risky portfolio (Portfolio #4: 40% fixed income, 40% equity, 15% real assets and 5% credit) and a more risky portfolio (Portfolio #5: 100% equity) in relation to the best-estimate portfolio.
It is assumed that the returns of the three portfolios follow a normal distribution. The annual long-term mean and standard deviation for each portfolio is given in Table 55 . Returns at two probability levels were selected to analyze: 1/10 and 1/50. The probabilities of earning these returns can be thought of as once in every 10 and 50 years, respectively. Since the normal distribution has two tails, left and right, both were examined. The left tail event is the occurrence of a nominal return such that the probability of earning that return or less is equal to 1/10 (or 1/50). The right tail event is the occurrence of a nominal return such that the probability of earning that return or more is equal to 1/10 (or 1/50).
For each portfolio, a nominal return is calculated at the two probability levels. The nominal returns are given in the following table.
| Probability of returnTable 55 footnote * | Tail | Portfolio 4: 40% Fixed Income/ 40% Equity/ 15% Real Assets/ 5% Credit |
Best-Estimate Portfolio: 20% Fixed Income/ 43% Equity/ 30% Real Assets/ 7% Credit |
Portfolio 5: 100% Equities |
|---|---|---|---|---|
| Nominal Return | Nominal Return | Nominal Return | ||
| 1/50 | Left | (12.2%) | (16.3%) | (26.2%) |
| 1/10 | Left | (5.3%) | (7.7%) | (13.4%) |
| 1/10 | Right | 17.5% | 20.9% | 29.0% |
| 1/50 | Right | 24.4% | 29.5% | 41.7% |
Table 55 Footnotes
|
||||
Table 56 presents the impact on the projected surplus/(deficit) as at 31 March 2021 (the expected date of the next actuarial review) if the nominal return for plan year 2019 happens to be equal to the returns presented in Table 55 for the best-estimate scenario. Following the various portfolio returns in plan year 2019, it is assumed that the return will revert back to its best estimate value for plan year 2020.
| Assumption(s) Varied | Actuarial Value of Assets | Liability | Surplus/ (Deficit) | Annual Special PaymentsTable 56 footnote * |
|---|---|---|---|---|
| None (i.e. current basis) | 13,615 | 12,121 | 1,494 | 0 |
| Investment return in plan year 2019 | ||||
| - Left Tail event at 1/50th probability | 11,904 | 12,121 | (217) | 24 |
| - Left Tail event at 1/10th probability | 12,587 | 12,121 | 466 | 0 |
| - Right Tail event at 1/10th probability | 14,851 | 12,121 | 2,730 | 0 |
| - Right Tail event at 1/50th probability | 15,534 | 12,121 | 3,413 | 0 |
Table 56 Footnotes
|
||||
J.4 Impact of Prolonged Low Bond Yields – Pension Fund and Superannuation Account
This section explores the consequences of slower than expected economic growth through a reduction in expected bond yields and variable income securities over the full projection period. Current bond yields are much lower than their historical averages and, without stronger economic growth, they might well remain low over the next few years. Over the last 15- and 50-year periods ending 31 December 2017, the average real yield of long-term Government of Canada bonds was 1.7% and 3.1%, respectively. This is much higher than the 0.15% real yield on long-term federal bonds as at March 2018. This section looks at the impact of keeping the current 0.15% real yield for one year and reducing all subsequent long-term federal bond yields by 0.3%.
The best-estimate scenario assumes that the long-term federal bond real (nominal) yield reaches its ultimate value of 2.6% (4.6%) at the beginning of plan year 2030. This scenario assumes that economic growth will remain weak for another couple of years and moderate thereafter. Consequently, the long-term federal bond nominal yield would remain at low level for a few years, and would slowly progress towards its ultimate real (nominal) value of 2.3% (4.3%) by plan year 2030. As a result, the new money rate would also be affected and would be 0.3% lower over the full projection period. In addition, returns for equity and real assets would also be lower for the entire projection period. Thus, the annual returns would be 0.2% lower on average over the next 10 years and 0.3% lower ultimately than under the best-estimate scenario.
Table 57 shows the impact that such a scenario would have on the expected new money rates and projected fund returns, as well as the impact on the actuarial liabilities, the long term current service cost and the annual special credits/payments required to fund the Superannuation Account shortfall and the Pension Fund deficit.
| Superannuation Account | Best-Estimate | Low Bond Yields | Difference |
|---|---|---|---|
| 2019-2028 Average New Money Rate | 3.6% | 3.3% | (0.3%) |
| Ultimate Average New Money Rate | 4.6% | 4.3% | (0.3%) |
| Total Actuarial Liability as at 31 March 2018 | 14,009 | 14,563 | 554 |
| Actuarial Excess/(Shortfall) | (886) | (1,440) | (554) |
| Special Credits | 79 | 129 | 50 |
| Pension Fund | Best-Estimate | Low Bond Yields | Difference |
| 2019-2028 Average Return Projected on Fund | 5.5% | 5.3% | (0.2%) |
| Ultimate Average Return Projected on Fund | 6.0% | 5.7% | (0.3%) |
| Total Actuarial Liability as at 31 March 2018 | 9,721 | 10,232 | 511 |
| Actuarial Surplus/(Deficit) | 572 | 61 | (511) |
| Long-term service cost | 23.3% | 25.0% | 1.7% |
| Special Payments | 0 | 0 | 0 |
As shown in the table above, the prolonged low bond yields result in higher actuarial liability and higher special credits/payments for both the Superannuation Account and the Pension Fund.
Appendix K - Detailed Membership Data
| Age | Completed Years of Service in the Force | All Years of Service | |||||||
|---|---|---|---|---|---|---|---|---|---|
| 0-4 | 5-9 | 10-14 | 15-19 | 20-24 | 25-29 | 30-34 | 35 | ||
| To 24 | 350 | 1 | 351 | ||||||
| $70,443 | $89,150 | $70,497 | |||||||
| 25-29 | 1,075 | 226 | 7 | 1,308 | |||||
| $75,629 | $91,290 | $95,962 | $78,444 | ||||||
| 30-34 | 748 | 1,157 | 525 | 2,430 | |||||
| $78,921 | $92,145 | $96,469 | $89,008 | ||||||
| 35-39 | 352 | 795 | 1,333 | 251 | 2,731 | ||||
| $78,915 | $92,352 | $97,168 | $103,090 | $93,958 | |||||
| 40-44 | 169 | 506 | 1,010 | 867 | 139 | 2,691 | |||
| $79,744 | $92,132 | $97,000 | $103,750 | $110,930 | $97,895 | ||||
| 45-49 | 68 | 284 | 608 | 696 | 576 | 210 | 3 | 2,445 | |
| $81,863 | $92,103 | $96,623 | $102,777 | $111,304 | $120,602 | $124,011 | $102,991 | ||
| 50-54 | 24 | 103 | 204 | 205 | 296 | 689 | 254 | 2 | 1,777 |
| $84,743 | $92,515 | $97,086 | $103,161 | $108,853 | $119,186 | $126,235 | $121,460 | $112,078 | |
| 55-59 | 5 | 29 | 55 | 52 | 82 | 234 | 275 | 84 | 816 |
| $86,741 | $90,708 | $95,008 | $103,388 | $107,927 | $112,317 | $121,681 | $126,182 | $113,799 | |
| 60+ | 6 | 10 | 10 | 17 | 36 | 51 | 80 | 210 | |
| $102,088 | $98,743 | $98,273 | $108,260 | $112,273 | $113,126 | $121,109 | $113,919 | ||
| All Ages | 2,791 | 3,107 | 3,752 | 2,081 | 1,110 | 1,169 | 583 | 166 | 14,759 |
| $76,775 | $92,147 | $96,902 | $103,251 | $110,307 | $117,852 | $122,929 | $123,680 | $96,987 | |
Table 58 Footnotes
|
|||||||||
| Average age: | 41.3 years |
|---|---|
| Average service in the Force: | 13.1 years |
| Average pensionable service: | 13.4 years |
| Annualized pensionable payroll: | $1,409.3 millions |
| Age | Completed Years of Service in the Force | All Years of Service | |||||||
|---|---|---|---|---|---|---|---|---|---|
| 0-4 | 5-9 | 10-14 | 15-19 | 20-24 | 25-29 | 30-34 | 35 | ||
| To 24 | 108 | 108 | |||||||
| $70,482 | $70,482 | ||||||||
| 25-29 | 345 | 68 | 413 | ||||||
| $77,388 | $90,494 | $79,546 | |||||||
| 30-34 | 196 | 293 | 154 | 643 | |||||
| $80,228 | $92,050 | $95,929 | $89,375 | ||||||
| 35-39 | 89 | 213 | 458 | 111 | 1 | 872 | |||
| $78,420 | $92,171 | $96,229 | $100,984 | $97,494 | $94,027 | ||||
| 40-44 | 41 | 100 | 276 | 306 | 104 | 827 | |||
| $79,703 | $91,484 | $96,351 | $101,131 | $108,219 | $98,198 | ||||
| 45-49 | 17 | 52 | 106 | 196 | 215 | 84 | 1 | 671 | |
| $78,509 | $90,918 | $97,232 | $101,543 | $108,518 | $115,850 | $159,049 | $103,567 | ||
| 50-54 | 2 | 18 | 49 | 52 | 73 | 133 | 61 | 388 | |
| $82,782 | $92,134 | $97,127 | $101,344 | $105,925 | $116,286 | $129,386 | $110,681 | ||
| 55-59 | 5 | 5 | 14 | 14 | 24 | 52 | 3 | 117 | |
| $89,867 | $94,658 | $101,829 | $107,403 | $118,558 | $124,080 | $161,880 | $116,539 | ||
| 60+ | 2 | 2 | 2 | 4 | 7 | 5 | 22 | ||
| $96,961 | $98,341 | $130,299 | $111,145 | $104,165 | $104,505 | $106,703 | |||
| All Ages | 798 | 749 | 1,050 | 681 | 409 | 245 | 121 | 8 | 4,061 |
| $77,422 | $91,777 | $96,354 | $101,248 | $108,021 | $116,275 | $125,892 | $126,021 | $95,926 | |
Table 59 Footnotes
|
|||||||||
| Average age: | 40.1 years |
|---|---|
| Average service in the Force: | 12.9 years |
| Average pensionable service: | 13.1 years |
| Annualized pensionable payroll: | $388.0 millions |
| Age | Completed Years of Service in the Force | All Years of Service | |||||||
|---|---|---|---|---|---|---|---|---|---|
| 0-4 | 5-9 | 10-14 | 15-19 | 20-24 | 25-29 | 30-34 | 35 | ||
| To 24 | 4 | 4 | |||||||
| $74,415 | $74,415 | ||||||||
| 25-29 | 54 | 4 | 58 | ||||||
| $71,510 | $79,277 | $72,046 | |||||||
| 30-34 | 67 | 81 | 19 | 167 | |||||
| $79,859 | $85,787 | $90,055 | $83,894 | ||||||
| 35-39 | 80 | 132 | 126 | 24 | 362 | ||||
| $77,810 | $86,004 | $89,275 | $95,877 | $85,986 | |||||
| 40-44 | 44 | 85 | 115 | 80 | 10 | 334 | |||
| $76,701 | $84,689 | $89,382 | $96,468 | $103,614 | $88,640 | ||||
| 45-49 | 47 | 65 | 72 | 77 | 31 | 7 | 299 | ||
| $80,152 | $88,117 | $91,005 | $94,655 | $101,384 | $96,177 | $90,808 | |||
| 50-54 | 21 | 49 | 55 | 45 | 34 | 39 | 10 | 253 | |
| $79,294 | $82,658 | $88,571 | $97,194 | $102,410 | $96,993 | $101,486 | $91,858 | ||
| 55-59 | 11 | 26 | 53 | 44 | 20 | 33 | 18 | 1 | 206 |
| $83,528 | $85,217 | $90,034 | $95,567 | $96,703 | $102,423 | $96,055 | $107,614 | $93,504 | |
| 60+ | 3 | 12 | 17 | 23 | 7 | 6 | 5 | 6 | 79 |
| $81,225 | $87,747 | $85,388 | $94,140 | $84,406 | $107,660 | $116,368 | $103,805 | $93,100 | |
| All Ages | 331 | 454 | 457 | 293 | 102 | 85 | 33 | 7 | 1,762 |
| $77,656 | $85,602 | $89,466 | $95,737 | $99,862 | $99,787 | $100,778 | $104,349 | $88,665 | |
Table 60 Footnotes
|
|||||||||
| Average age: | 45.0 years |
|---|---|
| Average pensionable service: | 14.1 years |
| Annualized pensionable payroll: | $154.1 millions |
| Age | Completed Years of Service in the Force | All Years of Service | |||||||
|---|---|---|---|---|---|---|---|---|---|
| 0-4 | 5-9 | 10-14 | 15-19 | 20-24 | 25-29 | 30-34 | 35 | ||
| To 24 | 4 | 4 | |||||||
| $61,534 | $61,534 | ||||||||
| 25-29 | 73 | 8 | 81 | ||||||
| $66,635 | $71,447 | $67,110 | |||||||
| 30-34 | 154 | 89 | 17 | 260 | |||||
| $72,368 | $78,997 | $79,063 | $75,075 | ||||||
| 35-39 | 106 | 150 | 138 | 14 | 408 | ||||
| $72,491 | $81,453 | $85,568 | $88,329 | $80,752 | |||||
| 40-44 | 57 | 100 | 118 | 93 | 7 | 375 | |||
| $72,097 | $78,780 | $84,999 | $90,574 | $89,678 | $82,849 | ||||
| 45-49 | 51 | 71 | 85 | 72 | 25 | 15 | 319 | ||
| $71,406 | $80,327 | $82,614 | $90,000 | $91,170 | $79,725 | $82,515 | |||
| 50-54 | 34 | 42 | 51 | 38 | 35 | 43 | 3 | 246 | |
| $73,493 | $75,064 | $82,093 | $84,256 | $89,564 | $90,970 | $86,169 | $82,703 | ||
| 55-59 | 11 | 24 | 35 | 24 | 15 | 19 | 10 | 5 | 143 |
| $75,655 | $75,223 | $78,953 | $81,975 | $83,309 | $96,248 | $102,565 | $90,844 | $83,402 | |
| 60+ | 5 | 8 | 15 | 10 | 7 | 3 | 4 | 4 | 56 |
| $65,810 | $77,200 | $82,667 | $79,903 | $77,269 | $80,847 | $87,930 | $82,905 | $79,508 | |
| All Ages | 495 | 492 | 459 | 251 | 89 | 80 | 17 | 9 | 1,892 |
| $71,415 | $79,222 | $83,648 | $88,080 | $88,003 | $89,736 | $96,228 | $87,316 | $80,477 | |
Table 61 Footnotes
|
|||||||||
| Average age: | 43.3 years |
|---|---|
| Average pensionable service: | 12.6 years |
| Annualized pensionable payroll: | $151.0 millions |
| Age Last Birthday | Superannuation Account | Pension Fund | RCA | |||
|---|---|---|---|---|---|---|
| Number | Pension ($) | Number | Pension ($) | Number | Pension ($) | |
| 45-49 | 86 | 17,949 | 86 | 33,763 | 16 | 929 |
| 50-54 | 491 | 23,879 | 493 | 31,493 | 21 | 2,206 |
| 55-59 | 1,394 | 36,322 | 1,395 | 27,804 | 20 | 11,409 |
| 60-64 | 2,590 | 42,925 | 2,320 | 19,072 | 46 | 7,766 |
| 65-69 | 3,060 | 39,701 | 2,096 | 9,647 | 56 | 4,348 |
| 70-74 | 2,322 | 41,628 | 822 | 4,561 | 41 | 3,600 |
| 75-79 | 1,499 | 42,387 | 50 | 1,820 | 14 | 1,522 |
| 80-84 | 847 | 42,672 | - | - | - | - |
| 85-89 | 428 | 41,120 | - | - | - | - |
| 90-94 | 31 | 33,308 | - | - | - | - |
| 95-99 | 4 | 18,367 | - | - | - | - |
| 100-104 | 1 | 41,896 | - | - | - | - |
| All Ages | 12,753 | 40,120 | 7,262 | 17,285 | 214 | 4,949 |
| Average Age | 68.5 years | |||||
| Average Age at Retirement | 52.0 years | |||||
Table 62 Footnotes
|
||||||
| Age Last Birthday | Superannuation Account | Pension Fund | RCA | |||
|---|---|---|---|---|---|---|
| Number | Pension ($) | Number | Pension ($) | Number | Pension ($) | |
| 30-34 | - | - | 15 | 12,611 | - | - |
| 35-39 | - | - | 38 | 15,534 | - | - |
| 40-44 | 14 | 4,944 | 51 | 20,241 | - | - |
| 45-49 | 62 | 11,245 | 96 | 24,717 | 8 | 218 |
| 50-54 | 218 | 19,473 | 229 | 23,394 | 7 | 544 |
| 55-59 | 430 | 28,096 | 427 | 21,233 | 3 | 511 |
| 60-64 | 466 | 32,348 | 398 | 15,165 | - | - |
| 65-69 | 396 | 31,505 | 276 | 8,205 | 1 | 1,925 |
| 70-74 | 201 | 31,412 | 70 | 4,738 | - | - |
| 75-79 | 58 | 33,856 | 4 | 729 | - | - |
| 80-84 | 15 | 30,465 | - | - | - | - |
| 85-89 | 7 | 29,192 | - | - | - | - |
| 90-94 | 3 | 39,954 | - | - | - | - |
| 95-99 | 1 | 15,499 | - | - | - | - |
| All Ages | 1,871 | 28,710 | 1,604 | 16,984 | 19 | 474 |
| Average Age | 61.1 years | |||||
| Average Age at Retirement | 49.6 years | |||||
Table 63 Footnotes
|
||||||
| Age Last Birthday | Superannuation Account | Pension Fund | RCA | |||
|---|---|---|---|---|---|---|
| Number | Pension ($) | Number | Pension ($) | Number | Pension ($) | |
| 40-44 | 1 | 3,593 | 1 | 23,387 | - | - |
| 45-49 | 34 | 15,565 | 34 | 28,797 | 6 | 1,048 |
| 50-54 | 151 | 24,327 | 149 | 29,858 | 9 | 2,504 |
| 55-59 | 225 | 33,240 | 222 | 24,550 | 3 | 6,436 |
| 60-64 | 183 | 36,593 | 158 | 18,276 | 3 | 8,655 |
| 65-69 | 66 | 32,586 | 49 | 12,759 | 3 | 12,468 |
| 70-74 | 17 | 31,145 | 13 | 7,731 | - | - |
| 75-79 | 6 | 15,422 | 1 | 2,367 | - | - |
| 80-84 | 7 | 23,849 | - | - | - | - |
| 85-89 | 3 | 17,850 | - | - | - | - |
| 90-94 | 3 | 16,701 | - | - | - | - |
| All Ages | 696 | 30,783 | 627 | 23,153 | 24 | 4,646 |
| Average Age | 59.3 years | |||||
| Average Age at Retirement | 51.4 years | |||||
Table 64 Footnotes
|
||||||
| Age Last Birthday | Superannuation Account | Pension Fund | RCA | |||
|---|---|---|---|---|---|---|
| Number | Pension ($) | Number | Pension ($) | Number | Pension ($) | |
| 25-29 | - | - | 1 | 5,938 | - | - |
| 30-34 | - | - | 6 | 10,885 | - | - |
| 35-39 | - | - | 24 | 15,251 | - | - |
| 40-44 | 17 | 3,891 | 40 | 21,852 | - | - |
| 45-49 | 70 | 11,032 | 91 | 22,827 | 10 | 147 |
| 50-54 | 130 | 19,355 | 135 | 23,365 | 9 | 124 |
| 55-59 | 122 | 24,535 | 113 | 21,444 | 2 | 172 |
| 60-64 | 80 | 27,001 | 61 | 17,637 | - | - |
| 65-69 | 29 | 25,347 | 20 | 12,152 | - | - |
| 70-74 | 6 | 22,261 | 2 | 6,534 | - | - |
| 75-79 | - | - | - | - | - | - |
| 80-84 | 2 | 21,480 | - | - | - | - |
| All Ages | 456 | 20,657 | 493 | 20,889 | 21 | 139 |
| Average Age | 53.9 years | |||||
| Average Age at Retirement | 46.7 years | |||||
Table 65 Footnotes
|
||||||
| Age Last Birthday | Superannuation Account | Pension Fund | RCA | |||
|---|---|---|---|---|---|---|
| Number | Pension ($) | Number | Pension ($) | Number | Pension ($) | |
| 50-54 | 3 | 17,182 | 4 | 39,132 | - | - |
| 55-59 | 72 | 31,763 | 73 | 30,987 | - | - |
| 60-64 | 181 | 34,810 | 199 | 23,578 | 4 | 8,295 |
| 65-69 | 198 | 32,706 | 211 | 12,182 | 6 | 1,600 |
| 70-74 | 172 | 33,881 | 133 | 7,728 | 2 | 3,768 |
| 75-79 | 105 | 31,152 | 28 | 3,353 | 1 | 2,145 |
| 80-84 | 56 | 26,551 | 5 | 3,596 | - | - |
| 85-89 | 36 | 26,158 | - | - | - | - |
| 90-94 | 5 | 28,486 | - | - | - | - |
| 95-99 | 1 | 10,949 | - | - | - | - |
| All Ages | 829 | 32,323 | 653 | 16,571 | 13 | 4,035 |
| Average Age | 69.5 years | |||||
| Average Age at Retirement | 58.1 years | |||||
Table 66 Footnotes
|
||||||
| Age Last Birthday | Superannuation Account | Pension Fund | RCA | |||
|---|---|---|---|---|---|---|
| Number | Pension ($) | Number | Pension ($) | Number | Pension ($) | |
| 30-34 | - | - | 1 | 7,526 | - | - |
| 35-39 | - | - | 1 | 23,956 | - | - |
| 40-44 | - | - | 2 | 14,203 | - | - |
| 45-49 | 3 | 7,541 | 8 | 14,865 | - | - |
| 50-54 | 8 | 13,699 | 14 | 16,340 | - | - |
| 55-59 | 18 | 17,803 | 26 | 17,894 | - | - |
| 60-64 | 21 | 31,173 | 21 | 15,851 | - | - |
| 65-69 | 15 | 24,501 | 13 | 7,427 | - | - |
| 70-74 | 11 | 27,450 | 5 | 2,768 | - | - |
| 75-79 | 9 | 19,912 | 1 | 14,223 | - | - |
| 80-84 | 5 | 16,969 | - | - | - | - |
| 85-89 | 2 | 11,474 | - | - | - | - |
| All Ages | 92 | 22,432 | 92 | 14,460 | - | - |
| Average Age | 62.1 years | |||||
| Average Age at Retirement | 51.4 years | |||||
Table 67 Footnotes
|
||||||
| Age Last Birthday | Superannuation Account | Pension Fund | RCA | |||
|---|---|---|---|---|---|---|
| Number | Pension ($) | Number | Pension ($) | Number | Pension ($) | |
| 50-54 | 4 | 7,657 | 9 | 15,612 | - | - |
| 55-59 | 69 | 24,010 | 91 | 23,949 | - | - |
| 60-64 | 165 | 27,849 | 190 | 18,319 | 2 | 10,475 |
| 65-69 | 139 | 25,359 | 146 | 10,917 | - | - |
| 70-74 | 89 | 23,285 | 80 | 7,388 | 1 | 4,088 |
| 75-79 | 45 | 20,996 | 24 | 4,856 | 1 | 1,264 |
| 80-84 | 33 | 24,964 | 3 | 3,570 | - | - |
| 85-89 | 20 | 23,128 | 1 | 4,231 | - | - |
| 90-94 | 5 | 20,151 | - | - | - | - |
| 95-99 | 2 | 23,371 | - | - | - | - |
| 100-104 | 1 | 17,310 | - | - | - | - |
| All Ages | 572 | 24,957 | 544 | 14,921 | 4 | 6,576 |
| Average Age | 67.5 years | |||||
| Average Age at Retirement | 57.7 years | |||||
Table 68 Footnotes
|
||||||
| Age Last Birthday | Superannuation Account | Pension Fund | RCA | |||
|---|---|---|---|---|---|---|
| Number | Pension ($) | Number | Pension ($) | Number | Pension ($) | |
| 30-34 | - | - | 1 | 7,614 | - | - |
| 35-39 | - | - | 13 | 11,447 | - | - |
| 40-44 | 4 | 1,524 | 25 | 15,718 | - | - |
| 45-49 | 8 | 6,548 | 26 | 14,663 | - | - |
| 50-54 | 29 | 11,562 | 42 | 15,559 | - | - |
| 55-59 | 55 | 18,294 | 71 | 16,995 | - | - |
| 60-64 | 51 | 19,263 | 48 | 10,184 | - | - |
| 65-69 | 48 | 19,718 | 38 | 6,684 | - | - |
| 70-74 | 15 | 17,470 | 10 | 6,951 | - | - |
| 75-79 | 5 | 16,216 | 2 | 6,326 | - | - |
| 80-84 | 1 | 15,112 | - | - | - | - |
| 85-89 | 2 | 15,410 | - | - | - | - |
| All Ages | 218 | 17,055 | 276 | 13,101 | - | - |
| Average Age | 57.7 years | |||||
| Average Age at Retirement | 49.6 years | |||||
Table 69 Footnotes
|
||||||
| Age Last Birthday | Superannuation Account | Pension Fund | RCA | |||
|---|---|---|---|---|---|---|
| Number | Allowance ($) | Number | Allowance ($) | Number | Allowance ($) | |
| to 39 | 2 | 2,866 | 18 | 7,168 | - | - |
| 40-44 | 5 | 10,073 | 19 | 7,053 | - | - |
| 45-49 | 22 | 7,552 | 31 | 9,040 | - | - |
| 50-54 | 76 | 14,453 | 63 | 8,260 | - | - |
| 55-59 | 134 | 17,481 | 85 | 8,000 | - | - |
| 60-64 | 258 | 19,883 | 135 | 5,219 | 3 | 5,453 |
| 65-69 | 384 | 20,377 | 120 | 4,223 | 1 | 12 |
| 70-74 | 404 | 21,872 | 63 | 2,706 | 3 | 1,804 |
| 75-79 | 434 | 22,437 | 8 | 945 | 2 | 143 |
| 80-84 | 454 | 21,413 | 3 | 2,638 | - | - |
| 85-89 | 274 | 20,340 | - | - | - | - |
| 90-94 | 69 | 16,802 | - | - | - | - |
| 95-99 | 14 | 19,520 | - | - | - | - |
| 100-104 | 3 | 16,207 | - | - | - | - |
| All Ages | 2,533 | 20,516 | 545 | 5,763 | 9 | 2,452 |
| Average Age | 73.5 years | |||||
| Average Age at Death of Contributor | 60.8 years | |||||
Table 70 Footnotes
|
||||||
| Age Last Birthday | Superannuation Account | Pension Fund | RCA | |||
|---|---|---|---|---|---|---|
| Number | Allowance ($) | Number | Allowance ($) | Number | Allowance ($) | |
| to 39 | - | - | 2 | 5,268 | - | - |
| 40-44 | - | - | - | - | - | - |
| 45-49 | 2 | 11,416 | 3 | 6,460 | - | - |
| 50-54 | 3 | 9,471 | 4 | 13,337 | - | - |
| 55-59 | 7 | 9,055 | 5 | 9,063 | - | - |
| 60-64 | 7 | 14,271 | 5 | 8,816 | 1 | 3,107 |
| 65-69 | 12 | 13,120 | 7 | 5,565 | - | - |
| 70-74 | 10 | 12,138 | 10 | 3,730 | 1 | 448 |
| 75-79 | 5 | 16,932 | 3 | 1,336 | - | - |
| 80-84 | 4 | 21,408 | - | - | - | - |
| 85-89 | 5 | 9,778 | 1 | 10,549 | - | - |
| 90-94 | 1 | 4,554 | - | - | - | - |
| All Ages | 56 | 12,805 | 40 | 6,587 | 2 | 1,778 |
| Average Age | 67.2 years | |||||
| Average Age at Death of Contributor | 58.8 years | |||||
Table 71 Footnotes
|
||||||
| Age Last Birthday | Superannuation Account | Pension Fund | ||
|---|---|---|---|---|
| Number | Pension ($) | Number | Pension ($) | |
| 0 to 18 | 40 | 1,933 | 103 | 1,762 |
| 19 to 25 | 37 | 3,168 | 32 | 1,483 |
| All Ages | 77 | 2,526 | 135 | 1,696 |
Table 72 Footnotes
|
||||
Appendix L - Mortality Table for the Calculation of Instalments
For members who elect to buy back prior service, the mortality rates to be used up to the next actuarial valuation (or the date of transfer of Civilian Members to the PS pension plan if earlier) to calculate the monthly instalments required are shown in Table 73. These mortality rates are combined mortality rates for Regular and Civilian Members and are projected to plan year 2023. Table 74 shows the mortality rates to be used after the date of transfer of Civilian Members to the PS pension plan should this transfer occur before the next actuarial valuation. The mortality rates in Table 74 are rates for Regular Members only and are projected to plan year 2023.
Mortality rates in both tables are deemed to be the mortality rates applicable for plan years 2019 to 2023 inclusively together with the assumed longevity improvement factors shown in this report with the first year of projection being plan year 2024.
| Age Last BirthdayTable 73 footnote * | Male | Female |
|---|---|---|
| 30 | 0.4 | 0.2 |
| 40 | 0.7 | 0.6 |
| 50 | 1.5 | 1.2 |
| 60 | 3.7 | 3.2 |
| 70 | 10.5 | 8.5 |
| 80 | 40.5 | 27.3 |
| 90 | 129.2 | 105.9 |
| 100 | 276.4 | 310.7 |
| 110+ | 499.9 | 500.0 |
Table 73 Footnotes
|
||
| Age Last BirthdayTable 74 footnote * | Male | Female |
|---|---|---|
| 30 | 0.5 | 0.3 |
| 40 | 0.8 | 0.6 |
| 50 | 1.5 | 1.3 |
| 60 | 3.7 | 3.3 |
| 70 | 10.4 | 8.2 |
| 80 | 40.7 | 25.7 |
| 90 | 127.2 | 100.9 |
| 100 | 267.2 | 318.9 |
| 110+ | 500.0 | 500.0 |
Table 74 Footnotes
|
||
Appendix M - Transfer of Active Civilian Members to Public Service
It is expected that active Civilian Members (CMs) will become Public Service Employees under the Public Service Employment Act and will join the pension plan for the Public Service of Canada with their benefits accrued under the RCMP pension plan up to the deeming date being transferred to the PS pension plan. This appendix shows the financial impact on the RCMP pension plan assuming a deeming date of 21 May 2020. The following tables show the actuarial liabilities and current service costs of the plan before and after the deeming date of transfer.
| Superannuation Account | Pension Fund | RCA Account | Total | |
|---|---|---|---|---|
| Liabilities before transfer of CMs | 13,538 | 11,424 | 57 | 25,019 |
| Liabilities for Active CMs | (95) | (920) | (2) | (1,017) |
| Liabilities after transfer of CMs | 13,443 | 10,504 | 55 | 24,001 |
| Calendar Year | Current Service Cost As a percentage of pensionable payroll |
Ratio of Government to Contributors Current Service Cost |
|||
|---|---|---|---|---|---|
| RM Contributors | CM Contributors | Government | Total | ||
| 2020 | 9.06 | 1.38 | 12.81 | 23.24 | 1.23 |
| 2021 | 9.06 | 1.32 | 12.86 | 23.24 | 1.24 |
| 2022 | 9.07 | 1.27 | 12.95 | 23.28 | 1.25 |
| Calendar Year | Current Service Cost As a percentage of pensionable payroll |
Ratio of Government to Contributors Current Service Cost |
||
|---|---|---|---|---|
| Contributors | Government | Total | ||
| 2020 | 10.44 | 13.05 | 23.50 | 1.25 |
| 2021 | 10.39 | 13.12 | 23.52 | 1.26 |
| 2022 | 10.34 | 13.19 | 23.53 | 1.28 |
Appendix N - Acknowledgements
The Superannuation Directorate of the Department of PSPC provided the data on plan members.
The co-operation and able assistance received from the above-mentioned data provider deserve to be acknowledged.
The following individuals assisted in the preparation of this report:
Linda Benjauthrit
Hao Chen, ACIA, ASA
Li Ya Ding, ASA
Daniel Hébert, FCIA, FSA
Nicholas Landry, ACIA, ASA
François Lemire, FCIA, FSA
Guillaume Lépine-Mathieu, ACIA, ASA
Steve McCleave
Véronique Ménard, FCIA, FSA
Kelly Moore
Footnotes
- Footnote 1
-
The plans refer to the Pension Plans for the Public Service of Canada, the Canadian Forces (Regular Force and Reserve Force) and the RCMP.
- Footnote 2
-
The actuarial liability for service prior to 1 April 2000 refers to the actuarial liability for service accrued prior to that date except for service elections made on or after 1 April 2000. Service elections made on or after 1 April 2000 are deemed to be service accrued since that date.
- Footnote 3
-
All references to pensionable payroll throughout this report mean the aggregate of pensionable earnings of all contributors with less than 35 years of service.
- Footnote 4
-
A non-permitted surplus exists when the amount by which assets exceed liabilities in the Royal Canadian Mounted Police Pension Fund as determined by the actuarial valuation report referred to in section 30 of the RCMPSA or one requested by the President of Treasury Board, is greater than 25 percent of the amount of liabilities in respect of contributors, as determined in that report.
- Footnote 5
-
The Consolidated Revenue Fund of Canada is the account into which taxes and revenue are deposited, and from which funds are drawn in order to defray the costs of public services. Funds are deposited and withdrawn by the Receiver General for Canada.
- Footnote 6
-
Any reference to a given plan year throughout this report should be taken as the 12-month period ending 31 March of the given year.
- Footnote 7
-
If the number of years of pensionable service is less than five, then the averaging is over the entire period of pensionable service.
- Footnote 8
-
Indexed CPP annual pensionable earnings means the average of the YMPE, as defined in the CPP, over the five calendar years leading up to and including the one in which pensionable service terminated, increased by indexation proportionate to that accrued in respect of the immediate annuity.
- Footnote 9
-
Years of CPP pensionable service mean the number of years of RCMPSA pensionable service after 1965 or after attaining age 18, whichever is later, but not exceeding 35.
- Footnote 10
-
Or becomes entitled to a disability pension from the CPP or the QPP.
- Footnote 11
-
Note that all of the real rates presented in this report are actually differentials, i.e. the difference between the effective annual rate and the rate of increase in prices. This differs from the technical definition of a real rate of return, which, for example in the case of the ultimate Projected Return on the Fund assumption would be 3.9% (derived from 1.060/1.020) rather than 4.0%.
- Footnote 12
-
The spreads for the first year are based on the average spreads for plan year 2019 of 68, 2 and -14 basis points between 10-year-plus Government of Canada bond yield and the bonds underlying ??, ?? and ?7 respectively. The ultimate spreads of -18, 10 and -65 basis points, starting in fiscal year 2027, are based on the average spreads over the last 10 years. An interpolation reflecting the variation in new money rates is applied for intermediate years.
- Footnote 13
-
Salary at entry level rank for Constables at 1 April 2016 ($53,144) plus an assumed economic salary increase of 2.0% at 1 April 2017 and at 1 April 2018.
- Footnote 14
-
The average service in the force at retirement increased by 2.3 years and the average age at retirement increased by 3.8 years from 2002 to 2012.
- Footnote 15
-
In the previous intervaluation period, the average service in the force and average age at retirement for Regular Members remained stable. In the current intervaluation period, the average service in the force at retirement decreased from 32.0 years to 31.0 years and the average age at retirement decreased slightly from 55.3 years to 55.2 years.
- Footnote 16
-
More information on the basis to develop the mortality rates for the PS pension plan can be found in the Actuarial Report on the Pension Plan for the Public Service of Canada as at 31 March 2017.
- Footnote 17
-
Source: the Canadian Institute of Actuaries' Report on Canadian Economic Statistics 1924 – 2017.
- Footnote 18
-
In this Section, "risk-free" refers to the default risk. A risk-free bond is still subject to return volatility given the changes in interest rates.
- Footnote 19
-
Long-term federal bonds are considered risk-free since they have no risk of default. However, their market value is volatile and therefore long-term federal bonds do exhibit market and funding risk over the course of their life.
- Footnote 20
-
The 10 percent downside real returns over the next 3 years represent the expected 10th percentile average return over that period. That is, there is a 10% probability that the average real returns over the next 3 years will be lower than the 10 percent downside real returns.
- Footnote 21
-
The Funding Policy for the Public Sector Pension Plans limits the funding risk as having a lower than 5% chance of a plan being less than 70% funded over a 10-year horizon, assuming a fully funded initial position. The dotted line on the chart (using right axis) represents the chance that the plan is less than 70% funded over the next 20 years, based on initial funding ratio of 106% as at 31 March 2018; there is no virtual change to the dotted line if an initial funding ratio of 100% is assumed.
- Footnote 22
-
The legislation requires that the government stops contributing to the fund when there is a non-permitted surplus. The government may withdraw the non-permitted surplus and may also reduce employee contribution. As these actions are not automatic, they are not modeled.