Royal Canadian Mounted Police Pension Plan as at 31 March 2021 - Highlights
Accessibility statement
The Web Content Accessibility Guidelines (WCAG) defines requirements for designers and developers to improve accessibility for people with disabilities. It defines three levels of conformance: Level A, Level AA, and Level AAA. This report is partially conformant with WCAG 2.0 level AA. If you require a compliant version, please contact webmaster@osfi-bsif.gc.ca.
Message from the Actuary
We reflected the impacts of the COVID-19 pandemic on the economic assumptions used in this report. The pandemic is a very fluid situation that will continue to evolve for some time. The final impacts will be reflected in future reports.
Contributions are expected to exceed Fund benefits payments until 2031.
Main Findings
| Financial Position ($ millions) | AccountFootnote 1 | Fund |
|---|---|---|
| Recorded Balance/Actuarial Value of Assets | 13,359 | 13,802 |
| Liabilities | 14,503 | 12,720 |
| Surplus (Shortfall) | (1,144)Footnote 2 | 1,082 |
| Funding Ratio | 92.1% | 108.5% |
Key Assumptions
| Discount Rate | Current | Previous |
|---|---|---|
| Ultimate real rate on the Account | 2.0% | 2.6% |
| Ultimate real rate on the Fund | 3.9% | 4.0% |
| Cohort Life expectancy at age 65 (in years)Footnote 3 | 2021 | 2036 |
| Male | 22.5 | 23.4 |
| Female | 25.0 | 25.8 |
| Below YMPE | Above YMPE | Ratio of Government to Contributor Current Service Cost |
|---|---|---|
| 9.35% | 12.37% | 1.22 |
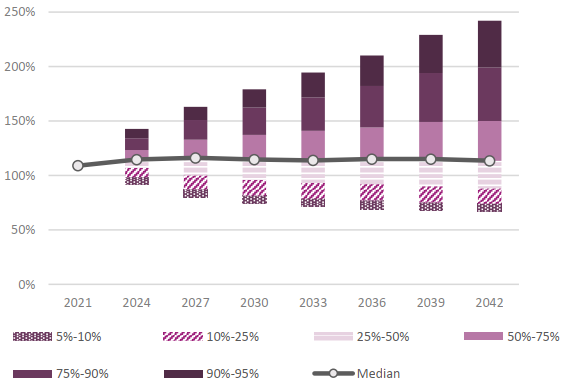
Range of Potential Funding Ratio
Graphic Description - Range of Potential Funding Ratio
| Year | 2021 | 2022 | 2023 | 2024 | 2025 | 2026 | 2027 | 2028 | 2029 | 2030 | 2031 | 2032 | 2033 | 2034 | 2035 | 2036 | 2037 | 2038 | 2039 | 2040 | 2041 | 2042 |
|---|---|---|---|---|---|---|---|---|---|---|---|---|---|---|---|---|---|---|---|---|---|---|
| 5%-10% | 0% | 3% | 6% | 7% | 7% | 7% | 7% | 7% | 7% | 8% | 8% | 7% | 7% | 7% | 7% | 8% | 8% | 7% | 7% | 8% | 7% | 7% |
| 10%-25% | 0% | 2% | 6% | 8% | 11% | 12% | 13% | 14% | 14% | 14% | 15% | 14% | 14% | 15% | 15% | 15% | 15% | 15% | 15% | 15% | 15% | 14% |
| 25%-50% | 0% | 1% | 5% | 8% | 11% | 14% | 16% | 17% | 18% | 19% | 20% | 20% | 21% | 22% | 22% | 23% | 24% | 24% | 25% | 25% | 26% | 26% |
| 50%-75% | 0% | 3% | 5% | 9% | 12% | 15% | 17% | 19% | 20% | 23% | 25% | 26% | 27% | 28% | 29% | 29% | 31% | 32% | 34% | 36% | 37% | 37% |
| 75%-90% | 0% | 7% | 9% | 11% | 13% | 15% | 18% | 21% | 23% | 25% | 27% | 28% | 31% | 33% | 35% | 38% | 40% | 42% | 45% | 48% | 50% | 49% |
| 90%-95% | 0% | 5% | 7% | 9% | 9% | 10% | 12% | 14% | 15% | 17% | 19% | 21% | 23% | 24% | 26% | 28% | 30% | 33% | 35% | 36% | 40% | 43% |
| Median | 109% | 111% | 113% | 115% | 116% | 116% | 116% | 116% | 116% | 115% | 114% | 114% | 114% | 114% | 114% | 115% | 115% | 115% | 115% | 115% | 116% | 114% |
Bar graph showing the range of potential funding ratio of the Pension Fund for the best-estimate portfolio over time. Y-axis represents the funded ratio. X-axis shows the plan year, starting at 31 March 2021 and ending at 31 March 2042.
The chart shows that the funding ratio for the Pension Fund was 108.5% as at 31 March 2021. The median expected funding ratio is stable (114.6% as at 31 March 2024, 113.8% as at 31 March 2033 and 113.5% as at 31 March 2042) over the projection period. At the fifth percentile, the funding ratio is 91.5% as at 31 March 2024, 71.6% as at 31 March 2033 and 67.0% as at 31 March 2042. At the 95th percentile, the funding ratio is 142.7% as at 31 March 2024, 194.5% as at 31 March 2033 and 242.0% at 31 March 2042.
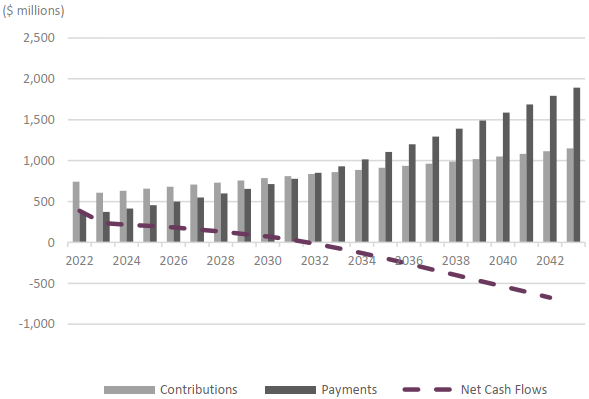
Evolution of Cash Flows over Time
Graphic Description - Evolution of Cash Flows over Time
| Plan Year | Contributions | Payments | Special Payments | Net Cash Flows |
|---|---|---|---|---|
| 2022 | 743 | 358 | N/A- | 385 |
| 2023 | 609 | 373 | N/A- | 236 |
| 2024 | 631 | 414 | N/A- | 217 |
| 2025 | 657 | 455 | N/A- | 202 |
| 2026 | 682 | 499 | N/A- | 183 |
| 2027 | 706 | 548 | N/A- | 158 |
| 2028 | 732 | 599 | N/A- | 133 |
| 2029 | 758 | 655 | N/A- | 103 |
| 2030 | 785 | 712 | N/A- | 73 |
| 2031 | 811 | 777 | N/A- | 34 |
| 2032 | 836 | 851 | N/A- | -15 |
| 2033 | 860 | 930 | N/A- | -70 |
| 2034 | 886 | 1,016 | N/A- | - 130 |
| 2035 | 912 | 1,107 | N/A- | - 195 |
| 2036 | 937 | 1,199 | N/A- | - 262 |
| 2037 | 962 | 1,294 | N/A- | - 332 |
| 2038 | 990 | 1,390 | N/A- | - 400 |
| 2039 | 1,019 | 1,490 | N/A- | - 471 |
| 2040 | 1,050 | 1,588 | N/A- | - 538 |
| 2041 | 1,082 | 1,688 | N/A- | - 606 |
| 2042 | 1,115 | 1,791 | N/A- | - 676 |
| 2043 | 1,151 | 1,892 | N/A- | - 741 |
Bar graph showing the evolution of cash flows under the Pension Fund over time. Y-axis represents the expected contributions, payments and resulting net cash flows in millions. X-axis represents the plan year, starting in 2022 and ending in 2043.
In plan year 2022, contributions to the Pension Fund are $743 million, whereas payments are $358 million, resulting in net cash flows of $385 million. Both contributions and payments are increasing over time, however payments are increasing at a higher rate than the contributions. Payments will be higher than contributions starting plan year 2032.
In 2032, the chart shows payments of $851 million exceeding contributions of $836 million and resulting in net cash flows of negative $15 million. From 2032, the Pension Fund experiences negative net cash flows. In plan year 2043, contributions to the Pension Fund reach $1,151 million, whereas payouts reach $1,892 million resulting in net cash flows of negative $741 million.
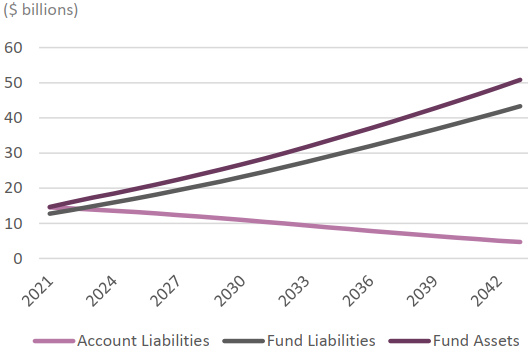
Account and Fund Projection
Graphic Description - Account and Fund Projection
| Valuation Year | Account Liabilities | Fund Liabilities | Fund Assets |
|---|---|---|---|
| 2021 | 15 | 13 | 15 |
| 2022 | 14 | 14 | 16 |
| 2023 | 14 | 15 | 17 |
| 2024 | 14 | 16 | 19 |
| 2025 | 13 | 17 | 20 |
| 2026 | 13 | 18 | 21 |
| 2027 | 12 | 19 | 22 |
| 2028 | 12 | 21 | 24 |
| 2029 | 11 | 22 | 25 |
| 2030 | 11 | 23 | 27 |
| 2031 | 10 | 25 | 28 |
| 2032 | 10 | 26 | 30 |
| 2033 | 9 | 28 | 32 |
| 2034 | 9 | 29 | 33 |
| 2035 | 8 | 30 | 35 |
| 2036 | 8 | 32 | 37 |
| 2037 | 7 | 34 | 39 |
| 2038 | 7 | 35 | 41 |
| 2039 | 6 | 37 | 43 |
| 2040 | 6 | 38 | 45 |
| 2041 | 5 | 40 | 47 |
| 2042 | 5 | 42 | 49 |
| 2043 | 5 | 43 | 51 |
The chart presents the evolution over time of the Superannuation Account liabilities for service prior to 1 April 2000 and the Pension Fund liabilities for service after 31 March 2000 as well as the Fund Assets. It is expected that the Pension Fund liabilities will exceed the Superannuation Account liabilities in 2023.
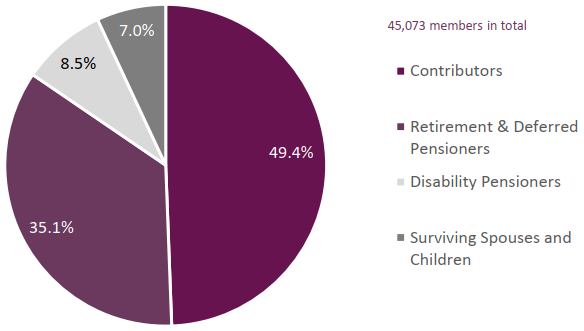
Summary of Membership Data
Graphic Description - Summary of Membership Data
| blank | Number | % |
|---|---|---|
| Contributors | 22 269 | 49.4% |
| Retirement & Deferred Pensioners | 15 826 | 35.1% |
| Disability Pensioners | 3 841 | 8.5% |
| Surviving Spouses and Children | 3 137 | 7.0% |
| Total | 45 073 | blank |
The pie chart presents a summary of membership data. 49.4% of the members are contributors, 35.1% are retirees and deferred pensioners, 8.5% are pensioners with disability and 7.0% are surviving spouses and children.
Footnotes
- Footnote 1
-
The Account tracks the liability for service prior to 1 April 2000.
- Footnote 2
-
Is it expected that a one-time nominal credit of $1,220 millions in 2023 will eliminate the account shortfall including accrued interest.
- Footnote 3
-
For a healthy Regular Member.