Old Age Security Program Mortality Experience: Actuarial Study No. 23
Accessibility statement
The Web Content Accessibility Guidelines (WCAG) defines requirements for designers and developers to improve accessibility for people with disabilities. It defines three levels of conformance: Level A, Level AA, and Level AAA. This report is partially conformant with WCAG 2.0 level AA. If you require a compliant version, please contact webmaster@osfi-bsif.gc.ca.
Office of the Chief Actuary
Office of the Superintendent of Financial Institutions Canada
12th Floor, Kent Square Building
255 Albert Street
Ottawa, Ontario
K1A 0H2
E-mail address: oca-bac@osfi-bsif.gc.ca
Table of contents
List of Tables
- Table 1 OAS Beneficiaries (as at December 31st)
- Table 2 OAS Beneficiary Deaths (1999-2019)
- Table 3 Comparison of OAS Beneficiary Deaths with Vital Statistics Deaths (2015-2019)
- Table 4 OAS Beneficiary Exposures (2019)
- Table 5 OAS Beneficiary Crude Mortality Rates* (2019)
- Table 6 OAS Beneficiary Graduated Mortality Rates (2019)
- Table 7 OAS Beneficiary and Population Mortality Rates and Ratios (2019)
- Table 8 OAS Beneficiary Life Expectancies (2019)
- Table 9 OAS Beneficiary and Population Life Expectancies at Age 65 (1999-2019)
- Table 10 Beneficiaries by Type of Benefit (as at December 31, 2019)
- Table 11 Deaths by Type of Benefit (2019)
- Table 12 Exposures by Type of Benefit (2019)
- Table 13 Graduated Mortality Rates and Ratios by Type of Benefit (2019)
- Table 14 Life Expectancies by Type of Benefit (2019)
- Table 15 Evolution of Life Expectancies at Age 65 by Type of Benefit (1999-2019)
- Table 16 Beneficiaries by Marital Status and Type of Benefit (as at December 31st 2019)
- Table 17 Deaths by Marital Status and Type of Benefit (2019)
- Table 18 Exposures by Marital Status and Type of Benefit (2019)
- Table 19 OAS Beneficiary Graduated Mortality Rates and Ratios by Marital Status (2019)
- Table 20 Mortality Rates and Ratios by Marital Status and Type of Benefit - Males (2019)
- Table 21 Mortality by Marital Status and Type of Benefit - Females (2019)
- Table 22 OAS Beneficiary Life Expectancies by Marital Status (2019)
- Table 23 Evolution of OAS Beneficiary Life Expectancies at Age 65 by Marital Status (2005-2019)
- Table 24 Life Expectancies by Marital Status and Type of Benefit (2019)
- Table 25 Evolution of Life Expectancies at Age 65 by Marital Status and Type of Benefit (2005 2019)
- Table 26 Beneficiaries by Place of Birth (as at December 31st 2019)
- Table 27 OAS Beneficiary Deaths by Place of Birth (2019)
- Table 28 OAS Beneficiary Exposures by Place of Birth (2019)
- Table 29 OAS Beneficiary Graduated Mortality Rates and Ratios by Place of Birth (2019)
- Table 30 OAS Beneficiary Life Expectancies by Place of Birth (2019)
- Table 31 Evolution of OAS Beneficiary Life Expectancies at Age 65 by Place of Birth (1999-2019)
- Table 32 OAS Beneficiary Average Annual Mortality Improvement Rates
- Table 33 OAS Beneficiary and Population Average Annual Mortality Improvement Rates
- Table 34 Average Annual Mortality Improvement Rates by Type of Benefit (2000-2014)
- Table 35 Average Annual Mortality Improvement Rates by Type of Benefit (2015-2019)
- Table 36 OAS Beneficiaries by Age and Sex (as at December 31st)
- Table 37 OAS Beneficiaries Deaths by Age and Sex (1999, 2009 and 2019)
- Table 38 OAS Beneficiaries Exposures by Age and Sex (1999, 2009 and 2019)
- Table 39 OAS Beneficiaries Graduated Mortality Rates by Age and Sex (1999, 2009 and 2019)
- Table 40 Life Table of OAS Beneficiaries (2019)
- Table 41 OAS Beneficiaries to Population Mortality Ratios (2019)
- Table 42 OAS Beneficiaries by Type of Benefit (as at December 31st 2019)
- Table 43 OAS Beneficiaries Deaths by Type of Benefit (2019)
- Table 44 OAS Beneficiaries Exposures by Type of Benefit (2019)
- Table 45 Graduated Mortality Rates and Ratios by Type of Benefit – Males (2019)
- Table 46 Graduated Mortality Rates and Ratios by Type of Benefit – Females (2019)
- Table 47 Life Table of OAS Beneficiaries without GIS (2019)
- Table 48 Life Table of OAS Beneficiaries with GIS (2019)
- Table 49 OAS Beneficiaries by Marital Status and Type of Benefit – Males (2019)
- Table 50 OAS Beneficiaries by Marital Status and Type of Benefit – Females (2019)
- Table 51 OAS Beneficiaries Deaths by Marital Status and Type of Benefit – Males (2019)
- Table 52 OAS Beneficiaries Deaths by Marital Status and Type of Benefit – Females (2019)
- Table 53 OAS Beneficiaries Exposures by Marital Status and Type of Benefit – Males (2019)
- Table 54 OAS Beneficiaries Exposures by Marital Status and Type of Benefit – Females (2019)
- Table 55 Graduated Mortality Rates and Ratios by Marital Status – Males (2019)
- Table 56 Graduated Mortality Rates and Ratios by Marital Status – Females (2019)
- Table 57 Life Table of OAS Married Beneficiaries (2019)
- Table 58 Life Table of OAS Single Beneficiaries (2019)
- Table 59 Male Graduated Mortality Rates by Age, Marital Status and Type of Benefit (2019)
- Table 60 Female Graduated Mortality Rates by Age, Marital Status and Type of Benefit (2019)
- Table 61 Life Table of OAS Married Beneficiaries without GIS (2019)
- Table 62 Life Table of OAS Married Beneficiaries with GIS (2019)
- Table 63 Life Table of OAS Single Beneficiaries without GIS (2019)
- Table 64 Life Table of OAS Single Beneficiaries with GIS (2019)
- Table 65 OAS Beneficiaries by Place of Birth (2019)
- Table 66 OAS Beneficiaries Deaths by Place of Birth (2019)
- Table 67 OAS Beneficiaries Exposures by Place of Birth (2019)
- Table 68 Graduated Mortality Rates and Ratios by Place of Birth (2019)
- Table 69 Life Table of OAS Beneficiaries Born In Canada (2019)
- Table 70 Life Table of OAS Beneficiaries Born Outside Canada (2019)
- Table 71 Life Expectancies at Age 65 by Type of Benefit, Marital Status and Place of Birth
List of Charts
- Chart 1 Distribution of OAS Beneficiary Deaths
- Chart 2 OAS Beneficiary Exposures (2019)
- Chart 3 OAS Beneficiary Crude Mortality Rates (2019)
- Chart 4 OAS Beneficiary Crude and Graduated Mortality Rates (2019)
- Chart 5 OAS Beneficiary to Population Mortality Ratios (2019)
- Chart 6 Evolution of OAS Beneficiary Life Expectancies at Age 65
- Chart 7 Exposures by Type of Benefit (2019)
- Chart 8 OAS Beneficiary Mortality Ratios by Type of Benefit (2019)
- Chart 9 Evolution of Life Expectancies at Age 65 by Type of Benefit
- Chart 10 OAS Beneficiary Mortality Ratios by Marital Status (2019)
- Chart 11 Mortality Ratios by Marital Status, and Type of Benefit - Males (2019)
- Chart 12 Mortality Ratios by Marital Status and Type of Benefit - Females (2019)
- Chart 13 Evolution of OAS Beneficiary Life Expectancies at Age 65 by Marital Status
- Chart 14 Life Expectancies at Age 65 by Marital Status and Type of Benefit
- Chart 15 OAS Beneficiary Mortality Ratios by Place of Birth (2019)
- Chart 16 Evolution of OAS Beneficiary Life Expectancies at Age 65 by Place of Birth
- Chart 17 OAS Beneficiary Mortality Improvement Rates
- Chart 18 OAS Mortality Improvement Rates by Type of Benefit
1. Executive Summary
1.1 Purpose
This is the fourth Old Age Security (OAS) program mortality experience study published by the Office of the Chief Actuary (OCA).
The OAS pension is a monthly benefit available to most Canadians 65 years of age or older, who meet residence and legal status requirements. The OAS pension is subject to a repayment amount or recovery tax for those with income exceeding a specified level. The OAS program also includes a Guaranteed Income Supplement (GIS) and Allowance monthly benefits paid to residents of Canada who receive a full or partial OAS pension and who have little or no other income. To receive the GIS, an individual must be an OAS pensioner. There Allowance benefit is paid to those aged 60 to 64 who are either the spouses or common-law partners of GIS recipients or are widowed.
Similar to the three preceding OAS mortality studies (Actuarial Studies Nos. 5, 11, and 17), this study excludes OAS benefits paid under international social security agreements and covers only benefits paid under the domestic OAS program. As well, like in the previous studies, this study covers OAS pensioners and GIS beneficiaries.
The availability of an administrative OAS beneficiaries database provided by Service Canada allows for a more accurate measurement of the level and trend in mortality experienced by the oldest portion of the Canadian population over the period from 1 January 1999 to 31 December 2019. As the experience period considered ends in 2019, the impacts of the COVID-19 pandemic are not reflected in this study.
The longer experience period of this study (from 1999 to 2019 inclusive) relative to its predecessors provides for the observation and analysis of longer-term trends of mortality. This study accounts for over 99 million life-years of exposure and about 4 million deaths.
The OCA will use the results of this study to assess the mortality characteristics of the overall Canadian population and of OAS program beneficiaries when producing its next triennial Canada Pension Plan (CPP) and OAS program actuarial reports.
1.2 Scope
Section II describes the data and methodology used to analyze the OAS program beneficiary mortality experience. Section III presents the overall mortality experience of OAS beneficiaries. Also included in section III is a comparison with the Canadian population mortality.
A comparison of mortality rates by type of benefit is presented in Section IV, while Section V presents the level of mortality by marital status and type of benefit. Section VI presents the level of mortality by place of birth. Section VII next presents an analysis of the trends in mortality improvement rates over the experience period. A conclusion of the study then follows in Section VIII. Detailed tables are provided in the Annex of the study, and lists of the references used and contributors to the study are provided at the end.
Throughout this study, the terms “OAS” and “OAS program” are used interchangeably to refer to the OAS program. Also, all life expectancies presented in this study refer to period life expectancies (i.e., without assumed future mortality improvements). Lastly, all figures shown in the study pertain to OAS program beneficiaries aged 65 and older, unless otherwise indicated.
1.3 Main Findings
1.3.1 Life Expectancies of OAS Beneficiaries
-
In 2019, the life expectancies at age 65 for OAS beneficiaries are 19.4 years for males and 22.2 years for females. These are 3.3 years and 2.3 years higher than the corresponding life expectancies observed in 1999.
-
The gap in life expectancies between females and males decreased from 3.8 years in 1999 to 2.8 years in 2019.
-
Older Canadians are living longer but the growth in life expectancy of one month per year over the period from 2015 to 2019 has been lower than the two months per year experienced over the previous 15 years period 2000 to 2014. Similar trends have been observed in the United States and in the United Kingdom.
1.3.2 Life Expectancies by Type of Benefit
-
Over the last 20 years, life expectancy at age 65 for males has increased from 16.9 years in 1999 to 20.3 years in 2019 for those not receiving the GIS benefits and from 14.5 years in 1999 to 17.4 years in 2019 for those receiving the GIS benefit.
-
In comparison, for females, life expectancy at age 65 has increased from 20.8 years in 1999 to 23.2 years in 2019 for those not receiving the GIS benefit and from 18.8 years in 1999 to 20.7 years in 2019 for those receiving the GIS benefit.
-
As such, the gap in life expectancies at age 65 between beneficiaries not receiving the GIS and those receiving the benefit has increased over the period 1999 to 2019. In 1999, the differential was 2.4 years for males and 2.0 years for females, while in 2019 the differential is 2.9 years for males and 2.5 years for females.
1.3.3 Life Expectancies by Marital Status and Type of Benefit
-
In 2019, the life expectancies at age 65 are 20.7 years for married males and 16.8 years for single males. The corresponding life expectancies at age 65 for married and single females are 23.6 years and 21.1 years.
-
In 2019, single males experience mortality that is about 2.7 times the level of married beneficiaries at age 65. In comparison, single females experience mortality that is about 1.9 times the level of married beneficiaries.
-
In 2019, for both sexes in general, single beneficiaries in receipt of the GIS have the lowest life expectancies while married beneficiaries not receiving the GIS have the highest life expectancies.
1.3.4 Life Expectancies by Place of Birth
-
OAS beneficiaries born outside Canada experience lower mortality than those born in Canada. This may be explained by the “healthy immigrant effect” (Vang et al., 2015), which results from several factors, including medical and employability screening prior to entry to Canada as well as cultural and lifestyle characteristics.
-
In 2019, the life expectancies at age 65 are 20.8 years for male OAS beneficiaries born outside Canada and 18.4 years for those born in Canada. The corresponding life expectancies for females at age 65 are 23.6 years and 21.4 years.
-
The gap between the life expectancies at age 65 of OAS beneficiaries born outside Canada and those born in Canada has increased for both sexes over the period 1999 to 2019. In 1999, the differential by place of birth was 1.5 years for males and 0.9 of a year for females. In 2019, the differential by place of birth for both males and females is about 2.2 years.
1.3.5 Mortality Improvements
-
The average annual mortality improvement rate for males in the age group 65 to 74 over the period 2000 to 2014 has been 2.7%, and this compares to a level of 1.0% over the more recent period 2015 to 2019. In comparison, for the same age group, the average annual mortality improvement rate for females has also decreased, standing at 1.9% for the 2000 to 2014 period and at 1.0% for the 2015 to 2019 period.
-
For both sexes, mortality improvements for beneficiaries in receipt of the GIS have generally been lower than for beneficiaries not receiving the GIS. Over the period 2000 to 2019, for ages 65 to 74, those in receipt of the GIS experienced an average annual mortality improvement rate of 1.6% and 1.1% for males and females, respectively. These compare to average annual improvement rates of 2.5% for males and 1.8% for females not in receipt of the GIS. These improvement rates have been somewhat lower over the more recent period 2015 to 2019.
-
The average annual mortality improvement rates for OAS beneficiaries are at the same levels as those derived from the general population mortality.
1.4 Conclusion
In general, this study confirms the results that were obtained by the previous OAS program beneficiary mortality studies. The analysis by type of benefit received shows that beneficiaries who do not receive the GIS experience lower mortality compared to those who receive the GIS. The analysis by marital status shows that beneficiaries who are married experience lower mortality compared to single beneficiaries. The analysis by place of birth shows that beneficiaries who were born outside Canada experience lower mortality compared to beneficiaries who were born in Canada.
The study also reveals that mortality improvement rates over the more recent period from 2015 to 2019 have been somewhat lower than improvement rates experienced over the previous 15 years period from 2000 to 2014.
2. Data and Methodology
2.1 Data Source and Validation
The main source of data for this study is an administrative seriatim (i.e., by non‑identifiable individual records) OAS program beneficiaries database that was provided to the OCA by Service Canada, which is the administrator of the OAS program. The OAS database contains information on the amount of regular monthly benefits received by each OAS program beneficiary along with the associated payment status (i.e., whether in pay, suspended, or terminated) at each 31 December for years 1999 to 2019 inclusive. The OAS database allows for the identification of those receiving the GIS and Allowance benefits in addition to the OAS pension due to having no or very low incomeFootnote 1.
The Canada Revenue Agency (CRA) database available to the OCA was also used for this study to determine the date of death and the marital status, if that information was not available solely from the OAS database. Statistics Canada also provided general population mortality data for Canada by age and sex for individual years 1999 to 2019 based on Canada Life Tables (CLT).
Data validation was performed on all data records. The validation indicated that only a small portion of all beneficiary records (less than 0.1% of records) had incorrect or missing data, and thus needed to be discarded.
This study is based on the number of deaths and life-years of exposures determined for each class of OAS beneficiaries. This study accounts for over 99 million life-years of exposure and about 4 million deaths. For any given calendar year, the term “life-years of exposures” (or simply “exposures”) at age “x” last birthday (i.e. attained age as at the last birthday) is defined as the amount of time for which a beneficiary was exposed to the risk of death at age “x” during that year. Specifically, exposures during a calendar year are measured as follows:
-
For beneficiaries in pay who are age “x” on 1 January of a calendar year, life-years of exposures at age “x” are measured from January 1st to the earliest of a beneficiary’s time of death or time they reach age “x+1”.
-
For beneficiaries in pay who are age “x-1” on 1 January of a calendar year, life-years of exposures at age “x” are measured from the time a beneficiary reaches age “x” to the earlier of the beneficiary’s time of death or the end of the calendar year.
-
For new beneficiaries who come into pay at age “x” during a given calendar year, life-years of exposures at age “x” are measured from the time an individual becomes a beneficiary to the earlier of the beneficiary’s time of death, time they reach age “x+1”, or the end of the calendar year.
-
For new beneficiaries who come into pay at age “x-1” during a given calendar year, life-years of exposures at age “x” are measured from the time the new beneficiary reaches age “x” to the earlier of the beneficiary’s time of death or the end of the calendar year.
Throughout this study, the terms “OAS” and “OAS program” are used interchangeably to refer to the OAS program. Also, all life expectancies presented in this study refer to period life expectancies (i.e., without assumed future mortality improvements).
2.2 Methodology used for Calculating Mortality Rates
This section provides a general overview of the methodology used in the development of the mortality rates of OAS beneficiaries over the experience periods running from 1 January 1999 to 31 December 2019.
The graduated OAS beneficiary mortality rates are derived using the following two-step process:
2.2.1 Crude Mortality Rates
For all beneficiary subclasses, the crude mortality rate for a given calendar year, age “x”, and sex is defined as the probability that a person of age “x” will die between ages “x” and “x+1” during the given year. Crude mortality rates are usually calculated by simply dividing the relevant number of deaths by the number of life-years of exposures (defined above) over the given year or period. For this study, annual crude mortality rates are determined using the Product-Limit Estimator (PLE) method, also known as the Kaplan-Meier Product-Limit Estimator method by using the survival rates (see Appendix B of Actuarial Study No.11). For the overall OAS program experience, the highest ages for which the crude mortality rates were judged to be statistically credible are age 97 for males and 101 for females.
2.2.2 Graduated Mortality Rates
For a given calendar year, the OAS beneficiary crude mortality rates by year, age, sex, and various other subclasses (i.e., by type of benefit, marital status, and place of birth), were graduated by age to reflect a compromise between smoothness and fit. A Whittaker-Henderson graduation method was used to produce smoothed rates up to the highest advanced age such that the trend in mortality over that age and the previous three ages was deemed to provide the best fit for convergence to the ultimate mortality rates at age 120 of 700 deaths per 1,000 males and 650 deaths per 1,000 females.
3. OAS Beneficiary Mortality
3.1 Introduction
This section presents the overall mortality of OAS beneficiaries over the period 1999 to 2019. As was done in the previous three OAS mortality studies, the OAS benefits provided through international social security agreements have been excluded from this study.
3.2 Overall Mortality Experience (1999-2019)
3.2.1 Beneficiaries
Historical data on the number of OAS beneficiaries by age and sex are presented in Table 1. As females live longer than males, in 2019, 29% of female beneficiaries were aged 80 and over compared to 23% for males. There were over 9,800 centenarians in 2019, out of which 83% were females.
Between 1999 and 2019, the number of male beneficiaries increased by 85%, from 1.6 million in 1999 to 2.9 million in 2019. Over the same period, the number of female beneficiaries increased by 63%, from 2.1 million to 3.5 million. The steeper increase in the number of male beneficiaries can be attributed to the higher mortality improvement rates for males over that period.
| Age Group | Males | |||||
|---|---|---|---|---|---|---|
| Number | Distribution | |||||
| 1999 | 2009 | 2019 | 1999 | 2009 | 2019 | |
| 65-69 | 521,861 | 655,116 | 908,908 | 33% | 32% | 31% |
| 70-74 | 436,295 | 502,918 | 804,298 | 28% | 25% | 28% |
| 75-79 | 321,466 | 402,107 | 541,093 | 20% | 20% | 19% |
| 80-84 | 174,527 | 270,065 | 345,669 | 11% | 13% | 12% |
| 85-89 | 85,757 | 139,362 | 203,740 | 5% | 7% | 7% |
| 90-94 | 26,153 | 41,698 | 79,804 | 2% | 2% | 3% |
| 95-99 | 4,921 | 8,700 | 17,215 | 0% | 0% | 1% |
| 100+ | 523 | 816 | 1,636 | 0% | 0% | 0% |
| Total | 1,571,503 | 2,020,782 | 2,902,363 | 100% | 100% | 100% |
| Age Group | Females | |||||
| Number | Distribution | |||||
| 1999 | 2009 | 2019 | 1999 | 2009 | 2019 | |
| 65-69 | 562,888 | 698,644 | 992,966 | 27% | 27% | 29% |
| 70-74 | 523,488 | 560,828 | 877,935 | 25% | 22% | 25% |
| 75-79 | 456,891 | 487,385 | 618,097 | 22% | 19% | 18% |
| 80-84 | 296,616 | 391,584 | 438,098 | 14% | 15% | 13% |
| 85-89 | 181,385 | 266,065 | 304,303 | 9% | 10% | 9% |
| 90-94 | 73,457 | 109,634 | 161,967 | 3% | 4% | 5% |
| 95-99 | 18,879 | 31,943 | 54,230 | 1% | 1% | 2% |
| 100+ | 2,839 | 4,562 | 8,211 | 0% | 0% | 0% |
| Total | 2,116,443 | 2,550,645 | 3,455,807 | 100% | 100% | 100% |
Tables 36 to 41 in the Annex show various statistics related to OAS program beneficiaries by individual age and sex.
3.2.2 Deaths
Table 2 presents the number of deaths by age group and sex. The deaths are tabulated on an age last birthday basis. Over the period 1999 to 2019, there were 2.0 million male deaths and 2.1 million female deaths. Of the 233,370 deaths in 2019, there were 4,092 classified as centenarians (82% being females). The median age at death of males increased by 3.0 years, from 78.8 years in 1999 to 81.8 years in 2019, while for females it increased by 2.9 years, from 83.3 to 86.2 years over the same period. Female deaths are distributed more toward the older ages compared to males, because of females’ greater longevity.
| Age Group | Males | ||||||
|---|---|---|---|---|---|---|---|
| Number | Distribution | ||||||
| 1999-2019 | 1999 | 2009 | 2019 | 1999 | 2009 | 2019 | |
| 65-69 | 234,868 | 11,541 | 10,602 | 13,187 | 13.8% | 11.8% | 11.6% |
| 70-74 | 302,177 | 15,685 | 12,701 | 17,319 | 18.7% | 14.2% | 15.2% |
| 75-79 | 366,639 | 18,546 | 17,369 | 18,640 | 22.1% | 19.4% | 16.4% |
| 80-84 | 405,639 | 16,820 | 19,714 | 20,783 | 20.1% | 22.0% | 18.3% |
| 85-89 | 360,497 | 13,192 | 17,245 | 22,290 | 15.7% | 19.3% | 19.6% |
| 90-94 | 208,526 | 6,141 | 8,835 | 15,360 | 7.3% | 9.9% | 13.5% |
| 95-99 | 63,435 | 1,714 | 2,718 | 5,478 | 2.0% | 3.0% | 4.8% |
| 100+ | 9,298 | 217 | 382 | 754 | 0.3% | 0.4% | 0.7% |
| Total | 1,951,079 | 83,856 | 89,566 | 113,811 | 100.0% | 100.0% | 100.0% |
| Median Age | 80.8 | 78.8 | 80.9 | 81.8 | |||
| Age Group | Females | ||||||
| Number | Distribution | ||||||
| 1999-2019 | 1999 | 2009 | 2019 | 1999 | 2009 | 2019 | |
| 65-69 | 154,346 | 6,899 | 6,751 | 8,896 | 7.8% | 6.8% | 7.4% |
| 70-74 | 212,554 | 10,504 | 9,114 | 12,307 | 11.8% | 9.2% | 10.3% |
| 75-79 | 291,863 | 15,236 | 13,299 | 14,537 | 17.2% | 13.4% | 12.2% |
| 80-84 | 395,191 | 17,560 | 19,279 | 18,600 | 19.8% | 19.5% | 15.6% |
| 85-89 | 465,628 | 18,816 | 23,226 | 24,029 | 21.2% | 23.5% | 20.1% |
| 90-94 | 388,681 | 13,033 | 17,179 | 24,220 | 14.7% | 17.4% | 20.3% |
| 95-99 | 182,050 | 5,357 | 8,247 | 13,632 | 6.0% | 8.3% | 11.4% |
| 100+ | 43,322 | 1,256 | 1,814 | 3,338 | 1.4% | 1.8% | 2.8% |
| Total | 2,133,635 | 88,661 | 98,909 | 119,559 | 100.0% | 100.0% | 100.0% |
| Median Age | 85.0 | 83.3 | 85.1 | 86.2 | |||
Chart 1 shows the change in the distribution of deaths by age and sex for 1999, 2009 and 2019. It clearly illustrates that the median age at death for both males and females has increased over time as the distribution has shifted to the right. In 2019, the highest number of deaths occurred at age 88 for males and at age 90 for females, this compares to age 78 for males and age 85 for females in 1999.
Chart 1 - Distribution of OAS Beneficiary Deaths (1999, 2009 and 2019)
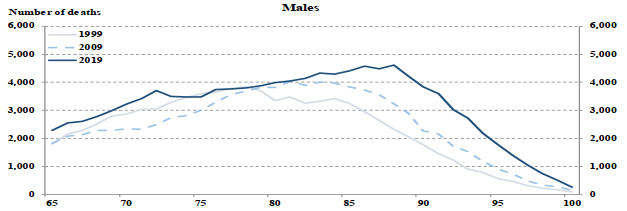
Chart Description
Two line charts. Chart 1(i) (top chart) is for males and Chart 1(ii) (bottom chart) is for females. Both charts show the distribution of deaths by age for years 1999, 2009 and 2019. The Y axis shows the number of deaths and the X axis shows the age.
Chart 1(i)
For males age 65, there were 1,791 deaths in 1999, 1,827 deaths in 2009 and 2,288 deaths in 2019.
For males age 70, there were 2,876 deaths in 1999, 2,333 deaths in 2009 and 3,227 deaths in 2019.
For males age 75, there were 3,597 deaths in 1999, 3,008 deaths in 2009 and 3,472 deaths in 2019.
For males age 80, there were 3,343 deaths in 1999, 3,822 deaths in 2009 and 3,989 deaths in 2019.
For males age 85, there were 3,242 deaths in 1999, 3,837 deaths in 2009 and 4,396 deaths in 2019.
For males age 90, there were 1,765 deaths in 1999, 2,267 deaths in 2009 and 3,843 deaths in 2019.
For males age 95, there were 564 deaths in 1999, 898 deaths in 2009 and 1,774 deaths in 2019.
For males age 100, there were 80 deaths in 1999, 144 deaths in 2009 and 262 deaths in 2019.
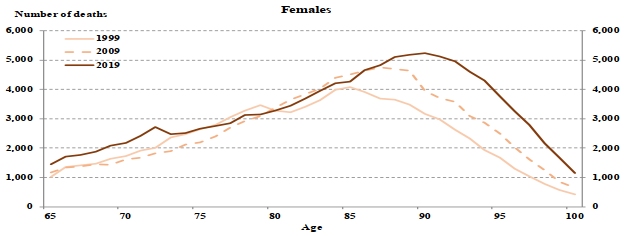
Chart Description
Chart 1(ii)
For females age 65, there were 1,029 deaths in 1999, 1,164 deaths in 2009 and 1,453 deaths in 2019.
For females age 70, there were 1,732 deaths in 1999, 1,615 deaths in 2009 and 2,181 deaths in 2019.
For females age 75, there were 2,651 deaths in 1999, 2,196 deaths in 2009 and 2,657 deaths in 2019.
For females age 80, there were 3,284 deaths in 1999, 3,369 deaths in 2009 and 3,283 deaths in 2019.
For females age 85, there were 4,086 deaths in 1999, 4,507 deaths in 2009 and 4,264 deaths in 2019.
For females age 90, there were 3,158 deaths in 1999, 3,952 deaths in 2009 and 5,229 deaths in 2019.
For females age 95, there were 1,690 deaths in 1999, 2,501 deaths in 2009 and 3,763 deaths in 2019.
For females age 100, there were 421 deaths in 1999, 655 deaths in 2009 and 1,142 deaths in 2019.
Table 3 shows, by age group and sex, a comparison of the number of deaths from the OAS database with the number of deaths reported by Statistics Canada (from the official Vital Statistics for Canada) over the period 2015 to 2019. For ages 65 to 69, the lower number of OAS deaths compared to the Vital Statistics may be explained by recipient rates for OAS benefits being less than 100%. This could be due to the fact that a portion of the population has not yet applied for OAS benefits by age 70 because of either not being eligible or opting to delay take-up of their pension in order to receive an actuarial adjustment or accumulate more years of residence and hence receive a higher pension. For ages 70 and above, the number of deaths from Vital Statistics is lower than that from the OAS database. The larger number of deaths as reported from the OAS program when compared to Vital Statistics is due to the fact that Vital Statistics exclude Canadians who die outside Canada while the OAS program includes them.
| Age Group | Males | Females | ||||
|---|---|---|---|---|---|---|
| OAS | Vital StatisticsFootnote * | Ratio OAS to Vital Statistics | OAS | Vital StatisticsFootnote * | Ratio OAS to Vital Statistics | |
| 65-69 | 65,264 | 66,294 | 0.984 | 43,932 | 44,761 | 0.981 |
| 70-74 | 79,461 | 78,058 | 1.018 | 57,387 | 56,652 | 1.013 |
| 75-79 | 88,160 | 86,234 | 1.022 | 68,994 | 68,148 | 1.012 |
| 80-84 | 102,756 | 100,769 | 1.020 | 92,715 | 91,287 | 1.016 |
| 85-89 | 107,559 | 104,955 | 1.025 | 120,458 | 118,264 | 1.019 |
| 90+ | 98,368 | 95,226 | 1.033 | 195,200 | 190,449 | 1.025 |
| Total | 541,568 | 531,536 | 1.019 | 578,686 | 569,561 | 1.016 |
Table 3 Footnote
|
||||||
3.2.3 Exposures
Consistent with the number of beneficiaries shown in Table 1, Table 4 shows that as females live longer than males, female life-years of exposures are on average distributed more toward the advanced ages. Chart 2 shows that females have higher exposures than males at every age because of females’ greater longevity.
| Age Group | Exposures | Distribution | ||||
|---|---|---|---|---|---|---|
| Males | Females | Both Sexes | Males | Females | Both Sexes | |
| 65-69 | 924,379 | 998,005 | 1,922,384 | 32.0% | 29.1% | 30.4% |
| 70-74 | 794,014 | 863,846 | 1,657,860 | 27.4% | 25.2% | 26.2% |
| 75-79 | 532,144 | 609,320 | 1,141,463 | 18.4% | 17.7% | 18.0% |
| 80-84 | 342,409 | 435,381 | 777,790 | 11.8% | 12.7% | 12.3% |
| 85-89 | 202,631 | 304,147 | 506,778 | 7.0% | 8.9% | 8.0% |
| 90-94 | 78,744 | 162,266 | 241,010 | 2.7% | 4.7% | 3.8% |
| 95-99 | 16,981 | 53,654 | 70,634 | 0.6% | 1.6% | 1.1% |
| 100+ | 1,609 | 8,131 | 9,739 | 0.1% | 0.2% | 0.2% |
| Total | 2,892,910 | 3,434,749 | 6,327,658 | 100.0% | 100.0% | 100.0% |
Chart 2 - OAS Beneficiary Exposures (2019)
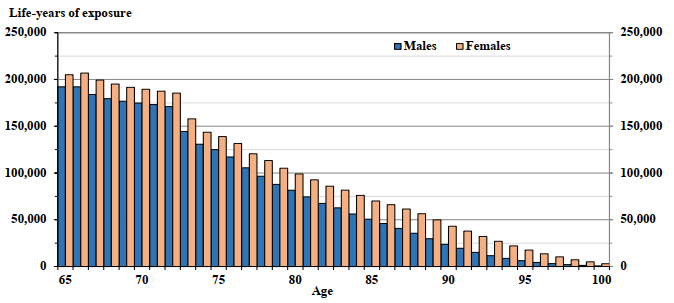
Chart Description
Vertical bars showing a comparison of males and females OAS beneficiaries’ exposures in 2019. The Y axis is the number of life-years of exposure and the X axis is the age.
At age 65, the exposure is 192,186 for males and it is 205,066 for females.
At age 70, the exposure is 174,830 for males and it is 189,547 for females.
At age 75, the exposure is 125,045 for males and it is 138,907 for females.
At age 80, the exposure is 81,533 for males and it is 98,951 for females.
At age 85, the exposure is 50,545 for males and it is 70,142 for females.
At age 90, the exposure is 23,769 for males and it is 43,122 for females.
At age 95, the exposure is 6,284 for males and it is 17,552 for females.
At age 100, the exposure is 646 for males and it is 3,033 for females.
3.2.4 OAS Beneficiary Mortality Rates (2019)
3.2.4.1 OAS Beneficiary Crude Mortality Rates by Age and Sex
The OAS program beneficiary crude mortality rates for the year 2019 by age and sex are presented in Table 5 and Chart 3. Males experience a higher level of mortality than females at all ages.
| Age | Annual Deaths per Thousand | Ratio Females to Males |
|
|---|---|---|---|
| Males | Females | ||
| 65 | 11.9 | 7.1 | 0.60 |
| 70 | 18.3 | 11.4 | 0.63 |
| 75 | 27.4 | 18.9 | 0.69 |
| 80 | 47.7 | 32.6 | 0.68 |
| 85 | 83.2 | 59.0 | 0.71 |
| 90 | 149.3 | 114.2 | 0.77 |
| 95 | 246.2 | 192.8 | 0.78 |
| 100 | 332.1 | 312.5 | 0.94 |
Table 5 Footnote
|
|||
Chart 3 - OAS Beneficiary Crude Mortality Rates (2019)
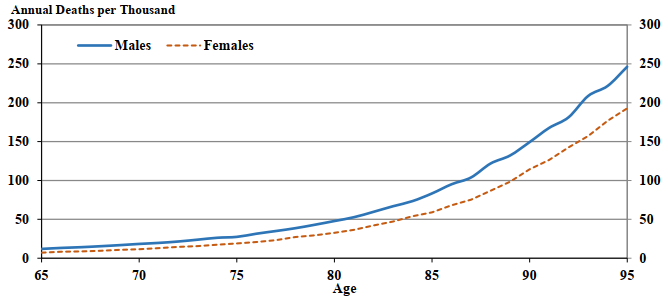
Chart Description
Line chart showing the male and female OAS beneficiary crude mortality rates in 2019. The Y axis shows the crude mortality rates per thousand and the X axis shows the age.
At age 65, the crude mortality rates per thousand is 11.9 for males and it is 7.1 for females.
At age 70, the crude mortality rates per thousand is 18.3 for males and it is 11.4 for females.
At age 75, the crude mortality rates per thousand is 27.4 for males and it is 18.9 for females.
At age 80, the crude mortality rates per thousand is 47.7 for males and it is 32.6 for females.
At age 85, the crude mortality rates per thousand is 83.2 for males and it is 59.0 for females.
At age 90, the crude mortality rates per thousand is 149.3 for males and it is 114.2 for females.
At age 95, the crude mortality rates per thousand is 246.2 for males and it is 192.8 for females.
3.2.4.2 OAS Beneficiary Graduated Mortality Rates by Age and Sex (2019)
The graduated and extended mortality rates by age and sex and corresponding ratios of female to male mortality rates for the year 2019 are presented in Table 6, and a comparison of the graduated and crude mortality rates for both sexes is shown in Chart 4.
| Age | Annual Deaths per Thousand | Ratio Females to Males |
|
|---|---|---|---|
| Males | Females | ||
| 65 | 12.0 | 7.2 | 0.61 |
| 70 | 18.1 | 11.7 | 0.65 |
| 75 | 28.4 | 19.0 | 0.67 |
| 80 | 47.5 | 33.0 | 0.69 |
| 85 | 83.6 | 59.8 | 0.72 |
| 90 | 149.7 | 112.0 | 0.75 |
| 95 | 245.0 | 195.4 | 0.80 |
| 100 | 355.8 | 299.7 | 0.84 |
| 105 | 474.4 | 413.3 | 0.87 |
| 110 | 583.3 | 524.8 | 0.90 |
| 115 | 664.6 | 611.3 | 0.92 |
| 120 | 700.0 | 650.0 | 0.93 |
Although male OAS beneficiaries experience higher mortality than female beneficiaries, the relative gap between the male and female graduated rates declines significantly with age, with mortality between the sexes converging at the older ages. At ages 70 to 80, female OAS beneficiaries experience mortality rates that are about two thirds the rates for males. By age 95, female mortality rates are 80% of male rates.
Chart 4 - OAS Beneficiary CrudeChart 4 Footnote * and Graduated Mortality Rates (2019)
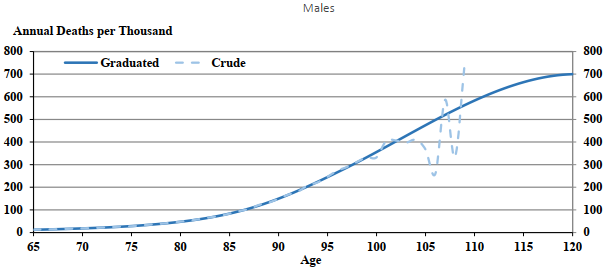
Chart Description
Two line charts. Chart 4(i) (Top chart) is for males and Chart 4(ii) (Bottom chart) is for females. Both charts showing the crude and graduated mortality rates per thousand in 2019. The Y axis shows the mortality rates per thousand and the X axis shows the age.
For males age 65, the crude mortality rates were 11.9 and the graduated mortality rates were 12.0.
For males age 70, the crude mortality rates were 18.3 and the graduated mortality rates were 18.1.
For males age 75, the crude mortality rates were 27.4 and the graduated mortality rates were 28.4.
For males age 80, the crude mortality rates were 47.7 and the graduated mortality rates were 47.5.
For males age 85, the crude mortality rates were 83.2 and the graduated mortality rates were 83.6.
For males age 90, the crude mortality rates were 149.3 and the graduated mortality rates were 149.7.
For males age 95, the crude mortality rates were 246.2 and the graduated mortality rates were 245.0.
For males age 100, the crude mortality rates were 332.1 and the graduated mortality rates were 355.8.
For males age 105, the crude mortality rates were 366.7 and the graduated mortality rates were 474.4.
For males age 110, the graduated mortality rates were 583.3.
For males age 115, the graduated mortality rates were 664.6.
For males age 120, the graduated mortality rates were 700.0.
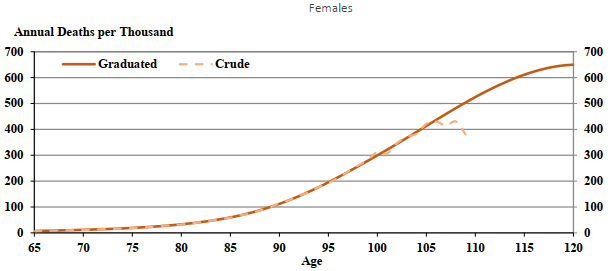
Chart Description
For females age 65, the crude mortality rates were 7.1 and the graduated mortality rates were 7.2.
For females age 70, the crude mortality rates were 11.4 and the graduated mortality rates were 11.7.
For females age 75, the crude mortality rates were 18.9 and the graduated mortality rates were 19.0.
For females age 80, the crude mortality rates were 32.6 and the graduated mortality rates were 33.0.
For females age 85, the crude mortality rates were 59.0 and the graduated mortality rates were 59.8.
For females age 90, the crude mortality rates were 114.2 and the graduated mortality rates were 112.0.
For females age 95, the crude mortality rates were 192.8 and the graduated mortality rates were 195.4.
For females age 100, the crude mortality rates were 312.5 and the graduated mortality rates were 299.7.
For females age 105, the crude mortality rates were 421.2 and the graduated mortality rates were 413.3.
For females age 110, the graduated mortality rates were 524.8.
For females age 115, the graduated mortality rates were 611.3.
For females age 120, the graduated mortality rates were 650.0.
- Chart 4 footnote *
-
The highest ages for which the crude mortality rates were judged to be statistically credible are age 97 for males and 101 for females
3.3 Comparison of OAS Beneficiary and Population Mortality (2019)
Since OAS beneficiaries represent a substantial portion of the Canadian population aged 65 and over, the mortality rates of OAS beneficiaries were compared to those of the population of Canada for the year 2019. The year 2019 was the most current year for which data on population mortality from Statistics Canada Life Tables (CLT) were available at the time of this study. For comparison purposes, mortality rates for year 2019 from the Canada Life Tables were extended to age 120.
Table 7 and Chart 5 show the ratios of OAS beneficiary to population mortality rates by age and sex for the year 2019. For both sexes in 2019, OAS beneficiary mortality rates are higher than for the population at most ages. In 2019, the mortality rates of male and female OAS beneficiaries at age 65 are 11% and 5% higher, respectively, relative to corresponding mortality rates in the Canadian population. An increase in the ratios at ages 65 to 69 can be observed since 2013. These higher ratios may be the result of the implementation of the OAS deferral provision which took effect in 2012.Those more apt to defer are those with better financial situations (i.e. married and not eligible for the GIS). This results in a population of beneficiaries at ages 65 to 69 that is more skewed towards singles and those receiving GIS, both groups having higher mortality than the general population.
Between ages 75 and 85, the mortality rates of OAS beneficiaries are about at the same level as those of the Canadian population. Beyond age 85, the OAS beneficiary mortality rates are slightly higher that the general population rates. At age 100, the mortality rates of male and female OAS beneficiaries is 5% and 2% higher, respectively, than the corresponding rates of the Canadian population.
An important reason that may explain the difference between the OAS and population mortality rates is the differences between the population census survey data used in constructing Canada Life Tables and the OAS administrative data used for this study.
| Age | Males | Females | ||||
|---|---|---|---|---|---|---|
| Annual Deaths Per Thousand | Ratio OAS to Vital Statistics | Annual Deaths Per Thousand | Ratio OAS to Vital Statistics | |||
| OAS | PopulationTable 7 Footnote * | OAS | PopulationTable 7 Footnote * | |||
| 65 | 12.0 | 10.8 | 1.11 | 7.2 | 6.9 | 1.05 |
| 70 | 18.1 | 17.5 | 1.04 | 11.7 | 11.3 | 1.03 |
| 75 | 28.4 | 28.7 | 0.99 | 19.0 | 19.1 | 1.00 |
| 80 | 47.5 | 47.8 | 0.99 | 33.0 | 33.1 | 1.00 |
| 85 | 83.6 | 81.1 | 1.03 | 59.8 | 58.9 | 1.01 |
| 90 | 149.7 | 139.7 | 1.07 | 112.0 | 107.5 | 1.04 |
| 95 | 245.0 | 230.9 | 1.06 | 195.4 | 188.5 | 1.04 |
| 100 | 355.8 | 337.8 | 1.05 | 299.7 | 294.5 | 1.02 |
Table 7 Footnote
|
||||||
Chart 5 - OAS Beneficiary to Population Mortality Ratios (2019)
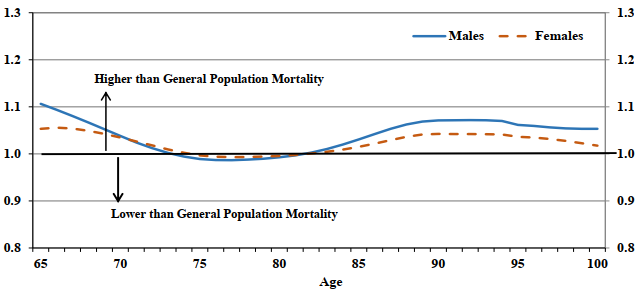
Chart Description
Line chart showing the male and female OAS beneficiaries to the general population mortality ratio in 2019. The Y axis shows the OAS beneficiaries to the general population mortality ratio and the X axis shows the age.
At age 65, the OAS beneficiaries to population mortality ratio is 1.11 for males and it is 1.05 for females.
At age 70, the OAS beneficiaries to population mortality ratio is 1.04 for males and it is 1.03 for females.
At age 75, the OAS beneficiaries to population mortality ratio is 0.99 for males and it is 1.00 for females.
At age 80, the OAS beneficiaries to population mortality ratio is 0.99 for males and it is 1.00 for females.
At age 85, the OAS beneficiaries to population mortality ratio is 1.03 for males and it is 1.01 for females.
At age 90, the OAS beneficiaries to population mortality ratio is 1.07 for males and it is 1.04 for females.
At age 95, the OAS beneficiaries to population mortality ratio is 1.06 for males and it is 1.04 for females.
At age 100, the OAS beneficiaries to population mortality ratio is 1.05 for males and it is 1.02 for females.
3.4 Life Expectancies
3.4.1 Evolution of OAS Beneficiary Life Expectancies
Table 8 shows life expectancies for OAS beneficiaries for the year 2019. The gap in life expectancies between female and male OAS beneficiaries reduces as age increases. At age 65, the gap between female and male life expectancies is 2.8 years, while the difference reduces to 0.9 of a year at age 90.
| Age | Males | Females | Difference (Females – Males) |
|---|---|---|---|
| 65 | 19.4 | 22.2 | 2.8 |
| 70 | 15.7 | 18.1 | 2.4 |
| 75 | 12.2 | 14.3 | 2.1 |
| 80 | 9.0 | 10.7 | 1.7 |
| 85 | 6.4 | 7.7 | 1.3 |
| 90 | 4.3 | 5.3 | 1.0 |
Table 9 shows, for both sexes, the evolution over the period 1999 to 2019 of life expectancies at age 65 of OAS beneficiaries and the general population. In general, OAS beneficiaries experience slightly higher mortality than the general population. In 2019, life expectancies at age 65 for the Canadian population are 19.6 years for males and 22.4 years for females. These population life expectancies are 0.2 of a year higher than the life expectancies of OAS beneficiaries at age 65, which are 19.4 years for males and 22.2 years for females. As discussed above, these differences may be explained by differences in data used.
| Year | Life Expectancy at Age 65 | ||||||
|---|---|---|---|---|---|---|---|
| Males | Females | Difference OAS Females - Males | |||||
| OAS | Population | Difference (Pop - OAS) |
OAS | Population | Difference (Pop - OAS) |
||
| 1999 | 16.1 | 16.4 | 0.3 | 19.9 | 20.1 | 0.2 | 3.8 |
| 2000 | 16.5 | 16.7 | 0.2 | 20.1 | 20.2 | 0.1 | 3.6 |
| 2001 | 16.7 | 17.0 | 0.3 | 20.3 | 20.4 | 0.1 | 3.6 |
| 2002 | 16.9 | 17.1 | 0.2 | 20.3 | 20.4 | 0.1 | 3.4 |
| 2003 | 17.0 | 17.3 | 0.3 | 20.5 | 20.6 | 0.1 | 3.5 |
| 2004 | 17.3 | 17.5 | 0.2 | 20.6 | 20.7 | 0.1 | 3.3 |
| 2005 | 17.5 | 17.7 | 0.2 | 20.7 | 20.8 | 0.1 | 3.2 |
| 2006 | 17.8 | 18.0 | 0.2 | 21.0 | 21.1 | 0.1 | 3.2 |
| 2007 | 17.8 | 18.0 | 0.2 | 21.0 | 21.1 | 0.1 | 3.2 |
| 2008 | 18.0 | 18.1 | 0.1 | 21.1 | 21.3 | 0.2 | 3.1 |
| 2009 | 18.2 | 18.4 | 0.2 | 21.4 | 21.5 | 0.1 | 3.2 |
| 2010 | 18.5 | 18.7 | 0.2 | 21.4 | 21.6 | 0.2 | 2.9 |
| 2011 | 18.6 | 18.8 | 0.2 | 21.5 | 21.8 | 0.3 | 2.9 |
| 2012 | 18.8 | 19.0 | 0.2 | 21.7 | 22.0 | 0.3 | 2.9 |
| 2013 | 18.9 | 19.1 | 0.2 | 21.8 | 21.9 | 0.1 | 2.9 |
| 2014 | 18.9 | 19.1 | 0.2 | 21.9 | 22.0 | 0.1 | 3.0 |
| 2015 | 19.0 | 19.2 | 0.2 | 21.8 | 21.9 | 0.1 | 2.8 |
| 2016 | 19.2 | 19.4 | 0.2 | 22.1 | 22.2 | 0.1 | 2.9 |
| 2017 | 19.1 | 19.4 | 0.3 | 22.0 | 22.1 | 0.1 | 2.9 |
| 2018 | 19.2 | 19.5 | 0.3 | 22.0 | 22.1 | 0.1 | 2.8 |
| 2019 | 19.4 | 19.6 | 0.2 | 22.2 | 22.4 | 0.2 | 2.8 |
The evolution of life expectancies of OAS beneficiaries for both sexes at age 65 from 1999 to 2019 is also shown in Chart 6. In 2019, the life expectancies at age 65 for OAS beneficiaries are 19.4 years for males and 22.2 years for females. These are 3.3 years and 2.3 years, respectively, higher than the corresponding life expectancies observed in 1999. However, the pace of increase in life expectancy at age 65 has slowed down over the last decade. Between 1999 and 2009, the average overall increase, for both sexes combined, was 2 months per year (from 18.0 to 19.8 years) which compares to a lower average increase over the most recent period 2009 to 2019 of 1 month per year (from 19.8 to 20.8 years). This recent slowdown in mortality improvementsFootnote 2 is analyzed further in Section VII of this study.
The gap in life expectancies between females and males has decreased from 3.8 years in 1999 to 2.8 years in 2019, with most of the decrease attributed to years prior to 2009 when males have experienced much higher mortality improvements than females.
Chart 6 - Evolution of OAS Beneficiary Life Expectancies at Age 65 (1999-2019)
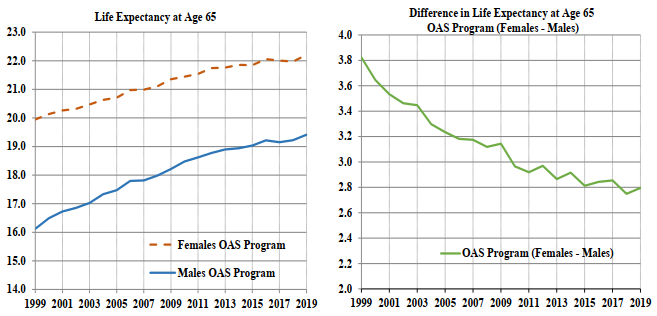
Chart Description
Two line charts. Chart 6 (i) (left chart) showing the life expectancy at age 65 for males and females. The Y axis shows the life expectancy at age 65 and the X axis shows the age. Chart 6 (ii) (right chart) showing the difference in life expectancy at age 65 between females and males. The Y axis shows the difference in life expectancy at age 65 between females and males and the X axis shows the year.
Chart 6(i)
For year 1999, the life expectancy at age 65, was 16.1 years for males and 19.9 years for females.
For year 2004, the life expectancy at age 65, was 17.3 years for males and 20.6 years for females.
For year 2009, the life expectancy at age 65, was 18.2 years for males and 21.4 years for females.
For year 2014, the life expectancy at age 65, was 18.9 years for males and 21.9 years for females.
For year 2019, the life expectancy at age 65, was 19.4 years for males and 22.2 years for females.
Chart 6(ii)
For year 1999, the difference in life expectancy at age 65 between females and males was 3.8 years.
For year 2004, the difference in life expectancy at age 65 between females and males was 3.3 years.
For year 2009, the difference in life expectancy at age 65 between females and males was 3.2 years.
For year 2014, the difference in life expectancy at age 65 between females and males was 3.0 years.
For year 2019, the difference in life expectancy at age 65 between females and males was 2.8 years.
4. OAS Beneficiary Mortality by Type of Benefit
4.1 Introduction
This section presents the results of analysis on the mortality of OAS program beneficiaries by type of benefit defined by whether an OAS pensioner receives or not the income-tested GIS benefit.
4.2 Mortality Experience by Type of Benefit (2019)
4.2.1 Beneficiaries by Type of Benefit
The number of beneficiaries by age, sex, and type of benefit received in 2019 is presented in Table 10. In aggregate for all age groups, in 2019, the proportion of male beneficiaries receiving the GIS was 29% compared to 36% of female beneficiaries. This is consistent with the fact that females have on average lower income than males. The differential in the proportion of male and female beneficiaries receiving the GIS increases at the older ages. For the age group 65 to 69, the proportion of males with the GIS is 25% compared to 27% for females, while for the age group 90 to 94, the corresponding proportions are 35% and 52%.
| Age Group | Males | Females | ||||
|---|---|---|---|---|---|---|
| Without GIS | With GIS | Proportion with GIS | Without GIS | With GIS | Proportion with GIS | |
| 65-69 | 682,829 | 226,079 | 25% | 726,171 | 266,795 | 27% |
| 70-74 | 580,581 | 223,717 | 28% | 588,328 | 289,607 | 33% |
| 75-79 | 376,406 | 164,687 | 30% | 382,273 | 235,824 | 38% |
| 80-84 | 228,525 | 117,144 | 34% | 245,645 | 192,453 | 44% |
| 85-89 | 132,478 | 71,262 | 35% | 159,541 | 144,762 | 48% |
| 90-94 | 51,493 | 28,311 | 35% | 78,468 | 83,499 | 52% |
| 95-99 | 11,034 | 6,181 | 36% | 24,096 | 30,134 | 56% |
| 100+ | 877 | 759 | 46% | 2,781 | 5,430 | 66% |
| Total | 2,064,223 | 838,140 | 29% | 2,207,303 | 1,248,504 | 36% |
Tables 42 to 48 in the Annex show various statistics related to the OAS program by individual age, sex, and type of benefit.
4.2.1.1 Deaths by Type of Benefit
Table 11 presents the number of deaths of OAS beneficiaries by age, sex, and type of benefit in 2019. In aggregate for all age groups, the proportion of males with the GIS at death is 39% compared to 52% for females. This reflects that on average females live longer than males and that an increasing proportion of females receive the GIS as age advances. For the age group 65 to 69, the proportion of males who were receiving the GIS at death is 40% compared to 43% for females. For the age group 90 to 94, the corresponding proportions are 37% and 54%.
| Age Group | Males | Females | |||||
|---|---|---|---|---|---|---|---|
| Without GIS | With GIS | Proportion with GIS | Without GIS | With GIS | Proportion with GIS | ||
| 65-69 | 7,925 | 5,262 | 40% | 5,057 | 3,839 | 43% | |
| 70-74 | 10,175 | 7,144 | 41% | 6,556 | 5,751 | 47% | |
| 75-79 | 10,986 | 7,654 | 41% | 7,384 | 7,153 | 49% | |
| 80-84 | 12,433 | 8,350 | 40% | 9,151 | 9,449 | 51% | |
| 85-89 | 13,868 | 8,422 | 38% | 11,407 | 12,622 | 53% | |
| 90-94 | 9,676 | 5,684 | 37% | 11,198 | 13,022 | 54% | |
| 95-99 | 3,546 | 1,932 | 35% | 5,858 | 7,774 | 57% | |
| 100+ | 408 | 346 | 46% | 1,126 | 2,212 | 66% | |
| Total | 69,017 | 44,794 | 39% | 57,737 | 61,822 | 52% | |
4.2.1.2 Exposures by Type of Benefit
Table 12 shows that exposures by age group, sex, and type of benefit are consistent with the distribution of beneficiaries shown in Table 10. In general, female exposures exceed that of males for each type of benefit because of females’ greater longevity. The age structure of the amount of exposures by type of OAS benefit received in 2019 for each sex is shown in Chart 7.
| Age Group | Males | Females | |||||
|---|---|---|---|---|---|---|---|
| Without GIS | With GIS | Proportion with GIS | Without GIS | With GIS | Proportion with GIS | ||
| 65-69 | 694,596 | 229,783 | 25% | 725,629 | 272,376 | 27% | |
| 70-74 | 572,163 | 221,851 | 28% | 575,665 | 288,181 | 33% | |
| 75-79 | 368,049 | 164,095 | 31% | 373,577 | 235,743 | 39% | |
| 80-84 | 225,411 | 116,998 | 34% | 242,322 | 193,060 | 44% | |
| 85-89 | 131,457 | 71,173 | 35% | 158,406 | 145,741 | 48% | |
| 90-94 | 50,757 | 27,988 | 36% | 78,072 | 84,194 | 52% | |
| 95-99 | 10,865 | 6,116 | 36% | 23,626 | 30,027 | 56% | |
| 100+ | 869 | 740 | 46% | 2,761 | 5,369 | 66% | |
| Total | 2,054,167 | 838,743 | 29% | 2,180,057 | 1,254,692 | 37% | |
Chart 7 - Exposures by Type of Benefit (2019)
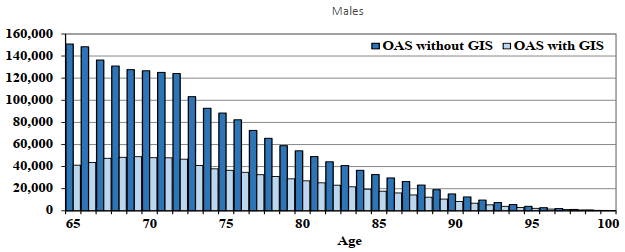
Chart Description
Two vertical bar charts. Chart 7 (i) (Top chart) is for males and Chart 7 (ii) (Bottom chart) is for females. Both charts show the number of exposures by type of benefit by age in 2019. The Y axis shows the number of exposures and the X axis shows the age.
For age 65, the number of exposures was 150,921 for those OAS without GIS and 41,264 for those OAS with GIS.
For age 70, the number of exposures was 126,699 for those OAS without GIS and 48,131 for those OAS with GIS.
For age 75, the number of exposures was 88,430 for those OAS without GIS and 36,615 for those OAS with GIS.
For age 80, the number of exposures was 54,334 for those OAS without GIS and 27,199 for those OAS with GIS.
For age 85, the number of exposures was 32,784 for those OAS without GIS and 17,762 for those OAS with GIS.
For age 90, the number of exposures was 15,304 for those OAS without GIS and 8,465 for those OAS with GIS.
For age 95, the number of exposures was 4,053 for those OAS without GIS and 2,231 for those OAS with GIS.
For age 100, the number of exposures was 377 for those OAS without GIS and 268 for those OAS with GIS.
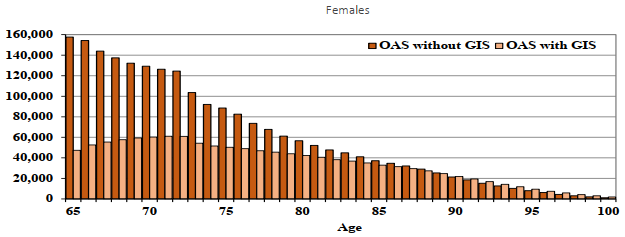
Chart Description
For age 65, the number of exposures was 157,694 for those OAS without GIS and 47,372 for those OAS with GIS.
For age 70, the number of exposures was 129,224 for those OAS without GIS and 60,323 for those OAS with GIS.
For age 75, the number of exposures was 88,557 for those OAS without GIS and 50,350 for those OAS with GIS.
For age 80, the number of exposures was 56,667 for those OAS without GIS and 42,284 for those OAS with GIS.
For age 85, the number of exposures was 37,244 for those OAS without GIS and 32,898 for those OAS with GIS.
For age 90, the number of exposures was 21,318 for those OAS without GIS and 21,804 for those OAS with GIS.
For age 95, the number of exposures was 8,059 for those OAS without GIS and 9,493 for those OAS with GIS.
For age 100, the number of exposures was 1,104 for those OAS without GIS and 1,928 for those OAS with GIS.
4.2.1.3 Graduated Mortality Rates by Type of Benefit
A comparison of mortality rates by type of benefit received is shown in Table 13 and Chart 8. Those beneficiaries not in receipt of the GIS experience lower mortality compared to overall OAS beneficiaries, while those who receive the GIS experience higher mortality. In 2019, GIS beneficiaries aged 65 experienced mortality that is 67% higher than the overall OAS population and about twice the level of those not receiving the GIS. In comparison, beneficiaries not receiving the experienced mortality that is about 18% lower than the overall OAS population. In both cases however, there is convergence to the overall OAS program mortality as age increases.
| Age | Males | |||||
|---|---|---|---|---|---|---|
| Overall OAS (annual deaths per thousand) |
Without GIS (annual deaths per thousand) |
Ratio without GIS to Overall | With GIS (annual deaths per thousand) |
Ratio with GIS to Overall |
Ratio With to Without GIS |
|
| 65 | 12.0 | 9.8 | 0.82 | 20.0 | 1.67 | 2.04 |
| 70 | 18.1 | 14.6 | 0.81 | 27.4 | 1.51 | 1.87 |
| 75 | 28.4 | 23.8 | 0.84 | 39.4 | 1.39 | 1.66 |
| 80 | 47.5 | 42.2 | 0.89 | 58.0 | 1.22 | 1.37 |
| 85 | 83.6 | 78.9 | 0.94 | 92.2 | 1.10 | 1.17 |
| 90 | 149.7 | 146.2 | 0.98 | 155.6 | 1.04 | 1.06 |
| 95 | 245.0 | 244.0 | 1.00 | 247.6 | 1.01 | 1.01 |
| 100 | 355.8 | 355.8 | 1.00 | 355.8 | 1.00 | 1.00 |
| Age | Females | |||||
| Overall OAS (annual deaths per thousand) |
Without GIS (annual deaths per thousand) |
Ratio without GIS to Overall | With GIS (annual deaths per thousand) |
Ratio with GIS to Overall |
Ratio With to Without GIS |
|
| 65 | 7.2 | 5.9 | 0.81 | 11.9 | 1.64 | 2.02 |
| 70 | 11.7 | 9.2 | 0.79 | 17.0 | 1.45 | 1.84 |
| 75 | 19.0 | 15.6 | 0.82 | 25.1 | 1.32 | 1.61 |
| 80 | 33.0 | 28.5 | 0.86 | 39.0 | 1.18 | 1.37 |
| 85 | 59.8 | 54.2 | 0.91 | 66.0 | 1.10 | 1.22 |
| 90 | 112.0 | 106.6 | 0.95 | 117.6 | 1.05 | 1.10 |
| 95 | 195.4 | 194.2 | 0.99 | 195.9 | 1.00 | 1.01 |
| 100 | 299.7 | 299.7 | 1.00 | 300.0 | 1.00 | 1.00 |
Chart 8 - OAS Beneficiary Mortality Ratios by Type of Benefit (2019)
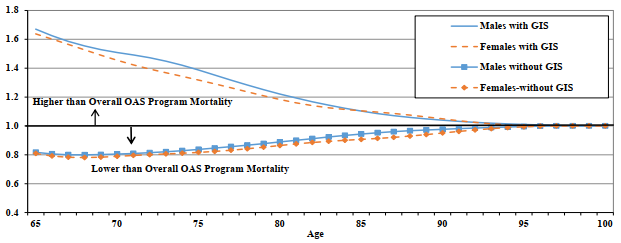
Chart Description
Line chart showing the male and female OAS mortality ratios by type of benefit for year 2019. The Y axis shows the mortality ratio by type of benefit relative to the overall OAS program mortality and the X axis shows the age.
At age 65, male mortality ratio for those with OAS without GIS is 0.82 and the male mortality ratio for those OAS with GIS is 1.67. In comparison, female mortality ratio for those with OAS without GIS is 0.81 and the male mortality ratio for those OAS with GIS is 1.64.
At age 70, male mortality ratio for those with OAS without GIS is 0.81 and the male mortality ratio for those OAS with GIS is 1.51. In comparison, female mortality ratio for those with OAS without GIS is 0.79 and the male mortality ratio for those OAS with GIS is 1.45.
At age 75, male mortality ratio for those with OAS without GIS is 0.84 and the male mortality ratio for those OAS with GIS is 1.39. In comparison, female mortality ratio for those with OAS without GIS is 0.82 and the male mortality ratio for those OAS with GIS is 1.32.
At age 80, male mortality ratio for those with OAS without GIS is 0.89 and the male mortality ratio for those OAS with GIS is 1.22. In comparison, female mortality ratio for those with OAS without GIS is 0.86 and the male mortality ratio for those OAS with GIS is 1.18.
At age 85, male mortality ratio for those with OAS without GIS is 0.94 and the male mortality ratio for those OAS with GIS is 1.10. In comparison, female mortality ratio for those with OAS without GIS is 0.91 and the male mortality ratio for those OAS with GIS is 1.10.
At age 90, male mortality ratio for those with OAS without GIS is 0.98 and the male mortality ratio for those OAS with GIS is 1.04. In comparison, female mortality ratio for those with OAS without GIS is 0.95 and the male mortality ratio for those OAS with GIS is 1.05.
At age 95, male mortality ratio for those with OAS without GIS is 1.00 and the male mortality ratio for those OAS with GIS is 1.01. In comparison, female mortality ratio for those with OAS without GIS is 0.99 and the male mortality ratio for those OAS with GIS is 1.00.
At age 100, male mortality ratio for those with OAS without GIS is 1.00 and the male mortality ratio for those OAS with GIS is 1.00. In comparison, female mortality ratio for those with OAS without GIS is 1.00 and the male mortality ratio for those OAS with GIS is 1.00.
4.3 Life Expectancies by Type of Benefit
4.3.1 Comparison of Life Expectancies by Age, Sex, and Type of Benefit (2019)
Table 14 shows life expectancies for beneficiaries by age, sex, and type of benefit received. In 2019, the life expectancy at age 65 for males not receiving the GIS was 20.3 years compared to 17.4 years for those receiving the GIS. The corresponding life expectancies at age 65 for females are 23.2 years and 20.7 years. For both sexes, the difference in life expectancies between those without and with the GIS reduces as age increases.
| Age | Males | Females | ||||||
|---|---|---|---|---|---|---|---|---|
| Overall OAS | Without GIS | With GIS | Difference | Overall OAS | Without GIS | With GIS | Difference | |
| 65 | 19.4 | 20.3 | 17.4 | 2.9 | 22.2 | 23.2 | 20.7 | 2.5 |
| 70 | 15.7 | 16.4 | 14.2 | 2.2 | 18.1 | 18.9 | 17.0 | 1.9 |
| 75 | 12.2 | 12.7 | 11.2 | 1.5 | 14.3 | 14.9 | 13.5 | 1.4 |
| 80 | 9.0 | 9.3 | 8.5 | 0.8 | 10.7 | 11.1 | 10.3 | 0.8 |
| 85 | 6.4 | 6.5 | 6.2 | 0.3 | 7.7 | 7.9 | 7.5 | 0.4 |
| 90 | 4.3 | 4.4 | 4.2 | 0.2 | 5.3 | 5.3 | 5.2 | 0.1 |
4.3.2 Evolution of Life Expectancies by Type of Benefit
Table 15 and Chart 9 show the evolution of life expectancies at age 65 by type of benefit over the period 1999 to 2019. Over the period, low-income male beneficiaries (those receiving the GIS) have seen their life expectancy increase by about 2.9 years, while those with higher-income (not receiving the GIS) saw their life expectancy increase by 3.4 years. For females, the corresponding increases in life expectancy are about 1.9 years for those receiving the GIS compared to 2.4 years for those not receiving the benefit.
As a result, the difference in life expectancies at age 65 between beneficiaries not receiving the GIS and those in receipt of the benefit has shown an overall small, gradual increase over the period for both sexes. For males, the differential between those without and with the GIS increased overall from about 2.4 years in 1999 to 2.9 years in 2019. For females, the corresponding differential increased overall from about 2.0 to 2.5 years.
| Year | Males | Females | ||||||
|---|---|---|---|---|---|---|---|---|
| Overall OAS | Without GIS | With GIS | Difference (Without – With GIS) |
Overall OAS | Without GIS | With GIS | Difference (Without – With GIS) |
|
| 1999 | 16.1 | 16.9 | 14.5 | 2.4 | 19.9 | 20.8 | 18.8 | 2.0 |
| 2000 | 16.5 | 17.3 | 14.8 | 2.5 | 20.1 | 21.0 | 18.9 | 2.1 |
| 2001 | 16.7 | 17.4 | 15.2 | 2.2 | 20.3 | 21.1 | 19.1 | 2.0 |
| 2002 | 16.9 | 17.6 | 15.3 | 2.3 | 20.3 | 21.1 | 19.3 | 1.8 |
| 2003 | 17.0 | 17.7 | 15.5 | 2.2 | 20.5 | 21.3 | 19.4 | 1.9 |
| 2004 | 17.3 | 18.1 | 15.7 | 2.4 | 20.6 | 21.5 | 19.5 | 2.0 |
| 2005 | 17.5 | 18.2 | 15.9 | 2.3 | 20.7 | 21.6 | 19.6 | 2.0 |
| 2006 | 17.8 | 18.5 | 16.3 | 2.2 | 21.0 | 21.8 | 19.9 | 1.9 |
| 2007 | 17.8 | 18.6 | 16.2 | 2.4 | 21.0 | 21.8 | 19.9 | 1.9 |
| 2008 | 18.0 | 18.8 | 16.2 | 2.6 | 21.1 | 22.0 | 19.9 | 2.1 |
| 2009 | 18.2 | 19.0 | 16.5 | 2.5 | 21.4 | 22.2 | 20.1 | 2.1 |
| 2010 | 18.5 | 19.2 | 16.8 | 2.4 | 21.4 | 22.3 | 20.1 | 2.2 |
| 2011 | 18.6 | 19.5 | 16.8 | 2.7 | 21.5 | 22.4 | 20.3 | 2.1 |
| 2012 | 18.8 | 19.6 | 16.9 | 2.7 | 21.7 | 22.6 | 20.4 | 2.2 |
| 2013 | 18.9 | 19.7 | 17.1 | 2.6 | 21.8 | 22.6 | 20.4 | 2.2 |
| 2014 | 18.9 | 19.8 | 17.0 | 2.8 | 21.9 | 22.7 | 20.5 | 2.2 |
| 2015 | 19.0 | 19.8 | 17.2 | 2.6 | 21.8 | 22.6 | 20.6 | 2.0 |
| 2016 | 19.2 | 20.1 | 17.3 | 2.8 | 22.1 | 22.9 | 20.7 | 2.2 |
| 2017 | 19.1 | 20.0 | 17.3 | 2.7 | 22.0 | 22.9 | 20.6 | 2.3 |
| 2018 | 19.2 | 20.1 | 17.3 | 2.8 | 22.0 | 22.9 | 20.5 | 2.4 |
| 2019 | 19.4 | 20.3 | 17.4 | 2.9 | 22.2 | 23.2 | 20.7 | 2.5 |
Chart 9 - Evolution of Life Expectancies at Age 65 by Type of Benefit (1999-2019)
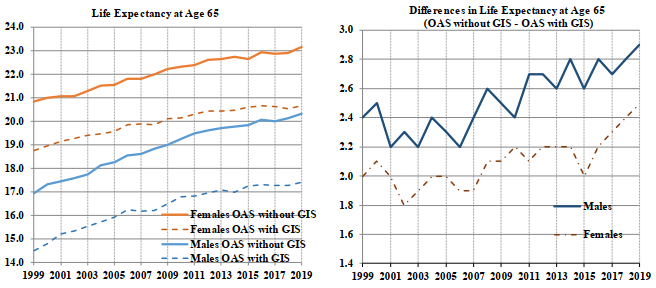
Chart Description
Two line charts. Chart 9(i) (left chart) showing the life expectancy at age 65 for males and females by type of benefit. The Y axis shows the life expectancy at age 65 and the X axis shows the age. Chart 9(ii) (right chart), where the Y axis shows the difference in life expectancy at age 65 between females and males by type of benefit and the X axis shows the year.
Chart 9(i)
For year 1999, the males’ life expectancy at age 65 for OAS beneficiaries without GIS was 16.9 years and 14.5 years for OAS beneficiaries with GIS. The females’ life expectancy at age 65 for OAS beneficiaries without GIS was 20.8 years and 18.8 years for OAS beneficiaries with GIS.
For year 2004, the males’ life expectancy at age 65 for OAS beneficiaries without GIS was 18.1 years and 15.7 years for OAS beneficiaries with GIS. The females’ life expectancy at age 65 for OAS beneficiaries without GIS was 21.5 years and 19.5 years for OAS beneficiaries with GIS.
For year 2009, the males’ life expectancy at age 65 for OAS beneficiaries without GIS was 19.0 years and 16.5 years for OAS beneficiaries with GIS. The females’ life expectancy at age 65 for OAS beneficiaries without GIS was 22.2 years and 20.1 years for OAS beneficiaries with GIS.
For year 2014, the males’ life expectancy at age 65 for OAS beneficiaries without GIS was 19.8 years and 17.0 years for OAS beneficiaries with GIS. The females’ life expectancy at age 65 for OAS beneficiaries without GIS was 22.7 years and 20.5 years for OAS beneficiaries with GIS.
For year 2019, the males’ life expectancy at age 65 for OAS beneficiaries without GIS was 20.3 years and 17.4 years for OAS beneficiaries with GIS. The females’ life expectancy at age 65 for OAS beneficiaries without GIS was 23.2 years and 20.7 years for OAS beneficiaries with GIS.
Chart 9(ii)
For year 1999, the difference in males’ life expectancy at age 65 for OAS beneficiaries without GIS and OAS beneficiaries with GIS was 2.4 years. The difference in females’ life expectancy at age 65 for OAS beneficiaries without GIS and OAS beneficiaries with GIS was 2.0 years.
For year 2004, the difference in males’ life expectancy at age 65 for OAS beneficiaries without GIS and OAS beneficiaries with GIS was 2.4 years. The difference in females’ life expectancy at age 65 for OAS beneficiaries without GIS and OAS beneficiaries with GIS was 2.0 years.
For year 2009, the difference in males’ life expectancy at age 65 for OAS beneficiaries without GIS and OAS beneficiaries with GIS was 2.5 years. The difference in females’ life expectancy at age 65 for OAS beneficiaries without GIS and OAS beneficiaries with GIS was 2.1 years.
For year 2014, the difference in males’ life expectancy at age 65 for OAS beneficiaries without GIS and OAS beneficiaries with GIS was 2.8 years. The difference in females’ life expectancy at age 65 for OAS beneficiaries without GIS and OAS beneficiaries with GIS was 2.2 years.
For year 2019, the difference in males’ life expectancy at age 65 for OAS beneficiaries without GIS and OAS beneficiaries with GIS was 2.9 years. The difference in females’ life expectancy at age 65 for OAS beneficiaries without GIS and OAS beneficiaries with GIS was 2.5 years.
5. OAS Beneficiary Mortality by Marital Status and Type of Benefit
5.1 Introduction
This section presents the results of analysis on the mortality of OAS program beneficiaries by marital status and type of benefit.
5.2 Mortality Experience by Marital Status and Type of Benefit for Year 2019
5.2.1 Beneficiaries by Marital Status and Type of Benefit
The number of beneficiaries by age, sex, marital status, and type of benefit in 2019 is presented in Table 16. In aggregate for all age groups, the proportion of male beneficiaries without the GIS who are married is 77% compared to 56% for those with GIS benefits. Overall, the proportion of female beneficiaries without the GIS who are married is 59% compared to 30% for those with GIS benefits.
For all age groups and both sexes, those with the GIS are more likely to be single than those without the GIS, especially at the younger ages. As well, for all age groups and both benefit types, females are more likely to be single compared to males, especially at the older ages due to females’ greater longevity.
| Males | ||||||||||
|---|---|---|---|---|---|---|---|---|---|---|
| Age Group | Overall OAS | Without GIS | With GIS | |||||||
| Married | Single | Married | Single | %Married | %Single | Married | Single | %Married | %Single | |
| 65-69 | 645,595 | 263,313 | 530,204 | 152,625 | 78% | 22% | 115,391 | 110,688 | 51% | 49% |
| 70-74 | 588,650 | 215,648 | 464,227 | 116,354 | 80% | 20% | 124,423 | 99,294 | 56% | 44% |
| 75-79 | 395,828 | 145,265 | 297,648 | 78,758 | 79% | 21% | 98,180 | 66,507 | 60% | 40% |
| 80-84 | 242,807 | 102,862 | 171,052 | 57,473 | 75% | 25% | 71,755 | 45,389 | 61% | 39% |
| 85-89 | 127,986 | 75,754 | 87,176 | 45,302 | 66% | 34% | 40,810 | 30,452 | 57% | 43% |
| 90-94 | 40,199 | 39,605 | 26,661 | 24,832 | 52% | 48% | 13,538 | 14,773 | 48% | 52% |
| 95-99 | 6,122 | 11,093 | 3,989 | 7,045 | 36% | 64% | 2,133 | 4,048 | 35% | 65% |
| 100+ | 362 | 1,274 | 204 | 673 | 23% | 77% | 158 | 601 | 21% | 79% |
| Total | 2,047,549 | 854,814 | 1,581,161 | 483,062 | 77% | 23% | 466,388 | 371,752 | 56% | 44% |
| Females | ||||||||||
| Age Group | Overall OAS | Without GIS | With GIS | |||||||
| Married | Single | Married | Single | %Married | %Single | Married | Single | %Married | %Single | |
| 65-69 | 622,085 | 370,881 | 512,380 | 213,791 | 71% | 29% | 109,705 | 157,090 | 41% | 59% |
| 70-74 | 507,407 | 370,528 | 395,112 | 193,216 | 67% | 33% | 112,295 | 177,312 | 39% | 61% |
| 75-79 | 304,267 | 313,830 | 224,904 | 157,369 | 59% | 41% | 79,363 | 156,461 | 34% | 66% |
| 80-84 | 161,442 | 276,656 | 112,468 | 133,177 | 46% | 54% | 48,974 | 143,479 | 25% | 75% |
| 85-89 | 68,518 | 235,785 | 46,777 | 112,764 | 29% | 71% | 21,741 | 123,021 | 15% | 85% |
| 90-94 | 17,080 | 144,887 | 11,593 | 66,875 | 15% | 85% | 5,487 | 78,012 | 7% | 93% |
| 95-99 | 2,111 | 52,119 | 1,489 | 22,607 | 6% | 94% | 622 | 29,512 | 2% | 98% |
| 100+ | 98 | 8,113 | 70 | 2,711 | 3% | 97% | 28 | 5,402 | 1% | 99% |
| Total | 1,683,008 | 1,772,799 | 1,304,793 | 902,510 | 59% | 41% | 378,215 | 870,289 | 30% | 70% |
Tables 49 to 64 in the Annex show various statistics related to the OAS program by individual age, sex, marital status, and type of benefit.
5.2.2 Deaths by Marital Status and Type of Benefit
Table 17 shows that as females live longer than males, the probability of being single at death is higher for females than males. There is also variation by age group, marital status, and type of benefit as to being single at death. For example, for the age group 85 to 89, 41% of males without the GIS were single at death compared to 51% of those in receipt of the GIS. For females in the same age group, 77% without the GIS were single at death, compared to 88% of those with the GIS.
| Males | ||||||||||
|---|---|---|---|---|---|---|---|---|---|---|
| Age Group | Overall OAS | Without GIS | With GIS | |||||||
| Married | Single | Married | Single | %Married | %Single | Married | Single | %Married | %Single | |
| 65-69 | 6,695 | 6,492 | 5,058 | 2,867 | 64% | 36% | 1,637 | 3,625 | 31% | 69% |
| 70-74 | 9,870 | 7,449 | 7,106 | 3,069 | 70% | 30% | 2,764 | 4,380 | 39% | 61% |
| 75-79 | 11,255 | 7,385 | 7,609 | 3,377 | 69% | 31% | 3,646 | 4,008 | 48% | 52% |
| 80-84 | 12,690 | 8,093 | 8,367 | 4,066 | 67% | 33% | 4,323 | 4,027 | 52% | 48% |
| 85-89 | 12,283 | 10,007 | 8,174 | 5,694 | 59% | 41% | 4,109 | 4,313 | 49% | 51% |
| 90-94 | 6,832 | 8,528 | 4,424 | 5,252 | 46% | 54% | 2,408 | 3,276 | 42% | 58% |
| 95-99 | 1,826 | 3,652 | 1,191 | 2,355 | 34% | 66% | 635 | 1,297 | 33% | 67% |
| 100+ | 163 | 591 | 95 | 313 | 23% | 77% | 68 | 278 | 20% | 80% |
| Total | 61,614 | 52,197 | 42,024 | 26,993 | 61% | 39% | 19,590 | 25,204 | 44% | 56% |
| Females | ||||||||||
| Age Group | Overall OAS | Without GIS | With GIS | |||||||
| Married | Single | Married | Single | %Married | %Single | Married | Single | %Married | %Single | |
| 65-69 | 4,169 | 4,727 | 3,064 | 1,993 | 61% | 39% | 1,105 | 2,734 | 29% | 71% |
| 70-74 | 5,437 | 6,870 | 3,853 | 2,703 | 59% | 41% | 1,584 | 4,167 | 28% | 72% |
| 75-79 | 5,465 | 9,072 | 3,632 | 3,752 | 49% | 51% | 1,833 | 5,320 | 26% | 74% |
| 80-84 | 5,311 | 13,289 | 3,347 | 5,804 | 37% | 63% | 1,964 | 7,485 | 21% | 79% |
| 85-89 | 4,229 | 19,800 | 2,679 | 8,728 | 23% | 77% | 1,550 | 11,072 | 12% | 88% |
| 90-94 | 2,097 | 22,123 | 1,381 | 9,817 | 12% | 88% | 716 | 12,306 | 5% | 95% |
| 95-99 | 464 | 13,168 | 301 | 5,557 | 5% | 95% | 163 | 7,611 | 2% | 98% |
| 100+ | 24 | 3,314 | 20 | 1,106 | 2% | 98% | 4 | 2,208 | 0% | 100% |
| Total | 27,196 | 92,363 | 18,277 | 39,460 | 32% | 68% | 8,919 | 52,903 | 14% | 86% |
5.2.3 Exposures by Marital Status and Type of Benefit
Table 18 shows the distributions of the exposures for the year 2019, by age group, sex, marital status, and type of benefit. Again, as females generally live longer than males, the proportion of exposures related to single rather than married beneficiaries is higher for females than for males for both benefit types, especially at the advanced ages. The distributions in Table 18 are consistent with those in Table 16, and as such, the other observations made earlier for Table 16 apply here as well.
| Males | ||||||||||
|---|---|---|---|---|---|---|---|---|---|---|
| Age Group | Overall OAS | Without GIS | With GIS | |||||||
| Married | Single | Married | Single | %Married | %Single | Married | Single | %Married | %Single | |
| 65-69 | 657,959 | 266,421 | 540,429 | 154,168 | 78% | 22% | 117,530 | 112,253 | 51% | 49% |
| 70-74 | 580,260 | 213,754 | 456,924 | 115,240 | 80% | 20% | 123,337 | 98,514 | 56% | 44% |
| 75-79 | 387,636 | 144,508 | 289,712 | 78,336 | 79% | 21% | 97,923 | 66,172 | 60% | 40% |
| 80-84 | 238,240 | 104,168 | 166,973 | 58,438 | 74% | 26% | 71,267 | 45,731 | 61% | 39% |
| 85-89 | 124,871 | 77,760 | 84,855 | 46,603 | 65% | 35% | 40,016 | 31,157 | 56% | 44% |
| 90-94 | 38,473 | 40,272 | 25,432 | 25,324 | 50% | 50% | 13,040 | 14,947 | 47% | 53% |
| 95-99 | 5,870 | 11,110 | 3,826 | 7,039 | 35% | 65% | 2,044 | 4,071 | 33% | 67% |
| 100+ | 344 | 1,265 | 195 | 673 | 23% | 77% | 148 | 592 | 20% | 80% |
| Total | 2,033,652 | 859,258 | 1,568,346 | 485,821 | 76% | 24% | 465,306 | 373,437 | 55% | 45% |
| Females | ||||||||||
| Age Group | Overall OAS | Without GIS | With GIS | |||||||
| Married | Single | Married | Single | %Married | %Single | Married | Single | %Married | %Single | |
| 65-69 | 620,482 | 377,523 | 509,314 | 216,314 | 70% | 30% | 111,168 | 161,208 | 41% | 59% |
| 70-74 | 493,726 | 370,119 | 383,177 | 192,488 | 67% | 33% | 110,550 | 177,631 | 38% | 62% |
| 75-79 | 293,925 | 315,394 | 216,015 | 157,562 | 58% | 42% | 77,910 | 157,833 | 33% | 67% |
| 80-84 | 154,669 | 280,712 | 107,287 | 135,035 | 44% | 56% | 47,382 | 145,678 | 25% | 75% |
| 85-89 | 64,742 | 239,405 | 44,081 | 114,325 | 28% | 72% | 20,661 | 125,080 | 14% | 86% |
| 90-94 | 15,809 | 146,456 | 10,748 | 67,323 | 14% | 86% | 5,061 | 79,133 | 6% | 94% |
| 95-99 | 1,937 | 51,717 | 1,369 | 22,257 | 6% | 94% | 567 | 29,460 | 2% | 98% |
| 100+ | 85 | 8,045 | 60 | 2,701 | 2% | 98% | 25 | 5,344 | 0% | 100% |
| Total | 1,645,376 | 1,789,372 | 1,272,052 | 908,005 | 58% | 42% | 373,324 | 881,367 | 30% | 70% |
5.2.4 OAS Beneficiary Mortality by Age and Marital Status
Table 19 and Chart 10 show a comparison of mortality rates by age, sex, and marital status for year 2019. Males generally experience more of a mortality differential by marital status than females. The mortality ratio of single to married males is higher than for females at all ages. In 2019, at age 65, married males experience mortality that is 33% lower than for the overall program while it is 24% lower for females. In comparison, at age 65, male singles experience mortality that is 79% higher than for the overall program, while the corresponding percentage for females experience mortality is 42%. As a result, the ratio of single mortality to married mortality is 2.68 for males and of 1.88 for females. For both sexes, married and singles, mortality gradually converges to the overall level as age increases.
| Year | Males | Females | ||||||||||
|---|---|---|---|---|---|---|---|---|---|---|---|---|
| Overall OAS (annual deaths per thousand) | Married (annual deaths per thousand) | Ratio Married to Overall | Single (annual deaths per thousand) | Ratio Single to Overall |
Ratio Single to Married |
Overall OAS (annual deaths per thousand) | Married (annual deaths per thousand) | Ratio Married to Overall | Single (annual deaths per thousand) | Ratio Single to Overall |
Ratio Single to Married |
|
| 65 | 12.0 | 8.0 | 0.67 | 21.4 | 1.79 | 2.68 | 7.25 | 5.49 | 0.76 | 10.32 | 1.42 | 1.88 |
| 70 | 18.1 | 13.8 | 0.76 | 29.6 | 1.63 | 2.15 | 11.71 | 9.00 | 0.77 | 15.70 | 1.34 | 1.75 |
| 75 | 28.4 | 23.0 | 0.81 | 42.9 | 1.51 | 1.86 | 19.05 | 14.99 | 0.79 | 23.49 | 1.23 | 1.57 |
| 80 | 47.5 | 41.1 | 0.87 | 63.4 | 1.33 | 1.54 | 32.97 | 26.38 | 0.80 | 37.45 | 1.14 | 1.42 |
| 85 | 83.6 | 75.3 | 0.90 | 99.1 | 1.19 | 1.32 | 59.77 | 50.41 | 0.84 | 63.20 | 1.06 | 1.25 |
| 90 | 149.7 | 137.4 | 0.92 | 163.0 | 1.09 | 1.19 | 112.05 | 101.70 | 0.91 | 113.61 | 1.01 | 1.12 |
| 95 | 245.0 | 232.8 | 0.95 | 253.4 | 1.03 | 1.09 | 195.36 | 190.57 | 0.98 | 195.84 | 1.00 | 1.03 |
| 100 | 355.8 | 350.8 | 0.99 | 359.8 | 1.01 | 1.03 | 299.71 | 299.71 | 1.00 | 300.50 | 1.00 | 1.00 |
Chart 10 - OAS Beneficiary Mortality Ratios by Marital Status (2019)
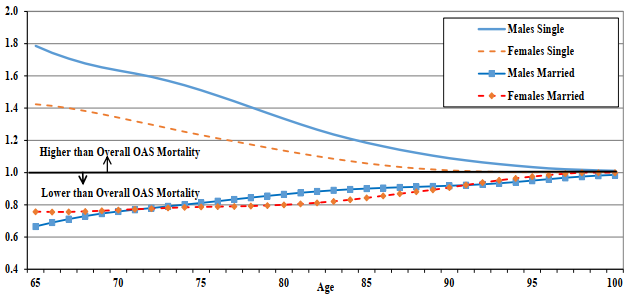
Chart Description
Line chart showing the males and females OAS mortality ratios by marital status for year 2019. The Y axis shows the mortality ratio by marital status relative to the overall OAS program mortality and the X axis shows the age.
At age 65, for males that are married the mortality ratio is 0.67 and 1.79 for males that are single. For females that are married the mortality ratio is 0.76 and 1.42 for females that are single.
At age 70, for males that are married the mortality ratio is 0.76 and 1.63 for males that are single. For females that are married the mortality ratio is 0.77 and 1.34 for females that are single.
At age 75, for males that are married the mortality ratio is 0.81 and 1.51 for males that are single. For females that are married the mortality ratio is 0.79 and 1.23 for females that are single.
At age 80, for males that are married the mortality ratio is 0.87 and 1.33 for males that are single. For females that are married the mortality ratio is 0.80 and 1.14 for females that are single.
At age 85, for males that are married the mortality ratio is 0.90 and 1.19 for males that are single. For females that are married the mortality ratio is 0.84 and 1.06 for females that are single.
At age 90, for males that are married the mortality ratio is 0.92 and 1.09 for males that are single. For females that are married the mortality ratio is 0.91 and 1.01 for females that are single.
At age 95, for males that are married the mortality ratio is 0.95 and 1.03 for males that are single. For females that are married the mortality ratio is 0.98 and 1.00 for females that are single.
At age 100, for males that are married the mortality ratio is 0.99 and 1.01 for males that are single. For females that are married or single the mortality ratio is 1.00.
5.2.5 Mortality by Marital Status and Type of Benefit
Table 20 and Chart 11 show a comparison of male mortality rates by age, marital status, and type of benefit. Single males in receipt of the GIS experience the highest mortality at most ages. For example, at age 65, single male GIS beneficiaries experience mortality that is almost two and a half times more than that of the overall OAS population. Single males without the GIS experience mortality that is higher compared to married GIS beneficiaries. Married males without the GIS experience the lowest mortality except at the very advanced ages. All subgroups show convergence to overall program mortality as age increases.
However, it should be noted that people living alone at older ages include widows/ers. As shown in CPP30, CPP survivor beneficiaries have higher mortality than the general population. For example in 2019, the difference in period life expectancy at age 65 between male survivors and the general population is 1.5 years. The difference for females is 1.0 years. Therefore, the analysis of OAS mortality trends by marital status must be interpreted with caution so that the ‘widow effect’ is well understood and considered. Nevertheless, the life expectancy gap between single and married individuals is higher than the gap between survivors and the general population. This points to additional reasons that may explain this difference in mortality. The lower mortality for married individuals may be related to better socio-economic situations of married individuals, and to the fact that a spouse provides physical and emotional support that has a positive impact on general health and well-being.
| Year | Overall OAS (annual deaths per thousand) | Without GIS | With GIS | ||||||||
|---|---|---|---|---|---|---|---|---|---|---|---|
| Married (annual deaths per thousand) | Ratio Married to Overall | Single (annual deaths per thousand) | Ratio Single to Overall |
Ratio Single to Married |
Married (annual deaths per thousand) | Ratio Married to Overall | Single (annual deaths per thousand) | Ratio Single to Overall |
Ratio Single to Married |
||
| 65 | 12.0 | 7.6 | 0.64 | 16.6 | 1.39 | 2.18 | 9.9 | 0.83 | 29.4 | 2.46 | 2.96 |
| 70 | 18.1 | 12.6 | 0.69 | 22.4 | 1.24 | 1.78 | 18.3 | 1.01 | 37.9 | 2.09 | 2.07 |
| 75 | 28.4 | 20.8 | 0.73 | 35.1 | 1.24 | 1.69 | 30.3 | 1.07 | 51.8 | 1.83 | 1.71 |
| 80 | 47.5 | 38.2 | 0.81 | 55.2 | 1.16 | 1.44 | 48.2 | 1.02 | 73.2 | 1.54 | 1.52 |
| 85 | 83.6 | 72.9 | 0.87 | 92.1 | 1.10 | 1.26 | 80.4 | 0.96 | 108.9 | 1.30 | 1.35 |
| 90 | 149.7 | 135.4 | 0.90 | 158.7 | 1.06 | 1.17 | 141.2 | 0.94 | 169.5 | 1.13 | 1.20 |
| 95 | 245.0 | 230.8 | 0.94 | 254.1 | 1.04 | 1.10 | 235.4 | 0.96 | 254.4 | 1.04 | 1.08 |
| 100 | 355.8 | 348.6 | 0.98 | 368.2 | 1.03 | 1.06 | 355.6 | 1.00 | 358.3 | 1.01 | 1.01 |
Chart 11 - Mortality Ratios by Marital Status, and Type of Benefit - Males (2019)
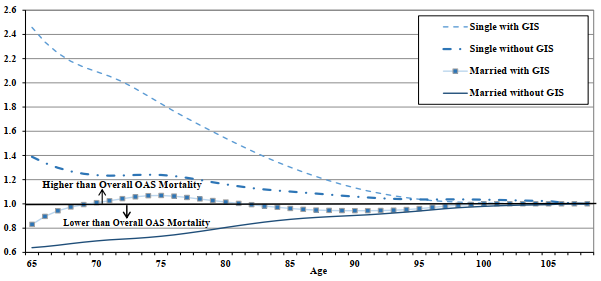
Chart Description
Line chart showing the males OAS mortality ratios by type of benefit and by marital status for year 2019. The Y axis shows the mortality ratio by type of benefit and by marital status relative to the overall OAS program mortality and the X axis shows the age.
At age 65, for male OAS beneficiaries without GIS who are married the mortality ratio is 0.64 and 1.39 for those who are single. For male OAS beneficiaries with GIS who are married the mortality ratio is 0.83 and 2.46 for those who are single.
At age 70, for male OAS beneficiaries without GIS who are married the mortality ratio is 0.69 and 1.24 for those who are single. For male OAS beneficiaries with GIS who are married the mortality ratio is 1.01 and 2.09 for those who are single.
At age 75, for male OAS beneficiaries without GIS who are married the mortality ratio is 0.73 and 1.24 for those who are single. For male OAS beneficiaries with GIS who are married the mortality ratio is 1.07 and 1.83 for those who are single.
At age 80, for male OAS beneficiaries without GIS who are married the mortality ratio is 0.81 and 1.16 for those who are single. For male OAS beneficiaries with GIS who are married the mortality ratio is 1.02 and 1.54 for those who are single.
At age 85, for male OAS beneficiaries without GIS who are married the mortality ratio is 0.87 and 1.10 for those who are single. For male OAS beneficiaries with GIS who are married the mortality ratio is 0.96 and 1.30 for those who are single.
At age 90, for male OAS beneficiaries without GIS who are married the mortality ratio is 0.90 and 1.06 for those who are single. For male OAS beneficiaries with GIS who are married the mortality ratio is 0.94 and 1.13 for those who are single.
At age 95, for male OAS beneficiaries without GIS who are married the mortality ratio is 0.94 and 1.04 for those who are single. For male OAS beneficiaries with GIS who are married the mortality ratio is 0.96 and 1.04 for those who are single.
At age 100, for male OAS beneficiaries without GIS who are married the mortality ratio is 0.98 and 1.03 for those who are single. For male OAS beneficiaries with GIS who are married the mortality ratio is 1.00 and 1.01 for those who are single.
Table 21 and Chart 12 show female mortality rates by age, marital status, and type of benefit. Single female GIS beneficiaries experience the highest mortality of all female beneficiaries, except at the very advanced ages. The mortality ratio for single female GIS beneficiaries relative to the overall program, which is 2.02 at age 65, converges more rapidly to 1.0 with increasing age compared to males. Married female GIS beneficiaries experience mortality that is very similar to that of single females without the GIS. As well, females in these two subgroups experience mortality that is similar to the overall program level, with mortality ratios relative to the program close to one at all ages.
Married females not in receipt of GIS benefits experience the lowest mortality at all ages compared to other subgroups. All subgroups show convergence to the overall program mortality as age increases.
| Year | Overall OAS (annual deaths per thousand) | Without GIS | With GIS | ||||||||
|---|---|---|---|---|---|---|---|---|---|---|---|
| Married (annual deaths per thousand) | Ratio Married to Overall | Single (annual deaths per thousand) | Ratio Single to Overall |
Ratio Single to Married |
Married (annual deaths per thousand) | Ratio Married to Overall | Single (annual deaths per thousand) | Ratio Single to Overall |
Ratio Single to Married |
||
| 65 | 7.2 | 5.1 | 0.70 | 7.7 | 1.06 | 1.51 | 7.8 | 1.08 | 14.7 | 2.02 | 1.88 |
| 70 | 11.7 | 8.1 | 0.69 | 11.7 | 1.00 | 1.45 | 12.3 | 1.05 | 20.1 | 1.72 | 1.63 |
| 75 | 19.0 | 13.7 | 0.72 | 18.6 | 0.98 | 1.36 | 18.9 | 0.99 | 28.5 | 1.50 | 1.51 |
| 80 | 33.0 | 23.9 | 0.73 | 32.9 | 1.00 | 1.38 | 32.3 | 0.98 | 41.7 | 1.26 | 1.29 |
| 85 | 59.8 | 46.5 | 0.78 | 58.4 | 0.98 | 1.25 | 58.8 | 0.98 | 67.6 | 1.13 | 1.15 |
| 90 | 112.0 | 97.1 | 0.87 | 108.3 | 0.97 | 1.12 | 109.6 | 0.98 | 118.4 | 1.06 | 1.08 |
| 95 | 195.4 | 186.2 | 0.95 | 195.0 | 1.00 | 1.05 | 195.9 | 1.00 | 196.2 | 1.00 | 1.00 |
| 100 | 299.7 | 299.7 | 1.00 | 301.9 | 1.01 | 1.01 | 300.0 | 1.00 | 300.7 | 1.00 | 1.00 |
Chart 12 - Mortality Ratios by Marital Status and Type of Benefit - Females (2019)
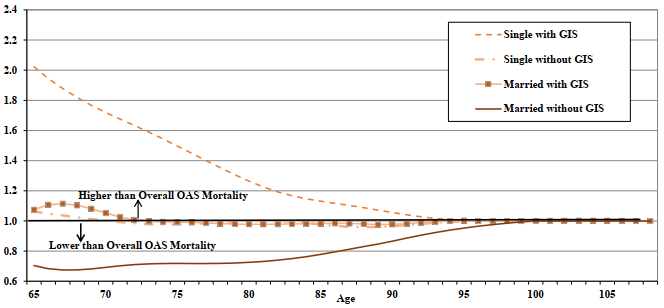
Chart Description
Line chart showing the female OAS mortality ratios by type of benefit and by marital status for year 2019. The Y axis shows the mortality ratio by type of benefit and by marital status relative to the overall OAS program mortality and the X axis shows the age.
At age 65, for female OAS beneficiaries without GIS who are married the mortality ratio is 0.70 and 1.06 for those who are single. For female OAS beneficiaries with GIS who are married the mortality ratio is 1.08 and 2.02 for those who are single.
At age 70, for female OAS beneficiaries without GIS who are married the mortality ratio is 0.69 and 1.00 for those who are single. For female OAS beneficiaries with GIS who are married the mortality ratio is 1.05 and 1.72 for those who are single.
At age 75, for female OAS beneficiaries without GIS who are married the mortality ratio is 0.72 and 0.98 for those who are single. For female OAS beneficiaries with GIS who are married the mortality ratio is 0.99 and 1.50 for those who are single.
At age 80, for female OAS beneficiaries without GIS who are married the mortality ratio is 0.73 and 1.00 for those who are single. For female OAS beneficiaries with GIS who are married the mortality ratio is 0.98 and 1.26 for those who are single.
At age 85, for female OAS beneficiaries without GIS who are married the mortality ratio is 0.78 and 0.98 for those who are single. For female OAS beneficiaries with GIS who are married the mortality ratio is 0.98 and 1.13 for those who are single.
At age 90, for female OAS beneficiaries without GIS who are married the mortality ratio is 0.87 and 0.97 for those who are single. For female OAS beneficiaries with GIS who are married the mortality ratio is 0.98 and 1.06 for those who are single.
At age 95, for female OAS beneficiaries without GIS who are married the mortality ratio is 0.95 and 1.00 for those who are single. For female OAS beneficiaries with GIS who are married or single the mortality ratio is 1.00.
At age 100, for female OAS beneficiaries without GIS who are married the mortality ratio is 1.00 and 1.01 for those who are single. For female OAS beneficiaries with GIS who are married or single the mortality ratio is 1.00.
5.3 Life Expectancies by Marital Status and Type of Benefit
5.3.1 Evolution of OAS Beneficiary Life Expectancies by Marital Status
Table 22 shows the life expectancies for beneficiaries by age, sex, and marital status. For both males and females, the life expectancies of married beneficiaries are higher than those of single beneficiaries.
In 2019, the life expectancies at age 65 are 20.7 years for married males and 16.8 years for singles, and the corresponding life expectancies at age 65 for married and single females are 23.5 and 21.1 years, respectively.
For both sexes, the difference in life expectancies between married and single beneficiaries reduces as age increases.
| Age | Males | Females | ||||||
|---|---|---|---|---|---|---|---|---|
| Overall OAS | Married | Single | Difference Married - Single |
Overall OAS | Married | Single | Difference Married - Single |
|
| 65 | 19.4 | 20.7 | 16.8 | 3.9 | 22.2 | 23.5 | 21.1 | 2.4 |
| 70 | 15.7 | 16.7 | 13.6 | 3.1 | 18.1 | 19.2 | 17.3 | 1.9 |
| 75 | 12.2 | 12.9 | 10.8 | 2.1 | 14.3 | 15.2 | 13.8 | 1.4 |
| 80 | 9.0 | 9.6 | 8.2 | 1.4 | 10.7 | 11.4 | 10.5 | 0.9 |
| 85 | 6.4 | 6.7 | 5.9 | 0.8 | 7.7 | 8.1 | 7.6 | 0.5 |
| 90 | 4.3 | 4.6 | 4.1 | 0.5 | 5.3 | 5.4 | 5.2 | 0.2 |
Table 23 and Chart 13 show the evolution of life expectancy at age 65 by sex and marital status for the period 2005 to 2019. Since 2005, for both sexes, the gap in life expectancies at age 65 between married and singles has remained relatively stable, but has increased slightly in recent years and more so for females than males. In 2005, the differentials between married and singles is 3.8 years for males and 2.1 for females. In 2019, the differentials by marital status are 3.9 years and 2.4 years for males and females, respectively.
| Year | Males | Females | ||||||
|---|---|---|---|---|---|---|---|---|
| Overall OAS | Married | Single | Difference Married - Single |
Overall OAS | Married | Single | Difference Married - Single |
|
| 2005 | 17.5 | 18.7 | 14.9 | 3.8 | 20.7 | 21.9 | 19.8 | 2.1 |
| 2006 | 17.8 | 18.8 | 15.4 | 3.4 | 21.0 | 22.1 | 20.1 | 2.0 |
| 2007 | 17.8 | 19.0 | 15.2 | 3.8 | 21.0 | 22.2 | 20.1 | 2.1 |
| 2008 | 18.0 | 19.0 | 15.6 | 3.4 | 21.1 | 22.1 | 20.3 | 1.8 |
| 2009 | 18.2 | 19.3 | 15.8 | 3.5 | 21.4 | 22.5 | 20.5 | 2.0 |
| 2010 | 18.5 | 19.7 | 15.9 | 3.8 | 21.4 | 22.7 | 20.5 | 2.2 |
| 2011 | 18.6 | 19.8 | 16.1 | 3.7 | 21.5 | 22.8 | 20.6 | 2.2 |
| 2012 | 18.8 | 20.0 | 16.2 | 3.8 | 21.7 | 23.0 | 20.7 | 2.3 |
| 2013 | 18.9 | 20.0 | 16.4 | 3.6 | 21.8 | 23.0 | 20.8 | 2.2 |
| 2014 | 18.9 | 20.1 | 16.4 | 3.7 | 21.9 | 23.1 | 20.9 | 2.2 |
| 2015 | 19.0 | 20.2 | 16.5 | 3.7 | 21.8 | 23.2 | 20.8 | 2.4 |
| 2016 | 19.2 | 20.4 | 16.6 | 3.8 | 22.1 | 23.4 | 21.0 | 2.4 |
| 2017 | 19.1 | 20.4 | 16.5 | 3.9 | 22.0 | 23.2 | 21.0 | 2.2 |
| 2018 | 19.2 | 20.5 | 16.6 | 3.9 | 22.0 | 23.2 | 20.9 | 2.3 |
| 2019 | 19.4 | 20.7 | 16.8 | 3.9 | 22.2 | 23.6 | 21.1 | 2.5 |
Table 23 Footnote
|
||||||||
Chart 13 - Evolution of OAS Beneficiary Life Expectancies at Age 65 by Marital Status (2005-2019)Footnote *
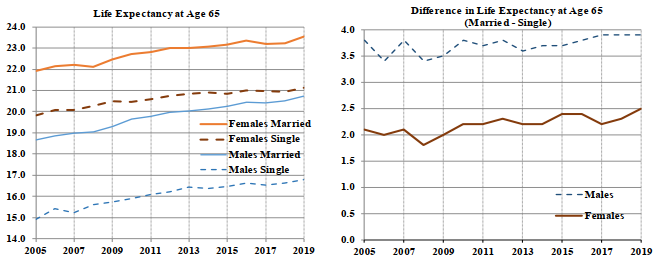
Chart Description
Two line charts. Chart 13(i) (left chart) showing the life expectancy at age 65 for males and females by marital status. The Y axis shows the life expectancy at age 65 and the X axis shows the age. Chart 13(ii) (right chart), where the Y axis shows the difference in life expectancy at age 65 between females and males by marital status and the X axis shows the year.
Chart 13(i)
For year 2005, the males’ life expectancy at age 65 for OAS beneficiaries who were married was 18.7 years and 14.9 years for males OAS beneficiaries who were single. The females’ life expectancy at age 65 for OAS beneficiaries who were married was 21.9 years and 19.8 years for females OAS beneficiaries who were single.
For year 2009, the males’ life expectancy at age 65 for OAS beneficiaries who were married was 19.3 years and 15.8 years for males OAS beneficiaries who were single. The females’ life expectancy at age 65 for OAS beneficiaries who were married was 22.5 years and 20.5 years for females OAS beneficiaries who were single.
For year 2014, the males’ life expectancy at age 65 for OAS beneficiaries who were married was 20.1 years and 16.4 years for males OAS beneficiaries who were single. The females’ life expectancy at age 65 for OAS beneficiaries who were married was 23.1 years and 20.9 years for females OAS beneficiaries who were single.
For year 2019, the males’ life expectancy at age 65 for OAS beneficiaries who were married was 20.7 years and 16.8 years for males OAS beneficiaries who were single. The females’ life expectancy at age 65 for OAS beneficiaries who were married was 23.6 years and 21.1 years for females OAS beneficiaries who were single.
Chart 13(ii)
For year 2005, the males’ difference in life expectancy at age 65 for OAS beneficiaries who were married and those who were single was 3.8 years. The females’ difference in life expectancy at age 65 for OAS beneficiaries who were married and those who were single was 2.1 years.
For year 2009, the males’ difference in life expectancy at age 65 for OAS beneficiaries who were married and those who were single was 3.5 years. the females’ difference in life expectancy at age 65 for OAS beneficiaries who were married and those who were single was 2.0 years.
For year 2014, the males’ difference in life expectancy at age 65 for OAS beneficiaries who were married and those who were single was 3.7 years. the females’ difference in life expectancy at age 65 for OAS beneficiaries who were married and those who were single was 2.2 years.
For year 2019, the males’ difference in life expectancy at age 65 for OAS beneficiaries who were married and those who were single was 3.9 years. the females’ difference in life expectancy at age 65 for OAS beneficiaries who were married and those who were single was 2.5 years.
Chart 13 Footnote
- Chart 13 Footnote *
-
Results for years prior to 2005 by marital status are not shown due to data limitation regarding marital status for those years.
5.3.2 Evolution of Life Expectancies by Marital Status and Type of Benefit
Table 24 shows the life expectancies for both sexes by age, marital status, and type of benefit, for the year 2019. For a given marital status, life expectancies of beneficiaries without the GIS are higher than for beneficiaries receiving the benefit. For instance, for single males aged 65, those not in receipt of the GIS live on average 2.8 years longer than those who receive the benefit.
For both sexes and for each benefit type, married beneficiaries live longer than single counterparts. For example, married males aged 65, without the GIS, are expected to live on average 21.1 years or 3.0 years longer than single males (18.1 years). In comparison, for the same benefit subgroup and age, married females are expected to live on average 24.0 years or 1.7 years longer than single females (22.3 years). Married males, aged 65, with the GIS, are expected to live on average 19.5 years or 4.2 years longer than single males (15.3 years). For the same benefit subgroup and age, married females are expected to live on average 22.2 years or 2.2 years longer than single females (20.0 years).
For both sexes in general, single GIS beneficiaries have the lowest life expectancies relative to the other subgroups, while married beneficiaries without the GIS have the highest life expectancies.
| Age | Males | |||||||
|---|---|---|---|---|---|---|---|---|
| Overall OAS Married | Married without GIS | Married with GIS | Difference Married without – with GIS |
Overall OAS Single | Single without GIS |
Single with GIS |
Difference Single without – with GIS |
|
| 65 | 20.7 | 21.1 | 19.5 | 1.6 | 16.8 | 18.1 | 15.3 | 2.8 |
| 70 | 16.7 | 17.0 | 15.6 | 1.4 | 13.6 | 14.7 | 12.5 | 2.2 |
| 75 | 12.9 | 13.2 | 12.2 | 1.0 | 10.8 | 11.4 | 10.0 | 1.4 |
| 80 | 9.6 | 9.7 | 9.2 | 0.5 | 8.2 | 8.6 | 7.7 | 0.9 |
| 85 | 6.7 | 6.8 | 6.6 | 0.2 | 5.9 | 6.1 | 5.7 | 0.4 |
| 90 | 4.6 | 4.6 | 4.5 | 0.1 | 4.1 | 4.2 | 4.1 | 0.1 |
| Age | Females | |||||||
| Overall OAS Married | Married without GIS | Married with GIS | Difference Married without – with GIS |
Overall OAS Single | Single without GIS | Single with GIS |
Difference Single without – with GIS |
|
| 65 | 23.5 | 24.0 | 22.2 | 1.8 | 21.1 | 22.3 | 20.0 | 2.3 |
| 70 | 19.2 | 19.7 | 18.2 | 1.5 | 17.3 | 18.2 | 16.5 | 1.7 |
| 75 | 15.2 | 15.6 | 14.3 | 1.3 | 13.8 | 14.4 | 13.2 | 1.2 |
| 80 | 11.4 | 11.8 | 10.8 | 1.0 | 10.5 | 10.8 | 10.2 | 0.6 |
| 85 | 8.1 | 8.3 | 7.8 | 0.5 | 7.6 | 7.8 | 7.4 | 0.4 |
| 90 | 5.4 | 5.5 | 5.3 | 0.2 | 5.2 | 5.3 | 5.2 | 0.1 |
Table 25 and Chart 14 show the evolution of life expectancies at age 65 for both sexes by marital status and type of benefit received for the period 2005 to 2019. Over 2005 to 2019, the life expectancy at age 65 for married males without the GIS increased from 19.2 years to 21.1 years (an increase of 1.9 years). In comparison, for married males with the GIS, life expectancies at age 65 increased from 17.3 to 19.5 years (or by 1.8 years) over the same period. As such, since the mid-2000s, the difference in life expectancies at age 65 for married males between those without and with the GIS has remained relatively stable at around 1.8 years.
Life expectancies at 65 for married females increased from 22.6 to 24.1 years for those without the GIS, and from 20.4 to 22.1 years for those with the benefit over the period 2005 to 2019. For married females age 65, the difference in life expectancies by benefit type fluctuated somewhat more than males, but still remained relatively stable at around 2.0 years from the mid-2000s to 2019.
In comparison, for both single males and females, the differences in life expectancies at age 65 between those without and with the GIS increased overall from the mid-2000s to 2019. For single males, from 2005 to 2019, life expectancy at age 65 for those without the GIS increased by 2.4 years, from 15.7 to 18.1 years. For those receiving the GIS, the increase was 1.4 years, from 13.9 to 15.3 years. As such, the difference in life expectancies at age 65 between single males without and with the GIS increased from 1.9 to 2.8 years over the period 2005 to 2019. Over the same period for single females, life expectancies at age 65 increased by 1.7 years, from 20.6 to 22.3 years for those without the GIS, and by 0.8 of a year, from 19.1 to 20.0 years for those receiving the benefit. Consequently, the difference in life expectancies at age 65 for single females without and with the GIS increased from 1.5 to 2.3 years over 2005 to 2019.
| Year | Males | |||||
|---|---|---|---|---|---|---|
| Married without GIS | Married with GIS | Difference | Single without GIS | Single with GIS | Difference | |
| 2005 | 19.2 | 17.3 | 1.9 | 15.7 | 13.9 | 1.8 |
| 2006 | 19.3 | 17.6 | 1.7 | 16.4 | 14.2 | 2.2 |
| 2007 | 19.5 | 17.7 | 1.8 | 16.3 | 14.0 | 2.3 |
| 2008 | 19.6 | 17.6 | 2.0 | 16.8 | 14.2 | 2.6 |
| 2009 | 19.8 | 18.0 | 1.8 | 16.9 | 14.4 | 2.5 |
| 2010 | 20.1 | 18.4 | 1.7 | 16.9 | 14.7 | 2.2 |
| 2011 | 20.3 | 18.4 | 1.9 | 17.3 | 14.7 | 2.6 |
| 2012 | 20.5 | 18.6 | 1.9 | 17.3 | 14.9 | 2.4 |
| 2013 | 20.5 | 18.7 | 1.8 | 17.5 | 15.1 | 2.4 |
| 2014 | 20.6 | 18.7 | 1.9 | 17.5 | 15.0 | 2.5 |
| 2015 | 20.7 | 19.0 | 1.7 | 17.5 | 15.2 | 2.3 |
| 2016 | 20.9 | 19.2 | 1.7 | 17.8 | 15.2 | 2.6 |
| 2017 | 20.8 | 19.2 | 1.6 | 17.7 | 15.2 | 2.5 |
| 2018 | 21.0 | 19.2 | 1.8 | 17.9 | 15.2 | 2.7 |
| 2019 | 21.1 | 19.5 | 1.6 | 18.1 | 15.3 | 2.8 |
| Year | Females | |||||
| Married without GIS | Married with GIS | Difference | Single without GIS | Single with GIS | Difference | |
| 2005 | 22.6 | 20.4 | 2.2 | 20.6 | 19.1 | 1.5 |
| 2006 | 22.8 | 20.6 | 2.2 | 20.8 | 19.4 | 1.4 |
| 2007 | 22.8 | 20.8 | 2.0 | 20.9 | 19.4 | 1.5 |
| 2008 | 22.8 | 20.6 | 2.2 | 21.2 | 19.4 | 1.8 |
| 2009 | 23.1 | 21.0 | 2.1 | 21.4 | 19.7 | 1.7 |
| 2010 | 23.4 | 21.0 | 2.4 | 21.3 | 19.6 | 1.7 |
| 2011 | 23.4 | 21.4 | 2.0 | 21.5 | 19.7 | 1.8 |
| 2012 | 23.5 | 21.6 | 1.9 | 21.7 | 19.8 | 1.9 |
| 2013 | 23.6 | 21.5 | 2.1 | 21.8 | 19.9 | 1.9 |
| 2014 | 23.6 | 21.6 | 2.0 | 21.9 | 19.9 | 2.0 |
| 2015 | 23.7 | 21.8 | 1.9 | 21.7 | 20.0 | 1.7 |
| 2016 | 23.9 | 22.0 | 1.9 | 22.0 | 20.0 | 2.0 |
| 2017 | 23.7 | 21.8 | 1.9 | 22.0 | 20.0 | 2.0 |
| 2018 | 23.8 | 21.9 | 1.9 | 22.0 | 19.8 | 2.2 |
| 2019 | 24.1 | 22.1 | 2.0 | 22.3 | 20.0 | 2.3 |
Table 25 Footnote
|
||||||
Chart 14 - Life Expectancies at Age 65 by Marital Status and Type of Benefit (2005-2019)Footnote *
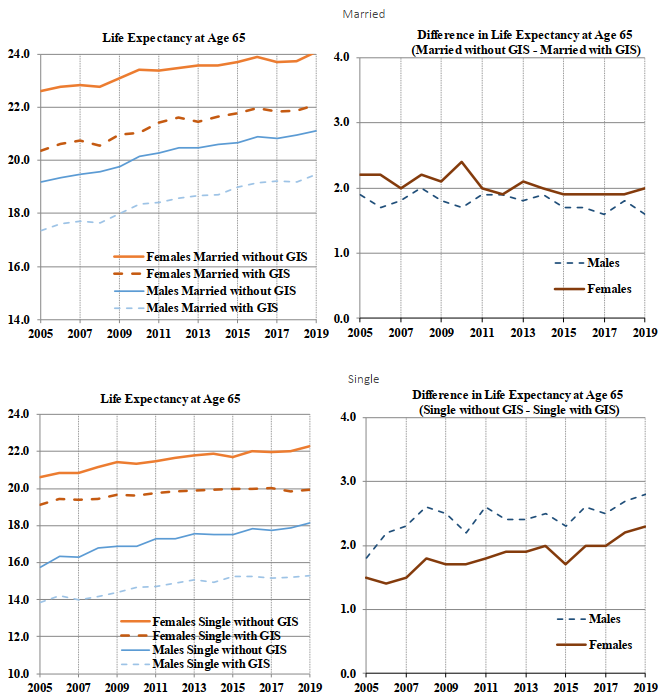
Chart Description
Four line charts. Chart 14(i) (top left chart) showing the life expectancy at age 65 for married males and females by type of benefit. The Y axis shows the life expectancy at age 65 and the X axis shows the age. Chart 14(ii) (top right chart), where the Y axis shows the difference in life expectancy at age 65 between married females and males by type of benefit and the X axis shows the year.
Chart 14(iii) (bottom left chart) showing the life expectancy at age 65 for single males and females by type of benefit. The Y axis shows the life expectancy at age 65 and the X axis shows the age. Chart 14(iv) (bottom right chart), where the Y axis shows the difference in life expectancy at age 65 between single females and males by type of benefit and the X axis shows the year.
Chart 14(i)
For year 2005, the males’ life expectancy at age 65 for married OAS beneficiaries without GIS was 19.2 years and 17.3 years for married OAS beneficiaries with GIS. The females’ life expectancy at age 65 for married OAS beneficiaries without GIS was 22.6 years and 20.4 years for married OAS beneficiaries with GIS.
For year 2009, the males’ life expectancy at age 65 for married OAS beneficiaries without GIS was 19.8 years and 18.0 years for married OAS beneficiaries with GIS. The females’ life expectancy at age 65 for married OAS beneficiaries without GIS was 23.1 years and 21.0 years for married OAS beneficiaries with GIS.
For year 2014, the males’ life expectancy at age 65 for married OAS beneficiaries without GIS was 20.6 years and 18.7 years for married OAS beneficiaries with GIS. The females’ life expectancy at age 65 for married OAS beneficiaries without GIS was 23.6 years and 21.6 years for married OAS beneficiaries with GIS.
For year 2019, the males’ life expectancy at age 65 for married OAS beneficiaries without GIS was 21.1 years and 19.5 years for married OAS beneficiaries with GIS. The females’ life expectancy at age 65 for married OAS beneficiaries without GIS was 24.1 years and 22.1 years for married OAS beneficiaries with GIS.
Chart 14(ii)
For year 2005, the males’ difference in life expectancy at age 65 for married OAS beneficiaries without GIS and those married OAS beneficiaries without GIS was 1.9 years. The females’ difference in life expectancy at age 65 for married OAS beneficiaries without GIS and those married OAS beneficiaries with GIS was 2.2 years.
For year 2009, the males’ difference in life expectancy at age 65 for married OAS beneficiaries without GIS and those married OAS beneficiaries without GIS was 1.8 years. The females’ difference in life expectancy at age 65 for married OAS beneficiaries without GIS and those married OAS beneficiaries with GIS was 2.1 years.
For year 2014, the males and females’ difference in life expectancy at age 65 for married OAS beneficiaries without GIS and those married OAS beneficiaries without GIS was 1.9 years.
For year 2019, the males’ difference in life expectancy at age 65 for married OAS beneficiaries without GIS and those married OAS beneficiaries without GIS was 1.6 years. The females’ difference in life expectancy at age 65 for married OAS beneficiaries without GIS and those married OAS beneficiaries with GIS was 2.0 years.
Chart 14(iii)
For year 2005, the males’ life expectancy at age 65 for single OAS beneficiaries without GIS was 15.7 years and 13.9 years for single OAS beneficiaries with GIS. The females’ life expectancy at age 65 for single OAS beneficiaries without GIS was 20.6 years and 19.1 years for single OAS beneficiaries with GIS.
For year 2009, the males’ life expectancy at age 65 for single OAS beneficiaries without GIS was 16.9 years and 14.4 years for single OAS beneficiaries with GIS. The females’ life expectancy at age 65 for single OAS beneficiaries without GIS was 21.4 years and 19.7 years for single OAS beneficiaries with GIS.
For year 2014, the males’ life expectancy at age 65 for single OAS beneficiaries without GIS was 17.5 years and 15.0 years for single OAS beneficiaries with GIS. The females’ life expectancy at age 65 for single OAS beneficiaries without GIS was 21.9 years and 19.9 years for single OAS beneficiaries with GIS.
For year 2019, the males’ life expectancy at age 65 for single OAS beneficiaries without GIS was 18.1 years and 15.3 years for single OAS beneficiaries with GIS. The females’ life expectancy at age 65 for single OAS beneficiaries without GIS was 22.3 years and 20.0 years for single OAS beneficiaries with GIS.
Chart 14(iv)
For year 2005, the males’ difference in life expectancy at age 65 for single OAS beneficiaries without GIS and those single OAS beneficiaries without GIS was 1.8 years. The females’ difference in life expectancy at age 65 for single OAS beneficiaries without GIS and those single OAS beneficiaries with GIS was 1.5 years.
For year 2009, the males’ difference in life expectancy at age 65 for single OAS beneficiaries without GIS and those single OAS beneficiaries without GIS was 2.5 years. The females’ difference in life expectancy at age 65 for single OAS beneficiaries without GIS and those single OAS beneficiaries with GIS was 1.7 years.
For year 2014, the males’ difference in life expectancy at age 65 for single OAS beneficiaries without GIS and those single OAS beneficiaries without GIS was 2.5 years. The females’ difference in life expectancy at age 65 for single OAS beneficiaries without GIS and those single OAS beneficiaries with GIS was 2.0 years.
For year 2019, the males’ difference in life expectancy at age 65 for single OAS beneficiaries without GIS and those single OAS beneficiaries without GIS was 2.8 years. The females’ difference in life expectancy at age 65 for single OAS beneficiaries without GIS and those single OAS beneficiaries with GIS was 2.3 years.
Chart 14 Footnote
- Chart 14 Footnote *
-
Results for years prior to 2005 are not shown by marital status due to data limitation on marital status for those years.
6. OAS Beneficiary Mortality by Place of Birth
6.1 Introduction
This section presents the results of analysis on the mortality of OAS beneficiaries by whether they were born in Canada or born outside Canada. The results of this study are consistent with the previous OAS program mortality studies prepared by the OCA, which showed that OAS beneficiaries born outside Canada experience lower mortality than those born in Canada. This may be explained by the “healthy immigrant effect” (Vang et al., 2015) that results from several factors, including medical and employability screening prior to entry to Canada as well as cultural and lifestyle characteristics.
First, people in poor health are less likely to migrate to another country. In addition, all potential immigrants to Canada are subject to medical screening. Moreover, immigrants to Canada are partially selected on the basis of employability, which would imply a certain status of health. As new immigrants tend to be healthy, they experience greater life expectancies than those who had immigrated years earlier. Lastly, cultural and lifestyle characteristics of immigrants may also contribute to their relative better health and increased longevities.
6.2 OAS Beneficiary Mortality Experience by Place of Birth for Year 2019
6.2.1 Beneficiaries by Place of Birth
Table 26 shows the proportion of OAS beneficiaries by age group, sex, and place of birth. Overall, about 27% of beneficiaries were born outside Canada. As well, there are higher proportions of beneficiaries born outside Canada at the older age groups.
| Age Group | Males | Females | ||||
|---|---|---|---|---|---|---|
| Born in Canada | Born Outside Canada | Proportion Born Outside Canada | Born in Canada | Born Outside Canada | Proportion Born Outside Canada | |
| 65-69 | 744,480 | 164,428 | 18% | 795,354 | 197,612 | 20% |
| 70-74 | 583,564 | 220,734 | 27% | 636,389 | 241,546 | 28% |
| 75-79 | 378,599 | 162,494 | 30% | 436,643 | 181,454 | 29% |
| 80-84 | 228,560 | 117,109 | 34% | 296,837 | 141,261 | 32% |
| 85-89 | 132,444 | 71,296 | 35% | 210,471 | 93,832 | 31% |
| 90-94 | 50,440 | 29,364 | 37% | 110,389 | 51,578 | 32% |
| 95-99 | 10,628 | 6,587 | 38% | 37,030 | 17,200 | 32% |
| 100+ | 984 | 652 | 40% | 5,931 | 2,280 | 28% |
| Total | 2,129,699 | 772,664 | 27% | 2,529,044 | 926,763 | 27% |
Tables 65 to 71 in the Annex show various statistics related to the OAS program by individual age, sex, and place of birth.
6.2.2 OAS Beneficiary Deaths by Place of Birth
Table 27 shows that there is little variation between male and female beneficiaries in the proportions of deaths by age and place of birth, except at ages 95 and over. For age groups between 65 and 94, the proportion of deaths for those born outside Canada varies between 13% and 33% for males and between 14% and 30% for females. At ages 95 and above, the corresponding proportions vary between 35% and 36% for males, and between 26% and 29% for females.
| Age Group | Males | Females | ||||
|---|---|---|---|---|---|---|
| Born in Canada | Born Outside Canada | Proportion Born Outside Canada | Born in Canada | Born Outside Canada | Proportion Born Outside Canada | |
| 65-69 | 11,421 | 1,766 | 13% | 7,672 | 1,224 | 14% |
| 70-74 | 13,602 | 3,717 | 21% | 9,857 | 2,450 | 20% |
| 75-79 | 14,249 | 4,391 | 24% | 11,235 | 3,302 | 23% |
| 80-84 | 14,817 | 5,966 | 29% | 13,813 | 4,787 | 26% |
| 85-89 | 15,443 | 6,847 | 31% | 17,576 | 6,453 | 27% |
| 90-94 | 10,218 | 5,142 | 33% | 17,020 | 7,200 | 30% |
| 95-99 | 3,497 | 1,981 | 36% | 9,614 | 4,018 | 29% |
| 100+ | 492 | 262 | 35% | 2,462 | 876 | 26% |
| Total | 83,739 | 30,072 | 26% | 89,249 | 30,310 | 25% |
6.2.3 OAS Beneficiary Exposures by Place of Birth
Table 28 shows the proportion of exposures by age group, sex, and place of birth. For male beneficiaries, the increase by age in the proportion of exposures of those born outside Canada reflects the fact that males born outside Canada live longer than those born in Canada. For females, the corresponding proportion by age is much more stable than observed for males.
| Age Group | Males | Females | ||||
|---|---|---|---|---|---|---|
| Born in Canada | Born Outside Canada | Proportion Born Outside of Canada | Born in Canada | Born Outside Canada | Proportion Born Outside of Canada | |
| 65-69 | 749,524 | 174,855 | 19% | 790,941 | 207,064 | 21% |
| 70-74 | 570,445 | 223,569 | 28% | 621,427 | 242,419 | 28% |
| 75-79 | 371,357 | 160,787 | 30% | 429,138 | 180,181 | 30% |
| 80-84 | 225,652 | 116,757 | 34% | 294,630 | 140,752 | 32% |
| 85-89 | 131,421 | 71,209 | 35% | 210,323 | 93,824 | 31% |
| 90-94 | 49,617 | 29,128 | 37% | 109,904 | 52,362 | 32% |
| 95-99 | 10,384 | 6,597 | 39% | 36,655 | 16,998 | 32% |
| 100+ | 943 | 666 | 41% | 5,824 | 2,307 | 28% |
| Total | 2,109,343 | 783,567 | 27% | 2,498,842 | 935,907 | 27% |
6.2.4 OAS Beneficiary Mortality by Place of Birth
Table 29 and Chart 15 show that, for both sexes, mortality for those born in Canada is higher than the overall OAS program mortality (6% and 7% higher at age 65, respectively for males and females), while mortality is lower for those born outside Canada (35% and 34% lower at age 65, respectively for males and females). In both cases however, mortality approaches that of the overall OAS program as age increases.
| Age | Males | Females | ||||||||
|---|---|---|---|---|---|---|---|---|---|---|
| Overall OAS (annual deaths per thousand) |
Born in Canada (annual deaths per thousand) |
Ratio Born in Canada to Overall |
Born Outside Canada (annual deaths per thousand) |
Ratio Born Outside Canada to Overall | Overall OAS (annual deaths per thousand) |
Born in Canada (annual deaths per thousand) |
Ratio Born in Canada to Overall |
Born Outside Canada (annual deaths per thousand) |
Ratio Born Outside Canada to Overall | |
| 65 | 12.0 | 12.7 | 1.06 | 7.8 | 0.65 | 7.2 | 7.8 | 1.07 | 4.8 | 0.66 |
| 70 | 18.1 | 19.7 | 1.09 | 13.5 | 0.74 | 11.7 | 13.0 | 1.11 | 8.0 | 0.68 |
| 75 | 28.4 | 31.1 | 1.10 | 21.7 | 0.77 | 19.0 | 21.0 | 1.10 | 14.2 | 0.75 |
| 80 | 47.5 | 51.6 | 1.09 | 39.1 | 0.82 | 33.0 | 36.5 | 1.11 | 25.4 | 0.77 |
| 85 | 83.6 | 89.7 | 1.07 | 72.2 | 0.86 | 59.8 | 63.9 | 1.07 | 50.7 | 0.85 |
| 90 | 149.7 | 157.7 | 1.05 | 135.0 | 0.90 | 112.0 | 116.7 | 1.04 | 102.0 | 0.91 |
| 95 | 245.0 | 255.4 | 1.04 | 230.7 | 0.94 | 195.4 | 200.8 | 1.03 | 183.1 | 0.94 |
| 100 | 355.8 | 372.4 | 1.05 | 348.2 | 0.98 | 299.7 | 306.9 | 1.02 | 288.1 | 0.96 |
Chart 15 - OAS Beneficiary Mortality Ratios by Place of Birth (2019)
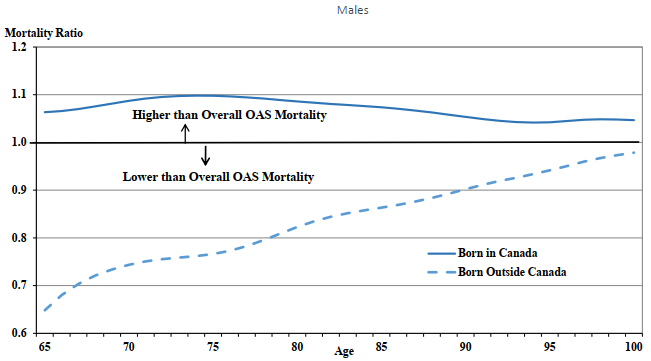
Chart Description
Two line charts. Chart 15(i) (top chart) is for males and Chart 15(ii) (bottom chart) is for females. Both charts show OAS mortality ratios by place of birth for year 2019. The Y axis shows the mortality ratio by place of birth relative to the overall OAS program mortality and the X axis shows the age.
Chart 15(i)
At age 65, male mortality ratio for those OAS beneficiaries born in Canada was 1.06 and 0.65 for those born outside Canada.
At age 70, male mortality ratio for those OAS beneficiaries born in Canada was 1.09 and 0.74 for those born outside Canada.
At age 75, male mortality ratio for those OAS beneficiaries born in Canada was 1.10 and 0.77 for those born outside Canada.
At age 80, male mortality ratio for those OAS beneficiaries born in Canada was 1.09 and 0.82 for those born outside Canada.
At age 85, male mortality ratio for those OAS beneficiaries born in Canada was 1.07 and 0.86 for those born outside Canada.
At age 90, male mortality ratio for those OAS beneficiaries born in Canada was 1.05 and 0.90 for those born outside Canada.
At age 95, male mortality ratio for those OAS beneficiaries born in Canada was 1.04 and 0.94 for those born outside Canada.
At age 100, male mortality ratio for those OAS beneficiaries born in Canada was 1.05 and 0.98 for those born outside Canada.
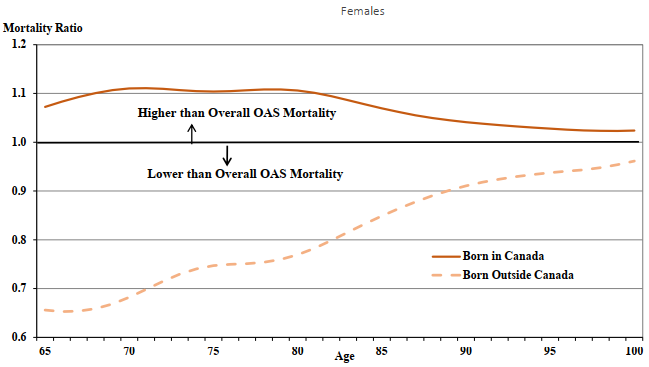
Chart Description
Chart 15(ii)
At age 65, female mortality ratio for those OAS beneficiaries born in Canada was 1.07 and 0.66 for those born outside Canada.
At age 70, female mortality ratio for those OAS beneficiaries born in Canada was 1.11 and 0.68 for those born outside Canada.
At age 75, female mortality ratio for those OAS beneficiaries born in Canada was 1.10 and 0.75 for those born outside Canada.
At age 80, female mortality ratio for those OAS beneficiaries born in Canada was 1.11 and 0.77 for those born outside Canada.
At age 85, female mortality ratio for those OAS beneficiaries born in Canada was 1.07 and 0.85 for those born outside Canada.
At age 90, female mortality ratio for those OAS beneficiaries born in Canada was 1.04 and 0.91 for those born outside Canada.
At age 95, female mortality ratio for those OAS beneficiaries born in Canada was 1.03 and 0.94 for those born outside Canada.
At age 100, female mortality ratio for those OAS beneficiaries born in Canada was 1.02 and 0.96 for those born outside Canada.
6.3 OAS Beneficiary Life Expectancies by Place of Birth
Table 30 shows life expectancies of OAS program beneficiaries by place of birth. For male beneficiaries, life expectancies at age 65 are 21.0 years for those born outside Canada and 18.8 years for those born in Canada, for a difference of 2.2 years. For female beneficiaries, life expectancies at age 65 are 23.8 years for those born outside Canada and 21.6 years for those born in Canada, a difference also of 2.2 years. For both sexes, the difference in life expectancies by place of birth reduces as age increases.
| Age | Males | Females | ||||||
|---|---|---|---|---|---|---|---|---|
| Overall OAS | Born Outside Canada | Born In Canada | Difference Born Outside – In Canada |
Overall OAS | Born Outside Canada | Born In Canada | Difference Born Outside – In Canada |
|
| 65 | 19.4 | 21.0 | 18.8 | 2.2 | 22.2 | 23.8 | 21.6 | 2.2 |
| 70 | 15.7 | 16.9 | 15.1 | 1.8 | 18.1 | 19.4 | 17.6 | 1.8 |
| 75 | 12.2 | 13.2 | 11.7 | 1.5 | 14.3 | 15.3 | 13.8 | 1.5 |
| 80 | 9.0 | 9.7 | 8.7 | 1.0 | 10.7 | 11.5 | 10.4 | 1.1 |
| 85 | 6.4 | 6.8 | 6.1 | 0.7 | 7.7 | 8.2 | 7.5 | 0.7 |
| 90 | 4.3 | 4.6 | 4.2 | 0.4 | 5.3 | 5.5 | 5.1 | 0.4 |
Table 31 and Chart 16 show that, for both sexes over the period 1999 to 2019, the gap between the life expectancies at age 65 of OAS beneficiaries born outside Canada and those born in Canada has increased. In 1999, the differential by place of birth was 1.5 years for males and 0.9 of a year for females. By 2019, the differential by place of birth for males was 2.3 years and 2.2 years for females.
| Year | Males | Females | ||||
|---|---|---|---|---|---|---|
| Born Outside Canada | Born In Canada | Difference Born Outside – In Canada | Born Outside Canada | Born In Canada | Difference Born Outside – In Canada | |
| 1999 | 17.2 | 15.7 | 1.5 | 20.6 | 19.7 | 0.9 |
| 2000 | 17.7 | 16.1 | 1.6 | 20.8 | 19.9 | 0.9 |
| 2001 | 17.8 | 16.3 | 1.5 | 21.2 | 19.9 | 1.3 |
| 2002 | 18.1 | 16.4 | 1.7 | 21.2 | 20.0 | 1.2 |
| 2003 | 18.1 | 16.6 | 1.5 | 21.4 | 20.1 | 1.3 |
| 2004 | 18.6 | 16.9 | 1.7 | 21.7 | 20.3 | 1.4 |
| 2005 | 18.6 | 17.0 | 1.6 | 21.7 | 20.3 | 1.4 |
| 2006 | 19.0 | 17.3 | 1.7 | 22.0 | 20.6 | 1.4 |
| 2007 | 19.0 | 17.3 | 1.7 | 22.1 | 20.6 | 1.5 |
| 2008 | 19.2 | 17.5 | 1.7 | 22.1 | 20.7 | 1.4 |
| 2009 | 19.5 | 17.7 | 1.8 | 22.5 | 20.9 | 1.6 |
| 2010 | 19.7 | 18.0 | 1.7 | 22.5 | 21.0 | 1.5 |
| 2011 | 19.9 | 18.1 | 1.8 | 22.7 | 21.1 | 1.6 |
| 2012 | 20.1 | 18.3 | 1.8 | 23.0 | 21.2 | 1.8 |
| 2013 | 20.2 | 18.4 | 1.8 | 23.1 | 21.3 | 1.8 |
| 2014 | 20.3 | 18.4 | 1.9 | 23.2 | 21.3 | 1.9 |
| 2015 | 20.4 | 18.4 | 2.0 | 23.3 | 21.3 | 2.0 |
| 2016 | 20.6 | 18.5 | 2.1 | 23.4 | 21.5 | 1.9 |
| 2017 | 20.4 | 18.5 | 1.9 | 23.4 | 21.4 | 2.0 |
| 2018 | 20.6 | 18.4 | 2.2 | 23.4 | 21.3 | 2.1 |
| 2019 | 20.8 | 18.4 | 2.4 | 23.6 | 21.4 | 2.2 |
Chart 16 - Evolution of OAS Beneficiary Life Expectancies at Age 65 by Place of Birth (1999-2019)
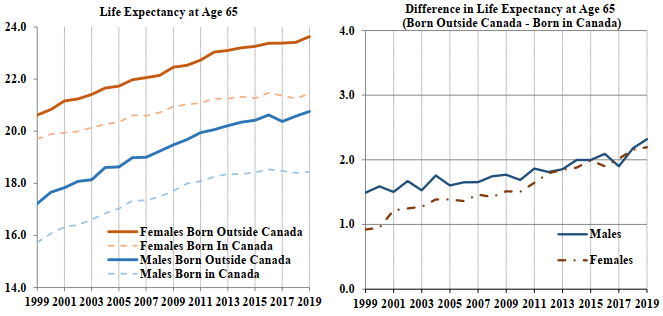
Chart Description
Two line charts. Chart 16(i) (left chart) showing the life expectancy at age 65 by place of birth for males and females. The Y axis for Chart 16(i) shows the life expectancy at age 65 and the X axis shows the year.
Chart 16(ii) (right chart) showing the difference in life expectancy at age 65 between females and males by place of birth. The Y axis for Chart 16(ii) shows the difference in years and the X axis shows the year.
Chart 16(i)
For year 1999, the males’ life expectancy at age 65 for OAS beneficiaries who were born outside of Canada was 17.2 years and 15.7 years for males OAS beneficiaries who were born in Canada. The females’ life expectancy at age 65 for OAS beneficiaries who were born outside of Canada was 20.6 years and 19.7 years for males OAS beneficiaries who were born in Canada.
For year 2004, the males’ life expectancy at age 65 for OAS beneficiaries who were born outside of Canada was 18.6 years and 16.9 years for males OAS beneficiaries who were born in Canada. The females’ life expectancy at age 65 for OAS beneficiaries who were born outside of Canada was 21.7 years and 20.3 years for males OAS beneficiaries who were born in Canada.
For year 2009, the males’ life expectancy at age 65 for OAS beneficiaries who were born outside of Canada was 19.5 years and 17.7 years for males OAS beneficiaries who were born in Canada. The females’ life expectancy at age 65 for OAS beneficiaries who were born outside of Canada was 22.5 years and 20.9 years for males OAS beneficiaries who were born in Canada.
For year 2014, the males’ life expectancy at age 65 for OAS beneficiaries who were born outside of Canada was 20.3 years and 18.4 years for males OAS beneficiaries who were born in Canada. The females’ life expectancy at age 65 for OAS beneficiaries who were born outside of Canada was 23.2 years and 21.3 years for males OAS beneficiaries who were born in Canada.
For year 2019, the males’ life expectancy at age 65 for OAS beneficiaries who were born outside of Canada was 20.8 years and 18.4 years for males OAS beneficiaries who were born in Canada. The females’ life expectancy at age 65 for OAS beneficiaries who were born outside of Canada was 23.6 years and 21.4 years for males OAS beneficiaries who were born in Canada.
Chart 16(ii)
For year 1999, the males’ difference in life expectancy at age 65 for OAS beneficiaries born outside Canada and those OAS beneficiaries born in Canada was 1.5 years. The females’ difference in life expectancy at age 65 for OAS beneficiaries born outside Canada and those OAS beneficiaries born in Canada was 0.9 years.
For year 2004, the males’ difference in life expectancy at age 65 for OAS beneficiaries born outside Canada and those OAS beneficiaries born in Canada was 1.7 years. The females’ difference in life expectancy at age 65 for OAS beneficiaries born outside Canada and those OAS beneficiaries born in Canada was 1.4 years.
For year 2009, the males’ difference in life expectancy at age 65 for OAS beneficiaries born outside Canada and those OAS beneficiaries born in Canada was 1.8 years. The females’ difference in life expectancy at age 65 for OAS beneficiaries born outside Canada and those OAS beneficiaries born in Canada was 1.6 years.
For year 2014, for males and females the difference in life expectancy at age 65 for OAS beneficiaries born outside Canada and those OAS beneficiaries born in Canada was 1.9 years.
For year 2019, the males’ difference in life expectancy at age 65 for OAS beneficiaries born outside Canada and those OAS beneficiaries born in Canada was 2.4 years. The females’ difference in life expectancy at age 65 for OAS beneficiaries born outside Canada and those OAS beneficiaries born in Canada was 2.2 years.
7. OAS Beneficiary Mortality Improvement Rates
Historical average annual mortality improvement rates measure the pace of change in mortality over time. The improvement in mortality indicates that mortality rates have decreased over time, which in turn has led to increased longevity. Mortality improvement rates may be used to formulate assumptions about how mortality and consequently life expectancies may evolve in the future.
7.1 Evolution of OAS Beneficiary Mortality Improvement Rates
Table 32 and Chart 17 compare OAS beneficiary mortality improvement rates experienced over the years 2000 to 2014 to those experienced over the more recent years from 2015 to 2019
The average annual mortality improvement rate for males in the age group 65 to 74 over the years 2000 to 2014 is 2.7%, and this compares to a lower level of 1.0% over the more recent years 2015 to 2019. In comparison, for the same age group, the average annual mortality improvement rate for females is 1.9% over the years 2000 to 2014, which compares to a lower level of 1.0% over the more recent years 2015 to 2019.
For the age group 75 to 89, the average annual mortality improvement rates experienced over the years 2000 to 2014 are 2.4% for males and 1.7% for females. These rates are higher than the experience over the more recent years 2015 to 2019 (1.3% and 0.9% for males and females, respectively).
For both male and female beneficiaries, the average annual mortality improvement rates over the period 2015 to 2019 are lower than the rates over the period 2000 to 2014.
Overall, the average annual mortality improvement rates over the period 2015 to 2019 are 1.0% and 0.7% males and females, respectively
| Age Group | 2000-2014(Footnote *, Footnote **) | 2015-2019(Footnote *, Footnote **) | 2000-2019(Footnote *, Footnote **) | |||
|---|---|---|---|---|---|---|
| Males | Females | Males | Females | Males | Females | |
| 65-69 | 2.6% | 1.9% | 0.6% | 0.4% | 2.0% | 1.6% |
| 70-74 | 2.8% | 1.8% | 1.3% | 1.3% | 2.4% | 1.6% |
| 75-79 | 2.8% | 2.0% | 1.4% | 0.8% | 2.5% | 1.7% |
| 80-84 | 2.4% | 1.7% | 1.5% | 1.1% | 2.2% | 1.6% |
| 85-89 | 1.8% | 1.6% | 1.0% | 1.0% | 1.6% | 1.5% |
| 90-94 | 1.1% | 1.1% | 0.5% | 0.1% | 1.0% | 1.0% |
| 95-99 | 0.8% | 0.7% | -0.5% | 0.2% | 0.6% | 0.7% |
| 100+ | 0.3% | 0.6% | -0.9% | 0.2% | 0.4% | 0.4% |
| Total | 2.2% | 1.5% | 1.0% | 0.7% | 2.0% | 1.3% |
| 65-74 | 2.7% | 1.9% | 1.0% | 1.0% | 2.3% | 1.6% |
| 75-89 | 2.4% | 1.7% | 1.3% | 0.9% | 2.1% | 1.6% |
Table 32 Footnotes
|
||||||
Chart 17 - OAS Beneficiary Mortality Improvement Rates - Males
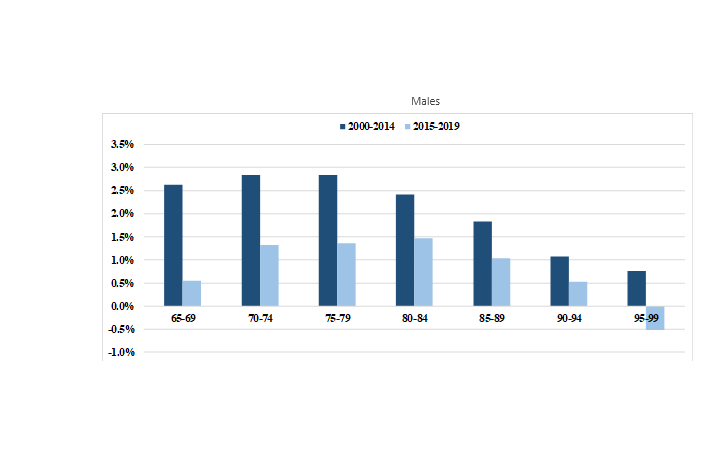
Chart Description
Two vertical bar charts showing the mortality improvement rates over the period 2000-2014 and over the period 2015-2019. Chart 17(i) (top chart) are male mortality improvement rates and Chart 17(ii) (bottom chart) for female mortality improvement rates. The Y axis shows the average level of the mortality improvement rates over the respective periods and the X axis shows by age-group.
Chart 17(i)
For age-group 65-69, the male mortality improvement rates over the period 2000-2014 was 2.6% and 0.6% over the period from 2015-2019.
For age-group 70-74, the male mortality improvement rates over the period 2000-2014 was 2.8% and 1.3% over the period from 2015-2019.
For age-group 75-79, the male mortality improvement rates over the period 2000-2014 was 2.8% and 1.4% over the period from 2015-2019.
For age-group 80-84, the male mortality improvement rates over the period 2000-2014 was 2.4% and 1.5% over the period from 2015-2019.
For age-group 85-89, the male mortality improvement rates over the period 2000-2014 was 1.8% and 1.0% over the period from 2015-2019.
For age-group 90-94, the male mortality improvement rates over the period 2000-2014 was 1.1% and 0.5% over the period from 2015-2019.
For age-group 95-99, the male mortality improvement rates over the period 2000-2014 was 0.8% and -0.5% over the period from 2015-2019.
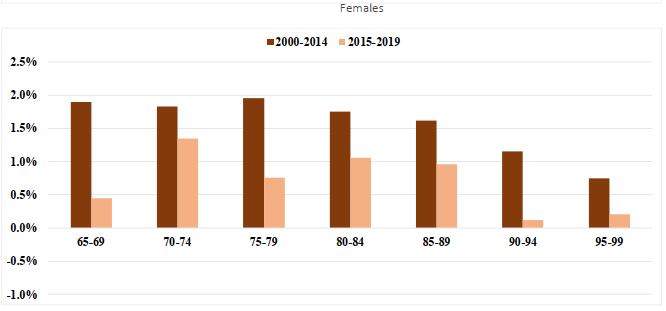
Chart Description
Chart 17(ii)
For age-group 65-69, the female mortality improvement rates over the period 2000-2014 was 1.9% and 0.4% over the period from 2015-2019.
For age-group 70-74, the female mortality improvement rates over the period 2000-2014 was 1.8% and 1.3% over the period from 2015-2019.
For age-group 75-79, the female mortality improvement rates over the period 2000-2014 was 2.0% and 0.8% over the period from 2015-2019.
For age-group 80-84, the female mortality improvement rates over the period 2000-2014 was 1.7% and 1.1% over the period from 2015-2019.
For age-group 85-89, the female mortality improvement rates over the period 2000-2014 was 1.6% and 1.0% over the period from 2015-2019.
For age-group 90-94, the female mortality improvement rates over the period 2000-2014 was 1.1% and 0.1% over the period from 2015-2019.
For age-group 95-99, the female mortality improvement rates over the period 2000-2014 was 0.7% and 0.2% over the period from 2015-2019.
7.1.1 Comparison of OAS Beneficiary and Population Mortality Improvements
Table 33 compares the OAS beneficiary average annual mortality improvement rates with those of the population of Canada. For the years 2000 to 2019, mortality improvement rates of OAS beneficiaries for both sexes and most age groups are similar to those observed for the general population.
Over the period 2015 to 2019, the overall mortality improvement rate for male beneficiaries is 1.0%, which is similar to that for the general population. The corresponding mortality improvement rates for female beneficiaries and the population are 0.7% and 0.6%, respectively.
| Age Group | Males | Females | ||||||
|---|---|---|---|---|---|---|---|---|
| 2000-2014 | 2015-2019 | 2000-2014 | 2015-2019 | |||||
| OAS | PopulationFootnote * | OAS | PopulationFootnote * | OAS | PopulationFootnote * | OAS | PopulationFootnote * | |
| 65-69 | 2.6% | 2.6% | 0.6% | 1.1% | 1.9% | 1.3% | 0.4% | 1.1% |
| 70-74 | 2.8% | 2.7% | 1.3% | 1.1% | 1.8% | 0.9% | 1.3% | 0.9% |
| 75-79 | 2.8% | 2.6% | 1.4% | 1.0% | 2.0% | 0.5% | 0.8% | 0.8% |
| 80-84 | 2.4% | 2.6% | 1.5% | 1.0% | 1.7% | 1.1% | 1.1% | 0.6% |
| 85-89 | 1.8% | 2.2% | 1.0% | 0.9% | 1.6% | 1.7% | 1.0% | 0.5% |
| 90-94 | 1.1% | 1.4% | 0.5% | 0.8% | 1.1% | 1.6% | 0.1% | 0.4% |
| 95-99 | 0.8% | 0.7% | -0.5% | 0.8% | 0.7% | 0.4% | 0.2% | 0.8% |
| 100+ | 0.3% | 0.3% | -0.9% | 0.7% | 0.6% | 0.0% | 0.2% | 0.8% |
| Total | 2.2% | 2.4% | 1.0% | 1.0% | 1.5% | 1.2% | 0.7% | 0.6% |
| 65-74 | 2.7% | 2.7% | 1.0% | 1.1% | 1.9% | 1.1% | 1.0% | 1.0% |
| 75-89 | 2.4% | 2.5% | 1.3% | 1.0% | 1.7% | 1.2% | 0.9% | 0.6% |
Table 33 Footnote
|
||||||||
7.1.2 Mortality Improvement Rates by Type of Benefit
Table 34, Table 35 and Chart 18 show mortality improvement rates for two periods, 2000 to 2014 and 2015 to 2019 by age group, sex, and type of benefit received. For both sexes, mortality improvements for GIS beneficiaries have generally been lower than for OAS beneficiaries not receiving the GIS. For example, over the years 2015 to 2019, for ages 65 to 74, GIS beneficiaries experienced average annual mortality improvement rates of 0.6% for males and 0.2% for females, which compare to average annual improvement rates of 1.5% for males and females not receiving the GIS.
Comparing two periods 2000 to 2014 and 2015 to 2019, mortality improvement rates are generally lower in 2015 to 2019 by age group, sex and type of benefits received. For example, over the years 2015 to 2019, for ages 65 to 74, GIS beneficiaries experienced average annual mortality improvement rates of 0.6% for males and 0.2% for females, which compare to average annual improvement rates of 2.0% for males and 1.4% for females not receiving the GIS during years 2000-2014.
| Age Group | Males | Females | ||||||
|---|---|---|---|---|---|---|---|---|
| Overall OAS | without GIS | with GIS | Difference | Overall OAS | without GIS | with GIS | Difference | |
| 65-69 | 2.6% | 2.8% | 1.7% | 1.1% | 1.9% | 2.1% | 1.2% | 0.9% |
| 70-74 | 2.8% | 3.3% | 2.2% | 1.1% | 1.8% | 2.0% | 1.5% | 0.5% |
| 75-79 | 2.8% | 3.1% | 2.5% | 0.6% | 2.0% | 2.1% | 1.8% | 0.3% |
| 80-84 | 2.4% | 2.5% | 2.3% | 0.2% | 1.7% | 1.8% | 1.5% | 0.3% |
| 85-89 | 1.8% | 1.8% | 1.7% | 0.1% | 1.6% | 1.7% | 1.4% | 0.3% |
| 90-94 | 1.1% | 0.8% | 1.2% | -0.4% | 1.1% | 1.3% | 1.0% | 0.3% |
| 95-99 | 0.8% | 0.5% | 1.1% | -0.6% | 0.7% | 0.9% | 0.7% | 0.2% |
| Total | 2.2% | 2.4% | 2.0% | 0.4% | 1.5% | 1.7% | 1.3% | 0.4% |
| 65-74 | 2.7% | 3.1% | 2.0% | 1.1% | 1.9% | 2.0% | 1.4% | 0.6% |
| 75-89 | 2.4% | 2.5% | 2.2% | 0.3% | 1.7% | 1.9% | 1.5% | 0.4% |
| Age Group | Males | Females | ||||||
|---|---|---|---|---|---|---|---|---|
| Overall OAS | without GIS | with GIS | Difference | Overall OAS | without GIS | with GIS | Difference | |
| 65-69 | 0.6% | 1.2% | 0.1% | 1.1% | 0.4% | 1.1% | -0.5% | 1.6% |
| 70-74 | 1.3% | 1.7% | 0.9% | 0.8% | 1.3% | 1.8% | 0.6% | 1.2% |
| 75-79 | 1.4% | 1.7% | 0.8% | 0.9% | 0.8% | 1.4% | 0.0% | 1.4% |
| 80-84 | 1.5% | 1.8% | 1.2% | 0.6% | 1.1% | 1.2% | 1.0% | 0.2% |
| 85-89 | 1.0% | 0.9% | 1.4% | -0.5% | 1.0% | 1.4% | 0.6% | 0.8% |
| 90-94 | 0.5% | 0.7% | 0.3% | 0.4% | 0.1% | 0.0% | 0.2% | -0.2% |
| 95-99 | -0.5% | -0.2% | -0.9% | 0.7% | 0.2% | 0.8% | -0.2% | 1.0% |
| Total | 1.0% | 1.3% | 0.8% | 0.5% | 0.7% | 1.1% | 0.3% | 0.8% |
| 65-74 | 1.0% | 1.5% | 0.6% | 0.9% | 1.0% | 1.5% | 0.2% | 1.3% |
| 75-89 | 1.3% | 1.5% | 1.1% | 0.4% | 0.9% | 1.3% | 0.6% | 0.7% |
As mortality improvement rates have been lower for those receiving the GIS, the gap in life expectancies at age 65 between those with and without GIS has increased over the years 2000 to 2019 (as shown earlier in Table 16).
Chart 18 - OAS Mortality Improvement Rates by Type of Benefit
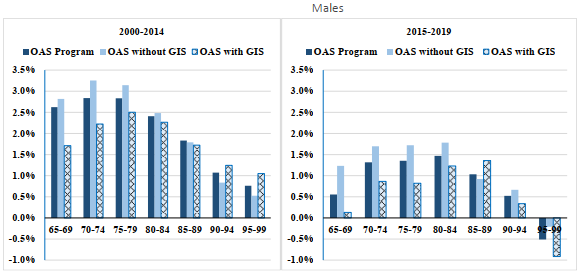
Chart Description
Four vertical bar charts showing the average mortality improvement rates by type of benefit over the periods 2000-2014 and 2015-2019 for males and then for females.
Chart 18 (i) (top left chart) are males mortality improvement rates over the period 2000-2014.
Chart 18 (ii) (top right chart) are males mortality improvement rates over the period 2015-2019.
Chart 18 (iii) (bottom left chart) are females mortality improvement rates over the period 2000-2014.
Chart 18 (iv) (bottom right chart) are females mortality improvement rates over the period 2015-2019.
The Y axis shows the average level of the mortality improvement rates and the X axis shows by age-group.
Chart 18 (i)
For age-group 65-69, the male mortality improvement rates over the period 2000-2014 was 2.6% for OAS beneficiaries, 2.8% for OAS beneficiaries without GIS and 1.7% for OAS beneficiaries with GIS.
For age-group 70-74, the male mortality improvement rates over the period 2000-2014 was 2.8% for OAS beneficiaries, 3.3% for OAS beneficiaries without GIS and 2.3% for OAS beneficiaries with GIS.
For age-group 75-79, the male mortality improvement rates over the period 2000-2014 was 2.8% for OAS beneficiaries, 3.1% for OAS beneficiaries without GIS and 2.5% for OAS beneficiaries with GIS.
For age-group 80-84, the male mortality improvement rates over the period 2000-2014 was 2.4% for OAS beneficiaries, 2.5% for OAS beneficiaries without GIS and 2.3% for OAS beneficiaries with GIS.
For age-group 85-89, the male mortality improvement rates over the period 2000-2014 was 1.8% for OAS beneficiaries, 1.8% for OAS beneficiaries without GIS and 1.7% for OAS beneficiaries with GIS.
For age-group 90-94, the male mortality improvement rates over the period 2000-2014 was 1.1% for OAS beneficiaries, 0.9% for OAS beneficiaries without GIS and 1.3% for OAS beneficiaries with GIS.
For age-group 95-99, the male mortality improvement rates over the period 2000-2014 was 0.8% for OAS beneficiaries, 0.5% for OAS beneficiaries without GIS and 1.1% for OAS beneficiaries with GIS.
Chart 18 (ii)
For age-group 65-69, the male mortality improvement rates over the period 2015-2019 was 0.6% for OAS beneficiaries, 1.3% for OAS beneficiaries without GIS and 0.1% for OAS beneficiaries with GIS.
For age-group 70-74, the male mortality improvement rates over the period 2015-2019 was 1.3% for OAS beneficiaries, 1.7% for OAS beneficiaries without GIS and 0.9% for OAS beneficiaries with GIS.
For age-group 75-79, the male mortality improvement rates over the period 2015-2019 was 1.4% for OAS beneficiaries, 1.7% for OAS beneficiaries without GIS and 0.8% for OAS beneficiaries with GIS.
For age-group 80-84, the male mortality improvement rates over the period 2015-2019 was 1.5% for OAS beneficiaries, 1.8% for OAS beneficiaries without GIS and 1.2% for OAS beneficiaries with GIS.
For age-group 85-89, the male mortality improvement rates over the period 2015-2019 was 1.0% for OAS beneficiaries, 0.9% for OAS beneficiaries without GIS and 1.4% for OAS beneficiaries with GIS.
For age-group 90-94, the male mortality improvement rates over the period 2015-2019 was 0.5% for OAS beneficiaries, 0.6% for OAS beneficiaries without GIS and 0.4% for OAS beneficiaries with GIS.
For age-group 95-99, the male mortality improvement rates over the period 2015-2019 was -0.5% for OAS beneficiaries, -0.2% for OAS beneficiaries without GIS and -0.9% for OAS beneficiaries with GIS.
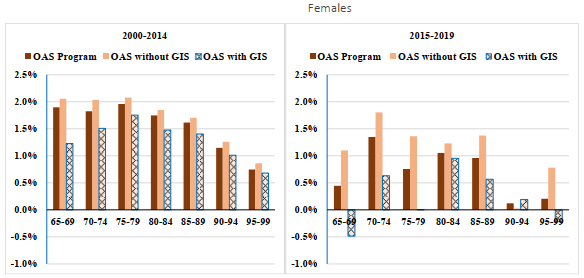
Chart Description
Chart 18 (iii)
For age-group 65-69, the female mortality improvement rates over the period 2000-2014 was 1.9% for OAS beneficiaries, 2.0% for OAS beneficiaries without GIS and 1.2% for OAS beneficiaries with GIS.
For age-group 70-74, the female mortality improvement rates over the period 2000-2014 was 1.8% for OAS beneficiaries, 2.0% for OAS beneficiaries without GIS and 1.5% for OAS beneficiaries with GIS.
For age-group 75-79, the female mortality improvement rates over the period 2000-2014 was 2.0% for OAS beneficiaries, 2.1% for OAS beneficiaries without GIS and 1.8% for OAS beneficiaries with GIS.
For age-group 80-84, the female mortality improvement rates over the period 2000-2014 was 1.7% for OAS beneficiaries, 1.8% for OAS beneficiaries without GIS and 1.5% for OAS beneficiaries with GIS.
For age-group 85-89, the female mortality improvement rates over the period 2000-2014 was 1.6% for OAS beneficiaries, 1.7% for OAS beneficiaries without GIS and 1.4% for OAS beneficiaries with GIS.
For age-group 90-94, the female mortality improvement rates over the period 2000-2014 was 1.1% for OAS beneficiaries, 1.2% for OAS beneficiaries without GIS and 1.0% for OAS beneficiaries with GIS.
For age-group 95-99, the female mortality improvement rates over the period 2000-2014 was 0.7% for OAS beneficiaries, 0.8% for OAS beneficiaries without GIS and 0.6% for OAS beneficiaries with GIS.
Chart 18 (iv)
For age-group 65-69, the female mortality improvement rates over the period 2015-2019 was 0.4% for OAS beneficiaries, 1.1% for OAS beneficiaries without GIS and -0.5% for OAS beneficiaries with GIS.
For age-group 70-74, the female mortality improvement rates over the period 2015-2019 was 1.3% for OAS beneficiaries, 1.8% for OAS beneficiaries without GIS and 0.7% for OAS beneficiaries with GIS.
For age-group 75-79, the female mortality improvement rates over the period 2015-2019 was 0.8% for OAS beneficiaries, 1.4% for OAS beneficiaries without GIS and 0.0% for OAS beneficiaries with GIS.
For age-group 80-84, the female mortality improvement rates over the period 2015-2019 was 1.1% for OAS beneficiaries, 1.3% for OAS beneficiaries without GIS and 1.0% for OAS beneficiaries with GIS.
For age-group 85-89, the female mortality improvement rates over the period 2015-2019 was 1.0% for OAS beneficiaries, 1.4% for OAS beneficiaries without GIS and 0.6% for OAS beneficiaries with GIS.
For age-group 90-94, the female mortality improvement rates over the period 2015-2019 was 0.1% for OAS beneficiaries, 0.0% for OAS beneficiaries without GIS and 0.2% for OAS beneficiaries with GIS.
For age-group 95-99, the female mortality improvement rates over the period 2015-2019 was 0.2% for OAS beneficiaries, 0.8% for OAS beneficiaries without GIS and -0.2% for OAS beneficiaries with GIS.
8. Conclusion
In general, this study confirms the results that were obtained by the previous OAS program mortality studies. The analysis by type of benefit received shows that beneficiaries who do not receive the GIS experience lower mortality compared to those who receive the GIS. The analysis by marital status shows that beneficiaries who are married experience lower mortality than single beneficiaries. The analysis by place of birth shows that beneficiaries who were born outside Canada experience lower mortality than those born in Canada.
The study also reveals that mortality improvement rates over the recent years from 2015 to 2019 have been generally lower than improvement rates experienced over the previous 15 year period from 2000 to 2014.
Appendix A ― Annex ― Detailed Tables by Year, Age and Sex
| Age | Males | Females | ||||
|---|---|---|---|---|---|---|
| 1999 | 2009 | 2019 | 1999 | 2009 | 2019 | |
| 65 | 103,063 | 139,772 | 185,891 | 110,688 | 148,816 | 202,126 |
| 66 | 105,010 | 141,398 | 187,281 | 111,178 | 149,533 | 205,253 |
| 67 | 106,802 | 133,824 | 183,329 | 114,134 | 141,464 | 200,194 |
| 68 | 103,979 | 123,116 | 177,652 | 113,601 | 131,935 | 194,361 |
| 69 | 103,007 | 117,006 | 174,755 | 113,287 | 126,896 | 191,032 |
| 70 | 94,657 | 110,284 | 174,162 | 107,661 | 120,507 | 189,626 |
| 71 | 92,102 | 106,344 | 170,408 | 106,877 | 116,798 | 185,624 |
| 72 | 87,359 | 98,781 | 173,352 | 104,404 | 110,658 | 188,439 |
| 73 | 83,423 | 95,946 | 155,009 | 102,978 | 107,789 | 169,686 |
| 74 | 78,754 | 91,563 | 131,367 | 101,568 | 105,076 | 144,560 |
| 75 | 73,673 | 86,947 | 125,625 | 98,657 | 101,677 | 139,611 |
| 76 | 68,316 | 83,329 | 119,255 | 94,419 | 98,154 | 133,865 |
| 77 | 64,497 | 81,722 | 109,090 | 92,112 | 98,432 | 124,101 |
| 78 | 59,860 | 76,692 | 97,305 | 87,879 | 95,802 | 113,268 |
| 79 | 55,120 | 73,417 | 89,818 | 83,824 | 93,320 | 107,252 |
| 80 | 42,631 | 64,504 | 81,958 | 67,444 | 86,145 | 99,576 |
| 81 | 38,781 | 60,063 | 75,858 | 64,237 | 82,818 | 93,890 |
| 82 | 34,344 | 53,963 | 67,906 | 58,534 | 78,562 | 86,627 |
| 83 | 30,857 | 48,486 | 63,155 | 54,740 | 74,125 | 81,631 |
| 84 | 27,914 | 43,049 | 56,792 | 51,661 | 69,934 | 76,374 |
| 85 | 24,741 | 37,291 | 50,722 | 47,762 | 64,727 | 70,696 |
| 86 | 20,254 | 31,927 | 45,537 | 41,485 | 58,731 | 65,078 |
| 87 | 17,027 | 27,625 | 41,177 | 36,148 | 53,610 | 61,584 |
| 88 | 13,093 | 23,423 | 35,672 | 30,011 | 47,260 | 56,137 |
| 89 | 10,642 | 19,096 | 30,632 | 25,979 | 41,737 | 50,808 |
| 90 | 8,389 | 12,995 | 24,073 | 21,475 | 30,676 | 43,072 |
| 91 | 6,663 | 10,228 | 19,652 | 17,948 | 26,285 | 37,586 |
| 92 | 5,025 | 7,912 | 15,442 | 14,290 | 21,068 | 32,368 |
| 93 | 3,560 | 5,976 | 11,771 | 11,108 | 17,301 | 26,789 |
| 94 | 2,516 | 4,587 | 8,866 | 8,636 | 14,304 | 22,152 |
| 95 | 1,828 | 3,349 | 6,400 | 6,375 | 11,177 | 17,762 |
| 96 | 1,322 | 2,361 | 4,422 | 4,882 | 8,085 | 13,529 |
| 97 | 845 | 1,494 | 3,103 | 3,518 | 5,933 | 10,388 |
| 98 | 562 | 911 | 2,000 | 2,409 | 4,014 | 7,330 |
| 99 | 364 | 585 | 1290 | 1,695 | 2,734 | 5,221 |
| 100 | 231 | 350 | 694 | 1,101 | 1,803 | 3,085 |
| 101 | 116 | 205 | 409 | 721 | 1175 | 2,037 |
| 102 | 84 | 134 | 225 | 427 | 665 | 1211 |
| 103 | 48 | 60 | 129 | 278 | 384 | 775 |
| 104 | 26 | 39 | 83 | 136 | 230 | 509 |
| 105+ | 18 | 28 | 96 | 176 | 305 | 594 |
| Total | 1,571,503 | 2,020,782 | 2,902,363 | 2,116,443 | 2,550,645 | 3,455,807 |
| Age | Males | Females | ||||
|---|---|---|---|---|---|---|
| 1999 | 2009 | 2019 | 1999 | 2009 | 2019 | |
| 65 | 1,791 | 1,827 | 2,288 | 1,029 | 1,164 | 1,453 |
| 66 | 2,147 | 2,070 | 2,543 | 1,347 | 1,341 | 1,719 |
| 67 | 2,285 | 2,132 | 2,608 | 1,416 | 1,368 | 1,764 |
| 68 | 2,519 | 2,282 | 2,770 | 1,475 | 1,440 | 1,882 |
| 69 | 2,799 | 2,291 | 2,978 | 1,632 | 1,438 | 2,078 |
| 70 | 2,876 | 2,333 | 3,227 | 1,732 | 1,615 | 2,181 |
| 71 | 3,033 | 2,320 | 3,425 | 1,910 | 1,670 | 2,423 |
| 72 | 3,040 | 2,491 | 3,706 | 2,018 | 1,825 | 2,722 |
| 73 | 3,284 | 2,734 | 3,487 | 2,365 | 1,889 | 2,471 |
| 74 | 3,452 | 2,823 | 3,474 | 2,479 | 2,115 | 2,510 |
| 75 | 3,597 | 3,008 | 3,472 | 2,651 | 2,196 | 2,657 |
| 76 | 3,638 | 3,295 | 3,746 | 2,791 | 2,395 | 2,762 |
| 77 | 3,777 | 3,560 | 3,756 | 3,050 | 2,700 | 2,844 |
| 78 | 3,830 | 3,694 | 3,797 | 3,284 | 2,920 | 3,124 |
| 79 | 3,704 | 3,812 | 3,869 | 3,460 | 3,088 | 3,150 |
| 80 | 3,343 | 3,822 | 3,989 | 3,284 | 3,369 | 3,283 |
| 81 | 3,484 | 4,019 | 4,036 | 3,228 | 3,660 | 3,454 |
| 82 | 3,252 | 3,887 | 4,146 | 3,417 | 3,835 | 3,696 |
| 83 | 3,317 | 4,015 | 4,329 | 3,635 | 4,026 | 3,950 |
| 84 | 3,424 | 3,971 | 4,283 | 3,996 | 4,389 | 4,217 |
| 85 | 3,242 | 3,837 | 4,396 | 4,086 | 4,507 | 4,264 |
| 86 | 2,943 | 3,732 | 4,584 | 3,908 | 4,632 | 4,661 |
| 87 | 2,636 | 3,552 | 4,474 | 3,687 | 4,747 | 4,818 |
| 88 | 2,316 | 3,237 | 4,614 | 3,654 | 4,700 | 5,112 |
| 89 | 2,055 | 2,887 | 4,222 | 3,481 | 4,640 | 5,174 |
| 90 | 1,765 | 2,267 | 3,843 | 3,158 | 3,952 | 5,229 |
| 91 | 1,450 | 2,143 | 3,581 | 2,983 | 3,700 | 5,129 |
| 92 | 1,226 | 1,722 | 3,027 | 2,625 | 3,569 | 4,952 |
| 93 | 910 | 1,519 | 2,725 | 2325 | 3,093 | 4,602 |
| 94 | 790 | 1,184 | 2,184 | 1942 | 2,865 | 4,308 |
| 95 | 564 | 898 | 1,774 | 1670 | 2501 | 3,763 |
| 96 | 463 | 728 | 1401 | 1298 | 2026 | 3251 |
| 97 | 313 | 483 | 1052 | 1043 | 1613 | 2787 |
| 98 | 218 | 330 | 743 | 777 | 1248 | 2163 |
| 99 | 156 | 279 | 508 | 569 | 859 | 1668 |
| 100 | 80 | 144 | 262 | 421 | 655 | 1142 |
| 101 | 71 | 107 | 211 | 318 | 427 | 719 |
| 102 | 24 | 52 | 111 | 194 | 287 | 533 |
| 103 | 13 | 36 | 72 | 122 | 176 | 370 |
| 104 | 12 | 19 | 46 | 89 | 112 | 242 |
| 105+ | 17 | 24 | 52 | 112 | 157 | 332 |
| Total | 83,856 | 89,566 | 113,811 | 88,661 | 98,909 | 119,559 |
| Age | Males | Females | ||||
|---|---|---|---|---|---|---|
| 1999 | 2009 | 2019 | 1999 | 2009 | 2019 | |
| 65 | 102,373 | 139,907 | 192,186 | 107,807 | 146,855 | 205,066 |
| 66 | 107,365 | 140,631 | 192,060 | 113,765 | 147,789 | 206,882 |
| 67 | 107,113 | 130,173 | 183,961 | 114,445 | 137,657 | 199,345 |
| 68 | 104,679 | 122,717 | 179,467 | 113,966 | 131,627 | 195,099 |
| 69 | 100,831 | 114,681 | 176,705 | 111,759 | 124,148 | 191,613 |
| 70 | 94,777 | 110,072 | 174,830 | 107,989 | 119,858 | 189,547 |
| 71 | 91,805 | 104,392 | 173,182 | 106,953 | 115,015 | 187,440 |
| 72 | 86,701 | 98,167 | 170,925 | 104,366 | 109,716 | 185,460 |
| 73 | 83,021 | 95,567 | 144,360 | 103,616 | 107,772 | 157,836 |
| 74 | 78,097 | 90,875 | 130,717 | 101,386 | 104,590 | 143,562 |
| 75 | 72,994 | 86,642 | 125,045 | 98,014 | 100,689 | 138,907 |
| 76 | 68,016 | 84,367 | 117,193 | 94,414 | 99,829 | 131,548 |
| 77 | 64,579 | 81,238 | 105,482 | 92,406 | 98,388 | 120,491 |
| 78 | 58,550 | 76,837 | 96,572 | 86,256 | 96,123 | 113,295 |
| 79 | 52,679 | 71,406 | 87,851 | 80,507 | 91,770 | 105,079 |
| 80 | 41,675 | 64,278 | 81,533 | 66,755 | 86,163 | 98,951 |
| 81 | 38,095 | 59,494 | 74,482 | 62,613 | 82,983 | 92,744 |
| 82 | 34,140 | 53,064 | 67,540 | 58,599 | 78,147 | 85,894 |
| 83 | 30,930 | 48,019 | 62,668 | 55,008 | 74,397 | 81,742 |
| 84 | 28,168 | 42,291 | 56,186 | 52,046 | 69,608 | 76,050 |
| 85 | 24,140 | 36,726 | 50,545 | 46,817 | 64,157 | 70,142 |
| 86 | 20,058 | 31,619 | 45,942 | 40,804 | 58,511 | 66,132 |
| 87 | 16,203 | 27,404 | 40,812 | 35,007 | 53,389 | 61,555 |
| 88 | 12,956 | 22,623 | 35,588 | 29,703 | 46,367 | 56,416 |
| 89 | 10,513 | 18,040 | 29,744 | 25,447 | 39,955 | 49,902 |
| 90 | 8,237 | 12,534 | 23,769 | 21,218 | 30,041 | 43,122 |
| 91 | 6,551 | 10,058 | 19,508 | 17,596 | 25,395 | 37,934 |
| 92 | 4,786 | 7,738 | 15,118 | 13,957 | 21,037 | 32,122 |
| 93 | 3,434 | 5,929 | 11,631 | 10,988 | 17,196 | 26,936 |
| 94 | 2,485 | 4,548 | 8,719 | 8,344 | 14,234 | 22,152 |
| 95 | 1,819 | 3,245 | 6,284 | 6,447 | 10,790 | 17,552 |
| 96 | 1,263 | 2,271 | 4,388 | 4,715 | 7,918 | 13,570 |
| 97 | 808 | 1,426 | 3,084 | 3,426 | 5,738 | 10,332 |
| 98 | 554 | 881 | 1,980 | 2,373 | 3,928 | 7,183 |
| 99 | 353 | 590 | 1,244 | 1,654 | 2,641 | 5,017 |
| 100 | 218 | 337 | 646 | 1,078 | 1,761 | 3,033 |
| 101 | 126 | 215 | 413 | 707 | 1,084 | 1,955 |
| 102 | 71 | 120 | 216 | 428 | 666 | 1,252 |
| 103 | 41 | 63 | 140 | 260 | 364 | 789 |
| 104 | 19 | 38 | 89 | 139 | 240 | 499 |
| 105+ | 23 | 35 | 106 | 174 | 285 | 603 |
| Total | 1,561,247 | 2,001,255 | 2,892,910 | 2,103,951 | 2,528,823 | 3,434,749 |
| Age | Males Annual Deaths per Thousand |
Females Annual Deaths per Thousand |
||||
|---|---|---|---|---|---|---|
| 1999 | 2009 | 2019 | 1999 | 2009 | 2019 | |
| 65 | 17.5 | 13.1 | 12.0 | 10.1 | 8.0 | 7.2 |
| 66 | 19.5 | 14.7 | 13.0 | 11.0 | 8.9 | 8.0 |
| 67 | 21.7 | 16.2 | 14.1 | 12.1 | 9.8 | 8.8 |
| 68 | 24.1 | 17.8 | 15.4 | 13.3 | 10.8 | 9.7 |
| 69 | 26.7 | 19.3 | 16.7 | 14.5 | 11.9 | 10.7 |
| 70 | 29.4 | 21.0 | 18.1 | 16.0 | 13.2 | 11.7 |
| 71 | 32.3 | 22.9 | 19.7 | 17.7 | 14.5 | 12.9 |
| 72 | 35.5 | 25.2 | 21.5 | 19.6 | 16.0 | 14.2 |
| 73 | 39.1 | 27.8 | 23.5 | 21.7 | 17.7 | 15.6 |
| 74 | 42.9 | 30.8 | 25.8 | 24.1 | 19.6 | 17.2 |
| 75 | 47.2 | 34.2 | 28.4 | 26.7 | 21.7 | 19.0 |
| 76 | 51.9 | 38.1 | 31.3 | 29.7 | 24.1 | 21.2 |
| 77 | 57.1 | 42.3 | 34.7 | 33.1 | 26.9 | 23.6 |
| 78 | 62.9 | 47.0 | 38.4 | 36.9 | 30.1 | 26.3 |
| 79 | 69.4 | 52.2 | 42.7 | 41.3 | 33.7 | 29.4 |
| 80 | 76.6 | 58.0 | 47.5 | 46.1 | 37.8 | 33.0 |
| 81 | 84.5 | 64.5 | 52.9 | 51.6 | 42.5 | 37.0 |
| 82 | 93.3 | 71.7 | 59.1 | 57.8 | 47.7 | 41.6 |
| 83 | 102.9 | 79.9 | 66.2 | 64.9 | 53.6 | 46.8 |
| 84 | 113.4 | 89.0 | 74.3 | 72.8 | 60.2 | 52.9 |
| 85 | 124.6 | 99.1 | 83.6 | 81.7 | 67.8 | 59.8 |
| 86 | 136.6 | 110.2 | 94.1 | 91.5 | 76.3 | 67.7 |
| 87 | 149.4 | 122.5 | 106.0 | 102.3 | 86.0 | 76.9 |
| 88 | 162.8 | 135.8 | 119.2 | 114.2 | 96.9 | 87.3 |
| 89 | 177.0 | 150.3 | 133.8 | 127.0 | 108.9 | 99.0 |
| 90 | 191.8 | 165.7 | 149.7 | 140.9 | 122.2 | 112.0 |
| 91 | 207.2 | 182.0 | 166.8 | 155.8 | 136.6 | 126.4 |
| 92 | 223.3 | 199.0 | 185.1 | 171.7 | 152.1 | 141.9 |
| 93 | 239.7 | 216.7 | 204.3 | 188.3 | 168.6 | 158.7 |
| 94 | 256.5 | 234.9 | 224.4 | 205.8 | 186.1 | 176.5 |
| 95 | 273.5 | 253.7 | 245.0 | 224.1 | 204.6 | 195.4 |
| 96 | 290.6 | 273.1 | 266.2 | 243.0 | 223.8 | 215.1 |
| 97 | 307.6 | 293.1 | 287.6 | 262.6 | 243.7 | 235.6 |
| 98 | 325.8 | 314.0 | 309.7 | 282.9 | 264.2 | 256.6 |
| 99 | 345.2 | 335.7 | 332.5 | 303.9 | 285.1 | 278.0 |
| 100 | 365.4 | 358.0 | 355.8 | 325.6 | 306.6 | 299.7 |
| 101 | 386.5 | 380.8 | 379.4 | 348.0 | 328.4 | 321.5 |
| 102 | 408.0 | 404.0 | 403.2 | 370.5 | 350.7 | 344.0 |
| 103 | 430.0 | 427.3 | 427.1 | 393.1 | 373.4 | 366.9 |
| 104 | 452.3 | 450.6 | 450.9 | 415.5 | 396.4 | 390.1 |
| 105 | 474.6 | 473.8 | 474.4 | 437.7 | 419.3 | 413.3 |
| 110 | 581.0 | 582.2 | 583.3 | 540.4 | 528.5 | 524.8 |
| 115 | 663.3 | 664.0 | 664.6 | 616.7 | 612.6 | 611.3 |
| 120 | 700.0 | 700.0 | 700.0 | 650.0 | 650.0 | 650.0 |
| Age | Males | Females | ||||||
|---|---|---|---|---|---|---|---|---|
| lx | 1,000 qx | dx | LifExp | lx | 1,000 qx | dx | LifExp | |
| 65 | 100,000 | 12.0 | 1,197 | 19.41 | 100,000 | 7.2 | 725 | 22.21 |
| 66 | 98,803 | 13.0 | 1,285 | 18.64 | 99,275 | 8.0 | 795 | 21.37 |
| 67 | 97,519 | 14.1 | 1,378 | 17.88 | 98,480 | 8.8 | 869 | 20.54 |
| 68 | 96,141 | 15.4 | 1,476 | 17.13 | 97,611 | 9.7 | 947 | 19.71 |
| 69 | 94,664 | 16.7 | 1,579 | 16.39 | 96,665 | 10.7 | 1,030 | 18.90 |
| 70 | 93,085 | 18.1 | 1,688 | 15.66 | 95,634 | 11.7 | 1,120 | 18.10 |
| 71 | 91,397 | 19.7 | 1,804 | 14.94 | 94,514 | 12.9 | 1,217 | 17.31 |
| 72 | 89,593 | 21.5 | 1,928 | 14.23 | 93,298 | 14.2 | 1,321 | 16.53 |
| 73 | 87,665 | 23.5 | 2,062 | 13.53 | 91,976 | 15.6 | 1,435 | 15.76 |
| 74 | 85,603 | 25.8 | 2,208 | 12.85 | 90,542 | 17.2 | 1,558 | 15.00 |
| 75 | 83,395 | 28.4 | 2,366 | 12.17 | 88,983 | 19.0 | 1,695 | 14.25 |
| 76 | 81,029 | 31.3 | 2,537 | 11.51 | 87,288 | 21.2 | 1,847 | 13.52 |
| 77 | 78,492 | 34.7 | 2,721 | 10.87 | 85,442 | 23.6 | 2,014 | 12.80 |
| 78 | 75,771 | 38.4 | 2,912 | 10.24 | 83,428 | 26.3 | 2,196 | 12.10 |
| 79 | 72,859 | 42.7 | 3,111 | 9.63 | 81,232 | 29.4 | 2,391 | 11.41 |
| 80 | 69,748 | 47.5 | 3,313 | 9.04 | 78,842 | 33.0 | 2,599 | 10.74 |
| 81 | 66,435 | 52.9 | 3,517 | 8.46 | 76,242 | 37.0 | 2,820 | 10.09 |
| 82 | 62,919 | 59.1 | 3,721 | 7.91 | 73,422 | 41.6 | 3,053 | 9.46 |
| 83 | 59,198 | 66.2 | 3,920 | 7.38 | 70,369 | 46.8 | 3,296 | 8.85 |
| 84 | 55,278 | 74.3 | 4,109 | 6.86 | 67,073 | 52.9 | 3,545 | 8.26 |
| 85 | 51,170 | 83.6 | 4,277 | 6.37 | 63,528 | 59.8 | 3,797 | 7.69 |
| 86 | 46,892 | 94.1 | 4,413 | 5.91 | 59,731 | 67.7 | 4,045 | 7.15 |
| 87 | 42,479 | 106.0 | 4,501 | 5.47 | 55,686 | 76.9 | 4,280 | 6.63 |
| 88 | 37,978 | 119.2 | 4,526 | 5.06 | 51,406 | 87.3 | 4,486 | 6.15 |
| 89 | 33,452 | 133.8 | 4,475 | 4.68 | 46,919 | 99.0 | 4,645 | 5.68 |
| 90 | 28,978 | 149.7 | 4,337 | 4.32 | 42,274 | 112.0 | 4,737 | 5.25 |
| 91 | 24,641 | 166.8 | 4,110 | 4.00 | 37,537 | 126.4 | 4,744 | 4.85 |
| 92 | 20,531 | 185.1 | 3,800 | 3.70 | 32,794 | 141.9 | 4,655 | 4.48 |
| 93 | 16,731 | 204.3 | 3,418 | 3.42 | 28,139 | 158.7 | 4,465 | 4.14 |
| 94 | 13,312 | 224.4 | 2,987 | 3.17 | 23,674 | 176.5 | 4,179 | 3.83 |
| 95 | 10,325 | 245.0 | 2,530 | 2.94 | 19,495 | 195.4 | 3,809 | 3.54 |
| 96 | 7,795 | 266.2 | 2,075 | 2.74 | 15,687 | 215.1 | 3,374 | 3.28 |
| 97 | 5,720 | 287.6 | 1,645 | 2.55 | 12,313 | 235.6 | 2,900 | 3.05 |
| 98 | 4,075 | 309.7 | 1,262 | 2.37 | 9,412 | 256.6 | 2,415 | 2.83 |
| 99 | 2,813 | 332.5 | 935 | 2.22 | 6,997 | 278.0 | 1,945 | 2.64 |
| 100 | 1,878 | 355.8 | 668 | 2.07 | 5,052 | 299.7 | 1,514 | 2.46 |
| 101 | 1,210 | 379.4 | 459 | 1.94 | 3,538 | 321.5 | 1,137 | 2.30 |
| 102 | 751 | 403.2 | 303 | 1.82 | 2,400 | 344.0 | 826 | 2.15 |
| 103 | 448 | 427.1 | 191 | 1.71 | 1,575 | 366.9 | 578 | 2.01 |
| 104 | 257 | 450.9 | 116 | 1.61 | 997 | 390.1 | 389 | 1.89 |
| 105 | 141 | 474.4 | 67 | 1.52 | 608 | 413.3 | 251 | 1.77 |
| 110 | 4 | 583.3 | 2 | 1.18 | 28 | 524.8 | 15 | 1.35 |
| 115 | 0 | 664.6 | 0 | 0.99 | 0 | 611.3 | 0 | 1.12 |
| 120 | 0 | 700.0 | 0 | 0.80 | 0 | 650.0 | 0 | 0.85 |
| Age | Males | Females | ||||
|---|---|---|---|---|---|---|
| Annual Deaths Per Thousand | Ratio OAS to Population |
Annual Deaths Per Thousand | Ratio OAS to Population |
|||
| OAS | Population | OAS | Population | |||
| 65 | 12.0 | 10.8 | 1.11 | 7.2 | 6.9 | 1.05 |
| 66 | 13.0 | 11.9 | 1.09 | 8.0 | 7.6 | 1.06 |
| 67 | 14.1 | 13.1 | 1.08 | 8.8 | 8.4 | 1.05 |
| 68 | 15.4 | 14.4 | 1.07 | 9.7 | 9.2 | 1.05 |
| 69 | 16.7 | 15.9 | 1.05 | 10.7 | 10.2 | 1.04 |
| 70 | 18.1 | 17.5 | 1.04 | 11.7 | 11.3 | 1.03 |
| 71 | 19.7 | 19.3 | 1.02 | 12.9 | 12.5 | 1.03 |
| 72 | 21.5 | 21.3 | 1.01 | 14.2 | 13.9 | 1.02 |
| 73 | 23.5 | 23.5 | 1.00 | 15.6 | 15.5 | 1.01 |
| 74 | 25.8 | 25.9 | 0.99 | 17.2 | 17.2 | 1.00 |
| 75 | 28.4 | 28.7 | 0.99 | 19.0 | 19.1 | 1.00 |
| 76 | 31.3 | 31.7 | 0.99 | 21.2 | 21.3 | 0.99 |
| 77 | 34.7 | 35.1 | 0.99 | 23.6 | 23.7 | 0.99 |
| 78 | 38.4 | 38.9 | 0.99 | 26.3 | 26.5 | 0.99 |
| 79 | 42.7 | 43.1 | 0.99 | 29.4 | 29.6 | 0.99 |
| 80 | 47.5 | 47.8 | 0.99 | 33.0 | 33.1 | 1.00 |
| 81 | 52.9 | 53.1 | 1.00 | 37.0 | 37.1 | 1.00 |
| 82 | 59.1 | 59.0 | 1.00 | 41.6 | 41.6 | 1.00 |
| 83 | 66.2 | 65.5 | 1.01 | 46.8 | 46.6 | 1.00 |
| 84 | 74.3 | 72.9 | 1.02 | 52.9 | 52.4 | 1.01 |
| 85 | 83.6 | 81.1 | 1.03 | 59.8 | 58.9 | 1.01 |
| 86 | 94.1 | 90.3 | 1.04 | 67.7 | 66.3 | 1.02 |
| 87 | 106.0 | 100.6 | 1.05 | 76.9 | 74.7 | 1.03 |
| 88 | 119.2 | 112.2 | 1.06 | 87.3 | 84.2 | 1.04 |
| 89 | 133.8 | 125.2 | 1.07 | 99.0 | 95.1 | 1.04 |
| 90 | 149.7 | 139.7 | 1.07 | 112.0 | 107.5 | 1.04 |
| 91 | 166.8 | 155.7 | 1.07 | 126.4 | 121.3 | 1.04 |
| 92 | 185.1 | 172.7 | 1.07 | 141.9 | 136.2 | 1.04 |
| 93 | 204.3 | 190.7 | 1.07 | 158.7 | 152.3 | 1.04 |
| 94 | 224.4 | 209.7 | 1.07 | 176.5 | 169.5 | 1.04 |
| 95 | 245.0 | 230.9 | 1.06 | 195.4 | 188.5 | 1.04 |
| 96 | 266.2 | 251.2 | 1.06 | 215.1 | 207.9 | 1.03 |
| 97 | 287.6 | 272.3 | 1.06 | 235.6 | 228.4 | 1.03 |
| 98 | 309.7 | 293.8 | 1.05 | 256.6 | 249.7 | 1.03 |
| 99 | 332.5 | 315.7 | 1.05 | 278.0 | 271.8 | 1.02 |
| 100 | 355.8 | 337.8 | 1.05 | 299.7 | 294.5 | 1.02 |
| 101 | 379.4 | 359.8 | 1.05 | 321.5 | 317.6 | 1.01 |
| 102 | 403.2 | 381.6 | 1.06 | 344.0 | 340.8 | 1.01 |
| 103 | 427.1 | 403.0 | 1.06 | 366.9 | 364.0 | 1.01 |
| 104 | 450.9 | 423.8 | 1.06 | 390.1 | 386.8 | 1.01 |
| 105 | 474.4 | 443.8 | 1.07 | 413.3 | 409.2 | 1.01 |
| 110 | 583.3 | 1000.0 | 0.58 | 524.8 | 1000.0 | 0.52 |
| 115 | 664.6 | 1000.0 | 0.66 | 611.3 | 1000.0 | 0.61 |
| 120 | 700.0 | 1000.0 | 0.70 | 650.0 | 1000.0 | 0.65 |
| Age | Males | Females | ||||
|---|---|---|---|---|---|---|
| without_GIS | with_GIS | Proportion with GIS | without_GIS | with_GIS | Proportion with GIS | |
| 65 | 143,121 | 42,770 | 23% | 154,775 | 47,351 | 23% |
| 66 | 146,568 | 40,713 | 22% | 155,039 | 50,214 | 24% |
| 67 | 136,617 | 46,712 | 25% | 145,560 | 54,634 | 27% |
| 68 | 130,202 | 47,450 | 27% | 138,111 | 56,250 | 29% |
| 69 | 126,321 | 48,434 | 28% | 132,686 | 58,346 | 31% |
| 70 | 126,122 | 48,040 | 28% | 129,768 | 59,858 | 32% |
| 71 | 123,156 | 47,252 | 28% | 125,704 | 59,920 | 32% |
| 72 | 125,764 | 47,588 | 27% | 126,568 | 61,871 | 33% |
| 73 | 112,136 | 42,873 | 28% | 113,020 | 56,666 | 33% |
| 74 | 93,403 | 37,964 | 29% | 93,268 | 51,292 | 35% |
| 75 | 89,055 | 36,570 | 29% | 89,123 | 50,488 | 36% |
| 76 | 84,360 | 34,895 | 29% | 85,120 | 48,745 | 36% |
| 77 | 75,852 | 33,238 | 30% | 76,536 | 47,565 | 38% |
| 78 | 66,646 | 30,659 | 32% | 68,519 | 44,749 | 40% |
| 79 | 60,493 | 29,325 | 33% | 62,975 | 44,277 | 41% |
| 80 | 54,885 | 27,073 | 33% | 57,474 | 42,102 | 42% |
| 81 | 50,360 | 25,498 | 34% | 53,261 | 40,629 | 43% |
| 82 | 44,654 | 23,252 | 34% | 48,393 | 38,234 | 44% |
| 83 | 41,372 | 21,783 | 34% | 45,041 | 36,590 | 45% |
| 84 | 37,254 | 19,538 | 34% | 41,476 | 34,898 | 46% |
| 86 | 29,540 | 15,997 | 35% | 34,369 | 30,709 | 47% |
| 87 | 26,591 | 14,586 | 35% | 32,340 | 29,244 | 47% |
| 88 | 23,533 | 12,139 | 34% | 29,122 | 27,015 | 48% |
| 89 | 19,769 | 10,863 | 35% | 25,941 | 24,867 | 49% |
| 90 | 15,503 | 8,570 | 36% | 21,483 | 21,589 | 50% |
| 91 | 12,716 | 6,936 | 35% | 18,411 | 19,175 | 51% |
| 92 | 9,946 | 5,496 | 36% | 15,549 | 16,819 | 52% |
| 93 | 7,589 | 4,182 | 36% | 12,624 | 14,165 | 53% |
| 94 | 5,739 | 3,127 | 35% | 10,401 | 11,751 | 53% |
| 95 | 4,128 | 2,272 | 36% | 8,181 | 9,581 | 54% |
| 96 | 2,871 | 1,551 | 35% | 6,170 | 7,359 | 54% |
| 97 | 1,986 | 1117 | 36% | 4,515 | 5,873 | 57% |
| 98 | 1273 | 727 | 36% | 3,116 | 4,214 | 57% |
| 99 | 776 | 514 | 40% | 2,114 | 3,107 | 60% |
| 100 | 388 | 306 | 44% | 1099 | 1,986 | 64% |
| 101 | 238 | 171 | 42% | 734 | 1,303 | 64% |
| 102 | 124 | 101 | 45% | 416 | 795 | 66% |
| 103 | 55 | 74 | 57% | 208 | 567 | 73% |
| 104 | 34 | 49 | 59% | 163 | 346 | 68% |
| 105+ | 38 | 58 | 60% | 161 | 433 | 73% |
| Total | 2,064,223 | 838,140 | 29% | 2,207,303 | 1,248,504 | 36% |
| Age | Males | Females | ||||
|---|---|---|---|---|---|---|
| without_GIS | with_GIS | Proportion with GIS |
without_GIS | with_GIS | Proportion with GIS |
|
| 65 | 1,477 | 811 | 35% | 913 | 540 | 37% |
| 66 | 1,579 | 964 | 38% | 1,004 | 715 | 42% |
| 67 | 1,548 | 1,060 | 41% | 1,011 | 753 | 43% |
| 68 | 1,576 | 1,194 | 43% | 1,030 | 852 | 45% |
| 69 | 1,745 | 1,233 | 41% | 1,099 | 979 | 47% |
| 70 | 1,933 | 1,294 | 40% | 1,158 | 1,023 | 47% |
| 71 | 1,963 | 1,462 | 43% | 1,349 | 1,074 | 44% |
| 72 | 2,196 | 1,510 | 41% | 1,448 | 1,274 | 47% |
| 73 | 2,039 | 1,448 | 42% | 1,321 | 1,150 | 47% |
| 74 | 2,044 | 1,430 | 41% | 1,280 | 1,230 | 49% |
| 75 | 2,033 | 1,439 | 41% | 1,393 | 1,264 | 48% |
| 76 | 2,228 | 1,518 | 41% | 1,435 | 1,327 | 48% |
| 77 | 2,253 | 1,503 | 40% | 1,412 | 1,432 | 50% |
| 78 | 2,222 | 1,575 | 41% | 1,611 | 1,513 | 48% |
| 79 | 2,250 | 1,619 | 42% | 1,533 | 1,617 | 51% |
| 80 | 2,367 | 1,622 | 41% | 1,578 | 1,705 | 52% |
| 81 | 2,402 | 1,634 | 40% | 1,707 | 1,747 | 51% |
| 82 | 2,467 | 1,679 | 40% | 1,801 | 1,895 | 51% |
| 83 | 2,609 | 1,720 | 40% | 2,004 | 1,946 | 49% |
| 84 | 2,588 | 1,695 | 40% | 2,061 | 2,156 | 51% |
| 85 | 2,683 | 1,713 | 39% | 2,028 | 2,236 | 52% |
| 86 | 2,828 | 1,756 | 38% | 2,282 | 2,379 | 51% |
| 87 | 2,807 | 1,667 | 37% | 2,292 | 2,526 | 52% |
| 88 | 2,910 | 1,704 | 37% | 2,373 | 2,739 | 54% |
| 89 | 2,640 | 1,582 | 37% | 2,432 | 2,742 | 53% |
| 90 | 2,391 | 1,452 | 38% | 2,443 | 2,786 | 53% |
| 91 | 2,274 | 1,307 | 36% | 2,388 | 2,741 | 53% |
| 92 | 1,884 | 1,143 | 38% | 2,313 | 2,639 | 53% |
| 93 | 1,726 | 999 | 37% | 2,108 | 2,494 | 54% |
| 94 | 1,401 | 783 | 36% | 1,946 | 2,362 | 55% |
| 95 | 1,142 | 632 | 36% | 1,664 | 2,099 | 56% |
| 96 | 923 | 478 | 34% | 1,435 | 1,816 | 56% |
| 97 | 684 | 368 | 35% | 1,227 | 1560 | 56% |
| 98 | 479 | 264 | 36% | 877 | 1286 | 59% |
| 99 | 318 | 190 | 37% | 655 | 1013 | 61% |
| 100 | 152 | 110 | 42% | 408 | 734 | 64% |
| 101 | 119 | 92 | 44% | 266 | 453 | 63% |
| 102 | 54 | 57 | 51% | 171 | 362 | 68% |
| 103 | 40 | 32 | 44% | 128 | 242 | 65% |
| 104 | 21 | 25 | 54% | 71 | 171 | 71% |
| 105+ | 22 | 30 | 58% | 82 | 250 | 75% |
| Age | Males | Females | ||||
|---|---|---|---|---|---|---|
| without_GIS | with_GIS | Proportion with GIS |
without_GIS | with_GIS | Proportion with GIS |
|
| 65 | 150,921 | 41,264 | 21% | 157,694 | 47,372 | 23% |
| 66 | 148,438 | 43,622 | 23% | 154,327 | 52,555 | 25% |
| 67 | 136,475 | 47,486 | 26% | 143,950 | 55,395 | 28% |
| 68 | 131,013 | 48,454 | 27% | 137,436 | 57,663 | 30% |
| 69 | 127,749 | 48,957 | 28% | 132,222 | 59,391 | 31% |
| 70 | 126,699 | 48,131 | 28% | 129,224 | 60,323 | 32% |
| 71 | 125,231 | 47,950 | 28% | 126,347 | 61,093 | 33% |
| 72 | 124,186 | 46,739 | 27% | 124,478 | 60,983 | 33% |
| 73 | 103,309 | 41,051 | 28% | 103,585 | 54,251 | 34% |
| 74 | 92,738 | 37,979 | 29% | 92,030 | 51,532 | 36% |
| 75 | 88,430 | 36,615 | 29% | 88,557 | 50,350 | 36% |
| 76 | 82,395 | 34,798 | 30% | 82,577 | 48,970 | 37% |
| 77 | 72,755 | 32,727 | 31% | 73,606 | 46,885 | 39% |
| 78 | 65,565 | 31,007 | 32% | 67,704 | 45,591 | 40% |
| 79 | 58,904 | 28,948 | 33% | 61,133 | 43,946 | 42% |
| 80 | 54,334 | 27,199 | 33% | 56,667 | 42,284 | 43% |
| 81 | 49,099 | 25,383 | 34% | 52,148 | 40,596 | 44% |
| 82 | 44,336 | 23,204 | 34% | 47,664 | 38,231 | 45% |
| 83 | 40,997 | 21,670 | 35% | 44,845 | 36,897 | 45% |
| 84 | 36,645 | 19,541 | 35% | 40,999 | 35,051 | 46% |
| 85 | 32,784 | 17,762 | 35% | 37,244 | 32,898 | 47% |
| 86 | 29,788 | 16,154 | 35% | 34,759 | 31,373 | 47% |
| 87 | 26,437 | 14,375 | 35% | 32,108 | 29,447 | 48% |
| 88 | 23,301 | 12,287 | 35% | 29,013 | 27,403 | 49% |
| 89 | 19,148 | 10,596 | 36% | 25,282 | 24,620 | 49% |
| 90 | 15,304 | 8,465 | 36% | 21,318 | 21,804 | 51% |
| 91 | 12,599 | 6,909 | 35% | 18,485 | 19,449 | 51% |
| 92 | 9,688 | 5,430 | 36% | 15,281 | 16,841 | 52% |
| 93 | 7,520 | 4,111 | 35% | 12,683 | 14,253 | 53% |
| 94 | 5,646 | 3,073 | 35% | 10,304 | 11,847 | 53% |
| 95 | 4,053 | 2,231 | 36% | 8,059 | 9,493 | 54% |
| 96 | 2,846 | 1,541 | 35% | 6,157 | 7,412 | 55% |
| 97 | 1,987 | 1,098 | 36% | 4,444 | 5,888 | 57% |
| 98 | 1,236 | 744 | 38% | 3,002 | 4,181 | 58% |
| 99 | 743 | 501 | 40% | 1,964 | 3,053 | 61% |
| 100 | 377 | 268 | 42% | 1,104 | 1,928 | 64% |
| 101 | 241 | 172 | 42% | 700 | 1,255 | 64% |
| 102 | 107 | 108 | 50% | 396 | 857 | 68% |
| 103 | 60 | 80 | 57% | 242 | 547 | 69% |
| 104 | 40 | 49 | 55% | 153 | 345 | 69% |
| 105+ | 44 | 62 | 58% | 166 | 437 | 72% |
| Age | Overall | without GIS | Ratio without GIS to Overall |
with GIS | Ratio with GIS to Overall |
Ratio with GIS to without |
|---|---|---|---|---|---|---|
| 65 | 12.0 | 9.8 | 0.82 | 20.0 | 1.67 | 2.04 |
| 66 | 13.0 | 10.5 | 0.81 | 21.1 | 1.62 | 2.02 |
| 67 | 14.1 | 11.3 | 0.80 | 22.4 | 1.59 | 1.98 |
| 68 | 15.4 | 12.3 | 0.80 | 23.9 | 1.55 | 1.94 |
| 69 | 16.7 | 13.4 | 0.80 | 25.5 | 1.53 | 1.91 |
| 70 | 18.1 | 14.6 | 0.81 | 27.4 | 1.51 | 1.87 |
| 71 | 19.7 | 16.0 | 0.81 | 29.4 | 1.49 | 1.84 |
| 72 | 21.5 | 17.5 | 0.81 | 31.7 | 1.47 | 1.81 |
| 73 | 23.5 | 19.3 | 0.82 | 34.1 | 1.45 | 1.76 |
| 74 | 25.8 | 21.4 | 0.83 | 36.6 | 1.42 | 1.71 |
| 75 | 28.4 | 23.8 | 0.84 | 39.4 | 1.39 | 1.66 |
| 76 | 31.3 | 26.5 | 0.85 | 42.4 | 1.35 | 1.60 |
| 77 | 34.7 | 29.7 | 0.86 | 45.7 | 1.32 | 1.54 |
| 78 | 38.4 | 33.3 | 0.87 | 49.3 | 1.28 | 1.48 |
| 79 | 42.7 | 37.5 | 0.88 | 53.4 | 1.25 | 1.43 |
| 80 | 47.5 | 42.2 | 0.89 | 58.0 | 1.22 | 1.37 |
| 81 | 52.9 | 47.7 | 0.90 | 63.2 | 1.19 | 1.33 |
| 82 | 59.1 | 53.9 | 0.91 | 69.0 | 1.17 | 1.28 |
| 83 | 66.2 | 61.1 | 0.92 | 75.7 | 1.14 | 1.24 |
| 84 | 74.3 | 69.4 | 0.93 | 83.4 | 1.12 | 1.20 |
| 85 | 83.6 | 78.9 | 0.94 | 92.2 | 1.10 | 1.17 |
| 86 | 94.1 | 89.7 | 0.95 | 102.2 | 1.09 | 1.14 |
| 87 | 106.0 | 101.8 | 0.96 | 113.5 | 1.07 | 1.12 |
| 88 | 119.2 | 115.2 | 0.97 | 126.2 | 1.06 | 1.10 |
| 89 | 133.8 | 130.0 | 0.97 | 140.3 | 1.05 | 1.08 |
| 90 | 149.7 | 146.2 | 0.98 | 155.6 | 1.04 | 1.06 |
| 91 | 166.8 | 163.7 | 0.98 | 172.1 | 1.03 | 1.05 |
| 92 | 185.1 | 182.4 | 0.99 | 189.7 | 1.02 | 1.04 |
| 93 | 204.3 | 202.1 | 0.99 | 208.2 | 1.02 | 1.03 |
| 94 | 224.4 | 222.7 | 0.99 | 227.6 | 1.01 | 1.02 |
| 95 | 245.0 | 244.0 | 1.00 | 247.6 | 1.01 | 1.01 |
| 96 | 266.2 | 265.8 | 1.00 | 268.0 | 1.01 | 1.01 |
| 97 | 287.6 | 287.6 | 1.00 | 288.7 | 1.00 | 1.00 |
| 98 | 309.7 | 309.7 | 1.00 | 310.2 | 1.00 | 1.00 |
| 99 | 332.5 | 332.5 | 1.00 | 332.5 | 1.00 | 1.00 |
| 100 | 355.8 | 355.8 | 1.00 | 355.8 | 1.00 | 1.00 |
| 101 | 379.4 | 379.4 | 1.00 | 379.4 | 1.00 | 1.00 |
| 102 | 403.2 | 403.2 | 1.00 | 403.2 | 1.00 | 1.00 |
| 103 | 427.1 | 427.1 | 1.00 | 427.1 | 1.00 | 1.00 |
| 104 | 450.9 | 450.9 | 1.00 | 450.9 | 1.00 | 1.00 |
| 105 | 474.4 | 474.4 | 1.00 | 474.4 | 1.00 | 1.00 |
| 110 | 583.3 | 583.3 | 1.00 | 583.3 | 1.00 | 1.00 |
| 115 | 664.6 | 664.6 | 1.00 | 664.6 | 1.00 | 1.00 |
| 120 | 700.0 | 700.0 | 1.00 | 700.0 | 1.00 | 1.00 |
| Age | Overall | without GIS | Ratio without GIS to Overall |
with GIS | Ratio with GIS to Overall |
Ratio with GIS to without |
|---|---|---|---|---|---|---|
| 65 | 7.2 | 5.9 | 0.81 | 11.9 | 1.64 | 2.02 |
| 66 | 8.0 | 6.3 | 0.79 | 12.8 | 1.60 | 2.02 |
| 67 | 8.8 | 6.9 | 0.78 | 13.8 | 1.56 | 2.00 |
| 68 | 9.7 | 7.6 | 0.78 | 14.8 | 1.53 | 1.95 |
| 69 | 10.7 | 8.4 | 0.78 | 15.9 | 1.49 | 1.90 |
| 70 | 11.7 | 9.2 | 0.79 | 17.0 | 1.45 | 1.84 |
| 71 | 12.9 | 10.2 | 0.80 | 18.3 | 1.42 | 1.79 |
| 72 | 14.2 | 11.3 | 0.80 | 19.7 | 1.39 | 1.74 |
| 73 | 15.6 | 12.6 | 0.81 | 21.3 | 1.37 | 1.70 |
| 74 | 17.2 | 14.0 | 0.81 | 23.1 | 1.34 | 1.66 |
| 75 | 19.0 | 15.6 | 0.82 | 25.1 | 1.32 | 1.61 |
| 76 | 21.2 | 17.4 | 0.82 | 27.3 | 1.29 | 1.57 |
| 77 | 23.6 | 19.6 | 0.83 | 29.8 | 1.26 | 1.52 |
| 78 | 26.3 | 22.2 | 0.84 | 32.5 | 1.24 | 1.47 |
| 79 | 29.4 | 25.1 | 0.85 | 35.6 | 1.21 | 1.42 |
| 80 | 33.0 | 28.5 | 0.86 | 39.0 | 1.18 | 1.37 |
| 81 | 37.0 | 32.4 | 0.88 | 42.9 | 1.16 | 1.33 |
| 82 | 41.6 | 36.8 | 0.89 | 47.4 | 1.14 | 1.29 |
| 83 | 46.8 | 41.9 | 0.89 | 52.7 | 1.13 | 1.26 |
| 84 | 52.9 | 47.6 | 0.90 | 58.9 | 1.11 | 1.24 |
| 85 | 59.8 | 54.2 | 0.91 | 66.0 | 1.10 | 1.22 |
| 86 | 67.7 | 61.9 | 0.91 | 74.2 | 1.10 | 1.20 |
| 87 | 76.9 | 70.8 | 0.92 | 83.5 | 1.09 | 1.18 |
| 88 | 87.3 | 81.1 | 0.93 | 93.8 | 1.07 | 1.16 |
| 89 | 99.0 | 93.1 | 0.94 | 105.2 | 1.06 | 1.13 |
| 90 | 112.0 | 106.6 | 0.95 | 117.6 | 1.05 | 1.10 |
| 91 | 126.4 | 121.6 | 0.96 | 130.9 | 1.04 | 1.08 |
| 92 | 141.9 | 138.0 | 0.97 | 145.4 | 1.02 | 1.05 |
| 93 | 158.7 | 155.7 | 0.98 | 161.0 | 1.01 | 1.03 |
| 94 | 176.5 | 174.5 | 0.99 | 177.9 | 1.01 | 1.02 |
| 95 | 195.4 | 194.2 | 0.99 | 195.9 | 1.00 | 1.01 |
| 96 | 215.1 | 214.7 | 1.00 | 215.2 | 1.00 | 1.00 |
| 97 | 235.6 | 235.6 | 1.00 | 235.6 | 1.00 | 1.00 |
| 98 | 256.6 | 256.6 | 1.00 | 256.6 | 1.00 | 1.00 |
| 99 | 278.0 | 278.0 | 1.00 | 278.1 | 1.00 | 1.00 |
| 100 | 299.7 | 299.7 | 1.00 | 300.0 | 1.00 | 1.00 |
| 101 | 321.5 | 321.5 | 1.00 | 322.0 | 1.00 | 1.00 |
| 102 | 344.0 | 344.0 | 1.00 | 344.7 | 1.00 | 1.00 |
| 103 | 366.9 | 366.9 | 1.00 | 367.7 | 1.00 | 1.00 |
| 104 | 390.1 | 390.1 | 1.00 | 391.0 | 1.00 | 1.00 |
| 105 | 413.3 | 413.3 | 1.00 | 414.3 | 1.00 | 1.00 |
| 110 | 524.8 | 524.8 | 1.00 | 525.6 | 1.00 | 1.00 |
| 115 | 611.3 | 611.3 | 1.00 | 611.6 | 1.00 | 1.00 |
| 120 | 650.0 | 650.0 | 1.00 | 650.0 | 1.00 | 1.00 |
| Age | Males | Females | ||||||
|---|---|---|---|---|---|---|---|---|
| lx | 1,000 qx | dx | LifExp | lx | 1,000 qx | dx | LifExp | |
| 65 | 100,000 | 9.8 | 978 | 20.33 | 100,000 | 5.9 | 587 | 23.16 |
| 66 | 99,022 | 10.5 | 1,038 | 19.53 | 99,413 | 6.3 | 630 | 22.29 |
| 67 | 97,984 | 11.3 | 1,108 | 18.73 | 98,783 | 6.9 | 682 | 21.43 |
| 68 | 96,875 | 12.3 | 1,189 | 17.94 | 98,101 | 7.6 | 743 | 20.58 |
| 69 | 95,686 | 13.4 | 1,280 | 17.15 | 97,357 | 8.4 | 813 | 19.73 |
| 70 | 94,406 | 14.6 | 1,379 | 16.38 | 96,544 | 9.2 | 892 | 18.89 |
| 71 | 93,027 | 16.0 | 1,486 | 15.62 | 95,652 | 10.2 | 980 | 18.06 |
| 72 | 91,541 | 17.5 | 1,605 | 14.86 | 94,672 | 11.3 | 1,074 | 17.25 |
| 73 | 89,936 | 19.3 | 1,737 | 14.12 | 93,598 | 12.6 | 1,177 | 16.44 |
| 74 | 88,198 | 21.4 | 1,885 | 13.38 | 92,421 | 14.0 | 1,290 | 15.64 |
| 75 | 86,313 | 23.8 | 2,050 | 12.67 | 91,131 | 15.6 | 1,418 | 14.86 |
| 76 | 84,263 | 26.5 | 2,234 | 11.96 | 89,713 | 17.4 | 1,563 | 14.08 |
| 77 | 82,029 | 29.7 | 2,436 | 11.27 | 88,150 | 19.6 | 1,728 | 13.32 |
| 78 | 79,593 | 33.3 | 2,652 | 10.60 | 86,422 | 22.2 | 1,914 | 12.58 |
| 79 | 76,941 | 37.5 | 2,883 | 9.95 | 84,507 | 25.1 | 2,121 | 11.85 |
| 80 | 74,058 | 42.2 | 3,127 | 9.32 | 82,387 | 28.5 | 2,347 | 11.15 |
| 81 | 70,932 | 47.7 | 3,381 | 8.71 | 80,040 | 32.4 | 2,592 | 10.46 |
| 82 | 67,551 | 53.9 | 3,643 | 8.12 | 77,448 | 36.8 | 2,851 | 9.79 |
| 83 | 63,908 | 61.1 | 3,908 | 7.55 | 74,597 | 41.9 | 3,122 | 9.15 |
| 84 | 60,000 | 69.4 | 4,166 | 7.01 | 71,475 | 47.6 | 3,402 | 8.52 |
| 85 | 55,834 | 78.9 | 4,406 | 6.50 | 68,073 | 54.2 | 3,689 | 7.92 |
| 86 | 51,428 | 89.7 | 4,612 | 6.01 | 64,383 | 61.9 | 3,983 | 7.35 |
| 87 | 46,816 | 101.8 | 4,764 | 5.56 | 60,401 | 70.8 | 4,275 | 6.80 |
| 88 | 42,053 | 115.2 | 4,845 | 5.13 | 56,125 | 81.1 | 4,554 | 6.28 |
| 89 | 37,208 | 130.0 | 4,838 | 4.73 | 51,571 | 93.1 | 4,800 | 5.79 |
| 90 | 32,369 | 146.2 | 4,733 | 4.37 | 46,771 | 106.6 | 4,984 | 5.34 |
| 91 | 27,636 | 163.7 | 4,524 | 4.03 | 41,787 | 121.6 | 5,080 | 4.91 |
| 92 | 23,113 | 182.4 | 4,215 | 3.72 | 36,707 | 138.0 | 5,065 | 4.52 |
| 93 | 18,898 | 202.1 | 3,819 | 3.44 | 31,642 | 155.7 | 4,926 | 4.17 |
| 94 | 15,079 | 222.7 | 3,358 | 3.18 | 26,717 | 174.5 | 4,661 | 3.84 |
| 95 | 11,721 | 244.0 | 2,860 | 2.95 | 22,056 | 194.2 | 4,283 | 3.55 |
| 96 | 8,861 | 265.8 | 2,355 | 2.74 | 17,773 | 214.7 | 3,816 | 3.28 |
| 97 | 6,506 | 287.6 | 1,871 | 2.55 | 13,957 | 235.6 | 3,288 | 3.05 |
| 98 | 4,635 | 309.7 | 1,436 | 2.37 | 10,669 | 256.6 | 2,738 | 2.83 |
| 99 | 3,199 | 332.5 | 1,064 | 2.22 | 7,932 | 278.0 | 2,205 | 2.64 |
| 100 | 2,135 | 355.8 | 760 | 2.07 | 5,726 | 299.7 | 1,716 | 2.46 |
| 101 | 1,376 | 379.4 | 522 | 1.94 | 4,010 | 321.5 | 1,289 | 2.30 |
| 102 | 854 | 403.2 | 344 | 1.82 | 2,721 | 344.0 | 936 | 2.15 |
| 103 | 509 | 427.1 | 218 | 1.71 | 1,785 | 366.9 | 655 | 2.01 |
| 104 | 292 | 450.9 | 132 | 1.61 | 1,130 | 390.1 | 441 | 1.89 |
| 105 | 160 | 474.4 | 76 | 1.52 | 689 | 413.3 | 285 | 1.77 |
| 110 | 4 | 583.3 | 2 | 1.18 | 32 | 524.8 | 17 | 1.35 |
| 115 | 0 | 664.6 | 0 | 0.99 | 1 | 611.3 | 0 | 1.12 |
| 120 | 0 | 700.0 | 0 | 0.80 | 0 | 650.0 | 0 | 0.85 |
| Age | Males | Females | ||||||
|---|---|---|---|---|---|---|---|---|
| lx | 1,000 qx | dx | LifExp | lx | 1,000 qx | dx | LifExp | |
| 65 | 100,000 | 20.0 | 1,999 | 17.40 | 100,000 | 11.9 | 1,187 | 20.68 |
| 66 | 98,001 | 21.1 | 2,070 | 16.74 | 98,813 | 12.8 | 1,267 | 19.93 |
| 67 | 95,931 | 22.4 | 2,150 | 16.10 | 97,546 | 13.8 | 1,346 | 19.18 |
| 68 | 93,782 | 23.9 | 2,237 | 15.45 | 96,200 | 14.8 | 1,425 | 18.44 |
| 69 | 91,544 | 25.5 | 2,334 | 14.82 | 94,775 | 15.9 | 1,505 | 17.71 |
| 70 | 89,210 | 27.4 | 2,441 | 14.19 | 93,270 | 17.0 | 1,589 | 16.99 |
| 71 | 86,769 | 29.4 | 2,554 | 13.58 | 91,682 | 18.3 | 1,679 | 16.27 |
| 72 | 84,215 | 31.7 | 2,668 | 12.97 | 90,003 | 19.7 | 1,777 | 15.57 |
| 73 | 81,546 | 34.1 | 2,779 | 12.38 | 88,226 | 21.3 | 1,883 | 14.87 |
| 74 | 78,767 | 36.6 | 2,885 | 11.80 | 86,343 | 23.1 | 1,996 | 14.18 |
| 75 | 75,883 | 39.4 | 2,987 | 11.23 | 84,346 | 25.1 | 2,117 | 13.51 |
| 76 | 72,896 | 42.4 | 3,087 | 10.67 | 82,229 | 27.3 | 2,246 | 12.84 |
| 77 | 69,808 | 45.7 | 3,187 | 10.12 | 79,982 | 29.8 | 2,383 | 12.19 |
| 78 | 66,621 | 49.3 | 3,286 | 9.58 | 77,600 | 32.5 | 2,524 | 11.55 |
| 79 | 63,334 | 53.4 | 3,383 | 9.05 | 75,076 | 35.6 | 2,671 | 10.92 |
| 80 | 59,951 | 58.0 | 3,477 | 8.54 | 72,404 | 39.0 | 2,825 | 10.30 |
| 81 | 56,474 | 63.2 | 3,568 | 8.03 | 69,579 | 42.9 | 2,986 | 9.70 |
| 82 | 52,906 | 69.0 | 3,653 | 7.54 | 66,593 | 47.4 | 3,160 | 9.11 |
| 83 | 49,253 | 75.7 | 3,731 | 7.06 | 63,433 | 52.7 | 3,344 | 8.54 |
| 84 | 45,522 | 83.4 | 3,797 | 6.60 | 60,089 | 58.9 | 3,538 | 7.99 |
| 85 | 41,725 | 92.2 | 3,846 | 6.15 | 56,551 | 66.0 | 3,733 | 7.46 |
| 86 | 37,879 | 102.2 | 3,871 | 5.73 | 52,818 | 74.2 | 3,919 | 6.95 |
| 87 | 34,008 | 113.5 | 3,861 | 5.32 | 48,898 | 83.5 | 4,082 | 6.47 |
| 88 | 30,147 | 126.2 | 3,805 | 4.94 | 44,817 | 93.8 | 4,205 | 6.01 |
| 89 | 26,342 | 140.3 | 3,695 | 4.58 | 40,612 | 105.2 | 4,272 | 5.58 |
| 90 | 22,647 | 155.6 | 3,524 | 4.25 | 36,340 | 117.6 | 4,272 | 5.18 |
| 91 | 19,124 | 172.1 | 3,291 | 3.94 | 32,068 | 130.9 | 4,199 | 4.80 |
| 92 | 15,832 | 189.7 | 3,003 | 3.65 | 27,869 | 145.4 | 4,052 | 4.45 |
| 93 | 12,829 | 208.2 | 2,672 | 3.39 | 23,817 | 161.0 | 3,835 | 4.13 |
| 94 | 10,157 | 227.6 | 2,312 | 3.15 | 19,982 | 177.9 | 3,554 | 3.82 |
| 95 | 7,846 | 247.6 | 1,943 | 2.93 | 16,428 | 195.9 | 3,219 | 3.54 |
| 96 | 5,903 | 268.0 | 1,582 | 2.73 | 13,209 | 215.2 | 2,842 | 3.28 |
| 97 | 4,321 | 288.7 | 1,247 | 2.54 | 10,366 | 235.6 | 2,442 | 3.04 |
| 98 | 3,073 | 310.2 | 953 | 2.37 | 7,924 | 256.6 | 2,033 | 2.83 |
| 99 | 2,120 | 332.5 | 705 | 2.22 | 5,891 | 278.1 | 1,638 | 2.63 |
| 100 | 1,415 | 355.8 | 504 | 2.07 | 4,253 | 300.0 | 1,276 | 2.45 |
| 101 | 912 | 379.4 | 346 | 1.94 | 2,977 | 322.0 | 959 | 2.29 |
| 102 | 566 | 403.2 | 228 | 1.82 | 2,018 | 344.7 | 696 | 2.14 |
| 103 | 338 | 427.1 | 144 | 1.71 | 1,323 | 367.7 | 486 | 2.01 |
| 104 | 193 | 450.9 | 87 | 1.61 | 836 | 391.0 | 327 | 1.88 |
| 105 | 106 | 474.4 | 50 | 1.52 | 509 | 414.3 | 211 | 1.77 |
| 110 | 3 | 583.3 | 2 | 1.18 | 23 | 525.6 | 12 | 1.35 |
| 115 | 0 | 664.6 | 0 | 0.99 | 0 | 611.6 | 0 | 1.12 |
| 120 | 0 | 700.0 | 0 | 0.80 | 0 | 650.0 | 0 | 0.85 |
| Age | Overall | without_GIS | with_GIS | |||||||
|---|---|---|---|---|---|---|---|---|---|---|
| Married | Single | Married | Single | %Married | %Single | Married | Single | %Married | %Single | |
| 65 | 130,588 | 55,303 | 108,950 | 34,171 | 76% | 24% | 21,638 | 21,132 | 51% | 49% |
| 66 | 132,091 | 55,190 | 112,560 | 34,008 | 77% | 23% | 19,531 | 21,182 | 48% | 52% |
| 67 | 129,809 | 53,520 | 106,259 | 30,358 | 78% | 22% | 23,550 | 23,162 | 50% | 50% |
| 68 | 127,332 | 50,320 | 102,543 | 27,659 | 79% | 21% | 24,789 | 22,661 | 52% | 48% |
| 69 | 125,775 | 48,980 | 99,892 | 26,429 | 79% | 21% | 25,883 | 22,551 | 53% | 47% |
| 70 | 126,451 | 47,711 | 100,375 | 25,747 | 80% | 20% | 26,076 | 21,964 | 54% | 46% |
| 71 | 124,389 | 46,019 | 98,534 | 24,622 | 80% | 20% | 25,855 | 21,397 | 55% | 45% |
| 72 | 127,314 | 46,038 | 100,810 | 24,954 | 80% | 20% | 26,504 | 21,084 | 56% | 44% |
| 73 | 114,170 | 40,839 | 90,048 | 22,088 | 80% | 20% | 24,122 | 18,751 | 56% | 44% |
| 74 | 96,326 | 35,041 | 74,460 | 18,943 | 80% | 20% | 21,866 | 16,098 | 58% | 42% |
| 75 | 92,364 | 33,261 | 71,126 | 17,929 | 80% | 20% | 21,238 | 15,332 | 58% | 42% |
| 76 | 87,685 | 31,570 | 67,092 | 17,268 | 80% | 20% | 20,593 | 14,302 | 59% | 41% |
| 77 | 80,081 | 29,009 | 60,077 | 15,775 | 79% | 21% | 20,004 | 13,234 | 60% | 40% |
| 78 | 70,701 | 26,604 | 52,293 | 14,353 | 78% | 22% | 18,408 | 12,251 | 60% | 40% |
| 79 | 64,997 | 24,821 | 47,060 | 13,433 | 78% | 22% | 17,937 | 11,388 | 61% | 39% |
| 80 | 59,049 | 22,909 | 42,426 | 12,459 | 77% | 23% | 16,623 | 10,450 | 61% | 39% |
| 81 | 54,102 | 21,756 | 38,232 | 12,128 | 76% | 24% | 15,870 | 9,628 | 62% | 38% |
| 82 | 47,615 | 20,291 | 33,279 | 11,375 | 75% | 25% | 14,336 | 8,916 | 62% | 38% |
| 83 | 43,570 | 19,585 | 30,388 | 10,984 | 73% | 27% | 13,182 | 8,601 | 61% | 39% |
| 84 | 38,471 | 18,321 | 26,727 | 10,527 | 72% | 28% | 11,744 | 7,794 | 60% | 40% |
| 85 | 33,616 | 17,106 | 23,040 | 10,005 | 70% | 30% | 10,576 | 7,101 | 60% | 40% |
| 86 | 29,330 | 16,207 | 19,917 | 9,623 | 67% | 33% | 9,413 | 6,584 | 59% | 41% |
| 87 | 25,710 | 15,467 | 17,461 | 9,130 | 66% | 34% | 8,249 | 6,337 | 57% | 43% |
| 88 | 21,487 | 14,185 | 14,765 | 8,768 | 63% | 37% | 6,722 | 5,417 | 55% | 45% |
| 89 | 17,843 | 12,789 | 11,993 | 7,776 | 61% | 39% | 5,850 | 5,013 | 54% | 46% |
| 90 | 13,246 | 10,827 | 8,811 | 6,692 | 57% | 43% | 4,435 | 4,135 | 52% | 48% |
| 91 | 10,211 | 9,441 | 6,837 | 5,879 | 54% | 46% | 3,374 | 3,562 | 49% | 51% |
| 92 | 7,561 | 7,881 | 5,015 | 4,931 | 50% | 50% | 2,546 | 2,950 | 46% | 54% |
| 93 | 5,454 | 6,317 | 3,588 | 4,001 | 47% | 53% | 1,866 | 2,316 | 45% | 55% |
| 94 | 3,727 | 5,139 | 2,410 | 3,329 | 42% | 58% | 1317 | 1,810 | 42% | 58% |
| 95 | 2,497 | 3,903 | 1,646 | 2,482 | 40% | 60% | 851 | 1,421 | 37% | 63% |
| 96 | 1,605 | 2,817 | 1040 | 1831 | 36% | 64% | 565 | 986 | 36% | 64% |
| 97 | 1016 | 2,087 | 669 | 1317 | 34% | 66% | 347 | 770 | 31% | 69% |
| 98 | 645 | 1355 | 414 | 859 | 33% | 67% | 231 | 496 | 32% | 68% |
| 99 | 359 | 931 | 220 | 556 | 28% | 72% | 139 | 375 | 27% | 73% |
| 100 | 177 | 517 | 102 | 286 | 26% | 74% | 75 | 231 | 25% | 75% |
| 101 | 93 | 316 | 56 | 182 | 24% | 76% | 37 | 134 | 22% | 78% |
| 102 | 36 | 189 | 24 | 100 | 19% | 81% | 12 | 89 | 12% | 88% |
| 103 | 24 | 105 | 6 | 49 | 11% | 89% | 18 | 56 | 24% | 76% |
| 104 | 13 | 70 | 9 | 25 | 26% | 74% | 4 | 45 | 8% | 92% |
| 105+ | 19 | 77 | 7 | 31 | 18% | 82% | 12 | 46 | 21% | 79% |
| Total | 2,047,549 | 854,814 | 1,581,161 | 483,062 | 77% | 23% | 466,388 | 371,752 | 56% | 44% |
| Age | Overall | without_GIS | with_GIS | |||||||
|---|---|---|---|---|---|---|---|---|---|---|
| Married | Single | Married | Single | %Married | %Single | Married | Single | %Married | %Single | |
| 65 | 129,958 | 72,168 | 110,105 | 44,670 | 71% | 29% | 19,853 | 27,498 | 42% | 58% |
| 66 | 130,079 | 75,174 | 109,428 | 45,611 | 71% | 29% | 20,651 | 29,563 | 41% | 59% |
| 67 | 125,452 | 74,742 | 102,980 | 42,580 | 71% | 29% | 22,472 | 32,162 | 41% | 59% |
| 68 | 120,308 | 74,053 | 97,375 | 40,736 | 71% | 29% | 22,933 | 33,317 | 41% | 59% |
| 69 | 116,288 | 74,744 | 92,492 | 40,194 | 70% | 30% | 23,796 | 34,550 | 41% | 59% |
| 70 | 113,797 | 75,829 | 89,897 | 39,871 | 69% | 31% | 23,900 | 35,958 | 40% | 60% |
| 71 | 109,688 | 75,936 | 86,013 | 39,691 | 68% | 32% | 23,675 | 36,245 | 40% | 60% |
| 72 | 109,109 | 79,330 | 85,028 | 41,540 | 67% | 33% | 24,081 | 37,790 | 39% | 61% |
| 73 | 95,967 | 73,719 | 74,431 | 38,589 | 66% | 34% | 21,536 | 35,130 | 38% | 62% |
| 74 | 78,846 | 65,714 | 59,743 | 33,525 | 64% | 36% | 19,103 | 32,189 | 37% | 63% |
| 75 | 74,015 | 65,596 | 55,837 | 33,286 | 63% | 37% | 18,178 | 32,310 | 36% | 64% |
| 76 | 68,483 | 65,382 | 51,415 | 33,705 | 60% | 40% | 17,068 | 31,677 | 35% | 65% |
| 77 | 60,899 | 63,202 | 44,775 | 31,761 | 59% | 41% | 16,124 | 31,441 | 34% | 66% |
| 78 | 53,300 | 59,968 | 38,865 | 29,654 | 57% | 43% | 14,435 | 30,314 | 32% | 68% |
| 79 | 47,570 | 59,682 | 34,012 | 28,963 | 54% | 46% | 13,558 | 30,719 | 31% | 69% |
| 80 | 42,010 | 57,566 | 29,749 | 27,725 | 52% | 48% | 12,261 | 29,841 | 29% | 71% |
| 81 | 36,862 | 57,028 | 25,763 | 27,498 | 48% | 52% | 11,099 | 29,530 | 27% | 73% |
| 82 | 31,559 | 55,068 | 21,913 | 26,480 | 45% | 55% | 9,646 | 28,588 | 25% | 75% |
| 83 | 27,570 | 54,061 | 18,972 | 26,069 | 42% | 58% | 8,598 | 27,992 | 23% | 77% |
| 84 | 23,441 | 52,933 | 16,071 | 25,405 | 39% | 61% | 7,370 | 27,528 | 21% | 79% |
| 85 | 19,586 | 51,110 | 13,361 | 24,408 | 35% | 65% | 6,225 | 26,702 | 19% | 81% |
| 86 | 16,403 | 48,675 | 11,225 | 23,144 | 33% | 67% | 5,178 | 25,531 | 17% | 83% |
| 87 | 13,396 | 48,188 | 9,063 | 23,277 | 28% | 72% | 4,333 | 24,911 | 15% | 85% |
| 88 | 10,722 | 45,415 | 7,356 | 21,766 | 25% | 75% | 3,366 | 23,649 | 12% | 88% |
| 89 | 8,411 | 42,397 | 5,772 | 20,169 | 22% | 78% | 2,639 | 22,228 | 11% | 89% |
| 90 | 5,979 | 37,093 | 4,014 | 17,469 | 19% | 81% | 1,965 | 19,624 | 9% | 91% |
| 91 | 4,438 | 33,148 | 2,996 | 15,415 | 16% | 84% | 1,442 | 17,733 | 8% | 92% |
| 92 | 3,141 | 29,227 | 2,124 | 13,425 | 14% | 86% | 1,017 | 15,802 | 6% | 94% |
| 93 | 2,092 | 24,697 | 1,469 | 11,155 | 12% | 88% | 623 | 13,542 | 4% | 96% |
| 94 | 1,430 | 20,722 | 990 | 9,411 | 10% | 90% | 440 | 11,311 | 4% | 96% |
| 95 | 881 | 16,881 | 623 | 7,558 | 8% | 92% | 258 | 9,323 | 3% | 97% |
| 96 | 603 | 12,926 | 423 | 5747 | 7% | 93% | 180 | 7179 | 2% | 98% |
| 97 | 342 | 10,046 | 239 | 4276 | 5% | 95% | 103 | 5770 | 2% | 98% |
| 98 | 182 | 7148 | 135 | 2981 | 4% | 96% | 47 | 4167 | 1% | 99% |
| 99 | 103 | 5118 | 69 | 2045 | 3% | 97% | 34 | 3073 | 1% | 99% |
| 100 | 50 | 3035 | 38 | 1061 | 3% | 97% | 12 | 1974 | 1% | 99% |
| 101 | 23 | 2014 | 18 | 716 | 2% | 98% | 5 | 1298 | 0% | 100% |
| 102 | 11 | 1200 | 4 | 412 | 1% | 99% | 7 | 788 | 1% | 99% |
| 103 | 7 | 768 | 5 | 203 | 2% | 98% | 2 | 565 | 0% | 100% |
| 104 | 3 | 506 | 3 | 160 | 2% | 98% | 0 | 346 | 0% | 100% |
| 105+ | 4 | 590 | 2 | 159 | 1% | 99% | 2 | 431 | 0% | 100% |
| Total | 1,683,008 | 1,772,799 | 1,304,793 | 902,510 | 59% | 41% | 378,215 | 870,289 | 30% | 70% |
| Age | Overall | without GIS | with GIS | |||||||
|---|---|---|---|---|---|---|---|---|---|---|
| Married | Single | Married | Single | %Married | %Single | Married | Single | %Married | %Single | |
| 65 | 1,076 | 1212 | 885 | 592 | 60% | 40% | 191 | 620 | 24% | 76% |
| 66 | 1,242 | 1,301 | 979 | 600 | 62% | 38% | 263 | 701 | 27% | 73% |
| 67 | 1,282 | 1326 | 975 | 573 | 63% | 37% | 307 | 753 | 29% | 71% |
| 68 | 1,448 | 1322 | 1039 | 537 | 66% | 34% | 409 | 785 | 34% | 66% |
| 69 | 1,647 | 1331 | 1,180 | 565 | 68% | 32% | 467 | 766 | 38% | 62% |
| 70 | 1,769 | 1,458 | 1,331 | 602 | 69% | 31% | 438 | 856 | 34% | 66% |
| 71 | 1,924 | 1,501 | 1,377 | 586 | 70% | 30% | 547 | 915 | 37% | 63% |
| 72 | 2,067 | 1,639 | 1,525 | 671 | 69% | 31% | 542 | 968 | 36% | 64% |
| 73 | 2,026 | 1,461 | 1,407 | 632 | 69% | 31% | 619 | 829 | 43% | 57% |
| 74 | 2,084 | 1,390 | 1,466 | 578 | 72% | 28% | 618 | 812 | 43% | 57% |
| 75 | 2,032 | 1,440 | 1,363 | 670 | 67% | 33% | 669 | 770 | 46% | 54% |
| 76 | 2,246 | 1,500 | 1,537 | 691 | 69% | 31% | 709 | 809 | 47% | 53% |
| 77 | 2,315 | 1,441 | 1,599 | 654 | 71% | 29% | 716 | 787 | 48% | 52% |
| 78 | 2,269 | 1,528 | 1,527 | 695 | 69% | 31% | 742 | 833 | 47% | 53% |
| 79 | 2,393 | 1,476 | 1,583 | 667 | 70% | 30% | 810 | 809 | 50% | 50% |
| 80 | 2,463 | 1,526 | 1,631 | 736 | 69% | 31% | 832 | 790 | 51% | 49% |
| 81 | 2,457 | 1,579 | 1,631 | 771 | 68% | 32% | 826 | 808 | 51% | 49% |
| 82 | 2,531 | 1,615 | 1,656 | 811 | 67% | 33% | 875 | 804 | 52% | 48% |
| 83 | 2,652 | 1,677 | 1,769 | 840 | 68% | 32% | 883 | 837 | 51% | 49% |
| 84 | 2,587 | 1,696 | 1,680 | 908 | 65% | 35% | 907 | 788 | 54% | 46% |
| 85 | 2,563 | 1,833 | 1,700 | 983 | 63% | 37% | 863 | 850 | 50% | 50% |
| 86 | 2,592 | 1,992 | 1,712 | 1116 | 61% | 39% | 880 | 876 | 50% | 50% |
| 87 | 2,476 | 1,998 | 1,668 | 1,139 | 59% | 41% | 808 | 859 | 48% | 52% |
| 88 | 2,458 | 2,156 | 1,654 | 1256 | 57% | 43% | 804 | 900 | 47% | 53% |
| 89 | 2,194 | 2,028 | 1,440 | 1200 | 55% | 45% | 754 | 828 | 48% | 52% |
| 90 | 1,927 | 1,916 | 1,256 | 1135 | 53% | 47% | 671 | 781 | 46% | 54% |
| 91 | 1,681 | 1,900 | 1,095 | 1179 | 48% | 52% | 586 | 721 | 45% | 55% |
| 92 | 1,296 | 1,731 | 841 | 1043 | 45% | 55% | 455 | 688 | 40% | 60% |
| 93 | 1098 | 1,627 | 697 | 1029 | 40% | 60% | 401 | 598 | 40% | 60% |
| 94 | 830 | 1354 | 535 | 866 | 38% | 62% | 295 | 488 | 38% | 62% |
| 95 | 677 | 1097 | 433 | 709 | 38% | 62% | 244 | 388 | 39% | 61% |
| 96 | 441 | 960 | 282 | 641 | 31% | 69% | 159 | 319 | 33% | 67% |
| 97 | 332 | 720 | 218 | 466 | 32% | 68% | 114 | 254 | 31% | 69% |
| 98 | 242 | 501 | 170 | 309 | 35% | 65% | 72 | 192 | 27% | 73% |
| 99 | 134 | 374 | 88 | 230 | 28% | 72% | 46 | 144 | 24% | 76% |
| 100 | 58 | 204 | 39 | 113 | 26% | 74% | 19 | 91 | 17% | 83% |
| 101 | 50 | 161 | 32 | 87 | 27% | 73% | 18 | 74 | 20% | 80% |
| 102 | 28 | 83 | 14 | 40 | 26% | 74% | 14 | 43 | 25% | 75% |
| 103 | 13 | 59 | 6 | 34 | 15% | 85% | 7 | 25 | 22% | 78% |
| 104 | 7 | 39 | 2 | 19 | 10% | 90% | 5 | 20 | 20% | 80% |
| 105+ | 7 | 45 | 2 | 20 | 9% | 91% | 5 | 25 | 17% | 83% |
| Total | 61,614 | 52,197 | 42,024 | 26,993 | 61% | 39% | 19,590 | 25,204 | 44% | 56% |
| Age | Overall | without GIS | with GIS | |||||||
|---|---|---|---|---|---|---|---|---|---|---|
| Married | Single | Married | Single | %Married | %Single | Married | Single | %Married | %Single | |
| 65 | 698 | 755 | 555 | 358 | 61% | 39% | 143 | 397 | 26% | 74% |
| 66 | 838 | 881 | 631 | 373 | 63% | 37% | 207 | 508 | 29% | 71% |
| 67 | 803 | 961 | 592 | 419 | 59% | 41% | 211 | 542 | 28% | 72% |
| 68 | 883 | 999 | 633 | 397 | 61% | 39% | 250 | 602 | 29% | 71% |
| 69 | 947 | 1131 | 653 | 446 | 59% | 41% | 294 | 685 | 30% | 70% |
| 70 | 1,020 | 1,161 | 709 | 449 | 61% | 39% | 311 | 712 | 30% | 70% |
| 71 | 1,114 | 1,309 | 819 | 530 | 61% | 39% | 295 | 779 | 27% | 73% |
| 72 | 1,158 | 1,564 | 827 | 621 | 57% | 43% | 331 | 943 | 26% | 74% |
| 73 | 1,088 | 1,383 | 773 | 548 | 59% | 41% | 315 | 835 | 27% | 73% |
| 74 | 1,057 | 1,453 | 725 | 555 | 57% | 43% | 332 | 898 | 27% | 73% |
| 75 | 1,098 | 1,559 | 748 | 645 | 54% | 46% | 350 | 914 | 28% | 72% |
| 76 | 1,120 | 1,642 | 757 | 678 | 53% | 47% | 363 | 964 | 27% | 73% |
| 77 | 1,031 | 1,813 | 686 | 726 | 49% | 51% | 345 | 1087 | 24% | 76% |
| 78 | 1,179 | 1,945 | 765 | 846 | 47% | 53% | 414 | 1099 | 27% | 73% |
| 79 | 1,037 | 2,113 | 676 | 857 | 44% | 56% | 361 | 1256 | 22% | 78% |
| 80 | 1,099 | 2,184 | 703 | 875 | 45% | 55% | 396 | 1309 | 23% | 77% |
| 81 | 1,044 | 2,410 | 664 | 1043 | 39% | 61% | 380 | 1367 | 22% | 78% |
| 82 | 1,097 | 2,599 | 666 | 1135 | 37% | 63% | 431 | 1464 | 23% | 77% |
| 83 | 1,045 | 2,905 | 681 | 1323 | 34% | 66% | 364 | 1582 | 19% | 81% |
| 84 | 1,026 | 3,191 | 633 | 1428 | 31% | 69% | 393 | 1763 | 18% | 82% |
| 85 | 935 | 3,329 | 585 | 1443 | 29% | 71% | 350 | 1886 | 16% | 84% |
| 86 | 928 | 3,733 | 577 | 1705 | 25% | 75% | 351 | 2028 | 15% | 85% |
| 87 | 844 | 3,974 | 549 | 1,743 | 24% | 76% | 295 | 2231 | 12% | 88% |
| 88 | 817 | 4,295 | 514 | 1859 | 22% | 78% | 303 | 2436 | 11% | 89% |
| 89 | 705 | 4,469 | 454 | 1978 | 19% | 81% | 251 | 2491 | 9% | 91% |
| 90 | 625 | 4,604 | 403 | 2040 | 16% | 84% | 222 | 2564 | 8% | 92% |
| 91 | 509 | 4,620 | 333 | 2055 | 14% | 86% | 176 | 2565 | 6% | 94% |
| 92 | 412 | 4,540 | 275 | 2038 | 12% | 88% | 137 | 2502 | 5% | 95% |
| 93 | 325 | 4,277 | 215 | 1893 | 10% | 90% | 110 | 2384 | 4% | 96% |
| 94 | 226 | 4082 | 155 | 1791 | 8% | 92% | 71 | 2291 | 3% | 97% |
| 95 | 168 | 3595 | 110 | 1554 | 7% | 93% | 58 | 2041 | 3% | 97% |
| 96 | 124 | 3127 | 75 | 1360 | 5% | 95% | 49 | 1767 | 3% | 97% |
| 97 | 75 | 2712 | 51 | 1176 | 4% | 96% | 24 | 1536 | 2% | 98% |
| 98 | 59 | 2104 | 38 | 839 | 4% | 96% | 21 | 1265 | 2% | 98% |
| 99 | 38 | 1630 | 27 | 628 | 4% | 96% | 11 | 1002 | 1% | 99% |
| 100 | 12 | 1130 | 10 | 398 | 2% | 98% | 2 | 732 | 0% | 100% |
| 101 | 7 | 712 | 6 | 260 | 2% | 98% | 1 | 452 | 0% | 100% |
| 102 | 1 | 532 | 1 | 170 | 1% | 99% | 0 | 362 | 0% | 100% |
| 103 | 4 | 366 | 3 | 125 | 2% | 98% | 1 | 241 | 0% | 100% |
| 104 | 0 | 242 | 0 | 71 | 0% | 100% | 0 | 171 | 0% | 100% |
| 105+ | 0 | 332 | 0 | 82 | 0% | 100% | 0 | 250 | 0% | 100% |
| Total | 27,196 | 92,363 | 18,277 | 39,460 | 32% | 68% | 8,919 | 52,903 | 14% | 86% |
| Age | Overall | without GIS | with GIS | |||||||
|---|---|---|---|---|---|---|---|---|---|---|
| Married | Single | Married | Single | %Married | %Single | Married | Single | %Married | %Single | |
| 65 | 135,501 | 56,685 | 115,220 | 35,701 | 76% | 24% | 20,280 | 20,984 | 49% | 51% |
| 66 | 135,671 | 56,389 | 114,395 | 34,043 | 77% | 23% | 21,276 | 22,346 | 49% | 51% |
| 67 | 130,760 | 53,201 | 106,551 | 29,924 | 78% | 22% | 24,209 | 23,277 | 51% | 49% |
| 68 | 128,599 | 50,868 | 103,129 | 27,884 | 79% | 21% | 25,470 | 22,984 | 53% | 47% |
| 69 | 127,428 | 49,277 | 101,133 | 26,616 | 79% | 21% | 26,296 | 22,661 | 54% | 46% |
| 70 | 126,984 | 47,846 | 100,934 | 25,764 | 80% | 20% | 26,050 | 22,081 | 54% | 46% |
| 71 | 126,401 | 46,781 | 100,112 | 25,120 | 80% | 20% | 26,289 | 21,661 | 55% | 45% |
| 72 | 125,416 | 45,509 | 99,469 | 24,718 | 80% | 20% | 25,947 | 20,792 | 56% | 44% |
| 73 | 105,726 | 38,634 | 82,494 | 20,815 | 80% | 20% | 23,232 | 17,819 | 57% | 43% |
| 74 | 95,733 | 34,984 | 73,915 | 18,823 | 80% | 20% | 21,819 | 16,161 | 57% | 43% |
| 75 | 91,717 | 33,328 | 70,363 | 18,067 | 80% | 20% | 21,354 | 15,261 | 58% | 42% |
| 76 | 86,025 | 31,169 | 65,375 | 17,021 | 79% | 21% | 20,650 | 14,148 | 59% | 41% |
| 77 | 76,800 | 28,683 | 57,205 | 15,551 | 79% | 21% | 19,595 | 13,132 | 60% | 40% |
| 78 | 69,727 | 26,845 | 51,095 | 14,470 | 78% | 22% | 18,632 | 12,375 | 60% | 40% |
| 79 | 63,368 | 24,484 | 45,675 | 13,229 | 78% | 22% | 17,693 | 11,255 | 61% | 39% |
| 80 | 58,322 | 23,212 | 41,591 | 12,743 | 77% | 23% | 16,731 | 10,469 | 62% | 38% |
| 81 | 52,543 | 21,939 | 36,910 | 12,189 | 75% | 25% | 15,634 | 9,750 | 62% | 38% |
| 82 | 46,911 | 20,628 | 32,769 | 11,567 | 74% | 26% | 14,142 | 9,061 | 61% | 39% |
| 83 | 42,752 | 19,916 | 29,706 | 11,291 | 72% | 28% | 13,045 | 8,625 | 60% | 40% |
| 84 | 37,712 | 18,474 | 25,997 | 10,648 | 71% | 29% | 11,715 | 7,826 | 60% | 40% |
| 85 | 32,850 | 17,696 | 22,372 | 10,411 | 68% | 32% | 10,477 | 7,284 | 59% | 41% |
| 86 | 29,149 | 16,793 | 19,830 | 9,958 | 67% | 33% | 9,319 | 6,835 | 58% | 42% |
| 87 | 24,990 | 15,822 | 16,988 | 9,448 | 64% | 36% | 8,002 | 6,373 | 56% | 44% |
| 88 | 21,042 | 14,546 | 14,392 | 8,909 | 62% | 38% | 6,650 | 5,637 | 54% | 46% |
| 89 | 16,841 | 12,904 | 11,272 | 7,876 | 59% | 41% | 5,568 | 5,028 | 53% | 47% |
| 90 | 12,782 | 10,987 | 8,498 | 6,806 | 56% | 44% | 4,284 | 4,181 | 51% | 49% |
| 91 | 9,806 | 9,702 | 6,537 | 6,062 | 52% | 48% | 3,269 | 3,640 | 47% | 53% |
| 92 | 7,188 | 7,930 | 4,725 | 4,963 | 49% | 51% | 2,463 | 2,967 | 45% | 55% |
| 93 | 5,154 | 6,477 | 3,369 | 4,151 | 45% | 55% | 1,785 | 2,326 | 43% | 57% |
| 94 | 3,542 | 5,177 | 2,303 | 3,342 | 41% | 59% | 1,239 | 1,834 | 40% | 60% |
| 95 | 2,394 | 3,890 | 1,562 | 2,491 | 39% | 61% | 832 | 1,399 | 37% | 63% |
| 96 | 1,527 | 2,861 | 1,002 | 1,844 | 35% | 65% | 525 | 1,017 | 34% | 66% |
| 97 | 992 | 2,092 | 654 | 1,333 | 33% | 67% | 338 | 759 | 31% | 69% |
| 98 | 628 | 1,352 | 400 | 836 | 32% | 68% | 227 | 517 | 31% | 69% |
| 99 | 330 | 915 | 208 | 535 | 28% | 72% | 122 | 379 | 24% | 76% |
| 100 | 160 | 485 | 97 | 281 | 26% | 74% | 64 | 205 | 24% | 76% |
| 101 | 82 | 331 | 51 | 189 | 21% | 79% | 30 | 142 | 18% | 82% |
| 102 | 38 | 178 | 19 | 88 | 18% | 82% | 19 | 90 | 17% | 83% |
| 103 | 25 | 114 | 8 | 51 | 14% | 86% | 17 | 63 | 21% | 79% |
| 104 | 15 | 73 | 8 | 31 | 21% | 79% | 7 | 42 | 14% | 86% |
| 105+ | 23 | 83 | 12 | 33 | 26% | 74% | 11 | 51 | 18% | 82% |
| Total | 2,033,652 | 859,258 | 1,568,346 | 485,821 | 76% | 24% | 465,306 | 373,437 | 55% | 45% |
| Age | Overall | without GIS | with GIS | |||||||
|---|---|---|---|---|---|---|---|---|---|---|
| Married | Single | Married | Single | %Married | %Single | Married | Single | %Married | %Single | |
| 65 | 130,651 | 74,415 | 111,165 | 46,529 | 70% | 30% | 19,486 | 27,886 | 41% | 59% |
| 66 | 130,086 | 76,796 | 108,524 | 45,803 | 70% | 30% | 21,563 | 30,992 | 41% | 59% |
| 67 | 124,116 | 75,229 | 101,472 | 42,478 | 70% | 30% | 22,644 | 32,751 | 41% | 59% |
| 68 | 119,806 | 75,293 | 96,309 | 41,127 | 70% | 30% | 23,497 | 34,166 | 41% | 59% |
| 69 | 115,823 | 75,791 | 91,844 | 40,378 | 69% | 31% | 23,978 | 35,413 | 40% | 60% |
| 70 | 112,837 | 76,710 | 88,944 | 40,280 | 69% | 31% | 23,893 | 36,430 | 40% | 60% |
| 71 | 109,656 | 77,784 | 85,649 | 40,698 | 68% | 32% | 24,007 | 37,085 | 39% | 61% |
| 72 | 106,158 | 79,302 | 82,792 | 41,686 | 67% | 33% | 23,367 | 37,616 | 38% | 62% |
| 73 | 87,861 | 69,974 | 67,440 | 36,145 | 65% | 35% | 20,422 | 33,829 | 38% | 62% |
| 74 | 77,213 | 66,349 | 58,352 | 33,678 | 63% | 37% | 18,861 | 32,671 | 37% | 63% |
| 75 | 72,489 | 66,418 | 54,561 | 33,996 | 62% | 38% | 17,928 | 32,422 | 36% | 64% |
| 76 | 65,951 | 65,596 | 49,075 | 33,503 | 59% | 41% | 16,877 | 32,094 | 34% | 66% |
| 77 | 58,056 | 62,434 | 42,552 | 31,054 | 58% | 42% | 15,504 | 31,380 | 33% | 67% |
| 78 | 51,914 | 61,382 | 37,519 | 30,185 | 55% | 45% | 14,395 | 31,196 | 32% | 68% |
| 79 | 45,515 | 59,564 | 32,309 | 28,824 | 53% | 47% | 13,206 | 30,740 | 30% | 70% |
| 80 | 40,450 | 58,501 | 28,517 | 28,150 | 50% | 50% | 11,934 | 30,351 | 28% | 72% |
| 81 | 35,180 | 57,564 | 24,461 | 27,686 | 47% | 53% | 10,719 | 29,877 | 26% | 74% |
| 82 | 30,304 | 55,590 | 20,878 | 26,786 | 44% | 56% | 9,426 | 28,804 | 25% | 75% |
| 83 | 26,449 | 55,292 | 18,216 | 26,628 | 41% | 59% | 8,233 | 28,664 | 22% | 78% |
| 84 | 22,285 | 53,765 | 15,215 | 25,784 | 37% | 63% | 7,070 | 27,981 | 20% | 80% |
| 85 | 18,625 | 51,517 | 12,714 | 24,529 | 34% | 66% | 5,910 | 26,987 | 18% | 82% |
| 86 | 15,619 | 50,513 | 10,595 | 24,165 | 30% | 70% | 5,025 | 26,348 | 16% | 84% |
| 87 | 12,670 | 48,885 | 8,596 | 23,511 | 27% | 73% | 4,074 | 25,373 | 14% | 86% |
| 88 | 10,114 | 46,302 | 6,931 | 22,082 | 24% | 76% | 3,182 | 24,220 | 12% | 88% |
| 89 | 7,714 | 42,188 | 5,244 | 20,038 | 21% | 79% | 2,470 | 22,151 | 10% | 90% |
| 90 | 5,545 | 37,577 | 3,725 | 17,593 | 17% | 83% | 1,819 | 19,984 | 8% | 92% |
| 91 | 4,154 | 33,780 | 2,806 | 15,680 | 15% | 85% | 1,349 | 18,100 | 7% | 93% |
| 92 | 2,864 | 29,258 | 1,966 | 13,314 | 13% | 87% | 897 | 15,944 | 5% | 95% |
| 93 | 1,946 | 24,990 | 1,349 | 11,334 | 11% | 89% | 597 | 13,656 | 4% | 96% |
| 94 | 1,301 | 20,851 | 902 | 9,402 | 9% | 91% | 399 | 11,449 | 3% | 97% |
| 95 | 831 | 16,721 | 595 | 7,464 | 7% | 93% | 236 | 9,257 | 2% | 98% |
| 96 | 540 | 13,030 | 372 | 5,786 | 6% | 94% | 168 | 7,244 | 2% | 98% |
| 97 | 306 | 10,026 | 221 | 4,223 | 5% | 95% | 85 | 5,803 | 1% | 99% |
| 98 | 166 | 7,018 | 117 | 2,885 | 4% | 96% | 48 | 4,133 | 1% | 99% |
| 99 | 95 | 4,923 | 65 | 1,900 | 3% | 97% | 30 | 3,023 | 1% | 99% |
| 100 | 45 | 2,988 | 35 | 1,069 | 3% | 97% | 10 | 1,919 | 0% | 100% |
| 101 | 17 | 1,938 | 10 | 690 | 1% | 99% | 7 | 1,248 | 1% | 99% |
| 102 | 11 | 1,242 | 6 | 390 | 1% | 99% | 5 | 852 | 1% | 99% |
| 103 | 6 | 783 | 5 | 236 | 2% | 98% | 1 | 546 | 0% | 100% |
| 104 | 4 | 495 | 3 | 150 | 2% | 98% | 1 | 345 | 0% | 100% |
| 105+ | 3 | 600 | 1 | 165 | 1% | 99% | 2 | 435 | 0% | 100% |
| Total | 1,645,376 | 1,789,372 | 1,272,052 | 908,005 | 58% | 42% | 373,324 | 881,367 | 30% | 70% |
| Age | Overall | Married | Ratio Married to Overall |
Single | Ratio Single to Overall |
Ratio Single to Married |
|---|---|---|---|---|---|---|
| 65 | 12.0 | 8.0 | 0.67 | 21.4 | 1.79 | 2.68 |
| 66 | 13.0 | 9.0 | 0.69 | 22.7 | 1.74 | 2.52 |
| 67 | 14.1 | 10.1 | 0.71 | 24.1 | 1.71 | 2.40 |
| 68 | 15.4 | 11.2 | 0.73 | 25.7 | 1.68 | 2.30 |
| 69 | 16.7 | 12.4 | 0.75 | 27.6 | 1.65 | 2.22 |
| 70 | 18.1 | 13.8 | 0.76 | 29.6 | 1.63 | 2.15 |
| 71 | 19.7 | 15.2 | 0.77 | 31.9 | 1.62 | 2.10 |
| 72 | 21.5 | 16.8 | 0.78 | 34.3 | 1.59 | 2.04 |
| 73 | 23.5 | 18.6 | 0.79 | 36.9 | 1.57 | 1.98 |
| 74 | 25.8 | 20.7 | 0.80 | 39.8 | 1.54 | 1.92 |
| 75 | 28.4 | 23.0 | 0.81 | 42.9 | 1.51 | 1.86 |
| 76 | 31.3 | 25.8 | 0.82 | 46.3 | 1.48 | 1.79 |
| 77 | 34.7 | 28.9 | 0.83 | 50.0 | 1.44 | 1.73 |
| 78 | 38.4 | 32.5 | 0.84 | 54.0 | 1.41 | 1.66 |
| 79 | 42.7 | 36.5 | 0.86 | 58.5 | 1.37 | 1.60 |
| 80 | 47.5 | 41.1 | 0.87 | 63.4 | 1.33 | 1.54 |
| 81 | 52.9 | 46.3 | 0.87 | 68.8 | 1.30 | 1.49 |
| 82 | 59.1 | 52.2 | 0.88 | 74.9 | 1.27 | 1.43 |
| 83 | 66.2 | 59.0 | 0.89 | 81.9 | 1.24 | 1.39 |
| 84 | 74.3 | 66.6 | 0.90 | 89.9 | 1.21 | 1.35 |
| 85 | 83.6 | 75.3 | 0.90 | 99.1 | 1.19 | 1.32 |
| 86 | 94.1 | 85.2 | 0.90 | 109.4 | 1.16 | 1.28 |
| 87 | 106.0 | 96.2 | 0.91 | 121.0 | 1.14 | 1.26 |
| 88 | 119.2 | 108.6 | 0.91 | 133.8 | 1.12 | 1.23 |
| 89 | 133.8 | 122.4 | 0.91 | 147.8 | 1.11 | 1.21 |
| 90 | 149.7 | 137.4 | 0.92 | 163.0 | 1.09 | 1.19 |
| 91 | 166.8 | 153.8 | 0.92 | 179.4 | 1.08 | 1.17 |
| 92 | 185.1 | 171.6 | 0.93 | 196.9 | 1.06 | 1.15 |
| 93 | 204.3 | 190.8 | 0.93 | 215.1 | 1.05 | 1.13 |
| 94 | 224.4 | 211.3 | 0.94 | 234.0 | 1.04 | 1.11 |
| 95 | 245.0 | 232.8 | 0.95 | 253.4 | 1.03 | 1.09 |
| 96 | 266.2 | 255.2 | 0.96 | 273.0 | 1.03 | 1.07 |
| 97 | 287.6 | 278.4 | 0.97 | 293.6 | 1.02 | 1.05 |
| 98 | 309.7 | 302.1 | 0.98 | 315.0 | 1.02 | 1.04 |
| 99 | 332.5 | 326.3 | 0.98 | 337.1 | 1.01 | 1.03 |
| 100 | 355.8 | 350.8 | 0.99 | 359.8 | 1.01 | 1.03 |
| 101 | 379.4 | 375.5 | 0.99 | 382.9 | 1.01 | 1.02 |
| 102 | 403.2 | 400.2 | 0.99 | 406.2 | 1.01 | 1.01 |
| 103 | 427.1 | 424.9 | 0.99 | 429.6 | 1.01 | 1.01 |
| 104 | 450.9 | 449.3 | 1.00 | 452.9 | 1.00 | 1.01 |
| 105 | 474.4 | 473.4 | 1.00 | 476.1 | 1.00 | 1.01 |
| 110 | 583.3 | 583.3 | 1.00 | 583.9 | 1.00 | 1.00 |
| 115 | 664.6 | 664.6 | 1.00 | 664.6 | 1.00 | 1.00 |
| 120 | 700.0 | 700.0 | 1.00 | 700.0 | 1.00 | 1.00 |
| Age | Overall | Married | Ratio Married to Overall |
Single | Ratio Single to Overall |
Ratio Single to Married |
|---|---|---|---|---|---|---|
| 65 | 7.2 | 5.5 | 0.76 | 10.3 | 1.42 | 1.88 |
| 66 | 8.0 | 6.1 | 0.76 | 11.3 | 1.41 | 1.87 |
| 67 | 8.8 | 6.7 | 0.76 | 12.4 | 1.40 | 1.85 |
| 68 | 9.7 | 7.4 | 0.76 | 13.4 | 1.38 | 1.82 |
| 69 | 10.7 | 8.1 | 0.76 | 14.5 | 1.36 | 1.78 |
| 70 | 11.7 | 9.0 | 0.77 | 15.7 | 1.34 | 1.75 |
| 71 | 12.9 | 9.9 | 0.77 | 17.0 | 1.32 | 1.71 |
| 72 | 14.2 | 11.0 | 0.78 | 18.4 | 1.30 | 1.67 |
| 73 | 15.6 | 12.2 | 0.78 | 19.9 | 1.28 | 1.63 |
| 74 | 17.2 | 13.5 | 0.78 | 21.6 | 1.25 | 1.60 |
| 75 | 19.0 | 15.0 | 0.79 | 23.5 | 1.23 | 1.57 |
| 76 | 21.2 | 16.7 | 0.79 | 25.7 | 1.21 | 1.54 |
| 77 | 23.6 | 18.6 | 0.79 | 28.1 | 1.19 | 1.51 |
| 78 | 26.3 | 20.9 | 0.79 | 30.9 | 1.17 | 1.48 |
| 79 | 29.4 | 23.4 | 0.80 | 34.0 | 1.15 | 1.45 |
| 80 | 33.0 | 26.4 | 0.80 | 37.5 | 1.14 | 1.42 |
| 81 | 37.0 | 29.8 | 0.81 | 41.4 | 1.12 | 1.39 |
| 82 | 41.6 | 33.8 | 0.81 | 45.8 | 1.10 | 1.35 |
| 83 | 46.8 | 38.5 | 0.82 | 50.8 | 1.09 | 1.32 |
| 84 | 52.9 | 44.0 | 0.83 | 56.6 | 1.07 | 1.29 |
| 85 | 59.8 | 50.4 | 0.84 | 63.2 | 1.06 | 1.25 |
| 86 | 67.7 | 58.0 | 0.86 | 70.8 | 1.05 | 1.22 |
| 87 | 76.9 | 66.8 | 0.87 | 79.6 | 1.04 | 1.19 |
| 88 | 87.3 | 76.9 | 0.88 | 89.6 | 1.03 | 1.16 |
| 89 | 99.0 | 88.4 | 0.89 | 100.9 | 1.02 | 1.14 |
| 90 | 112.0 | 101.7 | 0.91 | 113.6 | 1.01 | 1.12 |
| 91 | 126.4 | 116.7 | 0.92 | 127.6 | 1.01 | 1.09 |
| 92 | 141.9 | 133.2 | 0.94 | 142.9 | 1.01 | 1.07 |
| 93 | 158.7 | 151.1 | 0.95 | 159.4 | 1.00 | 1.05 |
| 94 | 176.5 | 170.3 | 0.96 | 177.1 | 1.00 | 1.04 |
| 95 | 195.4 | 190.6 | 0.98 | 195.8 | 1.00 | 1.03 |
| 96 | 215.1 | 211.8 | 0.98 | 215.6 | 1.00 | 1.02 |
| 97 | 235.6 | 234.0 | 0.99 | 236.2 | 1.00 | 1.01 |
| 98 | 256.6 | 256.6 | 1.00 | 257.3 | 1.00 | 1.00 |
| 99 | 278.0 | 278.0 | 1.00 | 278.8 | 1.00 | 1.00 |
| 100 | 299.7 | 299.7 | 1.00 | 300.5 | 1.00 | 1.00 |
| 101 | 321.5 | 321.5 | 1.00 | 322.2 | 1.00 | 1.00 |
| 102 | 344.0 | 344.0 | 1.00 | 344.5 | 1.00 | 1.00 |
| 103 | 366.9 | 366.9 | 1.00 | 367.3 | 1.00 | 1.00 |
| 104 | 390.1 | 390.1 | 1.00 | 390.4 | 1.00 | 1.00 |
| 105 | 413.3 | 413.3 | 1.00 | 413.6 | 1.00 | 1.00 |
| 110 | 524.8 | 524.8 | 1.00 | 524.8 | 1.00 | 1.00 |
| 115 | 611.3 | 611.3 | 1.00 | 611.3 | 1.00 | 1.00 |
| 120 | 650.0 | 650.0 | 1.00 | 650.0 | 1.00 | 1.00 |
| Age | Males | Females | ||||||
|---|---|---|---|---|---|---|---|---|
| lx | 1,000 qx | dx | LifExp | lx | 1,000 qx | dx | LifExp | |
| 65 | 100,000 | 8.0 | 797 | 20.73 | 100,000 | 5.5 | 549 | 23.52 |
| 66 | 99,203 | 9.0 | 891 | 19.89 | 99,451 | 6.1 | 602 | 22.65 |
| 67 | 98,312 | 10.1 | 989 | 19.06 | 98,849 | 6.7 | 660 | 21.78 |
| 68 | 97,323 | 11.2 | 1,092 | 18.25 | 98,189 | 7.4 | 723 | 20.92 |
| 69 | 96,232 | 12.4 | 1,198 | 17.45 | 97,466 | 8.1 | 793 | 20.07 |
| 70 | 95,034 | 13.8 | 1,308 | 16.67 | 96,673 | 9.0 | 870 | 19.24 |
| 71 | 93,726 | 15.2 | 1,424 | 15.89 | 95,803 | 9.9 | 953 | 18.41 |
| 72 | 92,302 | 16.8 | 1,550 | 15.13 | 94,850 | 11.0 | 1,044 | 17.59 |
| 73 | 90,752 | 18.6 | 1,689 | 14.38 | 93,807 | 12.2 | 1,143 | 16.78 |
| 74 | 89,063 | 20.7 | 1,841 | 13.64 | 92,664 | 13.5 | 1,251 | 15.98 |
| 75 | 87,222 | 23.0 | 2,010 | 12.92 | 91,413 | 15.0 | 1,371 | 15.19 |
| 76 | 85,212 | 25.8 | 2,196 | 12.21 | 90,042 | 16.7 | 1,503 | 14.41 |
| 77 | 83,016 | 28.9 | 2,399 | 11.52 | 88,539 | 18.6 | 1,650 | 13.65 |
| 78 | 80,617 | 32.5 | 2,617 | 10.85 | 86,890 | 20.9 | 1,813 | 12.90 |
| 79 | 78,000 | 36.5 | 2,848 | 10.20 | 85,077 | 23.4 | 1,993 | 12.16 |
| 80 | 75,152 | 41.1 | 3,088 | 9.57 | 83,084 | 26.4 | 2,192 | 11.44 |
| 81 | 72,064 | 46.3 | 3,337 | 8.96 | 80,893 | 29.8 | 2,411 | 10.74 |
| 82 | 68,727 | 52.2 | 3,590 | 8.37 | 78,482 | 33.8 | 2,653 | 10.05 |
| 83 | 65,137 | 59.0 | 3,841 | 7.80 | 75,829 | 38.5 | 2,917 | 9.39 |
| 84 | 61,296 | 66.6 | 4,083 | 7.26 | 72,912 | 44.0 | 3,205 | 8.74 |
| 85 | 57,213 | 75.3 | 4,309 | 6.74 | 69,707 | 50.4 | 3,514 | 8.12 |
| 86 | 52,904 | 85.2 | 4,505 | 6.25 | 66,193 | 58.0 | 3,838 | 7.52 |
| 87 | 48,399 | 96.2 | 4,658 | 5.78 | 62,355 | 66.8 | 4,165 | 6.96 |
| 88 | 43,741 | 108.6 | 4,752 | 5.34 | 58,189 | 76.9 | 4,476 | 6.42 |
| 89 | 38,989 | 122.4 | 4,770 | 4.93 | 53,713 | 88.4 | 4,748 | 5.91 |
| 90 | 34,218 | 137.4 | 4,702 | 4.55 | 48,964 | 101.7 | 4,979 | 5.44 |
| 91 | 29,516 | 153.8 | 4,540 | 4.20 | 43,985 | 116.7 | 5,132 | 5.00 |
| 92 | 24,976 | 171.6 | 4,286 | 3.87 | 38,853 | 133.2 | 5,175 | 4.59 |
| 93 | 20,690 | 190.8 | 3,947 | 3.57 | 33,678 | 151.1 | 5,089 | 4.22 |
| 94 | 16,743 | 211.3 | 3,538 | 3.29 | 28,590 | 170.3 | 4,868 | 3.88 |
| 95 | 13,205 | 232.8 | 3,075 | 3.04 | 23,721 | 190.6 | 4,521 | 3.58 |
| 96 | 10,131 | 255.2 | 2,586 | 2.81 | 19,201 | 211.8 | 4,068 | 3.30 |
| 97 | 7,545 | 278.4 | 2,100 | 2.61 | 15,133 | 234.0 | 3,540 | 3.05 |
| 98 | 5,445 | 302.1 | 1,645 | 2.42 | 11,593 | 256.6 | 2,975 | 2.83 |
| 99 | 3,800 | 326.3 | 1,240 | 2.25 | 8,618 | 278.0 | 2,396 | 2.64 |
| 100 | 2,560 | 350.8 | 898 | 2.09 | 6,222 | 299.7 | 1,865 | 2.46 |
| 101 | 1,662 | 375.5 | 624 | 1.95 | 4,357 | 321.5 | 1,401 | 2.30 |
| 102 | 1,038 | 400.2 | 415 | 1.83 | 2,956 | 344.0 | 1,017 | 2.15 |
| 103 | 623 | 424.9 | 265 | 1.71 | 1,939 | 366.9 | 712 | 2.01 |
| 104 | 358 | 449.3 | 161 | 1.61 | 1,228 | 390.1 | 479 | 1.89 |
| 105 | 197 | 473.4 | 93 | 1.52 | 749 | 413.3 | 310 | 1.77 |
| 110 | 5 | 583.3 | 3 | 1.18 | 34 | 524.8 | 18 | 1.35 |
| 115 | 0 | 664.6 | 0 | 0.99 | 1 | 611.3 | 0 | 1.12 |
| 120 | 0 | 700.0 | 0 | 0.80 | 0 | 650.0 | 0 | 0.85 |
| Age | Males | Females | ||||||
|---|---|---|---|---|---|---|---|---|
| lx | 1,000 qx | dx | LifExp | lx | 1,000 qx | dx | LifExp | |
| 65 | 100,000 | 21.4 | 2,138 | 16.79 | 100,000 | 10.3 | 1,032 | 21.13 |
| 66 | 97,862 | 22.7 | 2,218 | 16.14 | 98,968 | 11.3 | 1,121 | 20.35 |
| 67 | 95,644 | 24.1 | 2,307 | 15.51 | 97,848 | 12.4 | 1,209 | 19.57 |
| 68 | 93,337 | 25.7 | 2,403 | 14.88 | 96,639 | 13.4 | 1,296 | 18.81 |
| 69 | 90,934 | 27.6 | 2,508 | 14.26 | 95,343 | 14.5 | 1,384 | 18.06 |
| 70 | 88,425 | 29.6 | 2,620 | 13.65 | 93,959 | 15.7 | 1,475 | 17.32 |
| 71 | 85,805 | 31.9 | 2,735 | 13.05 | 92,483 | 17.0 | 1,571 | 16.59 |
| 72 | 83,070 | 34.3 | 2,850 | 12.46 | 90,913 | 18.4 | 1,670 | 15.87 |
| 73 | 80,220 | 36.9 | 2,962 | 11.89 | 89,242 | 19.9 | 1,775 | 15.15 |
| 74 | 77,258 | 39.8 | 3,072 | 11.32 | 87,467 | 21.6 | 1,887 | 14.45 |
| 75 | 74,186 | 42.9 | 3,180 | 10.77 | 85,580 | 23.5 | 2,010 | 13.76 |
| 76 | 71,006 | 46.3 | 3,285 | 10.23 | 83,570 | 25.7 | 2,144 | 13.08 |
| 77 | 67,722 | 50.0 | 3,385 | 9.70 | 81,425 | 28.1 | 2,290 | 12.41 |
| 78 | 64,337 | 54.0 | 3,477 | 9.19 | 79,135 | 30.9 | 2,445 | 11.75 |
| 79 | 60,860 | 58.5 | 3,559 | 8.68 | 76,690 | 34.0 | 2,607 | 11.11 |
| 80 | 57,301 | 63.4 | 3,630 | 8.19 | 74,083 | 37.5 | 2,775 | 10.48 |
| 81 | 53,671 | 68.8 | 3,691 | 7.71 | 71,309 | 41.4 | 2,949 | 9.87 |
| 82 | 49,979 | 74.9 | 3,744 | 7.24 | 68,359 | 45.8 | 3,130 | 9.28 |
| 83 | 46,236 | 81.9 | 3,786 | 6.79 | 65,229 | 50.8 | 3,316 | 8.70 |
| 84 | 42,449 | 89.9 | 3,816 | 6.35 | 61,913 | 56.6 | 3,504 | 8.14 |
| 85 | 38,633 | 99.1 | 3,827 | 5.93 | 58,409 | 63.2 | 3,692 | 7.60 |
| 86 | 34,806 | 109.4 | 3,808 | 5.53 | 54,717 | 70.8 | 3,874 | 7.08 |
| 87 | 30,997 | 121.0 | 3,750 | 5.14 | 50,843 | 79.6 | 4,045 | 6.58 |
| 88 | 27,247 | 133.8 | 3,645 | 4.78 | 46,798 | 89.6 | 4,192 | 6.10 |
| 89 | 23,602 | 147.8 | 3,489 | 4.44 | 42,606 | 100.9 | 4,300 | 5.65 |
| 90 | 20,113 | 163.0 | 3,279 | 4.13 | 38,306 | 113.6 | 4,352 | 5.23 |
| 91 | 16,834 | 179.4 | 3,021 | 3.84 | 33,954 | 127.6 | 4,333 | 4.84 |
| 92 | 13,813 | 196.9 | 2,719 | 3.57 | 29,622 | 142.9 | 4,232 | 4.47 |
| 93 | 11,094 | 215.1 | 2,387 | 3.32 | 25,390 | 159.4 | 4,046 | 4.13 |
| 94 | 8,707 | 234.0 | 2,038 | 3.09 | 21,343 | 177.1 | 3,779 | 3.82 |
| 95 | 6,669 | 253.4 | 1,690 | 2.88 | 17,564 | 195.8 | 3,440 | 3.54 |
| 96 | 4,979 | 273.0 | 1,359 | 2.69 | 14,125 | 215.6 | 3,045 | 3.28 |
| 97 | 3,620 | 293.6 | 1,063 | 2.51 | 11,079 | 236.2 | 2,616 | 3.04 |
| 98 | 2,557 | 315.0 | 806 | 2.34 | 8,463 | 257.3 | 2,178 | 2.82 |
| 99 | 1,752 | 337.1 | 591 | 2.19 | 6,285 | 278.8 | 1,752 | 2.63 |
| 100 | 1,161 | 359.8 | 418 | 2.05 | 4,533 | 300.5 | 1,362 | 2.45 |
| 101 | 743 | 382.9 | 285 | 1.92 | 3,171 | 322.2 | 1,021 | 2.29 |
| 102 | 459 | 406.2 | 186 | 1.81 | 2,149 | 344.5 | 740 | 2.15 |
| 103 | 272 | 429.6 | 117 | 1.70 | 1,409 | 367.3 | 517 | 2.01 |
| 104 | 155 | 452.9 | 70 | 1.60 | 891 | 390.4 | 348 | 1.89 |
| 105 | 85 | 476.1 | 40 | 1.51 | 543 | 413.6 | 225 | 1.77 |
| 110 | 2 | 583.9 | 1 | 1.18 | 25 | 524.8 | 13 | 1.35 |
| 115 | 0 | 664.6 | 0 | 0.99 | 0 | 611.3 | 0 | 1.12 |
| 120 | 0 | 700.0 | 0 | 0.80 | 0 | 650.0 | 0 | 0.85 |
| Age | Overall | without GIS | with GIS | ||||||
|---|---|---|---|---|---|---|---|---|---|
| Married | Ratio Married to Overall |
Single | Ratio Single to Overall |
Married | Ratio Married to Overall |
Single | Ratio Single to Overall |
||
| 65 | 12.0 | 7.6 | 0.64 | 16.6 | 1.39 | 9.9 | 0.83 | 29.4 | 2.46 |
| 66 | 13.0 | 8.4 | 0.65 | 17.4 | 1.34 | 11.7 | 0.90 | 30.4 | 2.34 |
| 67 | 14.1 | 9.3 | 0.66 | 18.4 | 1.30 | 13.3 | 0.94 | 31.7 | 2.25 |
| 68 | 15.4 | 10.3 | 0.67 | 19.5 | 1.27 | 15.0 | 0.97 | 33.4 | 2.18 |
| 69 | 16.7 | 11.4 | 0.68 | 20.8 | 1.25 | 16.6 | 0.99 | 35.5 | 2.13 |
| 70 | 18.1 | 12.6 | 0.69 | 22.4 | 1.24 | 18.3 | 1.01 | 37.9 | 2.09 |
| 71 | 19.7 | 13.9 | 0.70 | 24.3 | 1.23 | 20.2 | 1.03 | 40.6 | 2.05 |
| 72 | 21.5 | 15.3 | 0.71 | 26.6 | 1.24 | 22.4 | 1.04 | 43.2 | 2.01 |
| 73 | 23.5 | 16.8 | 0.72 | 29.1 | 1.24 | 24.9 | 1.06 | 45.9 | 1.95 |
| 74 | 25.8 | 18.7 | 0.72 | 32.0 | 1.24 | 27.5 | 1.07 | 48.8 | 1.89 |
| 75 | 28.4 | 20.8 | 0.73 | 35.1 | 1.24 | 30.3 | 1.07 | 51.8 | 1.83 |
| 76 | 31.3 | 23.3 | 0.74 | 38.5 | 1.23 | 33.3 | 1.06 | 55.3 | 1.77 |
| 77 | 34.7 | 26.3 | 0.76 | 42.1 | 1.22 | 36.5 | 1.05 | 59.2 | 1.71 |
| 78 | 38.4 | 29.7 | 0.77 | 46.0 | 1.20 | 40.0 | 1.04 | 63.5 | 1.65 |
| 79 | 42.7 | 33.7 | 0.79 | 50.3 | 1.18 | 43.9 | 1.03 | 68.1 | 1.60 |
| 80 | 47.5 | 38.2 | 0.81 | 55.2 | 1.16 | 48.2 | 1.02 | 73.2 | 1.54 |
| 81 | 52.9 | 43.5 | 0.82 | 60.6 | 1.15 | 53.2 | 1.00 | 78.9 | 1.49 |
| 82 | 59.1 | 49.4 | 0.84 | 66.9 | 1.13 | 58.7 | 0.99 | 85.1 | 1.44 |
| 83 | 66.2 | 56.3 | 0.85 | 74.1 | 1.12 | 65.0 | 0.98 | 92.1 | 1.39 |
| 84 | 74.3 | 64.1 | 0.86 | 82.5 | 1.11 | 72.2 | 0.97 | 100.0 | 1.35 |
| 85 | 83.6 | 72.9 | 0.87 | 92.1 | 1.10 | 80.4 | 0.96 | 108.9 | 1.30 |
| 86 | 94.1 | 82.9 | 0.88 | 102.9 | 1.09 | 89.8 | 0.95 | 118.9 | 1.26 |
| 87 | 106.0 | 94.1 | 0.89 | 115.0 | 1.09 | 100.6 | 0.95 | 129.9 | 1.23 |
| 88 | 119.2 | 106.6 | 0.89 | 128.3 | 1.08 | 112.8 | 0.95 | 142.0 | 1.19 |
| 89 | 133.8 | 120.3 | 0.90 | 142.9 | 1.07 | 126.3 | 0.94 | 155.2 | 1.16 |
| 90 | 149.7 | 135.4 | 0.90 | 158.7 | 1.06 | 141.2 | 0.94 | 169.5 | 1.13 |
| 91 | 166.8 | 151.8 | 0.91 | 175.6 | 1.05 | 157.4 | 0.94 | 184.8 | 1.11 |
| 92 | 185.1 | 169.7 | 0.92 | 193.7 | 1.05 | 174.9 | 0.95 | 201.0 | 1.09 |
| 93 | 204.3 | 188.9 | 0.92 | 212.9 | 1.04 | 193.7 | 0.95 | 218.1 | 1.07 |
| 94 | 224.4 | 209.3 | 0.93 | 233.1 | 1.04 | 213.8 | 0.95 | 235.9 | 1.05 |
| 95 | 245.0 | 230.8 | 0.94 | 254.1 | 1.04 | 235.4 | 0.96 | 254.4 | 1.04 |
| 96 | 266.2 | 253.1 | 0.95 | 275.9 | 1.04 | 258.5 | 0.97 | 273.3 | 1.03 |
| 97 | 287.6 | 276.2 | 0.96 | 298.4 | 1.04 | 282.2 | 0.98 | 293.3 | 1.02 |
| 98 | 309.7 | 299.9 | 0.97 | 321.3 | 1.04 | 306.4 | 0.99 | 314.2 | 1.01 |
| 99 | 332.5 | 324.1 | 0.97 | 344.6 | 1.04 | 330.9 | 1.00 | 336.0 | 1.01 |
| 100 | 355.8 | 348.6 | 0.98 | 368.2 | 1.03 | 355.6 | 1.00 | 358.3 | 1.01 |
| 101 | 379.4 | 373.3 | 0.98 | 391.9 | 1.03 | 379.4 | 1.00 | 381.1 | 1.00 |
| 102 | 403.2 | 398.2 | 0.99 | 415.6 | 1.03 | 403.2 | 1.00 | 404.2 | 1.00 |
| 103 | 427.1 | 422.9 | 0.99 | 439.2 | 1.03 | 427.1 | 1.00 | 427.5 | 1.00 |
| 104 | 450.9 | 447.4 | 0.99 | 462.5 | 1.03 | 450.9 | 1.00 | 450.9 | 1.00 |
| 105 | 474.4 | 471.6 | 0.99 | 485.4 | 1.02 | 474.4 | 1.00 | 474.4 | 1.00 |
| 110 | 583.3 | 582.7 | 1.00 | 590.2 | 1.01 | 583.3 | 1.00 | 583.3 | 1.00 |
| 115 | 664.6 | 664.6 | 1.00 | 666.9 | 1.00 | 664.6 | 1.00 | 664.6 | 1.00 |
| 120 | 700.0 | 700.0 | 1.00 | 700.0 | 1.00 | 700.0 | 1.00 | 700.0 | 1.00 |
| Age | Overall | without GIS | with GIS | ||||||
|---|---|---|---|---|---|---|---|---|---|
| Married | Ratio Married to Overall |
Single | Ratio Single to Overall |
Married | Ratio Married to Overall | Single | Ratio Single to Overall | ||
| 65 | 7.2 | 5.1 | 0.70 | 7.7 | 1.06 | 7.8 | 1.08 | 14.7 | 2.02 |
| 66 | 8.0 | 5.5 | 0.68 | 8.4 | 1.05 | 8.9 | 1.11 | 15.6 | 1.95 |
| 67 | 8.8 | 6.0 | 0.67 | 9.1 | 1.04 | 9.8 | 1.11 | 16.6 | 1.88 |
| 68 | 9.7 | 6.6 | 0.68 | 9.9 | 1.02 | 10.7 | 1.10 | 17.6 | 1.82 |
| 69 | 10.7 | 7.3 | 0.68 | 10.8 | 1.01 | 11.5 | 1.08 | 18.8 | 1.77 |
| 70 | 11.7 | 8.1 | 0.69 | 11.7 | 1.00 | 12.3 | 1.05 | 20.1 | 1.72 |
| 71 | 12.9 | 9.0 | 0.70 | 12.8 | 0.99 | 13.2 | 1.03 | 21.6 | 1.68 |
| 72 | 14.2 | 10.1 | 0.71 | 13.9 | 0.98 | 14.3 | 1.01 | 23.1 | 1.63 |
| 73 | 15.6 | 11.2 | 0.72 | 15.3 | 0.98 | 15.6 | 1.00 | 24.8 | 1.59 |
| 74 | 17.2 | 12.4 | 0.72 | 16.8 | 0.98 | 17.1 | 0.99 | 26.6 | 1.54 |
| 75 | 19.0 | 13.7 | 0.72 | 18.6 | 0.98 | 18.9 | 0.99 | 28.5 | 1.50 |
| 76 | 21.2 | 15.2 | 0.72 | 20.7 | 0.98 | 21.0 | 0.99 | 30.7 | 1.45 |
| 77 | 23.6 | 16.9 | 0.72 | 23.2 | 0.98 | 23.3 | 0.99 | 33.0 | 1.40 |
| 78 | 26.3 | 18.9 | 0.72 | 26.1 | 0.99 | 25.9 | 0.98 | 35.6 | 1.35 |
| 79 | 29.4 | 21.2 | 0.72 | 29.3 | 1.00 | 28.8 | 0.98 | 38.5 | 1.31 |
| 80 | 33.0 | 23.9 | 0.73 | 32.9 | 1.00 | 32.3 | 0.98 | 41.7 | 1.26 |
| 81 | 37.0 | 27.1 | 0.73 | 37.0 | 1.00 | 36.2 | 0.98 | 45.3 | 1.23 |
| 82 | 41.6 | 30.8 | 0.74 | 41.6 | 1.00 | 40.7 | 0.98 | 49.6 | 1.19 |
| 83 | 46.8 | 35.2 | 0.75 | 46.6 | 1.00 | 45.9 | 0.98 | 54.7 | 1.17 |
| 84 | 52.9 | 40.4 | 0.76 | 52.2 | 0.99 | 51.9 | 0.98 | 60.6 | 1.15 |
| 85 | 59.8 | 46.5 | 0.78 | 58.4 | 0.98 | 58.8 | 0.98 | 67.6 | 1.13 |
| 86 | 67.7 | 53.9 | 0.80 | 65.5 | 0.97 | 66.7 | 0.98 | 75.6 | 1.12 |
| 87 | 76.9 | 62.4 | 0.81 | 73.9 | 0.96 | 75.6 | 0.98 | 84.8 | 1.10 |
| 88 | 87.3 | 72.4 | 0.83 | 83.7 | 0.96 | 85.6 | 0.98 | 95.0 | 1.09 |
| 89 | 99.0 | 83.8 | 0.85 | 95.1 | 0.96 | 96.7 | 0.98 | 106.2 | 1.07 |
| 90 | 112.0 | 97.1 | 0.87 | 108.3 | 0.97 | 109.6 | 0.98 | 118.4 | 1.06 |
| 91 | 126.4 | 112.0 | 0.89 | 123.0 | 0.97 | 124.2 | 0.98 | 131.6 | 1.04 |
| 92 | 141.9 | 128.6 | 0.91 | 139.2 | 0.98 | 140.3 | 0.99 | 145.9 | 1.03 |
| 93 | 158.7 | 146.5 | 0.92 | 156.7 | 0.99 | 157.8 | 0.99 | 161.4 | 1.02 |
| 94 | 176.5 | 165.8 | 0.94 | 175.4 | 0.99 | 176.6 | 1.00 | 178.1 | 1.01 |
| 95 | 195.4 | 186.2 | 0.95 | 195.0 | 1.00 | 195.9 | 1.00 | 196.2 | 1.00 |
| 96 | 215.1 | 207.6 | 0.97 | 215.4 | 1.00 | 215.2 | 1.00 | 215.5 | 1.00 |
| 97 | 235.6 | 229.8 | 0.98 | 236.5 | 1.00 | 235.6 | 1.00 | 235.8 | 1.00 |
| 98 | 256.6 | 252.8 | 0.99 | 258.0 | 1.01 | 256.6 | 1.00 | 257.0 | 1.00 |
| 99 | 278.0 | 276.4 | 0.99 | 279.9 | 1.01 | 278.1 | 1.00 | 278.7 | 1.00 |
| 100 | 299.7 | 299.7 | 1.00 | 301.9 | 1.01 | 300.0 | 1.00 | 300.7 | 1.00 |
| 101 | 321.5 | 321.5 | 1.00 | 324.0 | 1.01 | 322.0 | 1.00 | 322.7 | 1.00 |
| 102 | 344.0 | 344.0 | 1.00 | 346.6 | 1.01 | 344.7 | 1.00 | 345.3 | 1.00 |
| 103 | 366.9 | 366.9 | 1.00 | 369.6 | 1.01 | 367.7 | 1.00 | 368.4 | 1.00 |
| 104 | 390.1 | 390.1 | 1.00 | 392.9 | 1.01 | 391.0 | 1.00 | 391.6 | 1.00 |
| 105 | 413.3 | 413.3 | 1.00 | 416.1 | 1.01 | 414.3 | 1.00 | 415.0 | 1.00 |
| 110 | 524.8 | 524.8 | 1.00 | 526.8 | 1.00 | 525.6 | 1.00 | 526.0 | 1.00 |
| 115 | 611.3 | 611.3 | 1.00 | 612.0 | 1.00 | 611.6 | 1.00 | 611.8 | 1.00 |
| 120 | 650.0 | 650.0 | 1.00 | 650.0 | 1.00 | 650.0 | 1.00 | 650.0 | 1.00 |
| Age | Males | Females | ||||||
|---|---|---|---|---|---|---|---|---|
| lx | 1,000 qx | dx | LifExp | lx | 1,000 qx | dx | LifExp | |
| 65 | 100,000 | 7.6 | 764 | 21.15 | 100,000 | 5.1 | 510 | 24.04 |
| 66 | 99,236 | 8.4 | 835 | 20.31 | 99,490 | 5.5 | 545 | 23.16 |
| 67 | 98,400 | 9.3 | 916 | 19.47 | 98,945 | 6.0 | 589 | 22.29 |
| 68 | 97,484 | 10.3 | 1,005 | 18.65 | 98,356 | 6.6 | 644 | 21.42 |
| 69 | 96,479 | 11.4 | 1,101 | 17.84 | 97,711 | 7.3 | 711 | 20.56 |
| 70 | 95,377 | 12.6 | 1,202 | 17.04 | 97,001 | 8.1 | 787 | 19.70 |
| 71 | 94,175 | 13.9 | 1,306 | 16.25 | 96,214 | 9.0 | 870 | 18.86 |
| 72 | 92,869 | 15.3 | 1,417 | 15.47 | 95,344 | 10.1 | 959 | 18.03 |
| 73 | 91,452 | 16.8 | 1,540 | 14.71 | 94,385 | 11.2 | 1,053 | 17.21 |
| 74 | 89,912 | 18.7 | 1,677 | 13.95 | 93,331 | 12.4 | 1,153 | 16.40 |
| 75 | 88,235 | 20.8 | 1,834 | 13.21 | 92,178 | 13.7 | 1,262 | 15.59 |
| 76 | 86,401 | 23.3 | 2,015 | 12.48 | 90,917 | 15.2 | 1,381 | 14.80 |
| 77 | 84,386 | 26.3 | 2,218 | 11.76 | 89,536 | 16.9 | 1,515 | 14.02 |
| 78 | 82,168 | 29.7 | 2,443 | 11.07 | 88,021 | 18.9 | 1,665 | 13.26 |
| 79 | 79,725 | 33.7 | 2,686 | 10.39 | 86,356 | 21.2 | 1,833 | 12.50 |
| 80 | 77,039 | 38.2 | 2,946 | 9.73 | 84,522 | 23.9 | 2,021 | 11.76 |
| 81 | 74,093 | 43.5 | 3,220 | 9.10 | 82,501 | 27.1 | 2,233 | 11.04 |
| 82 | 70,873 | 49.4 | 3,504 | 8.49 | 80,268 | 30.8 | 2,470 | 10.33 |
| 83 | 67,369 | 56.3 | 3,792 | 7.91 | 77,799 | 35.2 | 2,735 | 9.64 |
| 84 | 63,577 | 64.1 | 4,075 | 7.35 | 75,064 | 40.4 | 3,029 | 8.98 |
| 85 | 59,502 | 72.9 | 4,340 | 6.82 | 72,035 | 46.5 | 3,352 | 8.33 |
| 86 | 55,162 | 82.9 | 4,575 | 6.31 | 68,683 | 53.9 | 3,699 | 7.72 |
| 87 | 50,587 | 94.1 | 4,761 | 5.84 | 64,984 | 62.4 | 4,058 | 7.13 |
| 88 | 45,826 | 106.6 | 4,883 | 5.40 | 60,926 | 72.4 | 4,412 | 6.57 |
| 89 | 40,943 | 120.3 | 4,925 | 4.98 | 56,514 | 83.8 | 4,736 | 6.04 |
| 90 | 36,018 | 135.4 | 4,876 | 4.59 | 51,778 | 97.1 | 5,026 | 5.55 |
| 91 | 31,142 | 151.8 | 4,728 | 4.23 | 46,752 | 112.0 | 5,238 | 5.09 |
| 92 | 26,414 | 169.7 | 4,483 | 3.90 | 41,514 | 128.6 | 5,337 | 4.67 |
| 93 | 21,931 | 188.9 | 4,144 | 3.60 | 36,177 | 146.5 | 5,301 | 4.29 |
| 94 | 17,787 | 209.3 | 3,723 | 3.32 | 30,876 | 165.8 | 5,119 | 3.94 |
| 95 | 14,063 | 230.8 | 3,245 | 3.06 | 25,757 | 186.2 | 4,796 | 3.62 |
| 96 | 10,818 | 253.1 | 2,738 | 2.83 | 20,961 | 207.6 | 4,351 | 3.33 |
| 97 | 8,080 | 276.2 | 2,231 | 2.62 | 16,610 | 229.8 | 3,818 | 3.08 |
| 98 | 5,849 | 299.9 | 1,754 | 2.43 | 12,792 | 252.8 | 3,234 | 2.85 |
| 99 | 4,095 | 324.1 | 1,327 | 2.26 | 9,558 | 276.4 | 2,641 | 2.64 |
| 100 | 2,768 | 348.6 | 965 | 2.11 | 6,917 | 299.7 | 2,073 | 2.46 |
| 101 | 1,803 | 373.3 | 673 | 1.97 | 4,844 | 321.5 | 1,557 | 2.30 |
| 102 | 1,130 | 398.2 | 450 | 1.84 | 3,286 | 344.0 | 1,130 | 2.15 |
| 103 | 680 | 422.9 | 288 | 1.72 | 2,156 | 366.9 | 791 | 2.01 |
| 104 | 392 | 447.4 | 176 | 1.62 | 1,365 | 390.1 | 532 | 1.89 |
| 105 | 217 | 471.6 | 102 | 1.53 | 833 | 413.3 | 344 | 1.77 |
| 110 | 6 | 582.7 | 3 | 1.18 | 38 | 524.8 | 20 | 1.35 |
| 115 | 0 | 664.6 | 0 | 0.99 | 1 | 611.3 | 0 | 1.12 |
| 120 | 0 | 700.0 | 0 | 0.80 | 0 | 650.0 | 0 | 0.85 |
| Age | Males | Females | ||||||
|---|---|---|---|---|---|---|---|---|
| lx | 1,000 qx | dx | LifExp | lx | 1,000 qx | dx | LifExp | |
| 65 | 100,000 | 9.9 | 994 | 19.49 | 100,000 | 7.8 | 779 | 22.19 |
| 66 | 99,006 | 11.7 | 1,155 | 18.68 | 99,221 | 8.9 | 880 | 21.36 |
| 67 | 97,851 | 13.3 | 1,304 | 17.89 | 98,341 | 9.8 | 967 | 20.55 |
| 68 | 96,547 | 15.0 | 1,444 | 17.13 | 97,374 | 10.7 | 1,043 | 19.75 |
| 69 | 95,103 | 16.6 | 1,578 | 16.38 | 96,331 | 11.5 | 1,110 | 18.96 |
| 70 | 93,526 | 18.3 | 1,713 | 15.65 | 95,221 | 12.3 | 1,174 | 18.17 |
| 71 | 91,813 | 20.2 | 1,859 | 14.93 | 94,047 | 13.2 | 1,242 | 17.39 |
| 72 | 89,954 | 22.4 | 2,019 | 14.23 | 92,805 | 14.3 | 1,324 | 16.62 |
| 73 | 87,935 | 24.9 | 2,189 | 13.54 | 91,481 | 15.6 | 1,423 | 15.85 |
| 74 | 85,746 | 27.5 | 2,362 | 12.88 | 90,058 | 17.1 | 1,541 | 15.10 |
| 75 | 83,384 | 30.3 | 2,531 | 12.23 | 88,517 | 18.9 | 1,674 | 14.35 |
| 76 | 80,854 | 33.3 | 2,694 | 11.59 | 86,842 | 21.0 | 1,820 | 13.62 |
| 77 | 78,160 | 36.5 | 2,853 | 10.98 | 85,022 | 23.3 | 1,978 | 12.90 |
| 78 | 75,307 | 40.0 | 3,011 | 10.37 | 83,044 | 25.9 | 2,149 | 12.19 |
| 79 | 72,296 | 43.9 | 3,172 | 9.78 | 80,895 | 28.8 | 2,333 | 11.50 |
| 80 | 69,124 | 48.2 | 3,334 | 9.21 | 78,562 | 32.3 | 2,534 | 10.83 |
| 81 | 65,790 | 53.2 | 3,497 | 8.65 | 76,028 | 36.2 | 2,751 | 10.17 |
| 82 | 62,293 | 58.7 | 3,658 | 8.11 | 73,278 | 40.7 | 2,983 | 9.54 |
| 83 | 58,635 | 65.0 | 3,814 | 7.58 | 70,294 | 45.9 | 3,228 | 8.92 |
| 84 | 54,821 | 72.2 | 3,960 | 7.08 | 67,067 | 51.9 | 3,481 | 8.33 |
| 85 | 50,862 | 80.4 | 4,091 | 6.59 | 63,586 | 58.8 | 3,738 | 7.75 |
| 86 | 46,771 | 89.8 | 4,202 | 6.12 | 59,847 | 66.7 | 3,990 | 7.21 |
| 87 | 42,569 | 100.6 | 4,282 | 5.67 | 55,857 | 75.6 | 4,222 | 6.69 |
| 88 | 38,287 | 112.8 | 4,317 | 5.25 | 51,635 | 85.6 | 4,420 | 6.19 |
| 89 | 33,970 | 126.3 | 4,292 | 4.86 | 47,215 | 96.7 | 4,564 | 5.73 |
| 90 | 29,678 | 141.2 | 4,192 | 4.49 | 42,651 | 109.6 | 4,673 | 5.28 |
| 91 | 25,486 | 157.4 | 4,013 | 4.14 | 37,977 | 124.2 | 4,715 | 4.87 |
| 92 | 21,474 | 174.9 | 3,756 | 3.82 | 33,262 | 140.3 | 4,666 | 4.49 |
| 93 | 17,718 | 193.7 | 3,432 | 3.53 | 28,597 | 157.8 | 4,512 | 4.14 |
| 94 | 14,286 | 213.8 | 3,055 | 3.26 | 24,084 | 176.6 | 4,253 | 3.83 |
| 95 | 11,231 | 235.4 | 2,644 | 3.01 | 19,831 | 195.9 | 3,886 | 3.54 |
| 96 | 8,587 | 258.5 | 2,220 | 2.78 | 15,945 | 215.2 | 3,431 | 3.28 |
| 97 | 6,367 | 282.2 | 1,797 | 2.57 | 12,514 | 235.6 | 2,948 | 3.04 |
| 98 | 4,570 | 306.4 | 1,400 | 2.39 | 9,566 | 256.6 | 2,455 | 2.83 |
| 99 | 3,170 | 330.9 | 1,049 | 2.22 | 7,112 | 278.1 | 1,978 | 2.63 |
| 100 | 2,121 | 355.6 | 754 | 2.07 | 5,134 | 300.0 | 1,540 | 2.45 |
| 101 | 1,367 | 379.4 | 519 | 1.94 | 3,594 | 322.0 | 1,157 | 2.29 |
| 102 | 848 | 403.2 | 342 | 1.82 | 2,436 | 344.7 | 840 | 2.14 |
| 103 | 506 | 427.1 | 216 | 1.71 | 1,597 | 367.7 | 587 | 2.01 |
| 104 | 290 | 450.9 | 131 | 1.61 | 1,010 | 391.0 | 395 | 1.88 |
| 105 | 159 | 474.4 | 76 | 1.52 | 615 | 414.3 | 255 | 1.77 |
| 110 | 4 | 583.3 | 2 | 1.18 | 28 | 525.6 | 15 | 1.35 |
| 115 | 0 | 664.6 | 0 | 0.99 | 0 | 611.6 | 0 | 1.12 |
| 120 | 0 | 700.0 | 0 | 0.80 | 0 | 650.0 | 0 | 0.85 |
| Age | Males | Females | ||||||
|---|---|---|---|---|---|---|---|---|
| lx | 1,000 qx | dx | LifExp | lx | 1,000 qx | dx | LifExp | |
| 65 | 100,000 | 16.6 | 1,663 | 18.14 | 100,000 | 7.7 | 770 | 22.29 |
| 66 | 98,337 | 17.4 | 1,711 | 17.43 | 99,230 | 8.4 | 834 | 21.45 |
| 67 | 96,626 | 18.4 | 1,773 | 16.73 | 98,396 | 9.1 | 900 | 20.63 |
| 68 | 94,853 | 19.5 | 1,848 | 16.04 | 97,496 | 9.9 | 969 | 19.82 |
| 69 | 93,005 | 20.8 | 1,938 | 15.35 | 96,527 | 10.8 | 1,042 | 19.01 |
| 70 | 91,067 | 22.4 | 2,044 | 14.66 | 95,485 | 11.7 | 1,120 | 18.21 |
| 71 | 89,024 | 24.3 | 2,167 | 13.99 | 94,365 | 12.8 | 1,206 | 17.42 |
| 72 | 86,857 | 26.6 | 2,309 | 13.32 | 93,159 | 13.9 | 1,299 | 16.64 |
| 73 | 84,548 | 29.1 | 2,464 | 12.67 | 91,860 | 15.3 | 1,402 | 15.87 |
| 74 | 82,084 | 32.0 | 2,627 | 12.04 | 90,458 | 16.8 | 1,520 | 15.11 |
| 75 | 79,456 | 35.1 | 2,793 | 11.42 | 88,939 | 18.6 | 1,655 | 14.36 |
| 76 | 76,664 | 38.5 | 2,953 | 10.82 | 87,284 | 20.7 | 1,810 | 13.62 |
| 77 | 73,710 | 42.1 | 3,106 | 10.23 | 85,474 | 23.2 | 1,984 | 12.90 |
| 78 | 70,605 | 46.0 | 3,251 | 9.66 | 83,490 | 26.1 | 2,176 | 12.19 |
| 79 | 67,354 | 50.3 | 3,391 | 9.10 | 81,315 | 29.3 | 2,382 | 11.51 |
| 80 | 63,962 | 55.2 | 3,529 | 8.56 | 78,933 | 32.9 | 2,600 | 10.84 |
| 81 | 60,434 | 60.6 | 3,664 | 8.03 | 76,333 | 37.0 | 2,828 | 10.19 |
| 82 | 56,769 | 66.9 | 3,798 | 7.51 | 73,505 | 41.6 | 3,058 | 9.56 |
| 83 | 52,971 | 74.1 | 3,927 | 7.02 | 70,448 | 46.6 | 3,284 | 8.96 |
| 84 | 49,044 | 82.5 | 4,047 | 6.54 | 67,164 | 52.2 | 3,503 | 8.37 |
| 85 | 44,997 | 92.1 | 4,144 | 6.08 | 63,661 | 58.4 | 3,716 | 7.80 |
| 86 | 40,853 | 102.9 | 4,205 | 5.65 | 59,944 | 65.5 | 3,928 | 7.26 |
| 87 | 36,648 | 115.0 | 4,215 | 5.24 | 56,016 | 73.9 | 4,138 | 6.73 |
| 88 | 32,433 | 128.3 | 4,162 | 4.86 | 51,878 | 83.7 | 4,341 | 6.23 |
| 89 | 28,271 | 142.9 | 4,039 | 4.50 | 47,537 | 95.1 | 4,522 | 5.75 |
| 90 | 24,232 | 158.7 | 3,845 | 4.16 | 43,015 | 108.3 | 4,657 | 5.30 |
| 91 | 20,387 | 175.6 | 3,581 | 3.85 | 38,357 | 123.0 | 4,718 | 4.89 |
| 92 | 16,806 | 193.7 | 3,255 | 3.57 | 33,639 | 139.2 | 4,683 | 4.50 |
| 93 | 13,551 | 212.9 | 2,885 | 3.31 | 28,956 | 156.7 | 4,539 | 4.15 |
| 94 | 10,666 | 233.1 | 2,486 | 3.06 | 24,417 | 175.4 | 4,283 | 3.83 |
| 95 | 8,180 | 254.1 | 2,079 | 2.84 | 20,134 | 195.0 | 3,926 | 3.53 |
| 96 | 6,101 | 275.9 | 1,684 | 2.64 | 16,208 | 215.4 | 3,492 | 3.27 |
| 97 | 4,418 | 298.4 | 1,318 | 2.46 | 12,716 | 236.5 | 3,007 | 3.03 |
| 98 | 3,100 | 321.3 | 996 | 2.29 | 9,709 | 258.0 | 2,505 | 2.81 |
| 99 | 2,104 | 344.6 | 725 | 2.14 | 7,204 | 279.9 | 2,016 | 2.62 |
| 100 | 1,379 | 368.2 | 508 | 2.00 | 5,188 | 301.9 | 1,566 | 2.44 |
| 101 | 871 | 391.9 | 341 | 1.87 | 3,622 | 324.0 | 1,173 | 2.28 |
| 102 | 530 | 415.6 | 220 | 1.76 | 2,448 | 346.6 | 849 | 2.13 |
| 103 | 310 | 439.2 | 136 | 1.66 | 1,600 | 369.6 | 591 | 2.00 |
| 104 | 174 | 462.5 | 80 | 1.56 | 1,008 | 392.9 | 396 | 1.87 |
| 105 | 93 | 485.4 | 45 | 1.48 | 612 | 416.1 | 255 | 1.76 |
| 110 | 2 | 590.2 | 1 | 1.16 | 27 | 526.8 | 14 | 1.35 |
| 115 | 0 | 666.9 | 0 | 0.99 | 0 | 612.0 | 0 | 1.12 |
| 120 | 0 | 700.0 | 0 | 0.80 | 0 | 650.0 | 0 | 0.85 |
| Age | Males | Females | ||||||
|---|---|---|---|---|---|---|---|---|
| lx | 1,000 qx | dx | LifExp | lx | 1,000 qx | dx | LifExp | |
| 65 | 100,000 | 29.4 | 2,942 | 15.29 | 100,000 | 14.7 | 1,466 | 19.96 |
| 66 | 97,058 | 30.4 | 2,950 | 14.74 | 98,534 | 15.6 | 1,535 | 19.25 |
| 67 | 94,108 | 31.7 | 2,986 | 14.18 | 96,999 | 16.6 | 1,607 | 18.55 |
| 68 | 91,122 | 33.4 | 3,048 | 13.63 | 95,392 | 17.6 | 1,683 | 17.85 |
| 69 | 88,075 | 35.5 | 3,129 | 13.09 | 93,709 | 18.8 | 1,765 | 17.16 |
| 70 | 84,945 | 37.9 | 3,223 | 12.55 | 91,944 | 20.1 | 1,851 | 16.48 |
| 71 | 81,722 | 40.6 | 3,314 | 12.03 | 90,093 | 21.6 | 1,944 | 15.81 |
| 72 | 78,408 | 43.2 | 3,390 | 11.51 | 88,149 | 23.1 | 2,039 | 15.15 |
| 73 | 75,018 | 45.9 | 3,446 | 11.01 | 86,110 | 24.8 | 2,135 | 14.50 |
| 74 | 71,572 | 48.8 | 3,490 | 10.52 | 83,975 | 26.6 | 2,232 | 13.85 |
| 75 | 68,082 | 51.8 | 3,530 | 10.03 | 81,743 | 28.5 | 2,331 | 13.22 |
| 76 | 64,552 | 55.3 | 3,570 | 9.55 | 79,411 | 30.7 | 2,434 | 12.59 |
| 77 | 60,982 | 59.2 | 3,609 | 9.08 | 76,977 | 33.0 | 2,541 | 11.97 |
| 78 | 57,374 | 63.5 | 3,641 | 8.62 | 74,436 | 35.6 | 2,651 | 11.36 |
| 79 | 53,733 | 68.1 | 3,662 | 8.17 | 71,786 | 38.5 | 2,762 | 10.76 |
| 80 | 50,071 | 73.2 | 3,668 | 7.73 | 69,023 | 41.7 | 2,877 | 10.17 |
| 81 | 46,403 | 78.9 | 3,659 | 7.30 | 66,146 | 45.3 | 2,999 | 9.60 |
| 82 | 42,744 | 85.1 | 3,637 | 6.88 | 63,147 | 49.6 | 3,133 | 9.03 |
| 83 | 39,108 | 92.1 | 3,601 | 6.48 | 60,013 | 54.7 | 3,281 | 8.47 |
| 84 | 35,507 | 100.0 | 3,550 | 6.08 | 56,732 | 60.6 | 3,440 | 7.93 |
| 85 | 31,957 | 108.9 | 3,480 | 5.71 | 53,293 | 67.6 | 3,602 | 7.41 |
| 86 | 28,478 | 118.9 | 3,385 | 5.34 | 49,690 | 75.6 | 3,758 | 6.92 |
| 87 | 25,093 | 129.9 | 3,260 | 4.99 | 45,932 | 84.8 | 3,894 | 6.44 |
| 88 | 21,833 | 142.0 | 3,101 | 4.67 | 42,038 | 95.0 | 3,992 | 5.99 |
| 89 | 18,732 | 155.2 | 2,908 | 4.36 | 38,046 | 106.2 | 4,040 | 5.57 |
| 90 | 15,824 | 169.5 | 2,682 | 4.06 | 34,006 | 118.4 | 4,026 | 5.17 |
| 91 | 13,141 | 184.8 | 2,428 | 3.79 | 29,980 | 131.6 | 3,945 | 4.80 |
| 92 | 10,713 | 201.0 | 2,153 | 3.54 | 26,035 | 145.9 | 3,798 | 4.45 |
| 93 | 8,560 | 218.1 | 1,867 | 3.30 | 22,237 | 161.4 | 3,589 | 4.12 |
| 94 | 6,693 | 235.9 | 1,579 | 3.08 | 18,648 | 178.1 | 3,322 | 3.82 |
| 95 | 5,114 | 254.4 | 1,301 | 2.88 | 15,326 | 196.2 | 3,007 | 3.54 |
| 96 | 3,813 | 273.3 | 1,042 | 2.69 | 12,319 | 215.5 | 2,655 | 3.28 |
| 97 | 2,771 | 293.3 | 813 | 2.52 | 9,665 | 235.8 | 2,279 | 3.04 |
| 98 | 1,958 | 314.2 | 615 | 2.35 | 7,386 | 257.0 | 1,898 | 2.82 |
| 99 | 1,343 | 336.0 | 451 | 2.20 | 5,488 | 278.7 | 1,529 | 2.63 |
| 100 | 892 | 358.3 | 320 | 2.06 | 3,958 | 300.7 | 1,190 | 2.45 |
| 101 | 572 | 381.1 | 218 | 1.93 | 2,768 | 322.7 | 893 | 2.29 |
| 102 | 354 | 404.2 | 143 | 1.81 | 1,875 | 345.3 | 647 | 2.14 |
| 103 | 211 | 427.5 | 90 | 1.71 | 1,227 | 368.4 | 452 | 2.00 |
| 104 | 121 | 450.9 | 54 | 1.61 | 775 | 391.6 | 304 | 1.88 |
| 105 | 66 | 474.4 | 31 | 1.52 | 472 | 415.0 | 196 | 1.77 |
| 110 | 2 | 583.3 | 1 | 1.18 | 21 | 526.0 | 11 | 1.35 |
| 115 | 0 | 664.6 | 0 | 0.99 | 0 | 611.8 | 0 | 1.12 |
| 120 | 0 | 700.0 | 0 | 0.80 | 0 | 650.0 | 0 | 0.85 |
| Age | Males | Females | ||||
|---|---|---|---|---|---|---|
| Born in Canada | Born Outside Canada | Proportion Born Outside Canada | Born in Canada | Born Outside Canada | Proportion Born Outside Canada | |
| 65 | 160,474 | 25,417 | 14% | 170,283 | 31,843 | 16% |
| 66 | 156,415 | 30,866 | 16% | 166,472 | 38,781 | 19% |
| 67 | 148,172 | 35,157 | 19% | 158,447 | 41,747 | 21% |
| 68 | 141,940 | 35,712 | 20% | 152,380 | 41,981 | 22% |
| 69 | 137,479 | 37,276 | 21% | 147,772 | 43,260 | 23% |
| 70 | 132,856 | 41,306 | 24% | 142,753 | 46,873 | 25% |
| 71 | 122,791 | 47,617 | 28% | 134,073 | 51,551 | 28% |
| 72 | 124,577 | 48,775 | 28% | 135,927 | 52,512 | 28% |
| 73 | 109,716 | 45,293 | 29% | 120,354 | 49,332 | 29% |
| 74 | 93,624 | 37,743 | 29% | 103,282 | 41,278 | 29% |
| 75 | 87,632 | 37,993 | 30% | 98,159 | 41,452 | 30% |
| 76 | 84,758 | 34,497 | 29% | 96,166 | 37,699 | 28% |
| 77 | 77,007 | 32,083 | 29% | 88,240 | 35,861 | 29% |
| 78 | 68,002 | 29,303 | 30% | 80,338 | 32,930 | 29% |
| 79 | 61,200 | 28,618 | 32% | 73,740 | 33,512 | 31% |
| 80 | 55,146 | 26,812 | 33% | 67,759 | 31,817 | 32% |
| 81 | 50,454 | 25,404 | 33% | 63,813 | 30,077 | 32% |
| 82 | 44,668 | 23,238 | 34% | 58,149 | 28,478 | 33% |
| 83 | 41,353 | 21,802 | 35% | 55,165 | 26,466 | 32% |
| 84 | 36,939 | 19,853 | 35% | 51,951 | 24,423 | 32% |
| 85 | 32,989 | 17,733 | 35% | 48,173 | 22,523 | 32% |
| 86 | 29,538 | 15,999 | 35% | 44,673 | 20,405 | 31% |
| 87 | 26,822 | 14,355 | 35% | 42,960 | 18,624 | 30% |
| 88 | 23,454 | 12,218 | 34% | 39,401 | 16,736 | 30% |
| 89 | 19,641 | 10,991 | 36% | 35,264 | 15,544 | 31% |
| 90 | 15,286 | 8,787 | 37% | 29,895 | 13,177 | 31% |
| 91 | 12,529 | 7,123 | 36% | 25,795 | 11,791 | 31% |
| 92 | 9,699 | 5,743 | 37% | 21,950 | 10,418 | 32% |
| 93 | 7,377 | 4,394 | 37% | 17,937 | 8,852 | 33% |
| 94 | 5,549 | 3,317 | 37% | 14,812 | 7,340 | 33% |
| 95 | 4,001 | 2,399 | 37% | 11,949 | 5,813 | 33% |
| 96 | 2,688 | 1,734 | 39% | 9,116 | 4,413 | 33% |
| 97 | 1,939 | 1,164 | 38% | 7,192 | 3,196 | 31% |
| 98 | 1,216 | 784 | 39% | 5,152 | 2,178 | 30% |
| 99 | 784 | 506 | 39% | 3,621 | 1,600 | 31% |
| 100 | 443 | 251 | 36% | 2,213 | 872 | 28% |
| 101 | 255 | 154 | 38% | 1,502 | 535 | 26% |
| 102 | 145 | 80 | 36% | 922 | 289 | 24% |
| 103 | 65 | 64 | 50% | 549 | 226 | 29% |
| 104 | 41 | 42 | 51% | 368 | 141 | 28% |
| 105+ | 35 | 61 | 64% | 377 | 217 | 37% |
| Total | 2,129,699 | 772,664 | 27% | 2,529,044 | 926,763 | 27% |
| Age | Males | Females | ||||
|---|---|---|---|---|---|---|
| Born in Canada | Born Outside Canada | Proportion Born Outside Canada | Born in Canada | Born Outside Canada | Proportion Born Outside Canada | |
| 65 | 2,068 | 220 | 10% | 1,294 | 159 | 11% |
| 66 | 2,232 | 311 | 12% | 1,487 | 232 | 13% |
| 67 | 2,251 | 357 | 14% | 1,509 | 255 | 14% |
| 68 | 2,353 | 417 | 15% | 1,613 | 269 | 14% |
| 69 | 2,517 | 461 | 15% | 1,769 | 309 | 15% |
| 70 | 2,611 | 616 | 19% | 1,787 | 394 | 18% |
| 71 | 2,707 | 718 | 21% | 1,956 | 467 | 19% |
| 72 | 2,872 | 834 | 23% | 2,181 | 541 | 20% |
| 73 | 2,765 | 722 | 21% | 1,950 | 521 | 21% |
| 74 | 2,647 | 827 | 24% | 1,983 | 527 | 21% |
| 75 | 2,703 | 769 | 22% | 2,029 | 628 | 24% |
| 76 | 2,903 | 843 | 23% | 2,172 | 590 | 21% |
| 77 | 2,889 | 867 | 23% | 2,256 | 588 | 21% |
| 78 | 2,919 | 878 | 23% | 2,424 | 700 | 22% |
| 79 | 2,835 | 1,034 | 27% | 2,354 | 796 | 25% |
| 80 | 2,911 | 1,078 | 27% | 2,525 | 758 | 23% |
| 81 | 2,901 | 1,135 | 28% | 2,587 | 867 | 25% |
| 82 | 2,946 | 1,200 | 29% | 2,723 | 973 | 26% |
| 83 | 3,006 | 1,323 | 31% | 2,919 | 1,031 | 26% |
| 84 | 3,053 | 1,230 | 29% | 3,059 | 1,158 | 27% |
| 85 | 3,043 | 1,353 | 31% | 3,117 | 1,147 | 27% |
| 86 | 3,196 | 1,388 | 30% | 3,420 | 1,241 | 27% |
| 87 | 3,120 | 1,354 | 30% | 3,602 | 1,216 | 25% |
| 88 | 3,211 | 1,403 | 30% | 3,692 | 1,420 | 28% |
| 89 | 2,873 | 1,349 | 32% | 3,745 | 1,429 | 28% |
| 90 | 2,622 | 1,221 | 32% | 3,779 | 1,450 | 28% |
| 91 | 2,383 | 1,198 | 33% | 3,640 | 1,489 | 29% |
| 92 | 1,985 | 1,042 | 34% | 3,428 | 1,524 | 31% |
| 93 | 1,780 | 945 | 35% | 3,198 | 1,404 | 31% |
| 94 | 1,448 | 736 | 34% | 2,975 | 1,333 | 31% |
| 95 | 1,134 | 640 | 36% | 2,635 | 1,128 | 30% |
| 96 | 890 | 511 | 36% | 2,260 | 991 | 30% |
| 97 | 674 | 378 | 36% | 2,016 | 771 | 28% |
| 98 | 472 | 271 | 36% | 1545 | 618 | 29% |
| 99 | 327 | 181 | 36% | 1158 | 510 | 31% |
| 100 | 171 | 91 | 35% | 858 | 284 | 25% |
| 101 | 143 | 68 | 32% | 530 | 189 | 26% |
| 102 | 81 | 30 | 27% | 406 | 127 | 24% |
| 103 | 51 | 21 | 29% | 281 | 89 | 24% |
| 104 | 22 | 24 | 52% | 169 | 73 | 30% |
| 105+ | 24 | 28 | 54% | 218 | 114 | 34% |
| Total | 83,739 | 30,072 | 26% | 89,249 | 30,310 | 25% |
| Age | Males | Females | ||||
|---|---|---|---|---|---|---|
| Born in Canada | Born Outside Canada | Proportion Born Outside Canada | Born in Canada | Born Outside Canada | Proportion Born Outside Canada | |
| 65 | 162,644 | 29,542 | 15% | 168,604 | 36,462 | 18% |
| 66 | 158,488 | 33,572 | 17% | 165,971 | 40,911 | 20% |
| 67 | 147,751 | 36,209 | 20% | 157,124 | 42,221 | 21% |
| 68 | 142,601 | 36,866 | 21% | 152,066 | 43,033 | 22% |
| 69 | 138,040 | 38,665 | 22% | 147,177 | 44,437 | 23% |
| 70 | 129,316 | 45,514 | 26% | 139,451 | 50,096 | 26% |
| 71 | 124,403 | 48,779 | 28% | 135,240 | 52,200 | 28% |
| 72 | 122,137 | 48,788 | 29% | 132,830 | 52,631 | 28% |
| 73 | 102,408 | 41,952 | 29% | 112,260 | 45,576 | 29% |
| 74 | 92,181 | 38,537 | 29% | 101,647 | 41,916 | 29% |
| 75 | 87,757 | 37,288 | 30% | 98,385 | 40,522 | 29% |
| 76 | 83,210 | 33,983 | 29% | 94,148 | 37,400 | 28% |
| 77 | 74,067 | 31,415 | 30% | 85,585 | 34,906 | 29% |
| 78 | 67,079 | 29,493 | 31% | 79,540 | 33,755 | 30% |
| 79 | 59,244 | 28,608 | 33% | 71,481 | 33,599 | 32% |
| 80 | 54,642 | 26,891 | 33% | 67,368 | 31,583 | 32% |
| 81 | 49,282 | 25,199 | 34% | 62,609 | 30,135 | 32% |
| 82 | 44,230 | 23,310 | 35% | 57,634 | 28,261 | 33% |
| 83 | 40,971 | 21,697 | 35% | 55,430 | 26,312 | 32% |
| 84 | 36,527 | 19,660 | 35% | 51,590 | 24,460 | 32% |
| 85 | 32,681 | 17,865 | 35% | 47,803 | 22,339 | 32% |
| 86 | 29,973 | 15,969 | 35% | 45,621 | 20,512 | 31% |
| 87 | 26,657 | 14,155 | 35% | 43,074 | 18,481 | 30% |
| 88 | 23,130 | 12,457 | 35% | 39,215 | 17,201 | 30% |
| 89 | 18,980 | 10,764 | 36% | 34,610 | 15,291 | 31% |
| 90 | 15,104 | 8,665 | 36% | 29,677 | 13,445 | 31% |
| 91 | 12,346 | 7,162 | 37% | 25,888 | 12,046 | 32% |
| 92 | 9,464 | 5,653 | 37% | 21,533 | 10,590 | 33% |
| 93 | 7,240 | 4,391 | 38% | 17,957 | 8,979 | 33% |
| 94 | 5,462 | 3,257 | 37% | 14,850 | 7,302 | 33% |
| 95 | 3,880 | 2,404 | 38% | 11,744 | 5,808 | 33% |
| 96 | 2,659 | 1,728 | 39% | 9,213 | 4,356 | 32% |
| 97 | 1,908 | 1,176 | 38% | 7,198 | 3,134 | 30% |
| 98 | 1,174 | 806 | 41% | 5,000 | 2,184 | 30% |
| 99 | 763 | 482 | 39% | 3,501 | 1,517 | 30% |
| 100 | 412 | 234 | 36% | 2,192 | 840 | 28% |
| 101 | 256 | 156 | 38% | 1,435 | 520 | 27% |
| 102 | 130 | 86 | 40% | 927 | 325 | 26% |
| 103 | 71 | 68 | 49% | 555 | 234 | 30% |
| 104 | 38 | 51 | 57% | 347 | 152 | 30% |
| 105+ | 36 | 71 | 67% | 367 | 236 | 39% |
| Total | 2,109,343 | 783,567 | 27% | 2,498,842 | 935,907 | 27% |
| Age | Males | Females | ||||||||
|---|---|---|---|---|---|---|---|---|---|---|
| Overall | Born in Canada | Ratio Born in Canada to Overall | Born Outside Canada | Ratio Born Outside Canada to Overall | Overall | Born in Canada | Ratio Born in Canada to Overall | Born Outside Canada | Ratio Born Outside Canada to Overall | |
| 65 | 12.0 | 12.7 | 1.06 | 7.8 | 0.65 | 7.2 | 7.8 | 1.07 | 4.8 | 0.66 |
| 66 | 13.0 | 13.9 | 1.07 | 8.8 | 0.68 | 8.0 | 8.7 | 1.08 | 5.2 | 0.65 |
| 67 | 14.1 | 15.1 | 1.07 | 9.9 | 0.70 | 8.8 | 9.6 | 1.09 | 5.8 | 0.65 |
| 68 | 15.4 | 16.5 | 1.08 | 11.1 | 0.72 | 9.7 | 10.7 | 1.10 | 6.4 | 0.66 |
| 69 | 16.7 | 18.0 | 1.08 | 12.2 | 0.73 | 10.7 | 11.8 | 1.11 | 7.1 | 0.67 |
| 70 | 18.1 | 19.7 | 1.09 | 13.5 | 0.74 | 11.7 | 13.0 | 1.11 | 8.0 | 0.68 |
| 71 | 19.7 | 21.6 | 1.09 | 14.8 | 0.75 | 12.9 | 14.3 | 1.11 | 9.0 | 0.70 |
| 72 | 21.5 | 23.6 | 1.10 | 16.3 | 0.76 | 14.2 | 15.7 | 1.11 | 10.1 | 0.71 |
| 73 | 23.5 | 25.8 | 1.10 | 17.9 | 0.76 | 15.6 | 17.3 | 1.11 | 11.4 | 0.73 |
| 74 | 25.8 | 28.3 | 1.10 | 19.7 | 0.76 | 17.2 | 19.0 | 1.10 | 12.7 | 0.74 |
| 75 | 28.4 | 31.1 | 1.10 | 21.7 | 0.77 | 19.0 | 21.0 | 1.10 | 14.2 | 0.75 |
| 76 | 31.3 | 34.3 | 1.10 | 24.2 | 0.77 | 21.2 | 23.4 | 1.10 | 15.9 | 0.75 |
| 77 | 34.7 | 37.9 | 1.09 | 27.1 | 0.78 | 23.6 | 26.1 | 1.11 | 17.7 | 0.75 |
| 78 | 38.4 | 42.0 | 1.09 | 30.6 | 0.80 | 26.3 | 29.2 | 1.11 | 19.8 | 0.75 |
| 79 | 42.7 | 46.5 | 1.09 | 34.5 | 0.81 | 29.4 | 32.6 | 1.11 | 22.4 | 0.76 |
| 80 | 47.5 | 51.6 | 1.09 | 39.1 | 0.82 | 33.0 | 36.5 | 1.11 | 25.4 | 0.77 |
| 81 | 52.9 | 57.3 | 1.08 | 44.2 | 0.83 | 37.0 | 40.7 | 1.10 | 29.0 | 0.78 |
| 82 | 59.1 | 63.9 | 1.08 | 49.9 | 0.84 | 41.6 | 45.5 | 1.09 | 33.2 | 0.80 |
| 83 | 66.2 | 71.4 | 1.08 | 56.4 | 0.85 | 46.8 | 50.9 | 1.09 | 38.2 | 0.82 |
| 84 | 74.3 | 80.0 | 1.08 | 63.8 | 0.86 | 52.9 | 57.0 | 1.08 | 44.0 | 0.83 |
| 85 | 83.6 | 89.7 | 1.07 | 72.2 | 0.86 | 59.8 | 63.9 | 1.07 | 50.7 | 0.85 |
| 86 | 94.1 | 100.7 | 1.07 | 81.8 | 0.87 | 67.7 | 71.9 | 1.06 | 58.5 | 0.86 |
| 87 | 106.0 | 113.1 | 1.07 | 92.8 | 0.88 | 76.9 | 81.1 | 1.06 | 67.5 | 0.88 |
| 88 | 119.2 | 126.7 | 1.06 | 105.3 | 0.88 | 87.3 | 91.6 | 1.05 | 77.7 | 0.89 |
| 89 | 133.8 | 141.5 | 1.06 | 119.4 | 0.89 | 99.0 | 103.5 | 1.05 | 89.2 | 0.90 |
| 90 | 149.7 | 157.7 | 1.05 | 135.0 | 0.90 | 112.0 | 116.7 | 1.04 | 102.0 | 0.91 |
| 91 | 166.8 | 175.0 | 1.05 | 152.0 | 0.91 | 126.4 | 131.2 | 1.04 | 116.0 | 0.92 |
| 92 | 185.1 | 193.5 | 1.05 | 170.2 | 0.92 | 141.9 | 146.9 | 1.04 | 131.2 | 0.92 |
| 93 | 204.3 | 213.1 | 1.04 | 189.2 | 0.93 | 158.7 | 163.8 | 1.03 | 147.5 | 0.93 |
| 94 | 224.4 | 233.7 | 1.04 | 209.4 | 0.93 | 176.5 | 181.8 | 1.03 | 164.8 | 0.93 |
| 95 | 245.0 | 255.4 | 1.04 | 230.7 | 0.94 | 195.4 | 200.8 | 1.03 | 183.1 | 0.94 |
| 96 | 266.2 | 278.1 | 1.04 | 252.9 | 0.95 | 215.1 | 220.6 | 1.03 | 202.3 | 0.94 |
| 97 | 287.6 | 301.3 | 1.05 | 275.9 | 0.96 | 235.6 | 241.3 | 1.02 | 222.2 | 0.94 |
| 98 | 309.7 | 324.8 | 1.05 | 299.6 | 0.97 | 256.6 | 262.6 | 1.02 | 243.2 | 0.95 |
| 99 | 332.5 | 348.5 | 1.05 | 323.7 | 0.97 | 278.0 | 284.5 | 1.02 | 265.3 | 0.95 |
| 100 | 355.8 | 372.4 | 1.05 | 348.2 | 0.98 | 299.7 | 306.9 | 1.02 | 288.1 | 0.96 |
| 101 | 379.4 | 396.3 | 1.04 | 372.9 | 0.98 | 321.5 | 329.8 | 1.03 | 311.6 | 0.97 |
| 102 | 403.2 | 420.1 | 1.04 | 397.7 | 0.99 | 344.0 | 353.0 | 1.03 | 335.6 | 0.98 |
| 103 | 427.1 | 443.7 | 1.04 | 422.4 | 0.99 | 366.9 | 376.4 | 1.03 | 359.8 | 0.98 |
| 104 | 450.9 | 467.0 | 1.04 | 447.0 | 0.99 | 390.1 | 399.8 | 1.03 | 384.2 | 0.99 |
| 105 | 474.4 | 489.8 | 1.03 | 471.2 | 0.99 | 413.3 | 423.1 | 1.02 | 408.6 | 0.99 |
| 110 | 583.3 | 593.1 | 1.02 | 582.4 | 1.00 | 524.8 | 531.9 | 1.01 | 523.5 | 1.00 |
| 115 | 664.6 | 668.0 | 1.01 | 664.5 | 1.00 | 611.3 | 613.9 | 1.00 | 611.2 | 1.00 |
| 120 | 700.0 | 700.0 | 1.00 | 700.0 | 1.00 | 650.0 | 650.0 | 1.00 | 650.0 | 1.00 |
| Age | Males | Females | ||||||
|---|---|---|---|---|---|---|---|---|
| lx | 1,000 qx | dx | LifExp | lx | 1,000 qx | dx | LifExp | |
| 65 | 100,000 | 12.7 | 1,273 | 18.83 | 100,000 | 7.8 | 777 | 21.63 |
| 66 | 98,727 | 13.9 | 1,368 | 18.07 | 99,223 | 8.7 | 861 | 20.79 |
| 67 | 97,359 | 15.1 | 1,472 | 17.32 | 98,362 | 9.6 | 948 | 19.97 |
| 68 | 95,887 | 16.5 | 1,583 | 16.58 | 97,414 | 10.7 | 1,040 | 19.16 |
| 69 | 94,304 | 18.0 | 1,702 | 15.85 | 96,374 | 11.8 | 1,137 | 18.36 |
| 70 | 92,602 | 19.7 | 1,826 | 15.13 | 95,237 | 13.0 | 1,238 | 17.57 |
| 71 | 90,776 | 21.6 | 1,956 | 14.42 | 93,999 | 14.3 | 1,344 | 16.80 |
| 72 | 88,820 | 23.6 | 2,094 | 13.73 | 92,655 | 15.7 | 1,456 | 16.04 |
| 73 | 86,726 | 25.8 | 2,239 | 13.05 | 91,199 | 17.3 | 1,574 | 15.28 |
| 74 | 84,488 | 28.3 | 2,393 | 12.38 | 89,624 | 19.0 | 1,704 | 14.54 |
| 75 | 82,095 | 31.1 | 2,557 | 11.73 | 87,920 | 21.0 | 1,849 | 13.82 |
| 76 | 79,538 | 34.3 | 2,731 | 11.09 | 86,072 | 23.4 | 2,012 | 13.10 |
| 77 | 76,807 | 37.9 | 2,914 | 10.46 | 84,060 | 26.1 | 2,192 | 12.40 |
| 78 | 73,894 | 42.0 | 3,101 | 9.86 | 81,867 | 29.2 | 2,388 | 11.72 |
| 79 | 70,793 | 46.5 | 3,291 | 9.27 | 79,480 | 32.6 | 2,592 | 11.06 |
| 80 | 67,501 | 51.6 | 3,481 | 8.69 | 76,887 | 36.5 | 2,803 | 10.42 |
| 81 | 64,020 | 57.3 | 3,671 | 8.14 | 74,084 | 40.7 | 3,018 | 9.79 |
| 82 | 60,349 | 63.9 | 3,857 | 7.60 | 71,066 | 45.5 | 3,234 | 9.18 |
| 83 | 56,492 | 71.4 | 4,034 | 7.09 | 67,832 | 50.9 | 3,451 | 8.60 |
| 84 | 52,458 | 80.0 | 4,196 | 6.60 | 64,381 | 57.0 | 3,667 | 8.03 |
| 85 | 48,262 | 89.7 | 4,331 | 6.13 | 60,714 | 63.9 | 3,881 | 7.49 |
| 86 | 43,931 | 100.7 | 4,426 | 5.68 | 56,833 | 71.9 | 4,087 | 6.97 |
| 87 | 39,505 | 113.1 | 4,466 | 5.26 | 52,745 | 81.1 | 4,278 | 6.47 |
| 88 | 35,039 | 126.7 | 4,438 | 4.87 | 48,467 | 91.6 | 4,440 | 5.99 |
| 89 | 30,601 | 141.5 | 4,331 | 4.50 | 44,027 | 103.5 | 4,555 | 5.55 |
| 90 | 26,270 | 157.7 | 4,142 | 4.16 | 39,472 | 116.7 | 4,605 | 5.13 |
| 91 | 22,128 | 175.0 | 3,872 | 3.85 | 34,867 | 131.2 | 4,574 | 4.74 |
| 92 | 18,255 | 193.5 | 3,532 | 3.56 | 30,293 | 146.9 | 4,451 | 4.38 |
| 93 | 14,724 | 213.1 | 3,137 | 3.29 | 25,842 | 163.8 | 4,234 | 4.05 |
| 94 | 11,586 | 233.7 | 2,708 | 3.04 | 21,609 | 181.8 | 3,929 | 3.74 |
| 95 | 8,878 | 255.4 | 2,268 | 2.82 | 17,680 | 200.8 | 3,550 | 3.47 |
| 96 | 6,611 | 278.1 | 1,838 | 2.62 | 14,130 | 220.6 | 3,118 | 3.21 |
| 97 | 4,772 | 301.3 | 1,438 | 2.43 | 11,013 | 241.3 | 2,657 | 2.98 |
| 98 | 3,335 | 324.8 | 1,083 | 2.26 | 8,356 | 262.6 | 2,194 | 2.77 |
| 99 | 2,252 | 348.5 | 785 | 2.11 | 6,162 | 284.5 | 1,753 | 2.57 |
| 100 | 1,467 | 372.4 | 546 | 1.98 | 4,409 | 306.9 | 1,353 | 2.40 |
| 101 | 921 | 396.3 | 365 | 1.85 | 3,056 | 329.8 | 1,008 | 2.24 |
| 102 | 556 | 420.1 | 233 | 1.74 | 2,048 | 353.0 | 723 | 2.09 |
| 103 | 322 | 443.7 | 143 | 1.64 | 1,325 | 376.4 | 499 | 1.96 |
| 104 | 179 | 467.0 | 84 | 1.55 | 826 | 399.8 | 330 | 1.84 |
| 105 | 96 | 489.8 | 47 | 1.46 | 496 | 423.1 | 210 | 1.73 |
| 110 | 2 | 593.1 | 1 | 1.16 | 21 | 531.9 | 11 | 1.33 |
| 115 | 0 | 668.0 | 0 | 0.99 | 0 | 613.9 | 0 | 1.11 |
| 120 | 0 | 700.0 | 0 | 0.80 | 0 | 650.0 | 0 | 0.85 |
| Age | Males | Females | ||||||
|---|---|---|---|---|---|---|---|---|
| lx | 1,000 qx | dx | LifExp | lx | 1,000 qx | dx | LifExp | |
| 65 | 100,000 | 7.8 | 776 | 20.99 | 100,000 | 4.8 | 476 | 23.80 |
| 66 | 99,224 | 8.8 | 878 | 20.15 | 99,524 | 5.2 | 520 | 22.91 |
| 67 | 98,346 | 9.9 | 978 | 19.32 | 99,004 | 5.8 | 571 | 22.03 |
| 68 | 97,368 | 11.1 | 1,078 | 18.51 | 98,433 | 6.4 | 629 | 21.15 |
| 69 | 96,290 | 12.2 | 1,179 | 17.72 | 97,804 | 7.1 | 697 | 20.29 |
| 70 | 95,111 | 13.5 | 1,283 | 16.93 | 97,107 | 8.0 | 776 | 19.43 |
| 71 | 93,828 | 14.8 | 1,390 | 16.15 | 96,331 | 9.0 | 866 | 18.58 |
| 72 | 92,438 | 16.3 | 1,503 | 15.39 | 95,465 | 10.1 | 967 | 17.74 |
| 73 | 90,935 | 17.9 | 1,623 | 14.63 | 94,499 | 11.4 | 1,075 | 16.92 |
| 74 | 89,312 | 19.7 | 1,755 | 13.89 | 93,423 | 12.7 | 1,191 | 16.11 |
| 75 | 87,556 | 21.7 | 1,903 | 13.16 | 92,233 | 14.2 | 1,313 | 15.31 |
| 76 | 85,653 | 24.2 | 2,073 | 12.44 | 90,920 | 15.9 | 1,442 | 14.53 |
| 77 | 83,580 | 27.1 | 2,268 | 11.74 | 89,478 | 17.7 | 1,584 | 13.75 |
| 78 | 81,312 | 30.6 | 2,486 | 11.05 | 87,894 | 19.8 | 1,744 | 12.99 |
| 79 | 78,827 | 34.5 | 2,723 | 10.38 | 86,150 | 22.4 | 1,927 | 12.24 |
| 80 | 76,103 | 39.1 | 2,974 | 9.74 | 84,223 | 25.4 | 2,136 | 11.51 |
| 81 | 73,129 | 44.2 | 3,231 | 9.11 | 82,087 | 29.0 | 2,377 | 10.80 |
| 82 | 69,898 | 49.9 | 3,490 | 8.51 | 79,710 | 33.2 | 2,648 | 10.11 |
| 83 | 66,408 | 56.4 | 3,746 | 7.93 | 77,062 | 38.2 | 2,944 | 9.44 |
| 84 | 62,663 | 63.8 | 3,995 | 7.38 | 74,118 | 44.0 | 3,262 | 8.79 |
| 85 | 58,668 | 72.2 | 4,234 | 6.84 | 70,856 | 50.7 | 3,595 | 8.17 |
| 86 | 54,434 | 81.8 | 4,453 | 6.34 | 67,261 | 58.5 | 3,935 | 7.58 |
| 87 | 49,981 | 92.8 | 4,639 | 5.86 | 63,325 | 67.5 | 4,273 | 7.02 |
| 88 | 45,342 | 105.3 | 4,776 | 5.41 | 59,053 | 77.7 | 4,589 | 6.49 |
| 89 | 40,566 | 119.4 | 4,843 | 4.98 | 54,464 | 89.2 | 4,860 | 6.00 |
| 90 | 35,723 | 135.0 | 4,822 | 4.59 | 49,604 | 102.0 | 5,060 | 5.54 |
| 91 | 30,900 | 152.0 | 4,696 | 4.23 | 44,544 | 116.0 | 5,168 | 5.11 |
| 92 | 26,204 | 170.2 | 4,459 | 3.90 | 39,375 | 131.2 | 5,166 | 4.72 |
| 93 | 21,745 | 189.2 | 4,114 | 3.60 | 34,209 | 147.5 | 5,045 | 4.35 |
| 94 | 17,631 | 209.4 | 3,693 | 3.32 | 29,164 | 164.8 | 4,807 | 4.02 |
| 95 | 13,938 | 230.7 | 3,216 | 3.07 | 24,357 | 183.1 | 4,461 | 3.71 |
| 96 | 10,722 | 252.9 | 2,712 | 2.84 | 19,896 | 202.3 | 4,025 | 3.43 |
| 97 | 8,010 | 275.9 | 2,210 | 2.63 | 15,871 | 222.2 | 3,526 | 3.18 |
| 98 | 5,800 | 299.6 | 1,737 | 2.44 | 12,345 | 243.2 | 3,003 | 2.94 |
| 99 | 4,062 | 323.7 | 1,315 | 2.26 | 9,342 | 265.3 | 2,478 | 2.73 |
| 100 | 2,747 | 348.2 | 957 | 2.11 | 6,864 | 288.1 | 1,978 | 2.53 |
| 101 | 1,791 | 372.9 | 668 | 1.97 | 4,886 | 311.6 | 1,523 | 2.35 |
| 102 | 1,123 | 397.7 | 447 | 1.84 | 3,364 | 335.6 | 1,129 | 2.19 |
| 103 | 676 | 422.4 | 286 | 1.73 | 2,235 | 359.8 | 804 | 2.04 |
| 104 | 391 | 447.0 | 175 | 1.62 | 1,431 | 384.2 | 550 | 1.91 |
| 105 | 216 | 471.2 | 102 | 1.53 | 881 | 408.6 | 360 | 1.79 |
| 110 | 6 | 582.4 | 3 | 1.18 | 42 | 523.5 | 22 | 1.35 |
| 115 | 0 | 664.5 | 0 | 0.99 | 1 | 611.2 | 0 | 1.12 |
| 120 | 0 | 700.0 | 0 | 0.80 | 0 | 650.0 | 0 | 0.85 |
| Type of Benefit | 2007 | 2013 | 2019 | ||||||
|---|---|---|---|---|---|---|---|---|---|
| Males | Females | Female – Male Differential | Males | Females | Female – Male Differential | Males | Females | Female – Male Differential | |
| Benchmark (CLT of year) | 18.0 | 21.1 | 3.2 | 19.1 | 21.9 | 2.8 | 19.6 | 22.4 | 2.7 |
| OAS program | 17.8 | 21.0 | 3.2 | 18.9 | 21.8 | 2.9 | 19.4 | 22.2 | 2.8 |
| Differential Benchmark and OAS | 0.2 | 0.1 | 0.2 | 0.2 | 0.2 | 0.2 | |||
| OAS with GIS | 16.2 | 19.9 | 3.7 | 17.1 | 20.4 | 3.4 | 17.4 | 20.7 | 3.3 |
| OAS without GIS | 18.6 | 21.8 | 3.2 | 19.7 | 22.6 | 2.9 | 20.3 | 23.2 | 2.8 |
| Differential OAS without and OAS with GIS | 2.5 | 1.9 | 2.6 | 2.2 | 2.9 | 2.5 | |||
| Single | 15.2 | 20.1 | 4.9 | 16.4 | 20.8 | 4.4 | 16.8 | 21.1 | 4.3 |
| Married | 19.0 | 22.2 | 3.2 | 20.0 | 23.0 | 3.0 | 20.7 | 23.5 | 2.8 |
| Differential Married and Single | 3.8 | 2.1 | 3.6 | 2.2 | 3.9 | 2.4 | |||
| OAS with GIS Single | 14.0 | 19.4 | 5.4 | 15.1 | 19.9 | 4.8 | 15.3 | 20.0 | 4.7 |
| OAS without GIS Single | 16.3 | 20.9 | 4.6 | 17.5 | 21.8 | 4.2 | 18.1 | 22.3 | 4.1 |
| Differential without GIS and with GIS Single | 2.3 | 1.5 | 2.5 | 1.9 | 2.8 | 2.3 | |||
| OAS with GIS Married | 17.7 | 20.8 | 3.0 | 18.7 | 21.5 | 2.8 | 19.5 | 22.2 | 2.7 |
| OAS without GIS Married | 19.5 | 22.8 | 3.3 | 20.5 | 23.6 | 3.1 | 21.1 | 24.0 | 2.9 |
| Differential without GIS and with GIS Married | 1.8 | 2.1 | 1.8 | 2.1 | 1.7 | 1.9 | |||
| Born in Canada | 17.3 | 20.6 | 3.2 | 18.4 | 21.3 | 2.9 | 18.8 | 21.6 | 2.8 |
| Born outside of Canada (immigrants) | 19.0 | 22.1 | 3.1 | 20.3 | 23.1 | 2.9 | 21.0 | 23.8 | 2.8 |
| Differential immigrants and born in Canada | 1.7 | 1.5 | 1.9 | 1.9 | 2.2 | 2.2 | |||
Appendix B ― References
Chen, J., Wilkins, R., & Ng, E. (1996). Health Expectancy by Immigrant Status, 1986 and 1991. Statistics Canada Health Reports, Vol. 8, No. 3, Winter 1996, pp. 29-38.
Continuous Mortality Investigation Mortality Projections Committee. (2015). Recent Mortality in England & Wales, Working Paper 83. ISSN 2044-3145. Continuous Mortality Investigation Limited. London.
Omariba, D., Ng, E., & Vissandjée, B. (2014). Differences between immigrants at various durations of residence and host population in all-cause mortality, Canada 1991-2006. Population Studies - A Journal of Demography, Vol. 68, No. 3, November 2014, pp. 339-357. Routledge.
OSFI. (2006a). Old Age Security Program Mortality Experience - Actuarial Study No. 5. Office of the Superintendent of Financial Institutions - Office of the Chief Actuary. Ottawa.
OSFI. (2006b). Old Age Security Program Mortality Experience - Addendum to Actuarial Study No. 5. Office of the Superintendent of Financial Institutions - Office of the Chief Actuary. Ottawa.
OSFI. (2012). Old Age Security Program Mortality Experience - Actuarial Study No. 11. Office of the Superintendent of Financial Institutions - Office of the Chief Actuary. Ottawa.
OSFI. (2016). Old Age Security Program Mortality Experience - Actuarial Study No. 17. Office of the Superintendent of Financial Institutions - Office of the Chief Actuary. Ottawa.
OSFI. (2020). Sixteenth Actuarial Report on the Old Age Security Program as at 31 December 2018. Office of the Superintendent of Financial Institutions - Office of the Chief Actuary. Ottawa.
Raleigh, V. (2019). “Trends in life expectancy in EU and other OECD countries: Why are improvements slowing?”, OECD Health Working Papers, No. 108. OECD Publishing. Paris.
Trovato, F. & Odynak D. (2011). Sex differences in life expectancy in Canada: immigrant and native-born populations. Journal of Biosocial Science, Vol. 43, Iss. 3, May 2011, pp. 353-367. Cambridge University Press.
Vang, Z., Sigouin, J., Flenon, A., & Gagnon A. (2015). The Healthy Immigrant Effect in Canada: A Systematic Review. Population Change and Lifecourse Strategic Knowledge Cluster Discussion Paper Series: Vol. 3, Iss. 1, Article 4.
Zhang, Y., Galbraith, N., & Dion, P. (2019). “Chapter 4: Projection of Mortality”, in Population Projections for Canada (2018 to 2068), Provinces and Territories (2018 to 2043): Technical Report on Methodology and Assumptions. Statistics Canada catalogue no. 91-620-X.
Nikolai Serykh and Alex Yang. (2020). U.S. Mortality Improvement Trend Deep Dive.
R. Jerome Holman, Cynthia S. MacDonald, &Peter J. Miller.(2019) U.S. Population Mortality Observations Updated with 2017 Experience.
Appendix C ― Acknowledgements
Service Canada provided data on the Old Age Security program.
Mortality data for individual years 1999 to 2019 derived from the published Canada Life Tables (CLT) were provided by Statistics Canada.
The Canada Revenue Agency provided income tax return information.
The co-operation and able assistance received from the above-mentioned data providers deserve to be acknowledged.
The following people assisted in the preparation of this study:
- Assia Billig, FCIA, FSA, PhD
- Yu Cheng, ASA
- Julie Fortier
- Alain Guimond
- Sari Harrel, FCIA, FSA
- Michel Montambeault, FCIA, FSA
- Kelly Moore
- Louis-Marie Pommainville, FCIA, FSA
Footnotes
- Footnote 1
-
The level of income used to determine the level of GIS and Allowance entitlements as defined under the Old Age Security Act excludes any benefits received from the OAS program, employment income and self-employment income up to $10,000 since July 2020, and other amounts.
- Footnote 2
-
This recent slowdown in mortality improvements has also been observed in other countries. (See: Continuous Mortality Investigation Projections Committee, 2015, Raleigh, 2019, and Zhang et al., 2019).