Infosheet - Residential Mortgage Underwriting Practices and Procedures Guideline (B-20)
Information
Table of contents
Sound mortgage underwriting contributes to financial stability
The safety and stability of federally regulated financial institutions (FRFIs) is fundamental to the ongoing health of Canada’s financial system. OSFI contributes to public confidence in the Canadian financial system by fulfilling its mandate to protect the interests of depositors and other creditors of financial institutions. It does this through supervising FRFIs and setting standards that improve their resilience, both under normal conditions and in the event of a financial downturn.
OSFI monitors the housing market to better understand risks facing FRFIs. Lenders subject to OSFI supervision hold nearly 80 percent of all residential mortgages issued in Canada, and residential mortgage loans account for almost 30 percent of the total assets held by these lenders. Sound mortgage underwriting practices reduce risks to the financial system and to Canadians who entrust their savings to Canada’s financial institutions.
This information sheet is updated periodically to provide information about the effectiveness of Guideline B-20 and statistics on some of the risk areas that OSFI continues to monitor.
Risks to the financial system and the impact of Guideline B-20
Risks to the financial system
Elevated level of household indebtedness
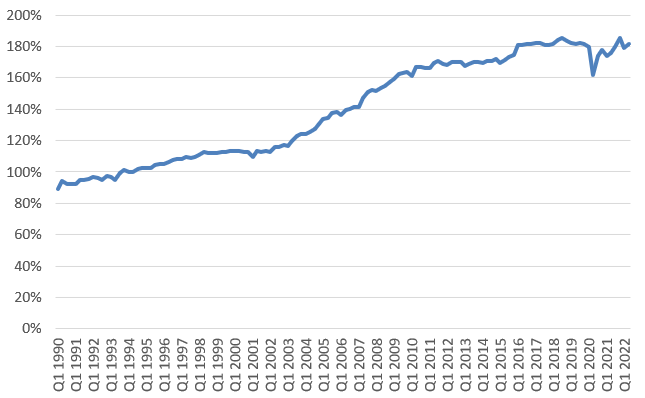
Over the last few decades, Canadian household debt relative to disposable income has increased and is at a near record high level. (See Chart 1)
Chart 1 - Household debt to disposable income (seasonally adjusted)
Household Debt to Disposable Income (Seasonally Adjusted) - Table
| Quarters | % |
|---|---|
| Q1 1990 | 89% |
| Q2 1990 | 94% |
| Q3 1990 | 93% |
| Q4 1990 | 93% |
| Q1 1991 | 92% |
| Q2 1991 | 95% |
| Q3 1991 | 95% |
| Q4 1991 | 95% |
| Q1 1992 | 96% |
| Q2 1992 | 96% |
| Q3 1992 | 95% |
| Q4 1992 | 97% |
| Q1 1993 | 97% |
| Q2 1993 | 95% |
| Q3 1993 | 99% |
| Q4 1993 | 101% |
| Q1 1994 | 100% |
| Q2 1994 | 100% |
| Q3 1994 | 102% |
| Q4 1994 | 102% |
| Q1 1995 | 102% |
| Q2 1995 | 103% |
| Q3 1995 | 105% |
| Q4 1995 | 105% |
| Q1 1996 | 105% |
| Q2 1996 | 106% |
| Q3 1996 | 108% |
| Q4 1996 | 108% |
| Q1 1997 | 108% |
| Q2 1997 | 110% |
| Q3 1997 | 109% |
| Q4 1997 | 110% |
| Q1 1998 | 111% |
| Q2 1998 | 113% |
| Q3 1998 | 112% |
| Q4 1998 | 112% |
| Q1 1999 | 112% |
| Q2 1999 | 112% |
| Q3 1999 | 113% |
| Q4 1999 | 113% |
| Q1 2000 | 114% |
| Q2 2000 | 113% |
| Q3 2000 | 113% |
| Q4 2000 | 112% |
| Q1 2001 | 109% |
| Q2 2001 | 113% |
| Q3 2001 | 113% |
| Q4 2001 | 113% |
| Q1 2002 | 113% |
| Q2 2002 | 116% |
| Q3 2002 | 116% |
| Q4 2002 | 117% |
| Q1 2003 | 116% |
| Q2 2003 | 120% |
| Q3 2003 | 123% |
| Q4 2003 | 124% |
| Q1 2004 | 124% |
| Q2 2004 | 126% |
| Q3 2004 | 128% |
| Q4 2004 | 130% |
| Q1 2005 | 133% |
| Q2 2005 | 134% |
| Q3 2005 | 137% |
| Q4 2005 | 138% |
| Q1 2006 | 136% |
| Q2 2006 | 140% |
| Q3 2006 | 140% |
| Q4 2006 | 141% |
| Q1 2007 | 141% |
| Q2 2007 | 147% |
| Q3 2007 | 151% |
| Q4 2007 | 152% |
| Q1 2008 | 152% |
| Q2 2008 | 154% |
| Q3 2008 | 155% |
| Q4 2008 | 157% |
| Q1 2009 | 159% |
| Q2 2009 | 162% |
| Q3 2009 | 163% |
| Q4 2009 | 164% |
| Q1 2010 | 161% |
| Q2 2010 | 167% |
| Q3 2010 | 167% |
| Q4 2010 | 166% |
| Q1 2011 | 166% |
| Q2 2011 | 169% |
| Q3 2011 | 170% |
| Q4 2011 | 169% |
| Q1 2012 | 168% |
| Q2 2012 | 170% |
| Q3 2012 | 170% |
| Q4 2012 | 170% |
| Q1 2013 | 167% |
| Q2 2013 | 169% |
| Q3 2013 | 170% |
| Q4 2013 | 170% |
| Q1 2014 | 169% |
| Q2 2014 | 171% |
| Q3 2014 | 171% |
| Q4 2014 | 172% |
| Q1 2015 | 170% |
| Q2 2015 | 171% |
| Q3 2015 | 173% |
| Q4 2015 | 175% |
| Q1 2016 | 181% |
| Q2 2016 | 181% |
| Q3 2016 | 181% |
| Q4 2016 | 181% |
| Q1 2017 | 182% |
| Q2 2017 | 182% |
| Q3 2017 | 181% |
| Q4 2017 | 181% |
| Q1 2018 | 182% |
| Q2 2018 | 184% |
| Q3 2018 | 185% |
| Q4 2018 | 183% |
| Q1 2019 | 182% |
| Q2 2019 | 181% |
| Q3 2019 | 182% |
| Q4 2019 | 181% |
| Q1 2020 | 180% |
| Q2 2020 | 162% |
| Q3 2020 | 174% |
| Q4 2020 | 178% |
| Q1 2021 | 174% |
| Q2 2021 | 176% |
| Q3 2021 | 180% |
| Q4 2021 | 185% |
| Q1 2022 | 179% |
| Q2 2022 | 182% |
Source: Statistics Canada
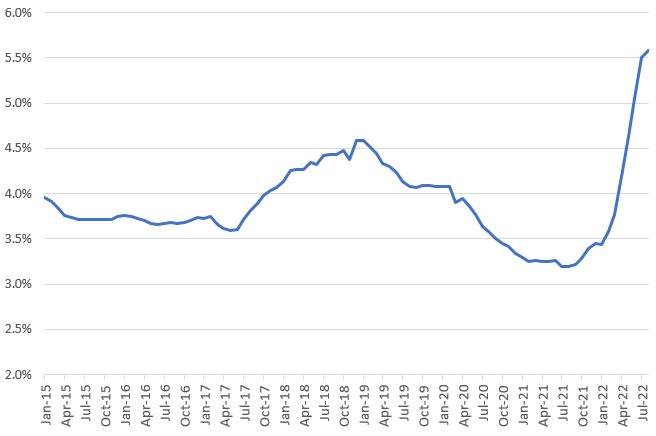
More recently, overnight rates and effective interest rates have increased significantly. (See Chart 2)
Chart 2 - Canada mortgage & housing corporation (5-year conventional mortgage lending rate)
Canada Mortgage & Housing Corporation (5-Year Conventional Mortgage Lending Rate) - Table
| Filing month | Canada Mortgage & Housing Corporation (5-Year Conventional Mortgage Lending Rate) |
|---|---|
| Jan-15 | 4.0% |
| Feb-15 | 3.9% |
| Mar-15 | 3.8% |
| Apr-15 | 3.8% |
| May-15 | 3.7% |
| Jun-15 | 3.7% |
| Jul-15 | 3.7% |
| Aug-15 | 3.7% |
| Sep-15 | 3.7% |
| Oct-15 | 3.7% |
| Nov-15 | 3.7% |
| Dec-15 | 3.8% |
| Jan-16 | 3.8% |
| Feb-16 | 3.8% |
| Mar-16 | 3.7% |
| Apr-16 | 3.7% |
| May-16 | 3.7% |
| Jun-16 | 3.7% |
| Jul-16 | 3.7% |
| Aug-16 | 3.7% |
| Sep-16 | 3.7% |
| Oct-16 | 3.7% |
| Nov-16 | 3.7% |
| Dec-16 | 3.7% |
| Jan-17 | 3.7% |
| Feb-17 | 3.8% |
| Mar-17 | 3.7% |
| Apr-17 | 3.6% |
| May-17 | 3.6% |
| Jun-17 | 3.6% |
| Jul-17 | 3.7% |
| Aug-17 | 3.8% |
| Sep-17 | 3.9% |
| Oct-17 | 4.0% |
| Nov-17 | 4.0% |
| Dec-17 | 4.1% |
| Jan-18 | 4.1% |
| Feb-18 | 4.3% |
| Mar-18 | 4.3% |
| Apr-18 | 4.3% |
| May-18 | 4.4% |
| Jun-18 | 4.3% |
| Jul-18 | 4.4% |
| Aug-18 | 4.4% |
| Sep-18 | 4.4% |
| Oct-18 | 4.5% |
| Nov-18 | 4.4% |
| Dec-18 | 4.6% |
| Jan-19 | 4.6% |
| Feb-19 | 4.5% |
| Mar-19 | 4.4% |
| Apr-19 | 4.3% |
| May-19 | 4.3% |
| Jun-19 | 4.2% |
| Jul-19 | 4.1% |
| Aug-19 | 4.1% |
| Sep-19 | 4.1% |
| Oct-19 | 4.1% |
| Nov-19 | 4.1% |
| Dec-19 | 4.1% |
| Jan-20 | 4.1% |
| Feb-20 | 4.1% |
| Mar-20 | 3.9% |
| Apr-20 | 4.0% |
| May-20 | 3.9% |
| Jun-20 | 3.8% |
| Jul-20 | 3.6% |
| Aug-20 | 3.6% |
| Sep-20 | 3.5% |
| Oct-20 | 3.5% |
| Nov-20 | 3.4% |
| Dec-20 | 3.3% |
| Jan-21 | 3.3% |
| Feb-21 | 3.3% |
| Mar-21 | 3.3% |
| Apr-21 | 3.3% |
| May-21 | 3.3% |
| Jun-21 | 3.3% |
| Jul-21 | 3.2% |
| Aug-21 | 3.2% |
| Sep-21 | 3.2% |
| Oct-21 | 3.3% |
| Nov-21 | 3.4% |
| Dec-21 | 3.5% |
| Jan-22 | 3.4% |
| Feb-22 | 3.6% |
| Mar-22 | 3.8% |
| Apr-22 | 4.2% |
| May-22 | 4.6% |
| Jun-22 | 5.1% |
| Jul-22 | 5.5% |
| Aug-22 | 5.6% |
Source: Statistics Canada
The combination of record high debt levels, inflation, and the possibility of continued increases in interest rates could lead to a reduction in the ability of borrowers to service their debt. As a larger share of their income is used to service existing debts, new and existing mortgage borrowers may respond to higher debt servicing costs in a number of ways.
Existing borrowers
- Reduce savings and spending in other areas
- Refinance and extend amortization
- Reduce debt servicing costs
New borrowers
- Buy less expensive dwelling
- Increase down payment
- Delay purchase of dwelling
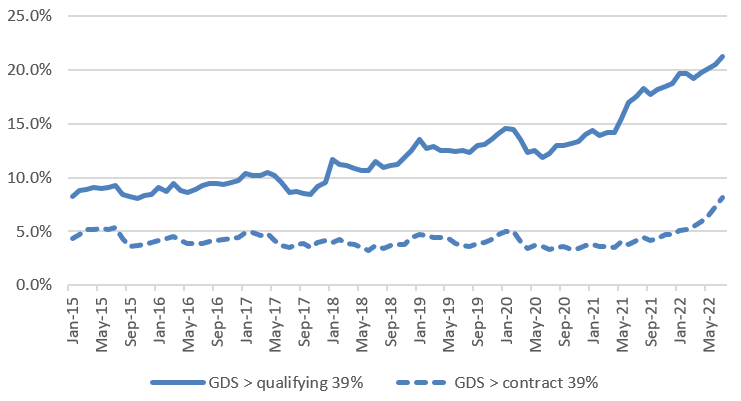
The debt service ratio measures the share of average borrowers’ incomes that must go towards servicing their debt obligations through interest (and depending on the version of the metric, may also include principal payments). The share of high gross debt service (GDS) lending has risen over time. (See Chart 3)
Chart 3 - Proportion of uninsured mortgages with GDS > 39%
Proportion of Uninsured Mortgages with GDS > 39% - Table
| Filing month | GDS > qualifying 39% | GDS > contract 39% |
|---|---|---|
| Jan-15 | 8.2% | 4.4% |
| Feb-15 | 8.8% | 4.7% |
| Mar-15 | 8.9% | 5.2% |
| Apr-15 | 9.1% | 5.2% |
| May-15 | 9.0% | 5.2% |
| Jun-15 | 9.0% | 5.2% |
| Jul-15 | 9.3% | 5.4% |
| Aug-15 | 8.4% | 4.4% |
| Sep-15 | 8.2% | 3.6% |
| Oct-15 | 8.0% | 3.7% |
| Nov-15 | 8.4% | 3.8% |
| Dec-15 | 8.4% | 4.0% |
| Jan-16 | 9.1% | 4.2% |
| Feb-16 | 8.7% | 4.4% |
| Mar-16 | 9.4% | 4.5% |
| Apr-16 | 8.8% | 4.2% |
| May-16 | 8.6% | 3.8% |
| Jun-16 | 8.9% | 3.9% |
| Jul-16 | 9.3% | 3.9% |
| Aug-16 | 9.5% | 4.1% |
| Sep-16 | 9.4% | 4.2% |
| Oct-16 | 9.4% | 4.2% |
| Nov-16 | 9.6% | 4.4% |
| Dec-16 | 9.8% | 4.5% |
| Jan-17 | 10.4% | 4.9% |
| Feb-17 | 10.2% | 4.9% |
| Mar-17 | 10.2% | 4.7% |
| Apr-17 | 10.5% | 4.8% |
| May-17 | 10.2% | 4.2% |
| Jun-17 | 9.6% | 3.7% |
| Jul-17 | 8.6% | 3.5% |
| Aug-17 | 8.8% | 3.8% |
| Sep-17 | 8.6% | 3.9% |
| Oct-17 | 8.4% | 3.5% |
| Nov-17 | 9.2% | 4.0% |
| Dec-17 | 9.5% | 4.2% |
| Jan-18 | 11.7% | 3.9% |
| Feb-18 | 11.2% | 4.3% |
| Mar-18 | 11.1% | 3.9% |
| Apr-18 | 10.9% | 3.8% |
| May-18 | 10.6% | 3.5% |
| Jun-18 | 10.6% | 3.2% |
| Jul-18 | 11.5% | 3.7% |
| Aug-18 | 10.9% | 3.4% |
| Sep-18 | 11.1% | 3.7% |
| Oct-18 | 11.2% | 3.8% |
| Nov-18 | 11.9% | 3.8% |
| Dec-18 | 12.5% | 4.4% |
| Jan-19 | 13.6% | 4.7% |
| Feb-19 | 12.7% | 4.6% |
| Mar-19 | 12.9% | 4.5% |
| Apr-19 | 12.5% | 4.5% |
| May-19 | 12.6% | 4.3% |
| Jun-19 | 12.4% | 3.9% |
| Jul-19 | 12.5% | 3.7% |
| Aug-19 | 12.3% | 3.6% |
| Sep-19 | 13.0% | 3.8% |
| Oct-19 | 13.1% | 4.0% |
| Nov-19 | 13.5% | 4.2% |
| Dec-19 | 14.1% | 4.7% |
| Jan-20 | 14.6% | 5.0% |
| Feb-20 | 14.4% | 5.0% |
| Mar-20 | 13.5% | 4.1% |
| Apr-20 | 12.4% | 3.4% |
| May-20 | 12.5% | 3.7% |
| Jun-20 | 11.8% | 3.6% |
| Jul-20 | 12.2% | 3.3% |
| Aug-20 | 13.0% | 3.5% |
| Sep-20 | 13.0% | 3.6% |
| Oct-20 | 13.2% | 3.3% |
| Nov-20 | 13.4% | 3.4% |
| Dec-20 | 14.0% | 3.7% |
| Jan-21 | 14.4% | 3.8% |
| Feb-21 | 13.9% | 3.6% |
| Mar-21 | 14.2% | 3.6% |
| Apr-21 | 14.2% | 3.5% |
| May-21 | 15.5% | 4.1% |
| Jun-21 | 17.0% | 3.7% |
| Jul-21 | 17.5% | 4.1% |
| Aug-21 | 18.3% | 4.4% |
| Sep-21 | 17.7% | 4.2% |
| Oct-21 | 18.2% | 4.4% |
| Nov-21 | 18.4% | 4.7% |
| Dec-21 | 18.7% | 4.7% |
| Jan-22 | 19.7% | 5.1% |
| Feb-22 | 19.7% | 5.2% |
| Mar-22 | 19.2% | 5.5% |
| Apr-22 | 19.8% | 5.9% |
| May-22 | 20.1% | 6.5% |
| Jun-22 | 20.5% | 7.3% |
| Jul-22 | 21.3% | 8.2% |
Source: FRFI filings to OSFI
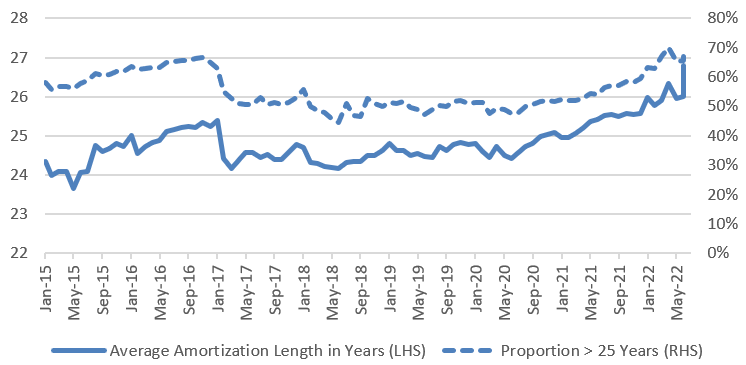
Higher debt service ratios have the most direct impact on FRFIs, as they lead to higher default probabilities and potential losses at these lenders. One of the key strategies FRFIs and borrowers have been using to offset the impact of interest rate increases on debt service ratios is to extend the amortization periods of mortgage originations. (See Chart 4)
Chart 4 - Average amortization length of uninsured mortgage originations
Average Amortization Length of Uninsured Mortgage Originations - Table
| Filing month | Average Amortization Length in Years (LHS) | Proportion > 25 Years (RHS) |
|---|---|---|
| Jan-15 | 24.3 | 58.07% |
| Feb-15 | 24.0 | 55.87% |
| Mar-15 | 24.1 | 56.63% |
| Apr-15 | 24.1 | 56.85% |
| May-15 | 23.7 | 55.96% |
| Jun-15 | 24.1 | 57.89% |
| Jul-15 | 24.1 | 58.89% |
| Aug-15 | 24.8 | 61.15% |
| Sep-15 | 24.6 | 60.71% |
| Oct-15 | 24.7 | 60.77% |
| Nov-15 | 24.8 | 61.89% |
| Dec-15 | 24.7 | 61.80% |
| Jan-16 | 25.0 | 63.76% |
| Feb-16 | 24.6 | 62.48% |
| Mar-16 | 24.7 | 62.97% |
| Apr-16 | 24.8 | 63.33% |
| May-16 | 24.9 | 63.36% |
| Jun-16 | 25.1 | 64.92% |
| Jul-16 | 25.2 | 65.35% |
| Aug-16 | 25.2 | 65.73% |
| Sep-16 | 25.2 | 65.57% |
| Oct-16 | 25.2 | 66.35% |
| Nov-16 | 25.4 | 66.59% |
| Dec-16 | 25.2 | 64.86% |
| Jan-17 | 25.4 | 62.82% |
| Feb-17 | 24.4 | 55.23% |
| Mar-17 | 24.2 | 52.75% |
| Apr-17 | 24.4 | 51.18% |
| May-17 | 24.6 | 50.77% |
| Jun-17 | 24.6 | 50.51% |
| Jul-17 | 24.5 | 53.07% |
| Aug-17 | 24.5 | 50.51% |
| Sep-17 | 24.4 | 51.36% |
| Oct-17 | 24.4 | 50.50% |
| Nov-17 | 24.6 | 51.31% |
| Dec-17 | 24.8 | 52.95% |
| Jan-18 | 24.7 | 55.70% |
| Feb-18 | 24.3 | 49.98% |
| Mar-18 | 24.3 | 48.72% |
| Apr-18 | 24.2 | 47.89% |
| May-18 | 24.2 | 46.02% |
| Jun-18 | 24.2 | 44.50% |
| Jul-18 | 24.3 | 51.02% |
| Aug-18 | 24.3 | 46.79% |
| Sep-18 | 24.3 | 46.69% |
| Oct-18 | 24.5 | 52.83% |
| Nov-18 | 24.5 | 50.88% |
| Dec-18 | 24.6 | 49.96% |
| Jan-19 | 24.8 | 51.24% |
| Feb-19 | 24.6 | 50.89% |
| Mar-19 | 24.6 | 51.64% |
| Apr-19 | 24.5 | 49.72% |
| May-19 | 24.5 | 48.84% |
| Jun-19 | 24.5 | 47.15% |
| Jul-19 | 24.4 | 48.97% |
| Aug-19 | 24.7 | 50.36% |
| Sep-19 | 24.6 | 49.87% |
| Oct-19 | 24.8 | 51.79% |
| Nov-19 | 24.8 | 52.00% |
| Dec-19 | 24.8 | 50.95% |
| Jan-20 | 24.8 | 51.19% |
| Feb-20 | 24.6 | 51.21% |
| Mar-20 | 24.5 | 47.70% |
| Apr-20 | 24.7 | 49.47% |
| May-20 | 24.5 | 49.04% |
| Jun-20 | 24.4 | 47.73% |
| Jul-20 | 24.6 | 47.95% |
| Aug-20 | 24.7 | 50.09% |
| Sep-20 | 24.8 | 50.52% |
| Oct-20 | 25.0 | 51.61% |
| Nov-20 | 25.0 | 52.18% |
| Dec-20 | 25.1 | 51.65% |
| Jan-21 | 25.0 | 52.43% |
| Feb-21 | 25.0 | 51.87% |
| Mar-21 | 25.1 | 52.14% |
| Apr-21 | 25.2 | 52.55% |
| May-21 | 25.4 | 54.40% |
| Jun-21 | 25.4 | 53.90% |
| Jul-21 | 25.5 | 56.55% |
| Aug-21 | 25.5 | 57.12% |
| Sep-21 | 25.5 | 57.18% |
| Oct-21 | 25.6 | 58.54% |
| Nov-21 | 25.6 | 58.15% |
| Dec-21 | 25.6 | 59.55% |
| Jan-22 | 26.0 | 63.23% |
| Feb-22 | 25.8 | 62.89% |
| Mar-22 | 25.9 | 67.10% |
| Apr-22 | 26.3 | 70.05% |
| May-22 | 25.9 | 65.25% |
| Jun-22 | 26.0 | 65.68% |
| Jul-22 | 26.8 | 66.92% |
Source: FRFI filings to OSFI
Due to the recent and further expected rate increases, for the first time in years, consumers renewing their mortgages are facing materially higher interest rates than the rates on their expiring loans. Particularly at risk are borrowers with variable-rate mortgages and loans that are coming up for renewal. In addition to the rate shock felt by borrowers who are renewing 5-year term mortgages, the impact of rising rates may be felt earlier on some variable rate mortgages, the proportion of which has increased during the pandemic. (See Chart 5)
Chart 5 - Proportion of newly originated uninsured variable rate mortgages
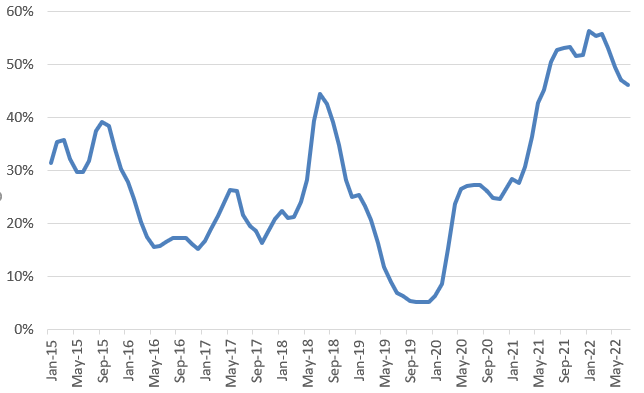
Proportion of Newly Originated Uninsured Variable Rate Mortgages - Table
| Filing month | Uninsured Variable proportion (by loan count) |
|---|---|
| Jan-15 | 31.35% |
| Feb-15 | 35.44% |
| Mar-15 | 35.68% |
| Apr-15 | 32.12% |
| May-15 | 29.73% |
| Jun-15 | 29.63% |
| Jul-15 | 31.83% |
| Aug-15 | 37.48% |
| Sep-15 | 39.17% |
| Oct-15 | 38.41% |
| Nov-15 | 34.08% |
| Dec-15 | 30.23% |
| Jan-16 | 27.88% |
| Feb-16 | 24.62% |
| Mar-16 | 20.30% |
| Apr-16 | 17.42% |
| May-16 | 15.62% |
| Jun-16 | 15.77% |
| Jul-16 | 16.45% |
| Aug-16 | 17.22% |
| Sep-16 | 17.30% |
| Oct-16 | 17.23% |
| Nov-16 | 16.09% |
| Dec-16 | 15.15% |
| Jan-17 | 16.72% |
| Feb-17 | 19.00% |
| Mar-17 | 21.45% |
| Apr-17 | 23.79% |
| May-17 | 26.23% |
| Jun-17 | 26.19% |
| Jul-17 | 21.59% |
| Aug-17 | 19.52% |
| Sep-17 | 18.61% |
| Oct-17 | 16.28% |
| Nov-17 | 18.77% |
| Dec-17 | 20.84% |
| Jan-18 | 22.27% |
| Feb-18 | 21.00% |
| Mar-18 | 21.21% |
| Apr-18 | 24.05% |
| May-18 | 28.28% |
| Jun-18 | 39.31% |
| Jul-18 | 44.36% |
| Aug-18 | 42.44% |
| Sep-18 | 39.18% |
| Oct-18 | 34.72% |
| Nov-18 | 28.26% |
| Dec-18 | 24.93% |
| Jan-19 | 25.40% |
| Feb-19 | 23.38% |
| Mar-19 | 20.66% |
| Apr-19 | 16.33% |
| May-19 | 11.75% |
| Jun-19 | 8.96% |
| Jul-19 | 6.92% |
| Aug-19 | 6.35% |
| Sep-19 | 5.43% |
| Oct-19 | 5.25% |
| Nov-19 | 5.20% |
| Dec-19 | 5.32% |
| Jan-20 | 6.42% |
| Feb-20 | 8.54% |
| Mar-20 | 15.15% |
| Apr-20 | 23.68% |
| May-20 | 26.51% |
| Jun-20 | 27.12% |
| Jul-20 | 27.31% |
| Aug-20 | 27.29% |
| Sep-20 | 26.11% |
| Oct-20 | 24.81% |
| Nov-20 | 24.54% |
| Dec-20 | 26.51% |
| Jan-21 | 28.46% |
| Feb-21 | 27.65% |
| Mar-21 | 30.71% |
| Apr-21 | 36.20% |
| May-21 | 42.77% |
| Jun-21 | 45.21% |
| Jul-21 | 50.38% |
| Aug-21 | 52.69% |
| Sep-21 | 53.08% |
| Oct-21 | 53.18% |
| Nov-21 | 51.49% |
| Dec-21 | 51.77% |
| Jan-22 | 56.19% |
| Feb-22 | 55.40% |
| Mar-22 | 55.72% |
| Apr-22 | 53.10% |
| May-22 | 49.50% |
| Jun-22 | 47.00% |
| Jul-22 | 46.15% |
Source: FRFI filings to OSFI
Potential losses at financial institutions
FRFIs need to ensure that they are prepared to handle the potential implications of lower housing prices and higher interest rates. In particular, the level of loss experienced by lenders not only depends on the likelihood of a default, but also how much of the loan the banks would lose in case of a default.
All uninsured mortgages are required to have at least a 20% down payment, which acts as a buffer in case of a downturn, while in the case of insured mortgages, mortgage insurers would be responsible for losses associated with defaulted properties. As market prices decline, the borrower’s equity is first impacted and once that is exhausted, the financial institutions would start observing actual losses in the case of borrower defaults. This buffer also accounts for the fact that foreclosed properties tend to be sold at a discount and that lenders have various costs associated with maintaining the properties and selling them. As such, any price corrections can quickly have an impact by increasing lenders’ losses.
Impact of Guideline B-20
Elevated level of household indebtedness
Following revisions to Guideline B-20 in 2018, lenders made changes that reduced the proportion of mortgages approved for the most highly indebted borrowers. These revisions included an updated minimum qualifying rate (MQR) “stress test”, that expects lenders to confirm borrowers’ ability to absorb unexpected changes in interest rates or income. As of June 1, 2021, the qualifying rate for all uninsured mortgages is the greater of the mortgage contractual rate plus 2% or 5.25%. The Minister of Finance implemented the same test for insured mortgages.
The MQR has provided a margin of safety, in that it has created room to absorb some of the impact of the recent increases in mortgage interest rates. The MQR prevented borrowers from overstretching themselves, thus ensuring that a larger number of borrowers could keep making payments even as interest rates rise. Recent increases in mortgage interest rates have already eroded a significant portion of the debt service capacity provided for by the qualifying rate buffer.
Contractual GDS ratios have remained largely stable, until recently, while qualifying GDS ratios have risen over time. This suggests that the MQR established a reliable buffer over actual mortgage rates in FRFI underwriting practices. (See Chart 6)
Chart 6 - Uninsured mortgage originations - Average qualifying and contract GDS
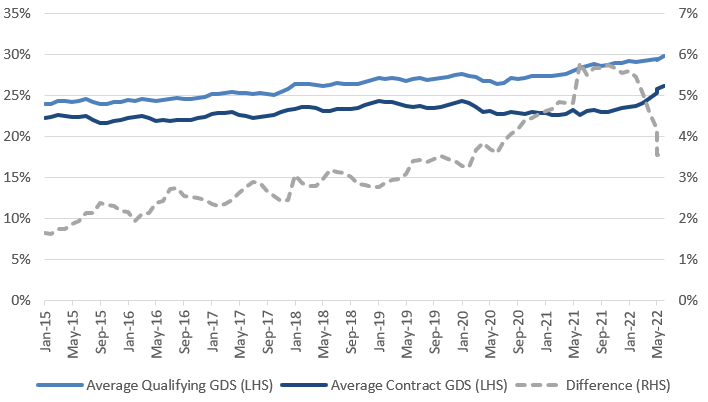
Uninsured Mortgage Originations - Average Qualifying and Contract GDS - Table
| Filing month | Average Qualifying GDS (LHS) |
Average Contract GDS (LHS) |
Difference (RHS) |
|---|---|---|---|
| Jan-15 | 24% | 22% | 2% |
| Feb-15 | 24% | 22% | 2% |
| Mar-15 | 24% | 23% | 2% |
| Apr-15 | 24% | 23% | 2% |
| May-15 | 24% | 22% | 2% |
| Jun-15 | 24% | 22% | 2% |
| Jul-15 | 25% | 22% | 2% |
| Aug-15 | 24% | 22% | 2% |
| Sep-15 | 24% | 22% | 2% |
| Oct-15 | 24% | 22% | 2% |
| Nov-15 | 24% | 22% | 2% |
| Dec-15 | 24% | 22% | 2% |
| Jan-16 | 24% | 22% | 2% |
| Feb-16 | 24% | 22% | 2% |
| Mar-16 | 25% | 22% | 2% |
| Apr-16 | 24% | 22% | 2% |
| May-16 | 24% | 22% | 2% |
| Jun-16 | 24% | 22% | 2% |
| Jul-16 | 25% | 22% | 3% |
| Aug-16 | 25% | 22% | 3% |
| Sep-16 | 25% | 22% | 3% |
| Oct-16 | 25% | 22% | 3% |
| Nov-16 | 25% | 22% | 2% |
| Dec-16 | 25% | 22% | 2% |
| Jan-17 | 25% | 23% | 2% |
| Feb-17 | 25% | 23% | 2% |
| Mar-17 | 25% | 23% | 2% |
| Apr-17 | 25% | 23% | 2% |
| May-17 | 25% | 23% | 3% |
| Jun-17 | 25% | 23% | 3% |
| Jul-17 | 25% | 22% | 3% |
| Aug-17 | 25% | 22% | 3% |
| Sep-17 | 25% | 22% | 3% |
| Oct-17 | 25% | 23% | 3% |
| Nov-17 | 25% | 23% | 2% |
| Dec-17 | 26% | 23% | 2% |
| Jan-18 | 26% | 23% | 3% |
| Feb-18 | 26% | 24% | 3% |
| Mar-18 | 26% | 24% | 3% |
| Apr-18 | 26% | 23% | 3% |
| May-18 | 26% | 23% | 3% |
| Jun-18 | 26% | 23% | 3% |
| Jul-18 | 26% | 23% | 3% |
| Aug-18 | 26% | 23% | 3% |
| Sep-18 | 26% | 23% | 3% |
| Oct-18 | 26% | 23% | 3% |
| Nov-18 | 27% | 24% | 3% |
| Dec-18 | 27% | 24% | 3% |
| Jan-19 | 27% | 24% | 3% |
| Feb-19 | 27% | 24% | 3% |
| Mar-19 | 27% | 24% | 3% |
| Apr-19 | 27% | 24% | 3% |
| May-19 | 27% | 24% | 3% |
| Jun-19 | 27% | 24% | 3% |
| Jul-19 | 27% | 24% | 3% |
| Aug-19 | 27% | 24% | 3% |
| Sep-19 | 27% | 24% | 3% |
| Oct-19 | 27% | 24% | 4% |
| Nov-19 | 27% | 24% | 3% |
| Dec-19 | 27% | 24% | 3% |
| Jan-20 | 28% | 24% | 3% |
| Feb-20 | 27% | 24% | 3% |
| Mar-20 | 27% | 24% | 4% |
| Apr-20 | 27% | 23% | 4% |
| May-20 | 27% | 23% | 4% |
| Jun-20 | 26% | 23% | 4% |
| Jul-20 | 27% | 23% | 4% |
| Aug-20 | 27% | 23% | 4% |
| Sep-20 | 27% | 23% | 4% |
| Oct-20 | 27% | 23% | 4% |
| Nov-20 | 27% | 23% | 4% |
| Dec-20 | 27% | 23% | 5% |
| Jan-21 | 27% | 23% | 5% |
| Feb-21 | 27% | 23% | 5% |
| Mar-21 | 27% | 23% | 5% |
| Apr-21 | 28% | 23% | 5% |
| May-21 | 28% | 23% | 4.8% |
| Jun-21 | 28% | 23% | 5.8% |
| Jul-21 | 29% | 23% | 5.5% |
| Aug-21 | 29% | 23% | 5.7% |
| Sep-21 | 29% | 23% | 5.7% |
| Oct-21 | 29% | 23% | 5.7% |
| Nov-21 | 29% | 23% | 5.7% |
| Dec-21 | 29% | 23% | 5.5% |
| Jan-22 | 29% | 24% | 5.6% |
| Feb-22 | 29% | 24% | 5.4% |
| Mar-22 | 29% | 24% | 5.0% |
| Apr-22 | 29% | 25% | 4.5% |
| May-22 | 29% | 25% | 4.2% |
| Jun-22 | 29% | 26% | 3.6% |
| Jul-22 | 30% | 26% | 3.6% |
Source: FRFI filings to OSFI
The MQR has had a meaningful impact on reducing high loan-to-income (LTI) borrowing following the January 2018 revisions to Guideline B-20. At the same time, there has been a build-up in the proportion of new uninsured mortgage originations with an LTI > 4.5x, which doubled from mid-2018 to early 2022. The extremely low interest rates reduced debt service costs substantially, allowing borrowers to take on additional leverage. As rates rise, the ability to service the increased leverage is reduced. (See Chart 7)
Chart 7 - Average LTI and proportion of uninsured mortgage originations with LTI > 4.5x
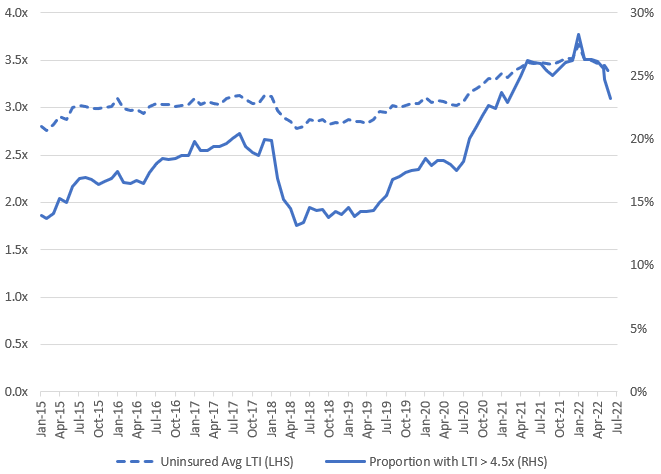
Average LTI and Proportion of Uninsured Mortgage Originations with LTI > 4.5x - Table
| Filing month | Uninsured Avg LTI (LHS) | Proportion with LTI > 4.5x (RHS) |
|---|---|---|
| Jan-15 | 2.80 | 13.96% |
| Feb-15 | 2.76 | 13.73% |
| Mar-15 | 2.82 | 14.12% |
| Apr-15 | 2.90 | 15.27% |
| May-15 | 2.88 | 15.03% |
| Jun-15 | 3.00 | 16.25% |
| Jul-15 | 3.02 | 16.91% |
| Aug-15 | 3.02 | 16.99% |
| Sep-15 | 3.00 | 16.82% |
| Oct-15 | 2.99 | 16.45% |
| Nov-15 | 3.01 | 16.64% |
| Dec-15 | 3.01 | 16.89% |
| Jan-16 | 3.10 | 17.45% |
| Feb-16 | 2.99 | 16.59% |
| Mar-16 | 2.97 | 16.53% |
| Apr-16 | 2.98 | 16.74% |
| May-16 | 2.94 | 16.53% |
| Jun-16 | 3.01 | 17.35% |
| Jul-16 | 3.05 | 18.04% |
| Aug-16 | 3.04 | 18.49% |
| Sep-16 | 3.03 | 18.37% |
| Oct-16 | 3.01 | 18.46% |
| Nov-16 | 3.03 | 18.69% |
| Dec-16 | 3.03 | 18.68% |
| Jan-17 | 3.10 | 19.85% |
| Feb-17 | 3.04 | 19.12% |
| Mar-17 | 3.06 | 19.09% |
| Apr-17 | 3.05 | 19.39% |
| May-17 | 3.04 | 19.42% |
| Jun-17 | 3.09 | 19.66% |
| Jul-17 | 3.12 | 20.07% |
| Aug-17 | 3.13 | 20.47% |
| Sep-17 | 3.09 | 19.43% |
| Oct-17 | 3.04 | 18.94% |
| Nov-17 | 3.05 | 18.72% |
| Dec-17 | 3.13 | 19.95% |
| Jan-18 | 3.12 | 19.93% |
| Feb-18 | 2.96 | 16.90% |
| Mar-18 | 2.90 | 15.24% |
| Apr-18 | 2.86 | 14.53% |
| May-18 | 2.78 | 13.17% |
| Jun-18 | 2.80 | 13.44% |
| Jul-18 | 2.87 | 14.56% |
| Aug-18 | 2.86 | 14.35% |
| Sep-18 | 2.88 | 14.43% |
| Oct-18 | 2.83 | 13.84% |
| Nov-18 | 2.84 | 14.26% |
| Dec-18 | 2.83 | 14.08% |
| Jan-19 | 2.88 | 14.58% |
| Feb-19 | 2.85 | 13.87% |
| Mar-19 | 2.85 | 14.29% |
| Apr-19 | 2.84 | 14.24% |
| May-19 | 2.87 | 14.38% |
| Jun-19 | 2.96 | 15.00% |
| Jul-19 | 2.95 | 15.53% |
| Aug-19 | 3.02 | 16.83% |
| Sep-19 | 3.00 | 17.05% |
| Oct-19 | 3.03 | 17.33% |
| Nov-19 | 3.05 | 17.55% |
| Dec-19 | 3.04 | 17.60% |
| Jan-20 | 3.11 | 18.48% |
| Feb-20 | 3.05 | 17.92% |
| Mar-20 | 3.07 | 18.35% |
| Apr-20 | 3.07 | 18.33% |
| May-20 | 3.03 | 18.01% |
| Jun-20 | 3.02 | 17.52% |
| Jul-20 | 3.06 | 18.25% |
| Aug-20 | 3.16 | 20.02% |
| Sep-20 | 3.20 | 21.04% |
| Oct-20 | 3.24 | 21.91% |
| Nov-20 | 3.30 | 22.64% |
| Dec-20 | 3.30 | 22.45% |
| Jan-21 | 3.36 | 23.66% |
| Feb-21 | 3.31 | 22.94% |
| Mar-21 | 3.39 | 24.02% |
| Apr-21 | 3.42 | 24.94% |
| May-21 | 3.48 | 26.24% |
| Jun-21 | 3.47 | 26.08% |
| Jul-21 | 3.47 | 25.96% |
| Aug-21 | 3.47 | 25.41% |
| Sep-21 | 3.45 | 25.01% |
| Oct-21 | 3.48 | 25.62% |
| Nov-21 | 3.52 | 26.09% |
| Dec-21 | 3.52 | 26.26% |
| Jan-22 | 3.67 | 28.30% |
| Feb-22 | 3.51 | 26.28% |
| Mar-22 | 3.50 | 26.32% |
| Apr-22 | 3.47 | 26.12% |
| May-22 | 3.44 | 25.57% |
| Jun-22 | 3.44 | 24.74% |
| Jul-22 | 3.34 | 23.19% |
Source: FRFI filings to OSFI
Potential losses at financial institutions
Mortgages with loan-to-value (LTV) ratios in excess of 75% are considered relatively high ratio mortgages, meaning there is less equity at origination and thus, higher risk. The proportion of newly underwritten uninsured mortgages with LTV ratios in excess of 75% has been decreasing over the past year, and remains below its historic peak levels (see Chart 8).
Chart 8 - Proportion of uninsured mortgage originations with LTV > 75% by loan amount
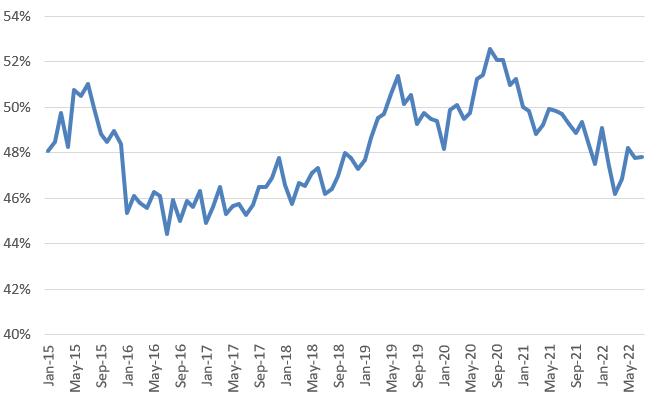
Proportion of Uninsured Mortgage Originations with LTV > 75% by Loan Amount - Table
| Filing | % |
|---|---|
| Jan-15 | 48.1% |
| Feb-15 | 48.5% |
| Mar-15 | 49.7% |
| Apr-15 | 48.3% |
| May-15 | 50.7% |
| Jun-15 | 50.5% |
| Jul-15 | 51.0% |
| Aug-15 | 50.0% |
| Sep-15 | 48.8% |
| Oct-15 | 48.5% |
| Nov-15 | 49.0% |
| Dec-15 | 48.4% |
| Jan-16 | 45.4% |
| Feb-16 | 46.1% |
| Mar-16 | 45.8% |
| Apr-16 | 45.6% |
| May-16 | 46.3% |
| Jun-16 | 46.1% |
| Jul-16 | 44.4% |
| Aug-16 | 45.9% |
| Sep-16 | 45.0% |
| Oct-16 | 45.9% |
| Nov-16 | 45.6% |
| Dec-16 | 46.3% |
| Jan-17 | 44.9% |
| Feb-17 | 45.6% |
| Mar-17 | 46.5% |
| Apr-17 | 45.3% |
| May-17 | 45.7% |
| Jun-17 | 45.7% |
| Jul-17 | 45.2% |
| Aug-17 | 45.7% |
| Sep-17 | 46.5% |
| Oct-17 | 46.5% |
| Nov-17 | 46.9% |
| Dec-17 | 47.8% |
| Jan-18 | 46.6% |
| Feb-18 | 45.7% |
| Mar-18 | 46.7% |
| Apr-18 | 46.5% |
| May-18 | 47.1% |
| Jun-18 | 47.3% |
| Jul-18 | 46.2% |
| Aug-18 | 46.4% |
| Sep-18 | 47.0% |
| Oct-18 | 48.0% |
| Nov-18 | 47.8% |
| Dec-18 | 47.3% |
| Jan-19 | 47.7% |
| Feb-19 | 48.6% |
| Mar-19 | 49.5% |
| Apr-19 | 49.7% |
| May-19 | 50.6% |
| Jun-19 | 51.3% |
| Jul-19 | 50.1% |
| Aug-19 | 50.6% |
| Sep-19 | 49.3% |
| Oct-19 | 49.8% |
| Nov-19 | 49.5% |
| Dec-19 | 49.4% |
| Jan-20 | 48.2% |
| Feb-20 | 49.9% |
| Mar-20 | 50.1% |
| Apr-20 | 49.5% |
| May-20 | 49.7% |
| Jun-20 | 51.2% |
| Jul-20 | 51.4% |
| Aug-20 | 52.5% |
| Sep-20 | 52.1% |
| Oct-20 | 52.1% |
| Nov-20 | 51.0% |
| Dec-20 | 51.2% |
| Jan-21 | 50.0% |
| Feb-21 | 49.8% |
| Mar-21 | 48.8% |
| Apr-21 | 49.2% |
| May-21 | 49.9% |
| Jun-21 | 49.8% |
| Jul-21 | 49.7% |
| Aug-21 | 49.3% |
| Sep-21 | 48.9% |
| Oct-21 | 49.3% |
| Nov-21 | 48.3% |
| Dec-21 | 47.5% |
| Jan-22 | 49.1% |
| Feb-22 | 47.4% |
| Mar-22 | 46.2% |
| Apr-22 | 46.8% |
| May-22 | 48.2% |
| Jun-22 | 47.8% |
| Jul-22 | 47.8% |
Source: FRFI filings to OSFI
Summary
OSFI’s actions are aimed at addressing the health of the federally regulated financial institutions active in lending, including in the residential real estate market.
In a rising rate environment, the debt service burden rises as consumers pay more interest, which can have a meaningful impact, especially on households that are already financially stretched. In turn, this can lead to higher default rates.
The MQR has provided a margin of safety that improves borrowers’ ability to absorb unexpected changes in interest rates or income. The MQR prevented borrowers from stretching their borrowing capacity to its maximum, thus ensuring that a larger number of borrowers could keep making payments even as interest rates rise. Recent increases in mortgage interest rates have already eroded a significant portion of the debt service capacity provided for by the qualifying rate buffer, and debt service ratios are still increasing.
Financial institutions may experience losses on their residential real estate loans in the case of borrower defaults if the value of the homeowners’ equity substantially erodes. This type of a situation has not been observed in Canada for decades due to the stability of the housing market but can happen in the case of a prolonged housing market correction.
OSFI will take action to continue to assess FRFIs’ readiness to manage borrower challenges in their mortgage portfolios and higher potential losses in light of their existing provisioning levels and capital positions.