Canada Pension Plan: Actuarial and investment considerations
Assia Billig, Chief Actuary
Office of the Superintendent of Financial Institutions, Canada
Steven James, Managing Director
Canada Pension Plan Investments
20th International Conference of Social Security Actuaries, Statisticians and Investment Specialists
ACT 2022, 28–31 March 2022
Canada Pension Plan (CPP) (Slide 2)
- Contributory retirement social insurance program covering all working Canadians outside of the province of Quebec
- Two components of the CPP: base and additional
- CPP is financed through employee and employer contributions and investment earnings
- Assets of the CPP are invested by Canada Pension Plan Investments (CPPIB)
Sustainability of base and additional CPP (Slide 3)
- The financial state of the CPP is reviewed every three years by the federal Minister of Finance and the provincial ministers
- The review is based on the results of the actuarial valuation which determines minimum contribution rates needed to sustain the plan over long-term
- The Plan is considered sustainable if the legislated contribution rates are in line with minimum contribution rates
Self-adjustment mechanisms (Slide 4)
- Should legislated rates be considered insufficient to sustain the Plan or outside of specified ranges, ministers must agree on course of actions
- Insufficient rates provision articulate default adjustments to the Plan in case no agreement is reached between ministers
Roles and responsibilities of the OCA and CPPIB (Slide 5)
- The role of each stakeholder is defined by legislation
- The OCA prepares an actuarial report on the financial state of the Plan every three years identifying the minimum contribution rates needed to sustain the Plan
- CPPIB invests CPP assets in line with its mandate
CPPIB and OCA maintain constant dialogue and exchange information
CPPIB’s mandate requires consideration of both asset and liability factors (Slide 6)
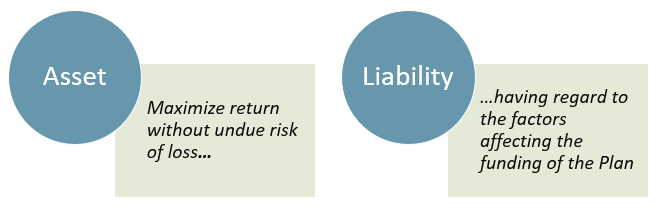
Chart Description
This slide contains two graphics, one on the left and one on the right. Each graphic is made up of a circle connected to a rectangle. In the left graphic, the circle is labelled “Asset” and the rectangle connected to it is labelled “Maximize return without undue risk of loss…”. In the right graphic, the circle is labelled “Liability” and the rectangle connected to it is labelled “…having regard to the factors affecting the funding of the Plan”.
- Asset-liability management balances Plan outcome risk and reward in setting the target risk of the Base and Additional CPP through Reference Portfolios
- Investment Guideline 6: Taking into account social security liabilities and funding policy in the determination of investment policy
CPPIB Step 1: Stochastic modelling of the Open Group balance sheet (Slide 7)
- Open Group balance approximates the statutory sustainability test
- Stochastic modelling of components generates stochastic Minimum Contribution Rate (MCR)
- Deterministic baseline benchmarked to last Actuarial Review
Base CPP Open Group Balance Sheet – Dec 31, 2018 (OCA Discount Rates)

Chart Description
The graph on this slide consists of two side-by-side stacked columns to illustrate the breakdown of the two components of the base CPP open group balance sheet as at December 31, 2018 based on OCA discount rates. The two components are: total liabilities and total assets.
The stacked column on the left is for total liabilities and is broken down between present value of future benefits (past service) and present value of future benefits (future service). The height of the column representing future service is slightly higher than the one representing past service.
The stacked column on the right is for total assets and is broken down between the fund and the present value of future contributions at statutory rate. The height of the column representing the fund is significantly lower than the one representing the present value of future contributions at statutory rate.
Investment, economic and demographic shocks affect fund and cash flow realizations… (Slide 8)
- Asset return shocks directly affect fund realizations
- Economic and demographic shocks directly affect cash flow realizations
- Shocks occur within a modelled repeating 3-year Actuarial Review cycle over the full 75-year Actuarial horizon
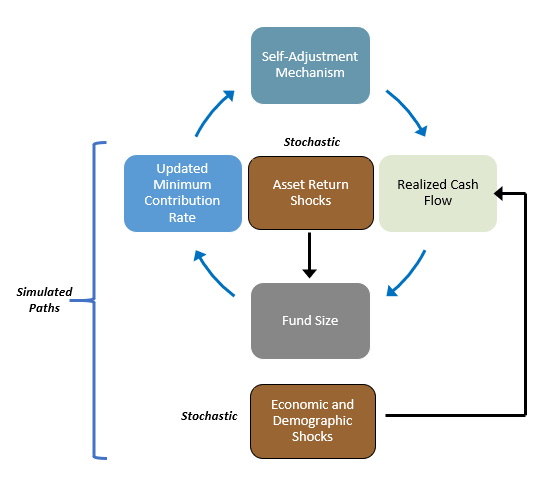
Chart Description
The chart on this slide portrays the inputs affecting fund and cash flow realizations.
There are six boxes across four rows and three columns. In the first row, there is one box in the second column labelled “Self- Adjustment Mechanism”. In the second row, the first box is in the first column and is labelled “Updated Minimum Contribution Rate”. The second box is in the second column and is labelled “Stochastic – Asset Return Shocks”. The third box is in the third column and is labelled “Realized Cash Flow”. In the third row, there is one box in the second column labelled “Fund Size”. In the fourth row, there is one box in the second column labelled “Stochastic – Economic and Demographic Shocks”.
There is an arrow pointing from “Self-Adjustment Mechanism” in the first row second column to “Realized Cash Flow” in the second row third column. There is an arrow pointing from “Realized Cash Flow” in the second row third column to “Fund Size” in the third row second column. There is an arrow pointing from “Fund Size” in the third row second column to “Updated Minimum Contribution Rate” in the second row first column. There is an arrow pointing from “Updated Minimum Contribution Rate” in the second row first column to “Self-Adjustment Mechanism” in the first row second column. There is an arrow pointing from “Stochastic-Asset Return Shocks” in the second row second column to “Fund Size” in the third row second column. There is an arrow pointing from “Stochastic – Economic and Demographic Shocks” in the fourth row second column to “Realized Cash Flow” in the second row third column.
The boxes in the second, third and fourth rows are categorized as “Simulated Paths”.
…as well as expected cash flow and the Open Group liability (Slide 9)
- Economic and demographic shocks propagate to expected earnings and benefits via the Plan’s indexing and accrual structure
- This generates liability and funding revisions which lead to an updated MCR and CPPIB risk target
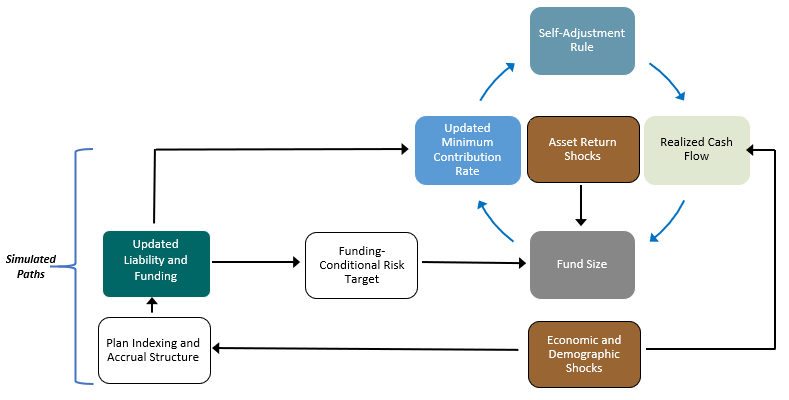
Chart Description
The chart on this slide portrays the inputs affecting fund and cash flow realizations, as well as expected cash flow and the Open Group liability.
There are nine boxes across four rows and five columns. In the first row, there is one box in the fourth column labelled “Self- Adjustment Rule”. In the second row, the first box is in the third column and is labelled “Updated Minimum Contribution Rate”. The second box is in the fourth column and is labelled “Asset Return Shocks”. The third box is in the fifth column and is labelled “Realized Cash Flow”. In the third row, the first box is in the first column and is labelled “Updated Liability and Funding”. The second box is in the second column and is labelled “Funding-Conditional Risk Target”. The third box is in the fourth column labelled “Fund Size”. In the fourth row, the first box is in the first column and is labelled “Plan Indexing and Accrual Structure”. The second box is in the fourth column labelled “Economic and Demographic Shocks”.
There is an arrow pointing from “Self-Adjustment Rule” in the first row fourth column to “Realized Cash Flow” in the second row fifth column. There is an arrow pointing from “Realized Cash Flow” in the second row fifth column to “Fund Size” in the third row fourth column. There is an arrow pointing from “Fund Size” in the third row fourth column to “Updated Minimum Contribution Rate” in the second row third column. There is an arrow pointing from “Updated Minimum Contribution Rate” in the second row third column to “Self-Adjustment Rule” in the first row fourth column. There is an arrow pointing from “Asset Return Shocks” in the second row fourth column to “Fund Size” in the third row fourth column. There is an arrow pointing from “Economic and Demographic Shocks” in the fourth row fourth column to “Realized Cash Flow” in the second row fifth column. There is an arrow pointing from “Economic and Demographic Shocks” in the fourth row fourth column to “Plan Indexing and Accrual Structure” in the fourth row first column. There is an arrow pointing from “Plan Indexing and Accrual Structure” in the fourth row first column to “Updated Liability and Funding” in the third row first column. There is one arrow pointing from “Updated Liability and Funding” in the third row first column to “Funding-Conditional Risk Target” in the third row second column. There is another arrow pointing from “Updated Liability and Funding” in the third row first column to “Updated Minimum Contribution Rate” in the second row third column. There is an arrow pointing from “Funding-Conditional Risk Target” in the third row second column to “Fund Size” in the third row fourth column.
The boxes in the second, third and fourth rows are categorized as “Simulated Paths”.
CPPIB Step 2: An explicit objective function expresses a view of Plan outcomes over various dimensions (Slide 10)
| Objective Function | Plan Value Metric (B) | Loss Function (A) | Time Steps; Horizon (C) |
|---|---|---|---|
| Minimize discounted expected loss function (A) defined over a Plan Value metric (B) over specified time steps and horizon (C) | Plan adjustments: change in contribution rate minus full cost rate (captures benefit adjustments) | Credit favourable adjustments less than unfavourable adjustments |
|
| Multi-period objective aligned with Open Group nature of Plan | Requires a detailed understanding of the actuarial review process and driversFootnote 1 | Expression of risk aversion explicable to the CPPIB Board and key stakeholders (including OCA)Footnote 1 | Aligns with open group nature of Plan and Actuarial Review cycleFootnote 1 |
Table Footnotes
|
|||
CPPIB Step 3: Solve for the optimal control rule that meets the objective (Slide 11)
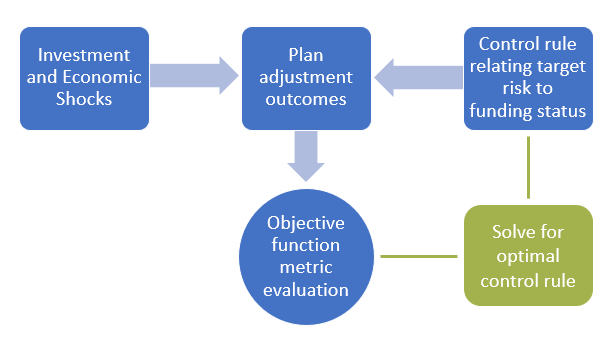
Chart Description
The chart on this slide portrays factors used to solve for the optimal control rule that meets the objective.
There are five shapes across two rows and three columns. There are three blue boxes in the top row, one in each column. In the bottom row, there is one blue circle in the second column and one green box in the third column.
The box in the first row first column is labelled “Investment and Economic Shocks”. The box in the first row second column is labelled “Plan adjustment outcomes”. The box in the first row third column is labelled “Control rule relating target risk to funding status”. The circle in the second row second column is labelled “Objective function metric evaluation”. The box in the second row third column is labelled “Solve for optimal control rule”.
There is a blue arrow pointing from “Investment and Economic Shocks” in the first row first column to “Plan adjustment outcomes” in the first row second column. There is a blue arrow pointing from “Control rule relating target risk to funding status” in the first row third column to “Plan adjustment out comes” in the first row second column. There is a blue arrow pointing from “Plan adjustment outcomes” in the first row second column to “Objective function metric evaluation” in the second row second column. There is one green line connecting “Solve for optimal control rule” in the second row third column to “Control rule relating target risk to funding status” in the first row third column. There is another green line connecting “Solve for optimal control rule” in the second row third column to “Objective function metric evaluation” in the second row second column.
CPPIB Step 3: Optimal control rule solution (Slide 12)
- Consistent application to each part of Plan
- Dynamic rule – optimal risk target as funding statuses evolve
Optimal Funding-Conditional Equity-Debt Risk Schedule
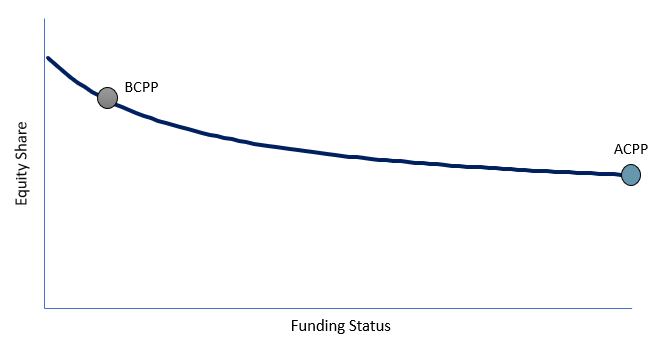
Chart Description
This slide shows a line chart showing the optimal funding-conditional equity-debt risk schedule. The x-axis represents Funding Status. The y-axis represents Equity Share.
There is one line on the chart. When the Funding status X-axis is 0, the line starts from near the top of Equity Share y-axis and slowly decreases to about the halfway point of the y-axis, by the end of the x-axis.
There are two points highlighted on the line. The first point is labelled “BCPP” and is positioned about 10% of the way down the line. The second point is labelled “ACPP” and is positioned at the very end of the line.
There are two text bullets overlayed on the chart. The first bullet says “consistent application to each part of Plan”. The Second bullet says “Dynamic rule – optimal risk target as funding statuses evolve”.
The CPPIB process requires key inputs that originate from the actuarial review cycle as well as actuarial and Plan structure insights (Slide 13)
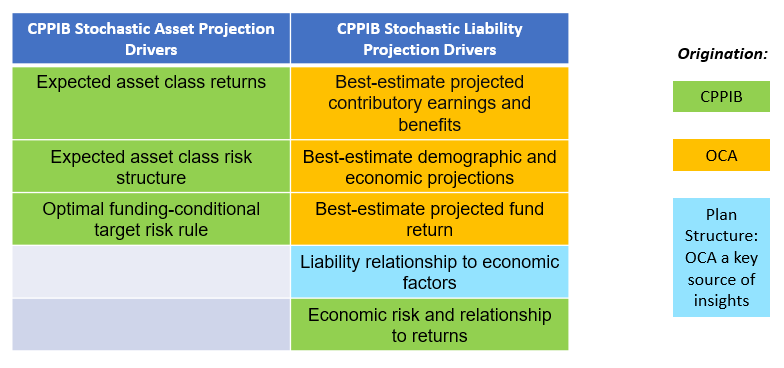
Chart Description
This slide contains a table with six rows and two columns, and a colour legend. The legend indicates that rows coloured green originate from “CPPIB”, orange from “OCA”, and blue from “Plan Structure: OCA a key source of insights”.
The title of the first column is labelled “CPPIB Stochastic Asset Projection Drivers”. There are three green rows below the title in this column. The first row is labelled “Expected asset class returns”. The second row is labelled “Expected asset class risk structure”. The third row is labelled “Optimal funding-conditional target risk rule”.
The title of the second column is labelled “CPPIB Stochastic Liability Projection Drivers”. There are three orange rows one blue row, and one green row below the title in this column. The first orange row is labelled “Best-estimate projected contributory earnings and benefits”. The second orange row is labelled “Best-estimate demographic and economic projections”. The third orange row is labelled “Best-estimate projected fund return”. The blue row is labelled “Liability relationship to economic factors”. The green row is labelled “Economic risk and relationship to returns”.
Alignment of the Reference Portfolio and actuarial review cycles facilitates two-way data and information sharing between the two processes (Slide 14)
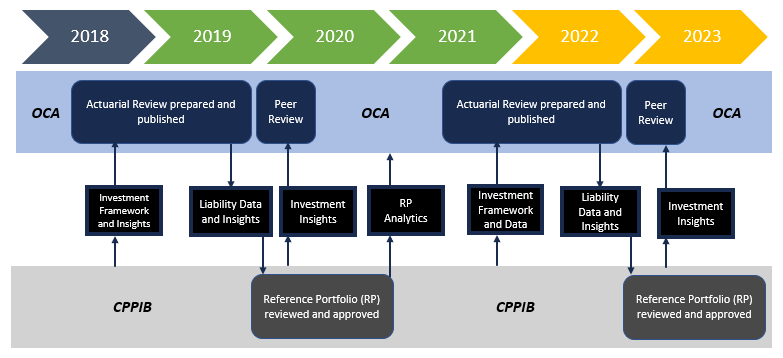
Chart Description
The chart on this slide portrays the data and information sharing between the OCA and CPPIB.
There are four rows of shapes. The first row has 6 arrows, each labelled with consecutive years, starting with “2018” and ending in “2023”.
The second row represents processes from the OCA. The first box is labelled “Actuarial Review prepared and published”. This box extends from the halfway point of the “2018” arrow in the first row to the end of the “2019” arrow in the first row. The second box is labelled “Peer review”. This box extends from the end of the “2019” arrow in the first row to the halfway point of the “2020” arrow in the first row. The third box is labelled “Actuarial Review prepared and published”. This box extends from the halfway point of the “2021” arrow in the first row to the end of the “2022” arrow in the first row. The fourth box is labelled “Peer review”. This box extends from the end of the “2022” arrow in the first row to the halfway point of the “2023” arrow in the first row.
The third row represents the information shared between CPPIB and OCA. The first box is labelled “Investment Framework and Insights” and is indicated as being provided by CPPIB to OCA during the first “Actuarial Review prepared and published” stage in the second row. The second box is labelled “Liability Data and Insights” and is indicated as being provided by the OCA to CPPIB during the first “Actuarial Review prepared and published” stage in the second row. The third box is labelled “Investment Insights” and is indicated as being provided by the CPPIB to the OCA during the first “Peer Review” stage in the second row. The fourth box is labelled “RP analytics” and is indicated as being provided by the CPPIB to the OCA between the first “Peer review” stage and the second “Actuarial review prepared and published” stage in the second row, which corresponds to between the second half of the “2020” arrow in the first row and the first half of the “2021” arrow in the first row.
The fifth box is labelled “Investment Framework and Data” and is indicated as being provided by CPPIB to OCA during the second “Actuarial Review prepared and published” stage in the second row. The sixth box is labelled “Liability Data and Insights” and is indicated as being provided by the OCA to CPPIB during the second “Actuarial Review prepared and published” stage in the second row. The third box is labelled “Investment Insights” and is indicated as being provided by the CPPIB to the OCA during the second “Peer Review” stage in the second row.
The fourth row represents processes from the CPPIB. The first box is labelled “Reference Portfolio (RP) reviewed and approved”. This box extends from the beginning of the “2020” arrow in the first row to the end of the “2020” arrow in the first row. It is indicated that it is developed using the “Liability Data and Insights” from OCA in the third row but is also used to develop the “Investment Insights” and “RP Analytics” in the third row. The second box is labelled “Reference Portfolio (RP) reviewed and approved”. This box extends from the beginning of the “2023” arrow in the first row to the end of the “2023” arrow in the first row. It is indicated that it is developed using the “Liability Data and Insights” from OCA in the third row but is also used to develop the “Investment Insights” in the third row.
OCA projections cover very long time period – at least 75 years (Slide 15)
- Real rate of return on assets projections is OCA best-estimate assumption
- Risk-return structure of assets classes
- Asset allocation
- Deterministic best-estimate assumptions are complemented by an extensive stochastic stress-testing
In the process of preparing the CPP actuarial valuations the OCA needs input from the CPPIB (Slide 16)
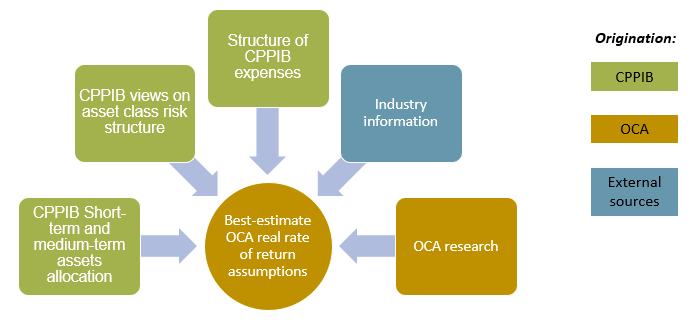
Chart Description
The chart on this slide portrays the inputs used to prepare the CPP actuarial valuations. There are five boxes with arrows pointing towards a circle in the middle. The middle circle is labelled “Best-estimate OCA real rate of return assumptions”.
Starting clockwise from the left of the circle, the first three boxes are all categorized as inputs coming from CPPIB, the first labelled “CPPIB Short-term and medium-term assets allocation, the second labelled, “CPPIB views on asset class risk structure”, and the third labelled “Structure of CPPIB expenses”.
The fourth box is categorized as coming from External sources and labelled as “Industry information”.
The fifth and final box is categorized as coming from OCA and labelled as “OCA research”.
OCA dynamic asset allocation approach – projections over long time horizon (Slide 17)
- Valuation date
- Actual asset allocation
- Medium term
- Transition to long-term assumptions
- Input from CPPIB’s long-term strategic portfolio (not long-term from actuarial point of view)
- Long term
CPPIB Actual and Strategic Portfolios (Base CPP) for CPP30 (Slide 18)
Asset classes and allocations as at valuation date are aligned with CPPIB (level of risk of Reference Portfolio 85 equities/15 fixed income)
Source: CPP Investments – 2019 Annual Report
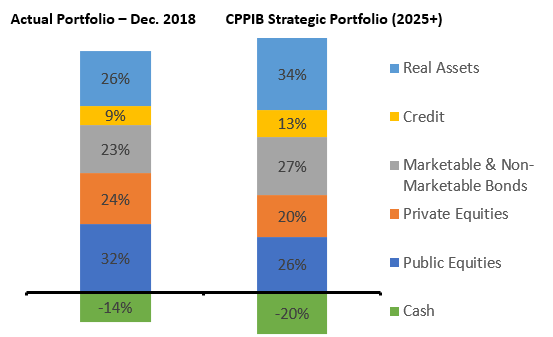
Chart Description
The graph on this slide consists of a stacked column chart with two columns showing CPPIB’s asset allocation for the base CPP by asset class at two different points in time.
The left column shows the actual portfolio at December 2018. It contains 26% real assets, 9% credit, 23% marketable & non-marketable bonds, 24% private equities, 32% public equities, and -14% cash.
The right column shows the CPPIB strategic portfolio (2025+) based on CPP Investments’ 2019 annual report. It contains 34% real assets, 13% credit, 27% marketable & non-marketable bonds, 20% private equities, 26% public equities, and -20% cash.
OCA dynamic asset allocation approach – projections over long time horizon (Slide 19)
- Valuation date
- Actual asset allocation
- Medium term
- Transition to long-term assumptions
- Input from CPPIB’s long-term strategic portfolio (not long-term from actuarial point of view)
- Long term
- Recognize financing objectives of the Plan
- Assume that assets are invested with the view to support the stability and the sufficiency of contribution rates (level of risk)
By the design of the base CPP financing, investment income increases in importance as a source of revenues (Slide 20)
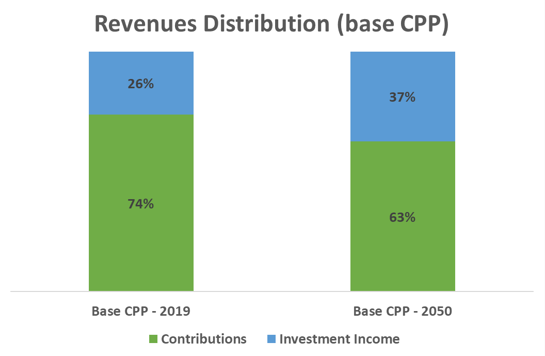

Source: 30th CPP Actuarial Report
Chart Description
This slide contains two charts. The left chart is a stacked column chart with two columns showing the revenue distribution for the base CPP at two different points in time. The left column shows the revenue distribution for the base CPP in 2019, which consists of 26% investment income and 74% contributions. The right column shows the revenue distribution for the base CPP in 2050, which consists of 37% investment income and 63% contributions.
The right chart is an area chart showing the percentage of expenditures covered by contributions for the base CPP over time. The X-axis represents years, starting in 2019 and ending in 2050. The Y-axis represents the percentage of expenditures covered by contributions, starting at 80% and going up to 100%.
The percentage of expenditures covered by contributions starts at 100% in 2019 and gradually decreases to about 89% in 2032, staying constant until 2048, then decreasing slightly to 88% in 2050.
Long-term risk/return trade-off (Slide 21)
- Stability
- Higher reliance on investment income for financing the Plan suggests higher impact of market volatility on the stability of contribution rate
- Sufficiency
- In order for the legislated contribution rate to be sufficient, a certain level of investment income is required
- Gradual decrease in equity allocation is assumed
- Consistent with CPPIB’s optimal control rule solution (slide 12)
| Hypothetical Reference Portfolio | Expected One-Year Standard Deviation | Minimum Contribution Rate | |
|---|---|---|---|
| Equity | Debt | ||
| 85 | 15 | 14.0 | 9.41 |
| 70 | 30 | 10.7 | 9.72 |
| 50 | 50 | 6.6 | 10.29 |
|
Current base CPP legislated rate: 9.9% Source: 30th CPP Actuarial Report |
|||
Risk of MCR Reaching Legislated Rate (Base CPP) (Slide 22)
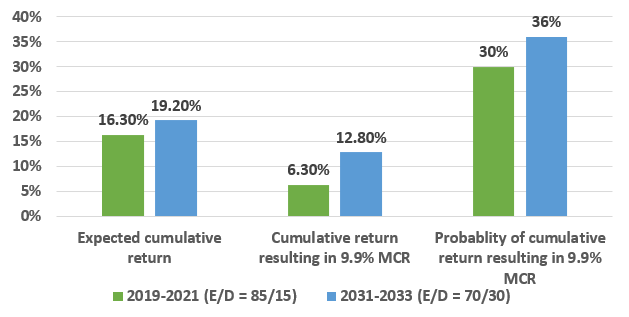
Source: 30th CPP Actuarial Report
Chart Description
This slide contains a clustered column chart titled “Risk of MCR Reaching Legislated Rate (Base CPP)”. The X-axis contains three sections, “Expected cumulative return”, “Cumulative return resulting in 9.9% MCR”, and “Probability of cumulative return resulting in 9.9% MCR”. The Y-Axis represents percentage, starting at 0% and going up to 40%.
In the “Expected cumulative return” section, the first column represents 2019-2021 (equity-debt ratio of 85/15) and has a value of 16.30%, and the second column represents 2031-2033 (equity-debt ratio of 70/30) and has a value of 19.20%.
In the “Cumulative return resulting in 9.9% MCR” section, the first column represents 2019-2021 (equity-debt ratio of 85/15) and has a value of 6.30%, and the second column represents 2031-2033 (equity-debt ratio of 70/30) and has a value of 12.80%.
In the “Probability of cumulative return resulting in 9.9% MCR” section, the first column represents 2019-2021 (equity-debt ratio of 85/15) and has a value of 30%, and the second column represents 2031-2033 (equity-debt ratio of 70/30) and has a value of 36%.
OCA asset allocation assumption – CPP30 (base CPP) (Slide 23)
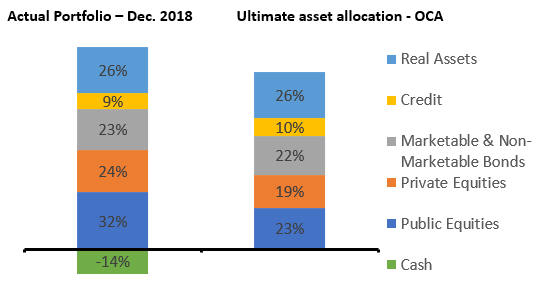
Chart Description
This slide contains a stacked column chart with two columns showing the CPP30 OCA asset allocation assumption for the base CPP by asset class at two different points in time.
The left column shows the actual portfolio at December 2018. It contains 26% real assets, 9% credit, 23% marketable & non-marketable bonds, 24% private equities, 32% public equities, and -14% cash.
The right column shows the ultimate assumed asset allocation of the OCA for the base CPP. It contains 26% real assets, 10% credit, 22% marketable & non-marketable bonds, 19% private equities, 23% public equities, and 0% cash.
Conclusion (Slide 24)
- CPP legislation clearly defines distinct roles for the actuarial and investment functions
- Mutual communication of data and underlying processes facilitates the ability of the OCA and CPPIB to meet their respective mandates in the service of the CPP
- Specific features (e.g., long investment horizon, target risk, Open Group balance) are reflective of the long-term and social insurance nature of CPP and its funding