Actuarial Report (31st) on the Canada Pension Plan
Accessibility statement
The Web Content Accessibility Guidelines (WCAG) defines requirements for designers and developers to improve accessibility for people with disabilities. It defines three levels of conformance: Level A, Level AA, and Level AAA. This report is partially conformant with WCAG 2.0 level AA. If you require a compliant version, please contact webmaster@osfi-bsif.gc.ca.
The Honourable Chrystia Freeland, P.C., M.P.
Minister of Finance
House of Commons
Ottawa, Canada
K1A 0A6
Dear Minister:
In accordance with section 115 of the Canada Pension Plan, which provides that an actuarial report shall be prepared every three years for purposes of the financial state review by the Minister of Finance and the ministers of the Crown from the provinces, I am pleased to submit the Thirty-First Actuarial Report on the Canada Pension Plan, prepared as at 31 December 2021.
Yours sincerely,
Assia Billig, FCIA, FSA, PhD
Chief Actuary
Table of contents
List of tables
- Table 1 Best-Estimate Assumptions
- Table 2 Population of Canada less Québec
- Table 3 Economic Assumptions
- Table 4 Contributions - Base CPP
- Table 5 Beneficiaries - Base CPP
- Table 6 Beneficiaries by Sex - Base CPP
- Table 7 Expenditures - Base CPP
- Table 8 Expenditures - Base CPP (millions of 2022 constant dollars)
- Table 9 Expenditures as Percentage of Contributory Earnings - Base CPP
- Table 10 Historical Results - Base CPP
- Table 11 Financial Projections - Base CPP, 9.9% Legislated Contribution Rate
- Table 12 Financial Projections – Base CPP, 9.9% Legislated Contribution Rate (millions of 2022 constant dollars)
- Table 13 Sources of Revenues and Funding of Expenditures - Base CPP, 9.9% Legislated Contribution Rate
- Table 14 Financial Projections - Base CPP, Minimum Contribution Rate of 9.56% for 2025-2033, 9.54% for 2034+
- Table 15 Progression of Minimum Contribution Rate over Time – Base CPP
- Table 16 Contributions - Additional CPP
- Table 17 Beneficiaries - Additional CPP
- Table 18 Beneficiaries by Sex – Additional CPP
- Table 19 Expenditures - Additional CPP
- Table 20 Expenditures – Additional CPP (millions of 2022 constant dollars)
- Table 21 Historical Results and Financial Projections - Additional CPP, 2.0%, 8.0% Legislated First and Second Additional Contribution Rates
- Table 22 Financial Projections - Additional CPP, 2.0%, 8.0% Legislated First and Second Additional Contribution Rates (millions of 2022 constant dollars)
- Table 23 Sources of Revenues - Additional CPP, 2.0%, 8.0% Legislated First and Second Additional Contribution Rates
- Table 24 Financial Projections - Additional CPP, First and Second Additional Minimum Contribution Rates of 1.97% / 7.88%
- Table 25 Progression of Additional Minimum Contribution Rates over Time
- Table 26 Change in Assets - 31 December 2018 to 31 December 2021 - Base CPP
- Table 27 Summary of Expenditures – 2019 to 2021 – Base CPP
- Table 28 Reconciliation of Changes in Minimum Contribution Rate
- Table 29 Change in Assets - 1 January 2019 to 31 December 2021 - Additional CPP
- Table 30 Reconciliation of Changes in Additional Minimum Contribution Rates
- Table 31 Legislated Contribution Rates
- Table 32 Projected Maximum Additional CPP Retirement Benefit
- Table 33 Legislated Pension Adjustment Factors
- Table 34 Projected Maximum Additional CPP Disability Benefit
- Table 35 Projected Maximum Additional CPP Survivor’s Benefit, Survivor under Age 65
- Table 36 Projected Maximum Additional CPP Survivor’s Benefit, Survivor Age 65 or Over
- Table 37 Data Sources
- Table 38 Cohort Fertility Rates by Age and Year of Birth
- Table 39 Fertility Rates for Canada
- Table 40 Percentage Increase in Mortality Rates
- Table 41 Assumed Annual Mortality Improvement Rates for Canada
- Table 42 Mortality Rates for Canada
- Table 43 Life Expectancies for Canada, without mortality improvements after the year shown
- Table 44 Life Expectancies for Canada, with mortality improvements after the year shown
- Table 45 Population of Canada by Age
- Table 46 Population of Canada less Québec by Age
- Table 47 Analysis of Population of Canada less Québec by Age
- Table 48 Births, Net Migrants, and Deaths for Canada less Québec
- Table 49 Active and Employed Populations (Canada, ages 15 and over)
- Table 50 Labour Force Participation, Employment, and Unemployment Rates (Canada, ages 15 and over)
- Table 51 Labour Force Participation Rates (Canada)
- Table 52 Employment of Population (Canada, ages 18 to 69)
- Table 53 Active and Employed Populations (Canada less Québec, ages 15 and over)
- Table 54 Labour Force Participation Rates (Canada less Québec)
- Table 55 Employment of Population (Canada less Québec, ages 18 to 69)
- Table 56 Real Wage Increase and Related Components
- Table 57 Inflation, Real AAE and AWE Increases
- Table 58 Average Annual Earnings (Canada less Québec, ages 18 to 69)
- Table 59 Total Earnings (Canada less Québec, ages 18 to 69)
- Table 60 Average Pensionable Earnings up to YMPE (Canada less Québec)
- Table 61 Average Pensionable Earnings up to YAMPE (Canada less Québec)
- Table 62 Proportion of Contributors to the CPP, by Age Group
- Table 63 Average Contributory Earnings for Pensionable Earnings up to YMPE
- Table 64 Average Contributory Earnings for Pensionable Earnings up to YAMPE
- Table 65 Total Adjusted Contributory Earnings for Pensionable Earnings up to YMPE
- Table 66 Total Adjusted Contributory Earnings for Pensionable Earnings up to YAMPE
- Table 67 Net Assets as at 31 December 2021
- Table 68 Initial Asset Mix as at 31 December 2021 for Base and Additional CPP
- Table 69 Real Rates of Return by Asset Type (before investment expenses and allocation for rebalancing and diversification)
- Table 70 Asset Mix, Portfolio Risk and Expected Rates of Return (before investment expenses)
- Table 71 Asset Mix, Portfolio Risk and Expected Rates of Return (before investment expenses)
- Table 72 Ultimate Rates of Return on Base and Additional CPP Assets
- Table 73 Annual Rates of Return on CPP Assets
- Table 74 Benefits Payable as at 31 December 2021 – Base CPP
- Table 75 Benefit Eligibility Rates by Type of Benefit
- Table 76 Proportion of Contributors to CPP (adjusted for benefit computation purposes)
- Table 77 Average Pensionable Earnings up to YMPE (adjusted for benefit computation purposes)
- Table 78 Average Pensionable Earnings up to YAMPE (adjusted for benefit computation purposes)
- Table 79 Average Earnings-Related Benefit as Percentage of Maximum Benefit - Base CPP
- Table 80 Average Additional Earnings-Related Benefit as Percentage of Maximum Additional Benefit - Additional CPP
- Table 81 Retirement Pension Take-up Rates (2031+)
- Table 82 New Retirement Beneficiaries and Pensions
- Table 83 Mortality Rates of Retirement Beneficiaries
- Table 84 Life Expectancies of Retirement Beneficiaries, with improvements after the year shown
- Table 85 Life Expectancies of Retirement Beneficiaries by Level of Base CPP Pension (2022), with future improvements
- Table 86 Proportion of CPP Retirement Beneficiaries who are Contributors
- Table 87 Average Contributory Earnings of Working Beneficiaries with Pensionable Earnings up to the YMPE
- Table 88 Average Contributory Earnings of Working Beneficiaries with Pensionable Earnings up to the YAMPE
- Table 89 Working Beneficiaries – Contributors, Contributions, and Post-Retirement Benefits
- Table 90 Ultimate Disability Incidence Rates (2026+)
- Table 91 New Disability Beneficiaries
- Table 92 New Disability Pensions and Post-retirement Disability Benefits
- Table 93 Disability Termination Rates in 2022 and 2035
- Table 94 Assumed Proportion of Contributors Married or in a Common-Law Relationship at Time of Death (2023+)
- Table 95 New Survivor Beneficiaries
- Table 96 New Survivor Pensions
- Table 97 Mortality Rates of Survivor Beneficiaries
- Table 98 Life Expectancies of Survivor Beneficiaries, with improvements after the year shown
- Table 99 Number of Death Benefits
- Table 100 New Children’s Benefits
- Table 101 Operating Expenses – Base CPP
- Table 102 Operating Expenses - Additional CPP
- Table 103 Full Funding Rates in Respect of the Amendments to the Base CPP
- Table 104 Additional CPP Balance Sheet (Open Group Basis)
- Table 105 Base CPP Balance Sheet (Open Group Basis)
- Table 106 Additional CPP Balance Sheet (Open Group Basis)
- Table 107 Reconciliation of Changes in Minimum Contribution Rate - Base CPP
- Table 108 Reconciliation of Changes in Additional Minimum Contribution Rates
- Table 109 Base CPP MCR as at December 31, 2021 based on Different Levels of Starting Assets
- Table 110 Probability Distribution of MCR as at 31 December 2024 based on 2022-2024 Intervaluation Investment Experience
- Table 111 Probability of MCR exceeding legislated rate of 9.9% as at 31 December 2024 based on 2022-2024 Investment Experience and Different Levels of MCRs at the Previous Valuation
- Table 112 Additional CPP FAMCR as at December 31, 2045 based on Different Levels of Starting Assets
- Table 113 Probability Distribution of FAMCR as at 31 December 2048 based on 2046-2048 Investment Returns Experience and Different Levels of FAMCRs at the Previous Valuation
- Table 114 Individual Sensitivity Test Assumptions
- Table 115 Sensitivity of Base CPP Minimum Contribution Rate
- Table 116 Sensitivity of Base CPP Assets/Expenditures Ratio
- Table 117 Sensitivity of Additional CPP Minimum Contribution Rates
- Table 118 Sensitivity of Additional CPP Assets/Expenditures Ratio
- Table 119 Higher and Lower Economic Growth Sensitivity Tests
- Table 120 Climate Change Scenario - Real Annual Rate of Return on Base CPP assets
- Table 121 Climate Change Scenario - Base CPP MCR for 2034 and thereafter
List of charts
- Chart 1 Revenues and Expenditures - Base CPP, 9.9% legislated contribution rate (billions of 2022 constant dollars)
- Chart 2 Revenues and Expenditures - Additional CPP, 2.0%/8.0% legislated contribution rates
- Chart 3 Historical and Projected Total and Cohort Fertility Rates for Canada
- Chart 4 Life Expectancies at Birth for Canada, without mortality improvements after the year shown
- Chart 5 Life Expectancies at Age 65 for Canada, without mortality improvements after the year shown
- Chart 6 Net Migration Rate (Canada)
- Chart 7 Age Distribution of the Population of Canada less Québec (thousands)
- Chart 8 Population of Canada less Québec
- Chart 9 Projected Components of Population Growth for Canada less Québec
- Chart 10 Components of the Labour Market
- Chart 11 Labour Force Participation Rates (Canada)
- Chart 12 Illustrative Two-Pool Investment Structure of the CPPIB
- Chart 13 Historical and Projected Retirement Pension Take-up Rates at age 60
- Chart 14 Historical Disability Incidence Rates
- Chart 15 Assets/Expenditures Ratio – Base CPP
- Chart 16 Assets/Expenditures Ratio – Additional CPP (legislated and additional minimum contribution rates)
- Chart 17 Illustrative Climate Scenarios – Cumulative GDP Impact Relative to Baseline Scenario
1 Highlights of the Report
| Contributions | Base CPP | Additional CPP |
|---|---|---|
|
Legislated contribution rate of 9.9% for year 2022 and thereafter. |
Legislated first and second additional contribution rates of 2.0% for 2023 and thereafter and 8.0% for 2024 and thereafter respectively. |
|
|
The number of CPP contributors expected to grow from 15.2 million in 2022 to 19.3 million in 2050. |
||
|
Contributions expected to increase from $61 billion in 2022 to $177 billion in 2050. |
Contributions expected to increase from $9.3 billion in 2022 to $45 billion in 2050. |
|
|
Contributions projected to be higher than expenditures up to the year 2025 inclusive. |
Contributions projected to be higher than expenditures up to the year 2057 inclusive. |
|
| Expenditures |
The number of retirement beneficiaries expected to increase from 6.0 million in 2022 to 9.9 million in 2050. Total expenditures projected to grow from $56 billion in 2022 to $197 billion in 2050. |
The number of retirement beneficiaries expected to increase from 0.8 million in 2022 to 8.9 million in 2050. Total expenditures projected to grow from $0.3 billion in 2022 to $29 billion in 2050. |
| Assets |
Total assets projected to grow from $544 billion at the end of 2021 to $791 billion by 2030 and $2.2 trillion by 2050. In 2050, investment income is projected to represent 42% of revenues. |
Total assets projected to grow from $11 billion at the end of 2021 to $200 billion by 2030 and $1.4 trillion by 2050. In 2050, investment income is projected to represent 61% of revenues. |
| Minimum Contribution Rates needed to sustain the CPP |
The minimum contribution rate is 9.56% of contributory earnings for years 2025 to 2033 and 9.54% for years 2034 and thereafter. |
The first additional minimum contribution rate as a percentage of contributory earnings is 1.97% for years 2025 and thereafter. The second additional minimum contribution rate as a percentage of contributory earnings above the YMPE up to the YAMPE is 7.88% for years 2025 and thereafter. |
|
The respective legislated contribution rates are higher than the minimum contribution rates needed to sustain the Plan, and thus are sufficient to finance both the base and additional CPP over the long term. |
||
| Rate of Return Assumption | Base CPP | Additional CPP |
|---|---|---|
|
The 31st CPP Actuarial Report is based on an assumed 75-year average annual nominal rate of return of 5.79% for the base CPP and 5.37% for the additional CPP. |
||
|
If lower average returns are assumed (4.20% for the base CPP and 4.17% for the additional CPP), this would result in: |
||
|
The MCR increasing from 9.54% to 11.22%. |
The FAMCR increasing from 1.97% to 2.86%. |
|
|
If higher average returns are assumed (7.39% for the base CPP and 6.57% for the additional CPP), this would result in: |
||
|
The MCR decreasing from 9.54% to 7.89%. |
The FAMCR decreasing from 1.97% to 1.38%. |
|
| Intervaluation Investment Experience |
Based on the best-estimate assumptions of this report, the MCR at the next valuation as at 31 December 2024 is expected to be 9.55%, and the FAMCR is expected to be 1.97%. |
|
|
However, there is a 16% probability that the MCR at the next valuation as at 31 December 2024 will exceed the legislated rate of 9.9% due to investment experience alone. |
It is very unlikely that short-term investment experience would cause the AMCRs to fall outside the “no action” ranges prescribed by the Additional Canada Pension Plan Sustainability Regulations. As the plan matures, it will become much more sensitive to intervaluation investment experience. The probability of the FAMCR as at 31 December 2048 falling outside the 1.8% to 2.1% range due to investment experience during the 2046-2048 period is 32%. |
|
| Mortality Assumption |
The 31st CPP Actuarial Report is based on the assumption that mortality will continue to improve but at a slower pace than over the last few decades. |
|
|
If longevity were to improve faster than assumed (life expectancies at age 65 in 2050 that are about 2 years higher), this would result in: |
||
|
The MCR increasing from 9.54% to 9.86%. |
The FAMCR increasing from 1.97% to 2.12%. |
|
|
If longevity were to improve slower than assumed (life expectancies at age 65 in 2050 that are about 2 years lower), this would result in: |
||
|
The MCR decreasing from 9.54% to 9.17% |
The FAMCR decreasing from 1.97% to 1.79%. |
|
| Economic Growth |
The 31st CPP Actuarial Report is based on the assumption of moderate and sustained economic growth. |
|
|
If lower economic growth is assumed with total employment earnings in 2035 being 11% lower, this would result in: |
||
|
The MCR increasing from 9.54% to 10.12%. |
The FAMCR decreasing from 1.97% to 1.73%. |
|
| If higher economic growth is assumed with total employment earnings in 2035 being 15% higher, this would result in: | ||
|
The MCR decreasing from 9.54% to 9.11%. |
The FAMCR increasing from 1.97% to 2.34%. |
|
| The impacts are in the opposite direction for the base and additional Plans due to the different financing approaches of the two components of the CPP. The base CPP relies more heavily on contributions as a source of revenues than the additional CPP. | ||
|
Table B footnotes
|
||
|
The 31st CPP Actuarial Report includes a new section that focuses on understanding and assessing downside risks due to three potential or emerging trends. Since the additional CPP is still at its early stages, it focuses on the base CPP only. Furthermore, given the purpose of the section, only adverse scenarios are presented. It is not meant to represent forecasts or predictions, and should be interpreted with caution. |
|
| Earnings Distribution |
The 31st CPP Actuarial Report assumes the same increase in earnings at each earnings level. If different nominal wage increases by earnings level are assumed until 2045, with lower increases assumed for lower level earners and vice-versa (no change in overall nominal wage growth compared to the best-estimate assumption), this would result in:
|
|---|---|
| Stagflation Scenario |
The 31st CPP Actuarial Report is based on the assumption that the current environment of high inflation is temporary and that the Bank of Canada will be successful in reaching its current mid-point inflation target of 2.0% by 2026. Elevated inflation over a long period of time can lead to stagflation, which is characterized by a simultaneous economic stagnation and increase in inflation. A hypothetical stagflation scenario was developed in which inflation and unemployment rates are higher than under the best-estimate assumptions, while real-wage growth and investment returns are lower. This hypothetical stagflation scenario would result in:
|
| Climate Scenarios |
Climate change can affect the CPP through various channels. The demographic, economic and investment environments can all be affected by climate change in the future. However, there is a lot of uncertainty on the direction and magnitude of these potential impacts, and the risk is evolving constantly. In order to illustrate the potential downside risk, three intentionally adverse hypothetical climate change scenarios were developed based on publicly available information. The scenarios focus on differences in GDP growth rates from different transition pathways. Based on the three hypothetical scenarios:
|
|
Table C Footnotes
|
|
2 Introduction
2.1 Purpose of the report
This is the 31st Actuarial Report on the Canada Pension Plan since the inception of the Canada Pension Plan (CPP or the Plan) in 1966. The valuation date is 31 December 2021. This report has been prepared in compliance with the timing and information requirements of the Canada Pension Plan. Section 113.1 of the Canada Pension Plan provides that the Minister of Finance and ministers of the Crown from the provinces shall review the financial state of the CPP once every three years and may consequently make recommendations to change the benefits or contribution rates, or both. Section 113.1 identifies the factors the ministers consider in their review, including information to be provided by the Chief Actuary.
Since 1 January 2019, the CPP has two components: the base and additional Plans. The CPP consisted only of the base Plan (or base CPP) prior to 2019, and this component continues. The additional Plan (or additional CPP) is the new enhancement to the CPP as of 2019. When not qualified, the term “CPP” or the “Plan” used in this report refers to the entire CPP, that is, to both its components.
An important purpose of the report is to inform contributors and beneficiaries of the current and projected financial states of the base and additional CPP. The report provides information to evaluate the financial sustainability of the base and additional Plans over a long period, assuming that the legislation remains unchanged. Such information facilitates a better understanding of the financial states of the base and additional Plans and the factors that influence costs, and thus contributes to an informed public discussion of issues related to the finances of the two components of the CPP.
The previous triennial report was the 30th Actuarial Report on the Canada Pension Plan as at 31 December 2018, which was tabled in the House of Commons on 10 December 2019.
This 31st CPP Actuarial Report takes into account all amendments to date regarding the CPP statute, with the most recent listed in the following section. This CPP Actuarial Report also takes into account: recent demographic, economic, and investment experience data as described in section B.2 of Appendix B of this report; various forecasts by demographic, economic and investment experts; the continuing and evolving impacts of the COVID-19 pandemic; and the impacts of the escalation of the conflict in Ukraine, which was considered a subsequent event for the purpose of this CPP Actuarial Report, as described in section 2.3.
The report presents projections of its revenues and expenditures for both of its components, the base and additional CPP, over a long period of time. Given the length of the projection period and the number of assumptions required, it is unlikely that actual future experience will develop precisely in accordance with the best-estimate projections.
2.2 Recent Amendments
The Canada Pension Plan was subject to amendments after 31 December 2018 as follows:
- Under the Budget Implementation Act, 2019, No. 1, which received Royal Assent on 21 June 2019, the application for a CPP retirement pension is waived upon reaching age 70, effective 1 January 2020. This amendment is taken into account in this 31st CPP Actuarial Report. It was also taken into account and treated as a subsequent event in the 30th CPP Actuarial Report.Footnote 1
- Under the Budget Implementation Act, 2022, No. 1, which received Royal Assent on 23 June 2022, technical amendments are made regarding eligibility for the base CPP post-retirement disability benefit and determination of the additional CPP drop-in provisions.Footnote 2 The amendments reflect the original intent of the given benefit and drop-in provisions and thus were included in the projections of previous CPP actuarial reports. The amendments are likewise included in the projections of this 31st CPP Actuarial Report. As such, the amendments have no impact on the projections in this report.
2.3 Subsequent Events
The continuing and evolving impacts of the COVID-19 pandemic were exacerbated by the conflict in Ukraine, notably its escalation as of 24 February 2022. This escalation is considered to be a subsequent event for the purpose of this 31st CPP Actuarial Report since it started subsequent to the valuation date but before the date of this report. There is much uncertainty surrounding the evolving conflict and potential impacts on the projected financial state of the CPP, in particular resulting from changing levels of inflation and volatility in the financial markets. This uncertainty was taken into account for the purpose of this 31st CPP Actuarial Report.
There were no other events determined by the Chief Actuary to be subsequent events with material effects on the financial state of the CPP as projected under this 31st CPP Actuarial Report.
2.4 Independent Peer Review Process
As part of its policy of ensuring that it provides sound and relevant actuarial advice to Members of Parliament and to the Canadian population, as was done for previous reports, the Office of the Chief Actuary (OCA) has commissioned an external peer review Footnote 3 of this actuarial report on the CPP.
The external peer review is intended to ensure that the actuarial reports meet high professional standards, and are based on reasonable methods and assumptions. Over the years, peer review recommendations have been carefully considered and many of them implemented.
2.5 Scope of the Report
Section 3 presents a general overview of the methodology used in preparing the actuarial estimates included in this report, which are based on the best-estimate assumptions described in section 4. The results for the base Plan and additional Plan are presented separately in sections 5 and 6, respectively, and include for each component the projections of the revenues, expenditures, and assets over more than the next 75 years. Section 7 provides the reconciliation of the results for the base and additional Plans with those of the 30th CPP Actuarial Report, while section 8 provides the actuarial opinion.
The various appendices provide a summary of the Plan provisions, a description of the data, assumptions and methodology employed, supplemental information on the financing of the CPP, detailed reconciliations of the results with the previous report, the uncertainty of results, and acknowledgements of data providers and staff who contributed to this report.
3 Methodology
The actuarial examination of the CPP involves projections of the revenues and expenditures of both components (base CPP and additional CPP) over a long period of time, so that the future impact of historical and projected trends in demographic, economic and investment factors can be properly assessed. The actuarial estimates in this report are based on the provisions of the Canada Pension Plan as at 31 December 2021,Footnote 4 historical experience data used for the starting point of the projections, and best-estimate assumptions that take into account the subsequent event described in section 2.3.
The revenues of the base and additional Plans include both contributions and investment income. The projection of contributions begins with a projection of the working-age population. This requires assumptions regarding demographic factors such as fertility, migration, and mortality. Total contributory earnings for each component of the Plan are derived by applying labour force participation and job creation rates to the projected population and by projecting future average employment earnings. This requires assumptions about various factors such as wage increases, an earnings distribution, and unemployment rates. Contributions for each of the components of the CPP are obtained by applying the respective component’s contribution rate(s) to the respective contributory earnings. Investment income is projected on the basis of the existing portfolios of assets for the base and additional CPP, the respective projected net cash flows (contributions less expenditures), and the respective assumptions regarding the future asset mix and rates of return on investments net of investment expenses. Since the assumptions regarding the future asset mix differ between the base and additional Plans, the resulting assumptions regarding investment returns differ as well.
Expenditures for each component of the Plan consist of the benefits paid out and operating expenses. Newly emerging benefits are projected by applying assumptions regarding retirement, disability, and death to the populations eligible for benefits, together with the benefit provisions and the earnings histories of participants (actual and projected). The projection of total benefits, which includes the continuation of benefits already in pay at the valuation date, requires further assumptions. Operating expenses, excluding operating expenses relating to professional management of the CPP Fund by the Canada Pension Plan Investment Board (CPPIB), are projected by considering the historical and projected relationship between expenses and total employment earnings, while CPPIB operating expenses are considered in the determination of the rates of return.
The assumptions and results presented in the following sections make it possible to measure the financial states of the base and additional CPP separately in each projection year and to calculate the minimum contribution rates.
For the base Plan, the minimum contribution rate (MCR) is the sum of two types of rates. The first of these is separate from the full funding provision for increased or new benefits, and is referred to as the “steady-state” contribution rate. The second type of rate that makes up the MCR is the full funding rate for increased or new benefits.
For the additional CPP, there are two additional minimum contribution rates (AMCRs), the first additional minimum contribution rate (FAMCR) and the second additional minimum contribution rate (SAMCR). The FAMCR is applicable to contributory earnings below the Year’s Maximum Pensionable Earnings (YMPE) and the SAMCR is applicable to contributory earnings between the YMPE and the Year’s Additional Maximum Pensionable Earnings (YAMPE).
Details of the methodology used to determine the MCR and AMCRs are presented in Appendix C.
A wide variety of factors influence both the current and projected financial states of the components of the CPP. Accordingly, the results shown in this report differ from those shown in previous reports. Likewise, future actuarial examinations will reveal results that differ from the projections included in this report.
4 Best-Estimate Assumptions
4.1 Introduction
The information required by statute, which is presented in sections 5 and 6 of this report, necessitates making numerous assumptions regarding future demographic, economic, and investment trends. The projections included in this report cover a long period of time (over 75 years), and the assumptions are determined by examining historical long-term and short-term trends and applying judgment as to the extent these trends will continue in the future. These assumptions reflect the Chief Actuary’s best judgment and are referred to in this report as the best-estimate assumptions. The assumptions were chosen to be independently reasonable and appropriate in the aggregate, taking into account certain interrelationships between them.
The assumptions were developed taking into account subsequent events, that is, events that became known to the Chief Actuary after the valuation date, but before the report date, that were deemed to have an effect on the financial states of the base or additional CPP as at the valuation date or during the projection period. The continuing and evolving impacts of the COVID-19 pandemic were exacerbated by the conflict in Ukraine, notably its escalation as of 24 February 2022. For the purpose of this 31st CPP Actuarial Report, this escalation, was considered to be a subsequent event with significant impacts on the projected financial state of the CPP. The following assumptions were therefore reviewed in light of this subsequent event: inflation, real wage increases, interest rates as well as expected returns on various asset classes. These assumptions were revised to reflect updated data and forecasts available up to the end of June 2022, as well as continued short-term uncertainty.
All past and recent amendments to the CPP statute are reflected in this CPP Actuarial Report. The most recent amendments are contained in the Budget Implementation Act, 2022, No. 1, which received Royal Assent on 23 June 2022. That Act contains technical amendments regarding eligibility for the base CPP post-retirement disability benefit and determination of the additional CPP drop-in provisions under the CPP statute.Footnote 2 The amendments reflect the original intent of the given benefit and drop-in provisions and thus were included in the projections of previous CPP actuarial reports. The amendments continue to be reflected in the projections of this 31st CPP Actuarial Report and have no impact.
The Chief Actuary held a virtual seminar in September 2021 on the long-term demographic, economic, and investment outlook for Canada to obtain opinions from a wide range of individuals with relevant expertise. Nine experts in the fields of demographics, economics, and investments were invited to present their views. The topics discussed included short-term and long-term perspectives on mortality, immigration, the labour market and the economy, as well as the potential implications of climate change on the macroeconomic and investment outlook.
Among the participants at the seminar were representatives from the OCA, federal departments including Statistics Canada, Employment and Social Development Canada (ESDC), and the Department of Finance, representatives from provincial and territorial governments, as well as representatives from Retraite Québec, the CPPIB, and other organizations. Representatives of the OCA also attended a virtual seminar on the demographic and economic perspectives relating to retirement held by Retraite Québec in October 2021.
In addition to the above mentioned seminars, OCA staff sought expert perspectives on demographic, economic, and investment-related topics by attending various webinars, consulting numerous publications, and consulting with other experts. These expert perspectives were all considered in developing the best-estimate assumptions for this 31st CPP Actuarial Report.
Table 1 presents a summary of the most important assumptions used in this report compared with those used in the previous triennial report. The assumptions are described in more detail in Appendix B of this report.
| Canada | 31st Report (as at 31 December 2021) |
30th Report (as at 31 December 2018) |
||
|---|---|---|---|---|
| Total Fertility Rate | 1.54 (2029+) | 1.62 (2027+) | ||
| Mortality | Statistics Canada Life Tables (CLT 1-year table: 2019) with assumed future improvements |
Statistics Canada Life Tables (CLT 3-year average table: 2014 - 2016) with assumed future improvements |
||
| Canadian Life Expectancy | Males | Females | Males | Females |
|
at birth in 2022
|
86.7 years | 90.0 years | 87.1 years | 90.1 years |
|
at age 65 in 2022
|
21.3 years | 23.8 years | 21.6 years | 24.0 years |
| Net Migration Rate | 0.64% of population (for 2031+) | 0.62% of population (for 2021+) | ||
| Participation Rate (age group 18-69) |
80.0% (2035) | 79.2% (2035) | ||
| Employment Rate (age group 18-69) |
75.3% (2035) | 74.4% (2035) | ||
| Unemployment Rate (age group 18-69) |
5.9% (2027+) | 6.0% (2030+) | ||
| Rate of Increase in Prices | 2.0% (2026+) | 2.0% (2019+) | ||
| Real Wage Increase | 0.9% (2026+) | 1.0% (2025+) | ||
| Real Rate of Return (average 2022-2096) |
Base CPP Assets | 3.7% | 4.0% | |
| Additional CPP Assets | 3.3% | 3.5% | ||
| Retirement Rates for Cohort at Age 60 | Males | 26.0% (2022+) | Males | 27.0% (2021+) |
| Females | 28.0% (2022+) | Females | 29.5% (2021+) | |
| CPP Disability Incidence Rates (per 1,000 eligible) | Males | 2.90 (2026+) | Males | 2.97 (2019+)Table 1 Footnote 1 |
| Females | 3.60 (2026+) | Females | 3.66 (2019+)Table 1 Footnote 1 | |
|
Table 1 footnote
|
||||
4.2 Demographic Assumptions
The population projections start with the Canada and Québec populations on 1 July 2021, to which are applied fertility, migration, and mortality assumptions. The relevant population for the Canada Pension Plan is the population of Canada less that of Québec and is obtained by subtracting the projected results for Québec from those for Canada. The population projections are essential in determining the future number of CPP contributors and beneficiaries.
The age distribution of the population has changed significantly since the inception of the Plan in 1966. The proportion of the Canadian population aged 65 and above has increased from 7.6% in 1966 to 18.5% in 2021, which indicates an aging population. It is assumed that the population aging will continue in the future, albeit to a more modest extent.
4.2.1 Fertility
The first cause of the aging of the Canadian population is the decline in the total fertility rate that has occurred over the last 60 years. The total fertility rate in Canada decreased rapidly from a level of about 4.0 children per woman in the late 1950s to 1.6 by the mid-1980s. The total fertility rate rose slightly in the early 1990s, but then declined to a level of 1.5 by the late 1990s. Canada is one of many industrialized countries that saw their fertility rates increase starting in the 2000s. By 2008, the total fertility rate for Canada reached 1.68. However, in some industrialized countries, including Canada, the total fertility rate has decreased since 2008, which could be largely attributable to the 2008 economic downturn and continuing economic uncertainty. The total fertility rate for Canada stood at 1.47 in 2019, and decreased further to 1.40 in 2020. The significant decrease in 2020 could be due to the high level of uncertainty and much lower immigration caused by the COVID-19 pandemic.
Similar to Canada, the total fertility rate in Québec fell from a high of about 4.0 children per woman in the 1950s; however, the Québec rate fell to a greater degree, reaching 1.4 by the mid-1980s. The Québec rate then recovered somewhat in the early 1990s to over 1.6 and subsequently declined to below 1.5 by the late 1990s. Subsequently, Québec fertility rate increased for certain age groups with the introduction of the Québec Childcare Centres in 1997 and with the introduction of the Québec Parental Insurance Plan in 2006. There was a significant increase in the Québec fertility rate in the 2000s, with the rate reaching 1.74 in 2008. However, similar to Canada’s fertility rate, the fertility rate for Québec has been decreasing in recent years and stood at 1.57 in 2019 and 1.52 in 2020.
The overall decrease in the total fertility rate over the last 60 years occurred as a result of changes in a variety of social, medical, economic and environmental-related factors. Although there have been periods of growth in the total fertility rates in recent decades, it is unlikely that the rates will return to historical levels in the absence of significant societal changes.
In 2021, the Government of Canada announced that it would work with provinces and territories to establish a Canada-Wide Early Learning and Child Care PlanFootnote 5. Consistent with what was experienced in Québec with the introduction of Childcare Centres, the proposed plan is assumed to result in increases in fertility rates for certain age groups following the adoption of the Early Learning and Child Care Plan.
Given the uncertainty surrounding the effect of the COVID-19 pandemic on fertility rates for the year 2020 (the last year of available data at the time this report was prepared), the data for 2020 were excluded from the analysis for purposes of setting the fertility rates for years 2021 and beyond. A 15-year period ending in 2019 of data is used to establish a linear trending model which is also adjusted for the upcoming Canada-Wide Early Learning and Child Care Plan. The assumed age-specific fertility rates lead to an assumed total fertility rate for Canada that will increase from its 2019 level of 1.47 children per woman to an ultimate level of 1.54 in 2029. The assumed age-specific fertility rates for Québec lead to a total fertility rate for the province that will decrease from its 2019 level of 1.57 to an ultimate level of 1.55 in 2029.
4.2.2 Mortality
Another element that has contributed to the aging of the population is the significant reduction in the age-specific mortality rates. This can be measured by the increase in life expectancy at age 65, which directly affects how long retirement benefits will be paid to beneficiaries. Male life expectancy (without future mortality improvements, i.e. reductions in mortality) at age 65 increased by 44% between 1966 and 2019, rising from 13.6 to 19.6 years. For women, life expectancy at age 65 (without future improvements) increased by 31%, from 16.9 to 22.1 years over the same period. Although the overall gains in life expectancy at age 65 since 1966 are similar for males and females (between 5 and 6 years), about 70% of the increase occurred after 1990 for males, while for females, only about 50% of the increase occurred in that period.
Future mortality rates are determined by applying assumed mortality improvement rates to Statistics Canada’s 2019 life tables.
Statistics Canada’s 2020 life tables published in January 2022 were used to derive the annual mortality improvement rates for 2020. These tables reflect significant rate increases related to COVID-19 deaths. In 2020, life expectancy at birth (without future mortality improvements) stood at 79.5 for males and 84.0 for females, a decrease from 2019 of 0.7 and 0.4 for males and females respectively.
The 15-year average mortality improvement rates by age and sex for the period ending in 2019 are the starting point for the projected annual mortality improvement rates from 2021 onward. These projections disregard the impact of the COVID-19 pandemic. Mortality improvements are expected to continue in the future, but at a slower pace than most recently observed over the 15-year period ending in 2019. Further, it is assumed that ultimately, mortality improvement rates will be the same for males and females. The assumed mortality improvement rates are based on the analysis of the Canadian experience over the period 1921 to 2019 and of the possible drivers of future mortality improvements.
The projected mortality improvement rates are assumed to gradually reduce to their ultimate levels in 2039, which are for both sexes 0.8% per year for ages below 90, 0.5% for ages 90 to 94, and 0.2% for ages 95 and above.
In the short term, mortality rates were also adjusted to reflect assumed additional increases in mortality rates due to the COVID-19 pandemic. These assumed increases are related to two factors: i) direct increases in mortality due to COVID-19 deaths, affecting older age groups more and ii) indirect increases in mortality due to the impact of the pandemic on the opioids crisis, affecting mostly men in the age group 25 to 49Footnote 6.
For the direct increases in mortality due to COVID-19 deaths in 2021, mortality rates were adjusted using data on the number of COVID-19 deaths from both Health Canada and Statistics Canada. The pandemic is assumed to have a residual effect on mortality in 2022, followed by an assumed full recovery and reversion to the projected unadjusted mortality rates for years 2023 and onward. For the indirect increases related to the opioid crisis, projected mortality rates for affected age groups are assumed to revert back to normal levels, leading to a period of high growth in mortality improvement rates.
The resulting adjustments lead to mortality rates for the full population that are 5.5% higher on average in 2021 and 2.0% higher on average in 2022 than the rates developed using the information up to and including 2019.
Considering the above, life expectancy (with future improvements) at age 65 in 2022 is projected to be 21.3 years for males, and 23.8 years for females.
To project CPP benefits, the mortality rates for CPP retirement, survivor, and disability beneficiaries reflect actual experience for those segments of the population. Specific mortality experience for CPP beneficiaries is discussed further in Appendix B of this report.
4.2.3 Net Migration
Net migration corresponds to the number of immigrants less the net number of emigrants, plus the net increase in the number of non-permanent residents.
The components of net migration were analyzed separately by looking at trends in the historical data in order to select the assumptions regarding the short-term and ultimate rates. Over the past two years, net migration for Canada decreased significantly due to various COVID-19 safety measures such as border closures and flight cancellations. As such, data for the years 2020 and 2021 were excluded from the analysis. Consideration was given to the federal government’s short-term immigration targets and to long-term perspectives of various experts regarding future immigration levels, net increases in the number of non-permanent residents, and the impacts of the COVID-19 pandemic.
The net migration rate for Canada is projected to increase from its current (year ending June 2021) level of 0.41% of the population to 1.04% in 2022, 1.05% in 2023, 0.93% in 2024 and gradually reach an ultimate level of 0.64% of the population for the year 2031 and thereafter. The ultimate net migration rate of 0.64% corresponds to the average experience observed over the 10 years ending in 2019, excluding the net increase in non-permanent residents during that period. The assumed short-term net migration rate is higher than the ultimate rate of 0.64% due to the federal government’s short-term targets and the assumed gradual decrease to zero for the net increase in the number of non-permanent residents from 2022 through 2026.
For the Québec population, the 2031 ultimate net migration rate assumption corresponds to the 10-year average historical experience ending in 2019 for the province of 0.43%, excluding the net increase in non-permanents residents.
4.2.4 Population Projections
Table 2 shows the population of Canada less Québec for three age groups (0-19, 20-64 and 65 and over) throughout the projection period. The ratio of the number of people aged 20-64 to those aged 65 and over is a measure that approximates the ratio of the number of working-age people to retirees. Because of the aging population, this ratio is projected to drop from an estimated value of 3.3 in 2022 to 1.9 by 2070 and remain at that level thereafter.
| Year | Total | Age 0-19 |
Age 20-64 |
Age 65 and Over |
Ratio of 20-64 to 65 and Over |
|---|---|---|---|---|---|
| 2022 | 30,074 | 6,335 | 18,203 | 5,536 | 3.3 |
| 2023 | 30,519 | 6,429 | 18,344 | 5,746 | 3.2 |
| 2024 | 30,937 | 6,510 | 18,471 | 5,957 | 3.1 |
| 2025 | 31,333 | 6,581 | 18,579 | 6,173 | 3.0 |
| 2026 | 31,708 | 6,644 | 18,674 | 6,390 | 2.9 |
| 2027 | 32,073 | 6,705 | 18,768 | 6,600 | 2.8 |
| 2028 | 32,426 | 6,759 | 18,851 | 6,815 | 2.8 |
| 2029 | 32,764 | 6,814 | 18,929 | 7,022 | 2.7 |
| 2030 | 33,087 | 6,866 | 19,012 | 7,209 | 2.6 |
| 2035 | 34,557 | 7,105 | 19,580 | 7,873 | 2.5 |
| 2040 | 35,854 | 7,328 | 20,191 | 8,335 | 2.4 |
| 2045 | 37,008 | 7,474 | 20,836 | 8,699 | 2.4 |
| 2050 | 38,078 | 7,494 | 21,402 | 9,182 | 2.3 |
| 2055 | 39,128 | 7,548 | 21,797 | 9,783 | 2.2 |
| 2060 | 40,229 | 7,706 | 22,020 | 10,504 | 2.1 |
| 2065 | 41,398 | 7,932 | 22,211 | 11,255 | 2.0 |
| 2070 | 42,581 | 8,167 | 22,665 | 11,750 | 1.9 |
| 2080 | 44,799 | 8,531 | 23,763 | 12,505 | 1.9 |
| 2090 | 46,894 | 8,829 | 25,021 | 13,045 | 1.9 |
| 2100 | 49,228 | 9,267 | 25,996 | 13,966 | 1.9 |
4.3 Economic and Investment Assumptions
The main economic assumptions for the CPP are regarding: labour force participation rates, job creation rates, unemployment rates, the rate of increase in prices, and real increases in average employment earnings. For asset projections, further assumptions on real rates of return on invested assets are required.
One of the key elements underlying the best-estimate economic assumptions relates to the continued trend toward longer working lives. Older workers are expected to exit the workforce at a later age, which could alleviate the impact of the aging of the population on future labour force growth. However, despite the expected later exit ages, labour force growth is projected to weaken as the working-age population expands at a slower pace and baby boomers exit the labour force.
4.3.1 Labour Force
Employment levels vary with the rate of unemployment, and reflect trends in increased workforce participation by women, longer periods of formal education among young adults, changes in the age structure of the working-age population, as well as changing retirement patterns of older workers.
As the population ages, older age groups with lower labour force participation increase in size. As a result, the labour force participation rate for Canadians aged 15 and over is expected to decline from an estimated value of 65.1% in 2022 to 64.1% in 2035. A more useful measure of the working-age population is the participation rate of those aged 18 to 69, which is expected to increase from an estimated 76.7% in 2022 to 80.0% in 2035. The increase in the participation rate for those aged 18 to 69 reflects several trends.
For example, it is assumed that female participation rates will continue to grow at a faster pace than male participation rates thereby continuing to reduce the gap in participation rates between males and females, albeit at a slower pace than in the past. A part of this reduction comes from the expected impact on the female labour force participation due to the Early Learning and Child Care Plan initiative announced by the federal Government in 2021.
It is also assumed that participation rates for age groups 55 and over for both genders will increase as a result of an expected continued trend toward longer working lives.
Despite the assumed future increase in participation rates of women and older workers, it is still expected that there will be continued labour shortages in the future as the working-age population expands at a slower pace and as baby boomers continue to retire and exit the labour force. The participation rates for all age groups are therefore expected to increase due to the attractive employment opportunities resulting from labour shortages.
Overall, the male participation rate of those aged 18 to 69 is expected to be 80.8% in 2022 and to increase to 83.2% in 2035, while the female participation rate for the same age group is expected to be 72.6% in 2022 and to increase to 76.8% in 2035. As such, the difference between male and female participation rates for the age group 18 to 69 is projected to be 8.2 percentage points in 2022 and decrease to 6.4 percentage points by 2035. Thereafter, the gap between males and females in the age group 18 to 69 is projected to vary between 6.3 and 6.4 percentage points.
The job creation rate (i.e. the change in the number of persons employed) in Canada was on average 1.5% from 1976 to 2021 based on available employment data, and it is assumed that the rate will be 2.9% in 2022 as the labour market recovers from the COVID-19 pandemic. The job creation rate assumption is determined on the basis of expected moderate economic growth and an unemployment rate for Canada, ages 15 and over, that is expected to decrease from 7.5% in 2021 to 6.0% in 2022, 5.7% in 2023 and then increase to reach an ultimate level of 6.1% by 2027. The assumed job creation rate for Canada, ages 15 and over, is on average about 0.8% from 2024 to 2027, which is slightly lower than the labour force growth rate. It is assumed that, starting in 2027, the job creation rate will follow the labour force growth rate, with both averaging 0.8% per year between 2027 and 2035, and 0.4% per year thereafter. The aging of the population is the main reason behind the expected slower long-term growth in the labour force and job creation rate.
4.3.2 Price Increases
On December 13, 2021, the Bank of Canada and the federal Government renewed their commitment to keep inflation between 1% and 3% with a target at the mid-point of 2% until the end of 2026. They further noted that the Bank of Canada will use the flexibility of the 1% to 3% range to actively seek the maximum sustainable level of employment to an extent that is consistent with keeping medium-term inflation expectations at 2%.
Despite the mid-point target of 2%, price increases (inflation), as measured by changes in the Consumer Price Index (CPI), tend to fluctuate from year to year. The COVID-19 pandemic had an impact on the CPI. In 2020, the CPI rose by only 0.7% as a result of a decline in consumer spending stemming from various pandemic-related measures and restrictions. However, as the pandemic evolved and restrictions were lifted, consumer demand increased and supply issues arose. As a result, the increase in CPI was 3.4% in 2021, the fastest pace since 1991. The uncertainty surrounding high inflation due to the demand and supply shocks caused by the pandemic has been exacerbated by the escalation of the conflict in Ukraine.
This report considers the escalation of the conflict in Ukraine as a subsequent event. It is therefore assumed that inflation will be higher than the 2% target up until 2025. Increases in prices are assumed to be 6.9% in 2022, 3.0% in 2023, 2.5% in 2024, 2.25% in 2025, and 2.0% for 2026 and thereafter. These assumed price increases are based on short-term forecasts from various economistsFootnote 7 as well as on the expectation that the Bank of Canada and federal Government will continue to renew the inflation target at 2.0% and that the Bank of Canada will be successful in keeping inflation at its mid-point target in the long term.
4.3.3 Real Wage Increases
Wage increases affect the financial state of the CPP in two ways. In the short term, an increase in the average wage translates into higher contribution income, with little immediate impact on benefits. Over the long term, higher average wages produce higher benefits. The difference between nominal wage increases and inflation represents increases in the real wage, which is also referred to in this report as the real wage increase.
Two wage measures are used in this report: the average annual earnings (AAE) and the average weekly earnings (AWE). The assumed increase in AAE is used to project the total employment earnings of CPP contributors, while the assumed increase in the AWE is used to project the increase in the YMPE from one year to the next. The average difference between both measures has been relatively small over the period 1966 to 2019, and the two measures are assumed to grow at the same pace over the long term. However, they tend to grow at different paces in times of economic expansions and slowdowns.
Based on information up to the end of June 2022, the real AAE is projected to decrease by 2.4% in 2022 and by 0.1% in 2023. Real AAE are then projected to increase, with an ultimate real increase of 0.9% reached in 2026. The negative real AAE growth in the early years of the projection is a result of assumed wage dynamics in periods of high inflation stemming from the COVID-19 pandemic and exarcerbated by the escalation of the conflict in Ukraine, which is considered a subsequent event. The ultimate real AAE increase assumption is developed taking into account historical trends, labour productivity, labour shortages, and other contributing factors. The ultimate real AAE increase assumption combined with the ultimate price increase assumption results in an assumed nominal annual increase of 2.9% in 2026 and thereafter.
Real AWE are projected to decrease by 3.3% in 2022 and by 0.1% in 2023. In the following years, and consistent with the historical long-term relationship between the real change in the AWE and AAE, AWE is projected to increase, with an ultimate real increase of 0.9% reached in 2026, equal to the same ultimate real increase in AAE that year.
4.3.4 Real Rates of Return on Investments
Real rates of return on investments are the excess of the nominal rates of return over price increases and are required for the projection of revenue arising from investment income. A real rate of return is assumed for each year in the projection period and for each of the main asset categories in which the base and additional CPP assets are invested. The assumed long-term real rates of return on base and additional CPP assets take into account the assumed asset mixes of investments of each CPP component. The real rates of return on investments are net of all investment expenses, including the CPPIB operating expenses.
The escalation of the conflict in Ukraine has had significant impacts on financial markets. In an effort to control rising inflation exacerbated by this escalation, the Bank of Canada has increased its benchmark interest rate by 225 basis points so far in 2022 (as of July 13, 2022), which has impacted returns on fixed income investments. In addition, stock market indices in the first half of 2022 have decreased significantly across geographies and sectors.
This report considers the escalation of the conflict in Ukraine a subsequent event, and the assumed rates of return have been adjusted accordingly. More specifically, for 2022, the assumed nominal return is -9.0% for the base CPP and -7.7% for the additional CPP. In real terms, this translates into 2022 assumed returns of -15.9% and -14.6% for the base CPP and additional CPP respectively. These returns reflect actual CPPIB results up to 30 June 2022, and continued uncertainty for the remainder of the year. In addition, fixed income returns beyond 2022 are based on a revised interest rate path that reflects the significant rate hikes that occurred in the first half of 2022.
For the period 2023 to 2032, the assumed annual real rates of return are lower than the assumed ultimate real rates of return in 2033 due to lower expected bond returns between 2023 and 2033, and high inflation in the first few years. The average real rates of return for the 5-year period 2023-2027 for the base and additional CPP are respectively 3.56% and 2.70%, while the average real rates of return for the 10-year period 2023-2032 for the base and additional CPP are respectively 3.73% and 2.98%.
The ultimate real rates of return for the base and additional CPP are respectively 4.0% and 3.6%. The 75-year average real rate of return on the assets over the 2022-2096 projection period is assumed to be 3.69% for the base CPP and 3.27% for the additional CPP.
Table 3 summarizes the main economic assumptions over the projection period.
| Year | Real Increase Average Annual Earnings | Real Increase Average Weekly Earnings (YMPE) | Price Increase | Labour Force (Canada, 15+) | Real Rates of Return on Investments | ||||
|---|---|---|---|---|---|---|---|---|---|
| Participation Rate | Job Creation Rate | Unemployment Rate | Labour Force Annual Increase | Base CPP | Additional CPP | ||||
| 2022 | (2.4) | (3.3) | 6.9 | 65.1 | 2.9 | 6.0 | 1.3 | (15.9) | (14.6) |
| 2023 | (0.1) | (0.1) | 3.0 | 65.0 | 1.5 | 5.7 | 1.1 | 2.9 | 1.9 |
| 2024 | 0.4 | 0.4 | 2.5 | 64.8 | 0.9 | 5.8 | 1.0 | 3.4 | 2.5 |
| 2025 | 0.6 | 0.6 | 2.3 | 64.6 | 0.8 | 5.9 | 0.9 | 3.6 | 2.8 |
| 2026 | 0.9 | 0.9 | 2.0 | 64.5 | 0.8 | 6.0 | 0.9 | 3.9 | 3.1 |
| 2027 | 0.9 | 0.9 | 2.0 | 64.4 | 0.8 | 6.1 | 0.9 | 3.9 | 3.2 |
| 2028 | 0.9 | 0.9 | 2.0 | 64.3 | 0.8 | 6.1 | 0.8 | 3.9 | 3.2 |
| 2029 | 0.9 | 0.9 | 2.0 | 64.2 | 0.8 | 6.1 | 0.8 | 3.9 | 3.2 |
| 2030 | 0.9 | 0.9 | 2.0 | 64.1 | 0.7 | 6.1 | 0.7 | 3.9 | 3.3 |
| 2035 | 0.9 | 0.9 | 2.0 | 64.1 | 0.7 | 6.1 | 0.7 | 4.0 | 3.6 |
| 2040 | 0.9 | 0.9 | 2.0 | 63.7 | 0.5 | 6.1 | 0.5 | 4.0 | 3.6 |
| 2045 | 0.9 | 0.9 | 2.0 | 63.2 | 0.5 | 6.1 | 0.5 | 4.0 | 3.6 |
| 2050 | 0.9 | 0.9 | 2.0 | 62.8 | 0.4 | 6.1 | 0.4 | 4.0 | 3.6 |
| 2055 | 0.9 | 0.9 | 2.0 | 62.2 | 0.2 | 6.1 | 0.2 | 4.0 | 3.6 |
| 2060 | 0.9 | 0.9 | 2.0 | 61.5 | 0.2 | 6.1 | 0.2 | 4.0 | 3.6 |
| 2065 | 0.9 | 0.9 | 2.0 | 60.8 | 0.3 | 6.1 | 0.3 | 4.0 | 3.6 |
| 2070 | 0.9 | 0.9 | 2.0 | 60.4 | 0.4 | 6.1 | 0.4 | 4.0 | 3.6 |
| 2080 | 0.9 | 0.9 | 2.0 | 60.1 | 0.4 | 6.1 | 0.4 | 4.0 | 3.6 |
| 2090 | 0.9 | 0.9 | 2.0 | 60.1 | 0.4 | 6.1 | 0.4 | 4.0 | 3.6 |
| 2100 | 0.9 | 0.9 | 2.0 | 59.7 | 0.4 | 6.1 | 0.4 | 4.0 | 3.6 |
4.4 Other Assumptions
This report is based on several other key assumptions, such as retirement benefit take-up rates and disability incidence rates.
4.4.1 Retirement Benefit Take-up Rates
The retirement benefit take-up rates are determined on a cohort basis. The sex-distinct retirement benefit take-up rate for any given age and year from age 60 and above corresponds to the number of emerging (new) retirement beneficiaries divided by the total number of people eligible for retirement benefits for the given sex, age, and year.
The unreduced pension age under the Canada Pension Plan is 65. In 1987, the flexible retirement age provision became effective such that a person can choose to receive a reduced retirement pension as early as age 60 (as well as an increased pension after age 65). This provision had the overall effect of lowering the average age at pension take-up to below age 65. In 1986, the average age at pension take-up was 65.2, compared to an average age of 62.7 over the decade ending in 2019.
Since 2012, the age 60 retirement benefit take-up rates have continually decreased. For cohorts reaching age 60 in 2019 (before the pandemic), the retirement take-up rates were 27.8% for males and 30.3% for females. For cohorts reaching age 60 in 2021, the retirement take-up rates were 23.3% for males and 25.0% for females. The 2021 take-up rate for males is the lowest one since 1989, while the 2021 take-up rate for females is a record low since the flexible retirement age provision was first introduced in 1987. At this time, it is not clear to what extent the COVID-19 pandemic contributed to the significant reduction in retirement take-up rates at age 60 during the years 2020 and 2021. The decreasing trend will be monitored for the next CPP valuation.
The assumption reflects the pre-pandemic trend in retirement take-up rates at age 60, while giving partial credibility to the years 2020 and 2021. For cohorts reaching age 60 in 2022 and thereafter, the retirement benefit take-up rates are assumed to be 26.0% for males and 28.0% for females. The retirement take-up rates at age 65 are derived such that the sum of the retirement rates for each cohort is 100%. The resulting rates at age 65 are determined to be 42.5% for males and 43.8% for females in 2031 and thereafter. These rates result in projected average ages at retirement pension take-up in 2031 of 63.6 for males and 63.4 for females. The same retirement take-up rates for the base CPP apply to the additional CPP.
4.4.2 Disability Incidence Rates - Disability Pension and Post-Retirement Disability Benefit
The sex-distinct disability incidence rate in respect of a disability benefit – either the disability pension or post-retirement disability benefit – at any given age is the number of new disability beneficiaries divided by the total number of people eligible for the disability benefit at that age. The disability incidence rates for the base Plan in respect of the disability pension are the same as for the additional Plan. The disability incidence rates in respect of the post-retirement disability benefit apply only to the base Plan, since the benefit pertains only to the base Plan.
The assumptions for the disability incidence rates in respect of the disability pension recognize that current disability incidence rates are significantly below the levels experienced from the mid-1970s to mid-1990s for males and during the early 1980s and early to mid-1990s for females. With the exception of more recent years (2019-2021), the incidence rates for both sexes have been relatively stable since the late 1990s as a result of administrative changes made to the disability program. Volatility was observed in the incidence rates over the period 2019 to 2021, which is attributable to administrative and COVID-19 related factors. Such volatility is not expected to continue, and as such, the years 2019 to 2021 were not considered in developing the ultimate assumptions for the disability incidence rates.
Based on the above and experience over the period 2007 to 2018, incidence rates in respect of the disability pension are expected to increase gradually from 2021 to 2026 and are then assumed to remain constant thereafter at values of 2.90 per thousand eligible for males and 3.60 per thousand eligible for females.
For the base CPP post-retirement disability benefit, which came into effect in 2019 and applies only to early retirement beneficiaries (before age 65) who become disabled, the incidence rates by age and sex were derived based on post-retirement disability benefit data for years 2019 and 2020 along with historical records of earnings data of early retirement beneficiaries. It is projected that, in 2026, the overall disability incidence rates in respect of the post-retirement disability benefit for early retirement beneficiaries will be 10.08 per 1,000 eligible males and 9.06 per 1,000 eligible females . As more experience data regarding post-retirement disability benefits become available, the assumptions for the incidence rates will be revised accordingly for future CPP actuarial reports.
5 Results - Base CPP
5.1 Overview
The key observations and findings of the actuarial projections of the financial state of the base CPP presented in this report are as follows.
- With the legislated contribution rate of 9.9%, contributions to the base CPP are projected to be more than sufficient to cover the expenditures over the period 2022 to 2025. Thereafter, a portion of investment income is required to make up the difference between contributions and expenditures. In 2030, about 9% of investment income will be required to pay for expenditures. This is expected to gradually increase to about 16% by 2050 and about 34% by 2070, after which it is expected to be fairly stable.
- With the legislated contribution rate of 9.9%, total assets of the base Plan are expected to decrease in 2022 as a result of the current financial markets environment. Assets are then expected to increase over the projection period, with more significant growth in the first few years. Total assets are expected to decrease from $544 billion at the end of 2021 to $499 billion at the end of 2022 and then grow to $791 billion by the end of 2030. Assets are then projected to reach $2.2 trillion by 2050 and $17 trillion by 2100. The ratio of assets to the following year’s expenditures is projected to increase slightly from 8.1 to 8.4 between 2022 and 2030 and to continue to grow thereafter to values of 10.7 in 2050 and 13.2 in 2100.
- With the legislated contribution rate of 9.9%, investment income of the base Plan, which is expected to represent 32% of revenues (i.e. contributions and investment income) in 2023, is further projected to represent 34% of revenues in 2030, 42% of revenues in 2050 and 51% of revenues by 2100. This illustrates the importance of investment income as a source of revenues for the base Plan.
- The minimum contribution rate (MCR) to sustain the base Plan is 9.56% of contributory earnings for years 2025 to 2033 and 9.54% for the year 2034 and thereafter. The legislated contribution rate of 9.9% applies to the first three years after the valuation year, that is, to the current triennial review period of 2022-2024.
- The MCR consists of two separate components. First, the steady-state contribution rate, which is the lowest rate that results in the projected ratio of the assets to the following year’s expenditures of the base Plan remaining generally constant over the long term, before consideration of any full funding of increased or new benefits, is 9.53% for the year 2025 and thereafter. The second component is the full funding rate that is required to fully fund the amendments made to the Canada Pension Plan under the Budget Implementation Act, 2018, No. 1. The full funding rate is 0.03% for years 2025 to 2033 and 0.01% for the year 2034 and thereafter.
- Under the MCR, the ratio of assets to the following year’s expenditures is projected to increase slightly from 8.1 in 2025 to 8.4 in 2034 and to be the same fifty years later in 2084.
- The MCR determined for this report is lower than the MCR of 9.72% for years 2034 and thereafter determined under the 30th CPP Actuarial Report. Experience over the period 2019 to 2021 was better than expected overall, leading to a decrease in the MCR. The main contributing factor for this was better than expected investment experience, which lowers the MCR by 0.35. This decrease is partially offset by changes in real rate of return assumptions for 2022. The net result of all changes since the 30th CPP Actuarial Report is a decrease in the MCR of 0.18 percentage points for the year 2034 and thereafter.
- Overall, changes to the assumptions to reflect the subsequent event resulted in an increase in the MCR of 0.31. A large portion of this increase is due to reductions in the 2022 assumed nominal rate of return. The reduction in MCR due to 2019-2021 investment experience is therefore partially offset by lower assumed returns in 2022.
- Although the pay-as-you-go rate is expected to increase over time from 9.1% in 2022 to 13.3% by 2100 due to the retirement of the baby boom generation and the projected continued aging of the population, the legislated contribution rate of 9.9% is sufficient to finance the base Plan over the long term. The pay-as-you-go rate is the contribution rate that would need to be paid if there were no assets.
- The number of contributors to the CPP is expected to grow from 15.2 million in 2022 to 19.3 million in 2050 and 24.0 million by 2100. Under the legislated contribution rate of 9.9%, base CPP contributions are expected to increase from $61 billion in 2022 to $177 billion in 2050 and $929 billion by 2100.
- The number of base CPP retirement beneficiaries is expected to increase from 6.0 million in 2022 to 9.9 million in 2050 and 15.3 million by 2100.
- Total expenditures of the base Plan are expected to grow rapidly from approximately $56 billion in 2022 to $89 billion in 2030. Thereafter, total expenditures are projected to grow at a slower pace, reaching $197 billion in 2050 and $1.2 trillion by 2100.
5.2 Contributions
Projected contributions are the product of the contribution rate, the number of contributors, and the average contributory earnings. The contribution rate for the base CPP is set by law and is 9.9%. As of 1 January 2019, all contributors to the base CPP also contribute to the additional CPP.
Table 4 presents the projected number of CPP contributors, including CPP retirement beneficiaries who are working (i.e. “working beneficiaries”), their base CPP contributory earnings and contributions. The number of contributors who are not working beneficiaries is directly linked to the assumed labour force participation rates applied to the projected working-age population and the job creation rates. The number of working beneficiaries who are contributors is derived from the number of retirement beneficiaries in pay. Hence, the demographic, economic, and retirement-related assumptions have a great influence on the expected level of contributions. In this report, the number of CPP contributors is expected to increase continuously throughout the projection period, but at a generally decreasing pace, from an estimated 15.2 million in 2022 to 16.7 million in 2030, 19.3 million in 2050, and 24.0 million by 2100. The future increase in the number of contributors is limited due to the projected lower growth in the working-age population and labour force.
The growth in base CPP contributory earnings, which are derived by subtracting the Year’s Basic Exemption (YBE) from pensionable earnings (up to the YMPE) is linked to the growth in average employment earnings through the assumption regarding annual increases in wages and is affected by the freeze on the YBE since 1998.
Contributions to the base CPP are expected to increase from an estimated $61 billion in 2022 to $86 billion in 2030, $177 billion in 2050 and to continue increasing thereafter, reaching $929 billion in 2100 as shown in Table 4. The projected YMPE is also shown, which is assumed to increase according to the increases in the average weekly earnings assumption. The YMPE for 2023 reflects actual data up to April 2022. The YMPE is projected to increase from $64,900 in 2022 to $82,200 in 2030, $145,600 in 2050, and $608,200 by 2100.
Since the legislated contribution rate is constant at 9.9% for the year 2019 and thereafter, contributions to the base CPP increase at the same rate as total contributory earnings over the projection period.
| Year | Contribution Rate (%) | YMPE ($) | Number of Contributors (thousands) | Contributory Earnings ($ million) | Contributions ($ million) |
|---|---|---|---|---|---|
| 2022 | 9.9 | 64,900 | 15,235 | 616,668 | 61,050 |
| 2023 | 9.9 | 66,900 | 15,534 | 648,785 | 64,230 |
| 2024 | 9.9 | 69,200 | 15,751 | 680,189 | 67,339 |
| 2025 | 9.9 | 71,200 | 15,959 | 710,485 | 70,338 |
| 2026 | 9.9 | 73,300 | 16,114 | 739,632 | 73,224 |
| 2027 | 9.9 | 75,400 | 16,264 | 769,230 | 76,154 |
| 2028 | 9.9 | 77,600 | 16,419 | 800,229 | 79,223 |
| 2029 | 9.9 | 79,900 | 16,566 | 832,186 | 82,386 |
| 2030 | 9.9 | 82,200 | 16,708 | 864,552 | 85,591 |
| 2035 | 9.9 | 94,800 | 17,464 | 1,047,401 | 103,693 |
| 2040 | 9.9 | 109,400 | 18,057 | 1,254,280 | 124,174 |
| 2045 | 9.9 | 126,200 | 18,686 | 1,499,428 | 148,443 |
| 2050 | 9.9 | 145,600 | 19,263 | 1,784,712 | 176,687 |
| 2055 | 9.9 | 168,000 | 19,687 | 2,108,096 | 208,701 |
| 2060 | 9.9 | 193,800 | 19,992 | 2,474,655 | 244,991 |
| 2065 | 9.9 | 223,600 | 20,289 | 2,903,032 | 287,400 |
| 2070 | 9.9 | 258,000 | 20,699 | 3,421,988 | 338,777 |
| 2080 | 9.9 | 343,300 | 21,805 | 4,803,930 | 475,589 |
| 2090 | 9.9 | 457,000 | 22,975 | 6,744,599 | 667,715 |
| 2100 | 9.9 | 608,200 | 23,973 | 9,379,076 | 928,529 |
5.3 Expenditures
The projected number of base CPP beneficiaries by type of benefit is given in Table 5, while Table 6 presents information for male and female beneficiaries separately. The number of retirement, disability, and survivor beneficiaries increases throughout the projection period. In particular, the number of retirement beneficiaries is expected to increase from an estimated 6.0 million in 2022 to 7.7 million by 2030 or by 27% due to the aging of the population and retirement of the baby boomers.
By 2050, the number of retirement beneficiaries is projected to be 9.9 million and to then further increase to 15.3 million by 2100. Female retirement beneficiaries continue to outnumber their male counterparts, and by 2050 there is projected to be 793 thousand or 17% more female than male retirement beneficiaries. By 2100, the number of female retirement beneficiaries is projected to exceed the number of male beneficiaries by 1.1 million or 15%. Over the projection period, the number of disability and survivor beneficiaries is also projected to increase but at a slower average pace than for retirement beneficiaries.
| Year | Retirement Table 5 Footnote 2, Table 5 Footnote 3, Table 5 Footnote 4, Table 5 Footnote 5 | Disability Table 5 Footnote 4, Table 5 Footnote 6 | Survivor Table 5 Footnote 5, Table 5 Footnote 6 | Children | Death Table 5 Footnote 7 |
|---|---|---|---|---|---|
| 2022 | 6,025 | 365 | 1,353 | 221 | 176 |
| 2023 | 6,230 | 363 | 1,377 | 224 | 178 |
| 2024 | 6,444 | 365 | 1,403 | 228 | 184 |
| 2025 | 6,671 | 370 | 1,430 | 234 | 189 |
| 2026 | 6,893 | 375 | 1,458 | 241 | 194 |
| 2027 | 7,093 | 380 | 1,486 | 248 | 200 |
| 2028 | 7,288 | 384 | 1,515 | 254 | 205 |
| 2029 | 7,476 | 388 | 1,545 | 262 | 212 |
| 2030 | 7,651 | 393 | 1,575 | 269 | 218 |
| 2035 | 8,334 | 429 | 1,729 | 301 | 251 |
| 2040 | 8,834 | 476 | 1,874 | 335 | 285 |
| 2045 | 9,300 | 526 | 1,991 | 359 | 312 |
| 2050 | 9,869 | 562 | 2,070 | 368 | 332 |
| 2055 | 10,564 | 583 | 2,116 | 366 | 344 |
| 2060 | 11,353 | 586 | 2,148 | 362 | 350 |
| 2065 | 12,088 | 580 | 2,191 | 363 | 358 |
| 2070 | 12,661 | 594 | 2,261 | 369 | 373 |
| 2080 | 13,551 | 633 | 2,450 | 386 | 418 |
| 2090 | 14,266 | 685 | 2,554 | 394 | 447 |
| 2100 | 15,260 | 709 | 2,545 | 402 | 450 |
|
Table 5 Footnotes
|
|||||
| Year | Males | Females | ||||||
|---|---|---|---|---|---|---|---|---|
| Retirement Table 6 Footnote 2, Table 6 Footnote 3, Table 6 Footnote 4, Table 6 Footnote 5 | Disability Table 6 Footnote 4, Table 6 Footnote 6 | Survivor Table 6 Footnote 5, Table 6 Footnote 6 | Death Table 6 Footnote 7 | Retirement Table 6 Footnote 2, Table 6 Footnote 3, Table 6 Footnote 4, Table 6 Footnote 5 | Disability Table 6 Footnote 4, Table 6 Footnote 6 | Survivor Table 6 Footnote 5, Table 6 Footnote 6 | Death Table 6 Footnote 7 | |
| 2022 | 2,889 | 163 | 278 | 104 | 3,136 | 202 | 1,075 | 73 |
| 2023 | 2,982 | 161 | 287 | 104 | 3,248 | 201 | 1,090 | 74 |
| 2024 | 3,079 | 162 | 297 | 107 | 3,365 | 203 | 1,107 | 77 |
| 2025 | 3,182 | 164 | 306 | 109 | 3,488 | 207 | 1,124 | 80 |
| 2026 | 3,283 | 166 | 315 | 112 | 3,611 | 210 | 1,142 | 82 |
| 2027 | 3,372 | 167 | 325 | 114 | 3,721 | 213 | 1,161 | 85 |
| 2028 | 3,459 | 168 | 334 | 117 | 3,829 | 215 | 1,181 | 89 |
| 2029 | 3,542 | 170 | 344 | 120 | 3,934 | 219 | 1,201 | 92 |
| 2030 | 3,619 | 171 | 353 | 123 | 4,033 | 221 | 1,222 | 95 |
| 2035 | 3,904 | 186 | 396 | 138 | 4,430 | 244 | 1,333 | 113 |
| 2040 | 4,097 | 205 | 430 | 152 | 4,738 | 271 | 1,444 | 132 |
| 2045 | 4,281 | 227 | 453 | 164 | 5,019 | 299 | 1,537 | 149 |
| 2050 | 4,538 | 243 | 466 | 171 | 5,331 | 319 | 1,604 | 161 |
| 2055 | 4,878 | 252 | 473 | 176 | 5,686 | 331 | 1,643 | 168 |
| 2060 | 5,279 | 252 | 482 | 178 | 6,074 | 334 | 1,666 | 172 |
| 2065 | 5,646 | 247 | 495 | 183 | 6,442 | 333 | 1,695 | 175 |
| 2070 | 5,911 | 253 | 512 | 191 | 6,750 | 341 | 1,749 | 182 |
| 2080 | 6,296 | 270 | 538 | 214 | 7,255 | 363 | 1,912 | 204 |
| 2090 | 6,610 | 293 | 540 | 227 | 7,655 | 392 | 2,014 | 220 |
| 2100 | 7,090 | 303 | 536 | 227 | 8,170 | 406 | 2,009 | 223 |
|
Table 6 Footnotes
|
||||||||
Table 7 shows the amount of projected base CPP expenditures by type. Total expenditures of the base Plan are expected to grow rapidly from approximately $56 billion in 2022 to $89 billion in 2030. Thereafter, total expenditures are projected to grow at a slower pace, reaching $197 billion in 2050 and $1.2 trillion by 2100. Table 8 shows the same information but in millions of 2022 constant dollars.
Table 9 shows the projected base CPP expenditures by type expressed as a percentage of contributory earnings. These are referred to as the pay-as-you-go (or “PayGo”) rates. A pay-as-you-go rate corresponds to the contribution rate that would need to be paid to cover expenditures if there were no assets. Although the total pay-as-you-go rate is expected to increase significantly from approximately 9.1% in 2022 to 13.3% by the end of the projection period, the legislated contribution rate of 9.9% is sufficient to finance the base Plan over the projection period.
| Year | RetirementTable 7 Footnote 1 | DisabilityTable 7 Footnote 2 | Survivor | Children | Death | Operating ExpensesTable 7 Footnote 3 | Total |
|---|---|---|---|---|---|---|---|
| 2022 | 44,846 | 4,397 | 4,975 | 571 | 440 | 775 | 56,005 |
| 2023 | 49,774 | 4,650 | 5,338 | 617 | 445 | 768 | 61,592 |
| 2024 | 53,281 | 4,768 | 5,514 | 648 | 459 | 756 | 65,425 |
| 2025 | 56,821 | 4,891 | 5,679 | 680 | 472 | 787 | 69,330 |
| 2026 | 60,460 | 5,034 | 5,845 | 715 | 485 | 817 | 73,356 |
| 2027 | 63,978 | 5,186 | 6,013 | 750 | 499 | 847 | 77,273 |
| 2028 | 67,526 | 5,335 | 6,197 | 787 | 513 | 879 | 81,237 |
| 2029 | 71,148 | 5,504 | 6,400 | 825 | 528 | 912 | 85,318 |
| 2030 | 74,802 | 5,694 | 6,623 | 865 | 544 | 945 | 89,472 |
| 2031 | 78,441 | 5,918 | 6,866 | 906 | 559 | 979 | 93,670 |
| 2032 | 82,040 | 6,172 | 7,129 | 946 | 575 | 1,015 | 97,877 |
| 2033 | 85,635 | 6,443 | 7,409 | 986 | 592 | 1,052 | 102,118 |
| 2034 | 89,272 | 6,729 | 7,707 | 1,029 | 609 | 1,091 | 106,436 |
| 2035 | 92,973 | 7,028 | 8,023 | 1,074 | 626 | 1,130 | 110,853 |
| 2036 | 96,745 | 7,338 | 8,355 | 1,120 | 643 | 1,169 | 115,370 |
| 2037 | 100,557 | 7,678 | 8,704 | 1,169 | 660 | 1,210 | 119,977 |
| 2038 | 104,408 | 8,043 | 9,067 | 1,221 | 677 | 1,252 | 124,669 |
| 2039 | 108,332 | 8,438 | 9,446 | 1,272 | 694 | 1,296 | 129,478 |
| 2040 | 112,382 | 8,843 | 9,839 | 1,323 | 711 | 1,341 | 134,439 |
| 2041 | 116,578 | 9,269 | 10,244 | 1,374 | 726 | 1,387 | 139,577 |
| 2042 | 120,925 | 9,707 | 10,658 | 1,423 | 740 | 1,436 | 144,889 |
| 2043 | 125,452 | 10,163 | 11,081 | 1,471 | 754 | 1,487 | 150,409 |
| 2044 | 130,197 | 10,627 | 11,515 | 1,520 | 768 | 1,540 | 156,167 |
| 2045 | 135,200 | 11,098 | 11,957 | 1,568 | 780 | 1,595 | 162,197 |
| 2046 | 140,488 | 11,570 | 12,404 | 1,613 | 791 | 1,651 | 168,516 |
| 2047 | 146,085 | 12,040 | 12,856 | 1,652 | 801 | 1,709 | 175,143 |
| 2048 | 152,016 | 12,511 | 13,312 | 1,690 | 811 | 1,768 | 182,108 |
| 2049 | 158,300 | 12,985 | 13,772 | 1,728 | 820 | 1,830 | 189,435 |
| 2050 | 164,967 | 13,462 | 14,237 | 1,765 | 829 | 1,892 | 197,151 |
| 2051 | 172,035 | 13,939 | 14,704 | 1,800 | 836 | 1,956 | 205,269 |
| 2052 | 179,500 | 14,423 | 15,171 | 1,834 | 842 | 2,021 | 213,791 |
| 2053 | 187,371 | 14,907 | 15,641 | 1,867 | 848 | 2,088 | 222,722 |
| 2054 | 195,698 | 15,381 | 16,115 | 1,900 | 853 | 2,156 | 232,103 |
| 2055 | 204,541 | 15,835 | 16,594 | 1,933 | 858 | 2,226 | 241,987 |
| 2060 | 255,758 | 18,027 | 19,116 | 2,112 | 874 | 2,602 | 298,489 |
| 2065 | 317,002 | 20,269 | 22,144 | 2,339 | 894 | 3,038 | 365,685 |
| 2070 | 385,069 | 23,475 | 26,057 | 2,631 | 931 | 3,562 | 441,724 |
| 2075 | 461,732 | 27,477 | 31,097 | 2,972 | 985 | 4,203 | 528,466 |
| 2080 | 549,340 | 32,208 | 37,189 | 3,350 | 1,043 | 4,971 | 628,102 |
| 2085 | 649,803 | 38,098 | 44,038 | 3,750 | 1,089 | 5,882 | 742,661 |
| 2090 | 771,028 | 44,855 | 51,349 | 4,169 | 1,116 | 6,950 | 879,465 |
| 2095 | 921,488 | 51,845 | 59,097 | 4,634 | 1,122 | 8,188 | 1,046,375 |
| 2100 | 1,103,304 | 59,859 | 67,667 | 5,180 | 1,123 | 9,634 | 1,246,767 |
|
Table 7 Footnotes
|
|||||||
| Year | Retirement Table 8 Footnote 2 | Disability Table 8 Footnote 3 | Survivor | Children | Death | Operating Expenses Table 8 Footnote 4 | Total |
|---|---|---|---|---|---|---|---|
| 2022 | 44,846 | 4,397 | 4,975 | 571 | 440 | 775 | 56,005 |
| 2023 | 48,324 | 4,515 | 5,182 | 599 | 432 | 746 | 59,798 |
| 2024 | 50,468 | 4,516 | 5,223 | 613 | 435 | 716 | 61,970 |
| 2025 | 52,637 | 4,531 | 5,260 | 630 | 437 | 729 | 64,224 |
| 2026 | 54,909 | 4,572 | 5,309 | 650 | 440 | 742 | 66,621 |
| 2027 | 56,965 | 4,617 | 5,354 | 668 | 444 | 754 | 68,803 |
| 2028 | 58,945 | 4,657 | 5,410 | 687 | 448 | 767 | 70,914 |
| 2029 | 60,889 | 4,710 | 5,477 | 706 | 452 | 780 | 73,015 |
| 2030 | 62,760 | 4,777 | 5,557 | 726 | 456 | 793 | 75,069 |
| 2031 | 64,523 | 4,868 | 5,648 | 745 | 460 | 805 | 77,050 |
| 2032 | 66,161 | 4,977 | 5,749 | 763 | 464 | 819 | 78,932 |
| 2033 | 67,706 | 5,094 | 5,858 | 780 | 468 | 832 | 80,738 |
| 2034 | 69,197 | 5,216 | 5,974 | 797 | 472 | 845 | 82,502 |
| 2035 | 70,653 | 5,341 | 6,097 | 816 | 476 | 859 | 84,241 |
| 2036 | 72,078 | 5,467 | 6,225 | 835 | 479 | 871 | 85,954 |
| 2037 | 73,449 | 5,608 | 6,357 | 854 | 482 | 884 | 87,634 |
| 2038 | 74,766 | 5,760 | 6,493 | 874 | 485 | 897 | 89,275 |
| 2039 | 76,056 | 5,924 | 6,632 | 893 | 488 | 910 | 90,901 |
| 2040 | 77,352 | 6,087 | 6,772 | 911 | 489 | 923 | 92,534 |
| 2041 | 78,666 | 6,254 | 6,912 | 927 | 490 | 936 | 94,186 |
| 2042 | 80,000 | 6,422 | 7,051 | 941 | 490 | 950 | 95,853 |
| 2043 | 81,368 | 6,592 | 7,187 | 954 | 489 | 965 | 97,554 |
| 2044 | 82,789 | 6,758 | 7,322 | 966 | 488 | 979 | 99,303 |
| 2045 | 84,284 | 6,919 | 7,454 | 977 | 486 | 994 | 101,115 |
| 2046 | 85,864 | 7,072 | 7,581 | 986 | 483 | 1,009 | 102,995 |
| 2047 | 87,534 | 7,215 | 7,703 | 990 | 480 | 1,024 | 104,946 |
| 2048 | 89,302 | 7,349 | 7,820 | 993 | 477 | 1,039 | 106,979 |
| 2049 | 91,170 | 7,479 | 7,932 | 995 | 473 | 1,054 | 109,102 |
| 2050 | 93,147 | 7,601 | 8,039 | 996 | 468 | 1,068 | 111,319 |
| 2051 | 95,233 | 7,716 | 8,139 | 996 | 463 | 1,083 | 113,631 |
| 2052 | 97,417 | 7,827 | 8,234 | 995 | 457 | 1,097 | 116,027 |
| 2053 | 99,695 | 7,932 | 8,322 | 993 | 451 | 1,111 | 118,504 |
| 2054 | 102,084 | 8,023 | 8,406 | 991 | 445 | 1,125 | 121,074 |
| 2055 | 104,605 | 8,098 | 8,487 | 989 | 439 | 1,138 | 123,755 |
| 2060 | 118,468 | 8,350 | 8,855 | 978 | 405 | 1,205 | 138,261 |
| 2065 | 132,994 | 8,503 | 9,290 | 981 | 375 | 1,274 | 153,418 |
| 2070 | 146,321 | 8,920 | 9,901 | 1,000 | 354 | 1,353 | 167,849 |
| 2075 | 158,912 | 9,457 | 10,703 | 1,023 | 339 | 1,447 | 181,880 |
| 2080 | 171,241 | 10,040 | 11,593 | 1,044 | 325 | 1,550 | 195,793 |
| 2085 | 183,463 | 10,756 | 12,433 | 1,059 | 307 | 1,661 | 209,679 |
| 2090 | 197,167 | 11,470 | 13,131 | 1,066 | 285 | 1,777 | 224,897 |
| 2095 | 213,429 | 12,008 | 13,688 | 1,073 | 260 | 1,896 | 242,354 |
| 2100 | 231,450 | 12,557 | 14,195 | 1,087 | 236 | 2,021 | 261,546 |
|
Table 8 Footnotes
|
|||||||
| Year | RetirementTable 9 Footnote 1 | DisabilityTable 9 Footnote 2 | Survivor | Children | Death | Operating ExpensesTable 9 Footnote 3 | Total |
|---|---|---|---|---|---|---|---|
| 2022 | 7.27 | 0.71 | 0.81 | 0.09 | 0.07 | 0.13 | 9.08 |
| 2023 | 7.67 | 0.72 | 0.82 | 0.10 | 0.07 | 0.12 | 9.49 |
| 2024 | 7.83 | 0.70 | 0.81 | 0.10 | 0.07 | 0.11 | 9.62 |
| 2025 | 8.00 | 0.69 | 0.80 | 0.10 | 0.07 | 0.11 | 9.76 |
| 2026 | 8.17 | 0.68 | 0.79 | 0.10 | 0.07 | 0.11 | 9.92 |
| 2027 | 8.32 | 0.67 | 0.78 | 0.10 | 0.06 | 0.11 | 10.05 |
| 2028 | 8.44 | 0.67 | 0.77 | 0.10 | 0.06 | 0.11 | 10.15 |
| 2029 | 8.55 | 0.66 | 0.77 | 0.10 | 0.06 | 0.11 | 10.25 |
| 2030 | 8.65 | 0.66 | 0.77 | 0.10 | 0.06 | 0.11 | 10.35 |
| 2031 | 8.73 | 0.66 | 0.76 | 0.10 | 0.06 | 0.11 | 10.43 |
| 2032 | 8.79 | 0.66 | 0.76 | 0.10 | 0.06 | 0.11 | 10.49 |
| 2033 | 8.83 | 0.66 | 0.76 | 0.10 | 0.06 | 0.11 | 10.53 |
| 2034 | 8.86 | 0.67 | 0.76 | 0.10 | 0.06 | 0.11 | 10.56 |
| 2035 | 8.88 | 0.67 | 0.77 | 0.10 | 0.06 | 0.11 | 10.58 |
| 2036 | 8.91 | 0.68 | 0.77 | 0.10 | 0.06 | 0.11 | 10.63 |
| 2037 | 8.93 | 0.68 | 0.77 | 0.10 | 0.06 | 0.11 | 10.66 |
| 2038 | 8.94 | 0.69 | 0.78 | 0.10 | 0.06 | 0.11 | 10.68 |
| 2039 | 8.95 | 0.70 | 0.78 | 0.11 | 0.06 | 0.11 | 10.70 |
| 2040 | 8.96 | 0.71 | 0.78 | 0.11 | 0.06 | 0.11 | 10.72 |
| 2041 | 8.97 | 0.71 | 0.79 | 0.11 | 0.06 | 0.11 | 10.74 |
| 2042 | 8.98 | 0.72 | 0.79 | 0.11 | 0.05 | 0.11 | 10.76 |
| 2043 | 8.98 | 0.73 | 0.79 | 0.11 | 0.05 | 0.11 | 10.77 |
| 2044 | 9.00 | 0.73 | 0.80 | 0.11 | 0.05 | 0.11 | 10.79 |
| 2045 | 9.02 | 0.74 | 0.80 | 0.10 | 0.05 | 0.11 | 10.82 |
| 2046 | 9.04 | 0.74 | 0.80 | 0.10 | 0.05 | 0.11 | 10.85 |
| 2047 | 9.08 | 0.75 | 0.80 | 0.10 | 0.05 | 0.11 | 10.89 |
| 2048 | 9.12 | 0.75 | 0.80 | 0.10 | 0.05 | 0.11 | 10.93 |
| 2049 | 9.18 | 0.75 | 0.80 | 0.10 | 0.05 | 0.11 | 10.98 |
| 2050 | 9.24 | 0.75 | 0.80 | 0.10 | 0.05 | 0.11 | 11.05 |
| 2051 | 9.32 | 0.76 | 0.80 | 0.10 | 0.05 | 0.11 | 11.12 |
| 2052 | 9.40 | 0.76 | 0.79 | 0.10 | 0.04 | 0.11 | 11.19 |
| 2053 | 9.49 | 0.75 | 0.79 | 0.09 | 0.04 | 0.11 | 11.28 |
| 2054 | 9.59 | 0.75 | 0.79 | 0.09 | 0.04 | 0.11 | 11.37 |
| 2055 | 9.70 | 0.75 | 0.79 | 0.09 | 0.04 | 0.11 | 11.48 |
| 2060 | 10.34 | 0.73 | 0.77 | 0.09 | 0.04 | 0.11 | 12.06 |
| 2065 | 10.92 | 0.70 | 0.76 | 0.08 | 0.03 | 0.10 | 12.60 |
| 2070 | 11.25 | 0.69 | 0.76 | 0.08 | 0.03 | 0.10 | 12.91 |
| 2075 | 11.40 | 0.68 | 0.77 | 0.07 | 0.02 | 0.10 | 13.04 |
| 2080 | 11.44 | 0.67 | 0.77 | 0.07 | 0.02 | 0.10 | 13.07 |
| 2085 | 11.40 | 0.67 | 0.77 | 0.07 | 0.02 | 0.10 | 13.03 |
| 2090 | 11.43 | 0.67 | 0.76 | 0.06 | 0.02 | 0.10 | 13.04 |
| 2095 | 11.58 | 0.65 | 0.74 | 0.06 | 0.01 | 0.10 | 13.15 |
| 2100 | 11.76 | 0.64 | 0.72 | 0.06 | 0.01 | 0.10 | 13.29 |
|
Table 9 Footnotes
|
|||||||
5.4 Financial Projections with Legislated Contribution Rate
5.4.1 Market Value of Assets as at 31 December 2021
Prior to 2001, CPP assets were valued at cost because they were traditionally limited to short-term investments and 20-year non-marketable bonds in the form of loans to the provinces. With the creation of the CPPIB in 1997, excess cash flows (contributions less Plan expenditures) not needed to pay benefits are invested in the capital markets as of 1999. Those assets, as is usually the case for private pension plans, are valued at market. The market value of base CPP assets is $544 billion as at 31 December 2021.
5.4.2 Projected Financial State
Table 10 presents historical results of the base CPP while Table 11 and Table 12 present the projected financial state of the base CPP using the legislated contribution rate of 9.9% in current dollars and in 2022 constant dollars, respectively. The projected financial state of the base CPP using the minimum contribution rate of 9.56% for years 2025-2033, and 9.54% for 2034 and thereafter is discussed in the next section 5.5.
Base CPP assets are projected to decrease in 2022 due to the market downturn observed in the first half of 2022 and assumed continued volatility for the remainder of 2022. They are then projected to continuously increase throughout the projection horizon. As shown in Table 10, the base CPP assets as at 31 December 2021 are $544 billion. As shown in Table 11, base CPP assets are projected to increase to $791 billion in 2030, $2.2 trillion in 2050 and $17 trillion by 2100.
Despite projected volatility and lower returns in the first few years of the projections, the investment experience over the 2018-2021 period leads to projected base CPP assets that are higher than projected under the previous triennial actuarial report (the 30th CPP Actuarial Report as at 31 December 2018).
| Year | PayGo Rate (%) Table 10 Footnote 1 | Contribution Rate (%) | Contributions ($ million) | Expenditures ($ million) | Net Cash Flows ($ million) | Net Investment Income Table 10 Footnote 2 ($ million) | Assets at 31 Dec. Table 10 Footnote 3 ($ million) | Yield/Return Table 10 Footnote 2 (%) | Assets/Expenditures Ratio |
|---|---|---|---|---|---|---|---|---|---|
| 1966 | 0.05 | 3.6 | 531 | 8 | 523 | 2 | 525 | 0.7 | 52.5 |
| 1970 | 0.45 | 3.6 | 773 | 97 | 676 | 193 | 3,596 | 6.2 | 24.1 |
| 1975 | 1.42 | 3.6 | 1,426 | 561 | 865 | 607 | 9,359 | 7.2 | 11.5 |
| 1980 | 2.72 | 3.6 | 2,604 | 1,965 | 639 | 1,466 | 18,433 | 8.7 | 7.6 |
| 1985 | 4.31 | 3.6 | 4,032 | 4,826 | (794) | 3,113 | 31,130 | 10.8 | 5.7 |
| 1986 | 4.20 | 3.6 | 4,721 | 5,503 | (782) | 3,395 | 33,743 | 10.9 | 4.7 |
| 1987 | 5.02 | 3.8 | 5,393 | 7,130 | (1,737) | 3,654 | 35,660 | 10.9 | 4.3 |
| 1988 | 5.41 | 4.0 | 6,113 | 8,272 | (2,159) | 3,886 | 37,387 | 11.0 | 4.0 |
| 1989 | 5.89 | 4.2 | 6,694 | 9,391 | (2,697) | 4,162 | 38,852 | 11.3 | 3.7 |
| 1990 | 5.82 | 4.4 | 7,889 | 10,438 | (2,549) | 4,386 | 40,689 | 11.4 | 3.5 |
| 1991 | 6.31 | 4.6 | 8,396 | 11,518 | (3,122) | 4,476 | 42,043 | 11.2 | 3.2 |
| 1992 | 7.07 | 4.8 | 8,883 | 13,076 | (4,193) | 4,497 | 42,347 | 11.0 | 3.0 |
| 1993 | 7.79 | 5.0 | 9,166 | 14,273 | (5,107) | 4,480 | 41,720 | 10.9 | 2.7 |
| 1994 | 8.33 | 5.2 | 9,585 | 15,362 | (5,777) | 4,403 | 40,346 | 11.0 | 2.5 |
| 1995 | 7.91 | 5.4 | 10,911 | 15,986 | (5,075) | 4,412 | 39,683 | 11.3 | 2.4 |
| 1996 | 8.71 | 5.6 | 10,757 | 16,723 | (5,966) | 4,177 | 37,894 | 11.0 | 2.2 |
| 1997 | 8.67 | 6.0 | 12,165 | 17,570 | (5,405) | 3,971 | 36,460 | 10.8 | 2.0 |
| 1998 | 8.11 | 6.4 | 14,473 | 18,338 | (3,865) | 3,938 | 36,535 | 10.9 | 1.9 |
| 1999 | 8.23 | 7.0 | 16,052 | 18,877 | (2,825) | 764 | 42,783 | 1.7 | 2.2 |
| 2000 | 7.69 | 7.8 | 19,977 | 19,683 | 294 | 4,446 | 47,523 | 9.9 | 2.3 |
| 2001 | 7.85 | 8.6 | 22,469 | 20,515 | 1,954 | 3,154 | 52,631 | 6.2 | 2.4 |
| 2002 | 8.16 | 9.4 | 24,955 | 21,666 | 3,289 | 187 | 56,107 | 0.3 | 2.5 |
| 2003 | 8.19 | 9.9 | 27,454 | 22,716 | 4,738 | 6,769 | 67,614 | 11.1 | 2.8 |
| 2004 | 8.29 | 9.9 | 28,459 | 23,833 | 4,626 | 6,475 | 78,715 | 8.9 | 3.2 |
| 2005 | 8.37 | 9.9 | 29,539 | 24,976 | 4,563 | 11,083 | 94,361 | 13.2 | 3.6 |
| 2006 | 8.33 | 9.9 | 31,000 | 26,080 | 4,920 | 14,300 | 113,581 | 14.4 | 4.1 |
| 2007 | 8.15 | 9.9 | 33,621 | 27,691 | 5,930 | 3,269 | 122,780 | 2.7 | 4.2 |
| 2008 | 8.03 | 9.9 | 36,053 | 29,259 | 6,794 | (18,350) | 111,224 | (14.2) | 3.6 |
| 2009 | 8.16 | 9.9 | 37,492 | 30,901 | 6,591 | 9,021 | 126,836 | 7.6 | 4.0 |
| 2010 | 8.83 | 9.9 | 35,885 | 32,023 | 3,862 | 11,804 | 142,502 | 8.9 | 4.2 |
| 2011 | 8.73 | 9.9 | 38,202 | 33,691 | 4,511 | 8,057 | 155,070 | 5.4 | 4.3 |
| 2012 | 8.84 | 9.9 | 40,682 | 36,321 | 4,361 | 15,664 | 175,095 | 9.7 | 4.7 |
| 2013 | 8.73 | 9.9 | 42,632 | 37,575 | 5,057 | 23,887 | 204,039 | 13.2 | 5.3 |
| 2014 | 8.70 | 9.9 | 44,181 | 38,808 | 5,373 | 32,136 | 241,548 | 15.2 | 5.9 |
| 2015 | 8.79 | 9.9 | 46,026 | 40,883 | 5,143 | 38,667 | 285,358 | 15.6 | 6.7 |
| 2016 | 9.06 | 9.9 | 46,492 | 42,561 | 3,931 | 12,244 | 301,533 | 4.2 | 6.8 |
| 2017 | 9.17 | 9.9 | 48,139 | 44,596 | 3,543 | 35,257 | 340,333 | 11.4 | 7.3 |
| 2018 | 9.30 | 9.9 | 49,594 | 46,591 | 3,003 | 28,364 | 371,700 | 8.2 | 7.6 |
| 2019 | 9.27 | 9.9 | 52,166 | 48,844 | 3,322 | 47,041 | 422,063 | 12.4 | 8.2 |
| 2020 | 9.62 | 9.9 | 52,833 | 51,322 | 1,511 | 51,320 | 474,894 | 12.0 | 9.0 |
| 2021 | 9.46 | 9.9 | 55,535 | 53,045 | 2,490 | 66,341 | 543,725 | 13.8 | 9.7 |
|
Table 10 Footnotes
|
|||||||||
| Year | PayGo Rate (%) | Contribution Rate (%) | Contributory Earnings ($ million) | Contributions ($ million) | Expenditures ($ million) | Net Cash Flows ($ million) | Net Investment Income Table 11 Footnote 1 ($ million) | Assets at 31 Dec. ($ million) | Net Rate of Return Footnote 1 (%) | Assets/ Expenditures Ratio |
|---|---|---|---|---|---|---|---|---|---|---|
| 2022 | 9.08 | 9.9 | 616,668 | 61,050 | 56,005 | 5,045 | (49,808) | 498,962 | (9.02) | 8.1 |
| 2023 | 9.49 | 9.9 | 648,785 | 64,230 | 61,592 | 2,638 | 29,938 | 531,538 | 5.91 | 8.1 |
| 2024 | 9.62 | 9.9 | 680,189 | 67,339 | 65,425 | 1,914 | 31,994 | 565,445 | 5.93 | 8.2 |
| 2025 | 9.76 | 9.9 | 710,485 | 70,338 | 69,330 | 1,008 | 33,776 | 600,229 | 5.90 | 8.2 |
| 2026 | 9.92 | 9.9 | 739,632 | 73,224 | 73,356 | (132) | 35,854 | 635,950 | 5.90 | 8.2 |
| 2027 | 10.05 | 9.9 | 769,230 | 76,154 | 77,273 | (1,119) | 38,111 | 672,942 | 5.93 | 8.3 |
| 2028 | 10.15 | 9.9 | 800,229 | 79,223 | 81,237 | (2,015) | 39,924 | 710,851 | 5.87 | 8.3 |
| 2029 | 10.25 | 9.9 | 832,186 | 82,386 | 85,318 | (2,931) | 42,343 | 750,262 | 5.90 | 8.4 |
| 2030 | 10.35 | 9.9 | 864,552 | 85,591 | 89,472 | (3,882) | 44,822 | 791,202 | 5.92 | 8.4 |
| 2031 | 10.43 | 9.9 | 898,197 | 88,922 | 93,670 | (4,748) | 46,868 | 833,322 | 5.87 | 8.5 |
| 2032 | 10.49 | 9.9 | 933,295 | 92,396 | 97,877 | (5,480) | 49,567 | 877,408 | 5.90 | 8.6 |
| 2033 | 10.53 | 9.9 | 969,910 | 96,021 | 102,118 | (6,097) | 53,397 | 924,709 | 6.04 | 8.7 |
| 2034 | 10.56 | 9.9 | 1,007,917 | 99,784 | 106,436 | (6,652) | 56,231 | 974,287 | 6.04 | 8.8 |
| 2035 | 10.58 | 9.9 | 1,047,401 | 103,693 | 110,853 | (7,161) | 59,198 | 1,026,325 | 6.03 | 8.9 |
| 2036 | 10.63 | 9.9 | 1,085,658 | 107,480 | 115,370 | (7,890) | 62,310 | 1,080,745 | 6.03 | 9.0 |
| 2037 | 10.66 | 9.9 | 1,125,623 | 111,437 | 119,977 | (8,540) | 65,575 | 1,137,780 | 6.03 | 9.1 |
| 2038 | 10.68 | 9.9 | 1,167,224 | 115,555 | 124,669 | (9,114) | 69,002 | 1,197,668 | 6.03 | 9.2 |
| 2039 | 10.70 | 9.9 | 1,210,287 | 119,818 | 129,478 | (9,660) | 72,592 | 1,260,600 | 6.02 | 9.4 |
| 2040 | 10.72 | 9.9 | 1,254,280 | 124,174 | 134,439 | (10,266) | 76,391 | 1,326,725 | 6.02 | 9.5 |
| 2041 | 10.74 | 9.9 | 1,299,423 | 128,643 | 139,577 | (10,934) | 80,378 | 1,396,170 | 6.02 | 9.6 |
| 2042 | 10.76 | 9.9 | 1,346,635 | 133,317 | 144,889 | (11,572) | 84,570 | 1,469,168 | 6.02 | 9.8 |
| 2043 | 10.77 | 9.9 | 1,396,342 | 138,238 | 150,409 | (12,171) | 88,998 | 1,545,994 | 6.02 | 9.9 |
| 2044 | 10.79 | 9.9 | 1,446,964 | 143,249 | 156,167 | (12,918) | 93,638 | 1,626,714 | 6.02 | 10.0 |
| 2045 | 10.82 | 9.9 | 1,499,428 | 148,443 | 162,197 | (13,753) | 98,509 | 1,711,470 | 6.02 | 10.2 |
| 2046 | 10.85 | 9.9 | 1,553,431 | 153,790 | 168,516 | (14,727) | 103,620 | 1,800,363 | 6.02 | 10.3 |
| 2047 | 10.89 | 9.9 | 1,608,638 | 159,255 | 175,143 | (15,888) | 108,975 | 1,893,450 | 6.02 | 10.4 |
| 2048 | 10.93 | 9.9 | 1,666,000 | 164,934 | 182,108 | (17,174) | 114,581 | 1,990,858 | 6.02 | 10.5 |
| 2049 | 10.98 | 9.9 | 1,724,766 | 170,752 | 189,435 | (18,683) | 120,443 | 2,092,618 | 6.02 | 10.6 |
| 2050 | 11.05 | 9.9 | 1,784,712 | 176,687 | 197,151 | (20,464) | 126,560 | 2,198,713 | 6.02 | 10.7 |
| 2051 | 11.12 | 9.9 | 1,846,030 | 182,757 | 205,269 | (22,512) | 132,931 | 2,309,132 | 6.02 | 10.8 |
| 2052 | 11.19 | 9.9 | 1,909,767 | 189,067 | 213,791 | (24,724) | 139,560 | 2,423,968 | 6.02 | 10.9 |
| 2053 | 11.28 | 9.9 | 1,974,826 | 195,508 | 222,722 | (27,214) | 146,449 | 2,543,202 | 6.02 | 11.0 |
| 2054 | 11.37 | 9.9 | 2,040,986 | 202,058 | 232,103 | (30,046) | 153,593 | 2,666,750 | 6.02 | 11.0 |
| 2055 | 11.48 | 9.9 | 2,108,096 | 208,701 | 241,987 | (33,286) | 160,987 | 2,794,451 | 6.02 | 11.1 |
| 2060 | 12.06 | 9.9 | 2,474,655 | 244,991 | 298,489 | (53,498) | 201,589 | 3,494,394 | 6.02 | 11.2 |
| 2065 | 12.60 | 9.9 | 2,903,032 | 287,400 | 365,685 | (78,285) | 248,302 | 4,298,794 | 6.02 | 11.3 |
| 2070 | 12.91 | 9.9 | 3,421,988 | 338,777 | 441,724 | (102,947) | 302,454 | 5,233,283 | 6.02 | 11.4 |
| 2075 | 13.04 | 9.9 | 4,051,490 | 401,097 | 528,466 | (127,369) | 366,783 | 6,345,944 | 6.02 | 11.6 |
| 2080 | 13.07 | 9.9 | 4,803,930 | 475,589 | 628,102 | (152,513) | 444,660 | 7,695,451 | 6.02 | 11.8 |
| 2085 | 13.03 | 9.9 | 5,697,857 | 564,088 | 742,661 | (178,573) | 540,461 | 9,358,546 | 6.02 | 12.2 |
| 2090 | 13.04 | 9.9 | 6,744,599 | 667,715 | 879,465 | (211,750) | 659,172 | 11,419,461 | 6.02 | 12.5 |
| 2095 | 13.15 | 9.9 | 7,958,860 | 787,927 | 1,046,375 | (258,447) | 804,984 | 13,948,338 | 6.02 | 12.9 |
| 2100 | 13.29 | 9.9 | 9,379,076 | 928,529 | 1,246,767 | (318,238) | 982,413 | 17,024,497 | 6.02 | 13.2 |
|
Table 11 Footnotes
|
||||||||||
| Year | PayGo Rate (%) | Contribution Rate (%) | Contributory Earnings ($ million) | Contributions ($ million) | Expenditures ($ million) | Net Cash Flows ($ million) | Net Investment Income Table 12 Footnote 2 ($ million) | Assets at 31 Dec. ($ million) |
|---|---|---|---|---|---|---|---|---|
| 2022 | 9.08 | 9.9 | 616,668 | 61,050 | 56,005 | 5,045 | (49,808) | 498,962 |
| 2023 | 9.49 | 9.9 | 629,888 | 62,359 | 59,798 | 2,561 | 29,066 | 516,056 |
| 2024 | 9.62 | 9.9 | 644,270 | 63,783 | 61,970 | 1,813 | 30,304 | 535,587 |
| 2025 | 9.76 | 9.9 | 658,158 | 65,158 | 64,224 | 934 | 31,288 | 556,023 |
| 2026 | 9.92 | 9.9 | 671,724 | 66,501 | 66,621 | (120) | 32,562 | 577,562 |
| 2027 | 10.05 | 9.9 | 684,907 | 67,806 | 68,803 | (997) | 33,933 | 599,174 |
| 2028 | 10.15 | 9.9 | 698,537 | 69,155 | 70,914 | (1,759) | 34,850 | 620,517 |
| 2029 | 10.25 | 9.9 | 712,189 | 70,507 | 73,015 | (2,509) | 36,237 | 642,078 |
| 2030 | 10.35 | 9.9 | 725,380 | 71,813 | 75,069 | (3,257) | 37,607 | 663,838 |
| 2031 | 10.43 | 9.9 | 738,833 | 73,144 | 77,050 | (3,906) | 38,552 | 685,468 |
| 2032 | 10.49 | 9.9 | 752,651 | 74,512 | 78,932 | (4,420) | 39,973 | 707,581 |
| 2033 | 10.53 | 9.9 | 766,842 | 75,917 | 80,738 | (4,820) | 42,218 | 731,104 |
| 2034 | 10.56 | 9.9 | 781,266 | 77,345 | 82,502 | (5,157) | 43,586 | 755,198 |
| 2035 | 10.58 | 9.9 | 795,952 | 78,799 | 84,241 | (5,442) | 44,987 | 779,935 |
| 2036 | 10.63 | 9.9 | 808,848 | 80,076 | 85,954 | (5,878) | 46,423 | 805,187 |
| 2037 | 10.66 | 9.9 | 822,179 | 81,396 | 87,634 | (6,238) | 47,897 | 831,059 |
| 2038 | 10.68 | 9.9 | 835,848 | 82,749 | 89,275 | (6,526) | 49,412 | 857,649 |
| 2039 | 10.70 | 9.9 | 849,692 | 84,119 | 90,901 | (6,782) | 50,964 | 885,015 |
| 2040 | 10.72 | 9.9 | 863,311 | 85,468 | 92,534 | (7,066) | 52,579 | 913,175 |
| 2041 | 10.74 | 9.9 | 876,846 | 86,808 | 94,186 | (7,378) | 54,239 | 942,130 |
| 2042 | 10.76 | 9.9 | 890,887 | 88,198 | 95,853 | (7,655) | 55,948 | 971,950 |
| 2043 | 10.77 | 9.9 | 905,658 | 89,660 | 97,554 | (7,894) | 57,723 | 1,002,722 |
| 2044 | 10.79 | 9.9 | 920,089 | 91,089 | 99,303 | (8,214) | 59,542 | 1,034,388 |
| 2045 | 10.82 | 9.9 | 934,755 | 92,541 | 101,115 | (8,574) | 61,411 | 1,066,944 |
| 2046 | 10.85 | 9.9 | 949,432 | 93,994 | 102,995 | (9,001) | 63,331 | 1,100,353 |
| 2047 | 10.89 | 9.9 | 963,896 | 95,426 | 104,946 | (9,520) | 65,298 | 1,134,555 |
| 2048 | 10.93 | 9.9 | 978,694 | 96,891 | 106,979 | (10,089) | 67,311 | 1,169,531 |
| 2049 | 10.98 | 9.9 | 993,349 | 98,342 | 109,102 | (10,760) | 69,367 | 1,205,206 |
| 2050 | 11.05 | 9.9 | 1,007,719 | 99,764 | 111,319 | (11,555) | 71,461 | 1,241,480 |
| 2051 | 11.12 | 9.9 | 1,021,904 | 101,168 | 113,631 | (12,462) | 73,587 | 1,278,262 |
| 2052 | 11.19 | 9.9 | 1,036,457 | 102,609 | 116,027 | (13,418) | 75,741 | 1,315,521 |
| 2053 | 11.28 | 9.9 | 1,050,751 | 104,024 | 118,504 | (14,480) | 77,921 | 1,353,168 |
| 2054 | 11.37 | 9.9 | 1,064,659 | 105,401 | 121,074 | (15,673) | 80,120 | 1,391,082 |
| 2055 | 11.48 | 9.9 | 1,078,104 | 106,732 | 123,755 | (17,023) | 82,331 | 1,429,114 |
| 2060 | 12.06 | 9.9 | 1,146,263 | 113,480 | 138,261 | (24,781) | 93,376 | 1,618,607 |
| 2065 | 12.60 | 9.9 | 1,217,925 | 120,575 | 153,418 | (32,843) | 104,172 | 1,803,497 |
| 2070 | 12.91 | 9.9 | 1,300,308 | 128,731 | 167,849 | (39,118) | 114,928 | 1,988,575 |
| 2075 | 13.04 | 9.9 | 1,394,382 | 138,044 | 181,880 | (43,836) | 126,234 | 2,184,053 |
| 2080 | 13.07 | 9.9 | 1,497,486 | 148,251 | 195,793 | (47,541) | 138,610 | 2,398,834 |
| 2085 | 13.03 | 9.9 | 1,608,706 | 159,262 | 209,679 | (50,417) | 152,591 | 2,642,249 |
| 2090 | 13.04 | 9.9 | 1,724,728 | 170,748 | 224,897 | (54,149) | 168,563 | 2,920,183 |
| 2095 | 13.15 | 9.9 | 1,843,378 | 182,494 | 242,354 | (59,860) | 186,445 | 3,230,621 |
| 2100 | 13.29 | 9.9 | 1,967,536 | 194,786 | 261,546 | (66,760) | 206,090 | 3,571,388 |
|
Table 12 Footnotes
|
||||||||
Over the period 2022 to 2025, contributions are projected to exceed expenditures for the base CPP. Thereafter, a small but increasing portion of investment income is required to cover the shortfall. This causes the total revenues (contributions and investment income) to continue to be higher than expenditures but to a lesser extent over the long term, which causes the assets to grow at a slower pace.
Chart 1 shows historical and projected revenues and expenditures of the base CPP for the period 2000 to 2050 on a year 2022 constant dollar basis.
Table 13 shows in more detail the sources of the revenues required to cover the expenditures, from which several observations can be made:
- From 2026 onward, a portion of investment income is required to fund net cash outflows. It is project that in 2050, 16% of investment income is required to pay for expenditures.
- Investment income, which is expected to represent 32% of revenues in 2023 is further projected to represent 42% of revenues in 2050. This clearly illustrates the importance of investment income as a source of revenues for the base Plan.
Chart 1 Revenues and Expenditures - Base CPP, 9.9% legislated contribution rate (billions of 2022 constant dollars)
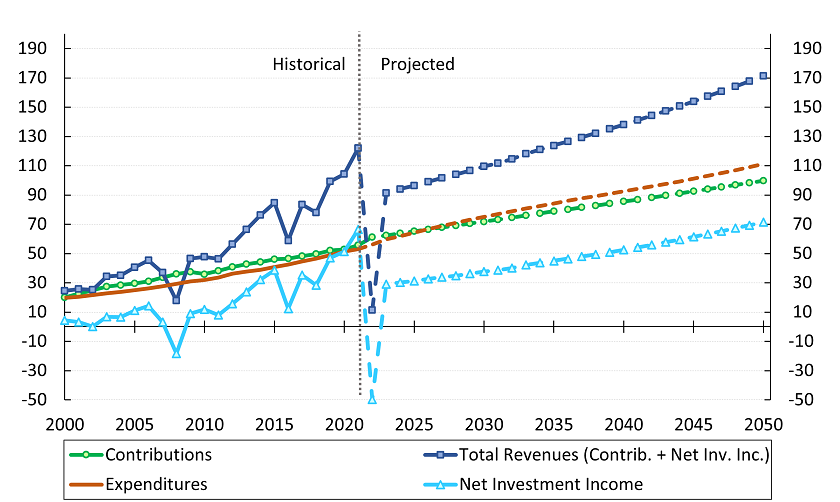
Text description: Chart 1 Revenues and Expenditures - Base CPP, 9.9% legislated contribution rate (billions of 2022 constant dollars)
Line chart showing the historical and projected base CPP’s revenues and expenditures using the 9.9% legislated contribution rate. Y axis represents billions of 2022 constant dollars. X axis represents the year.
Contributions are 20.0 in the year 2000, increase to 55.5 in 2021, and are projected to continue increasing to reach 99.8 in 2050.
Investment Income is 4.5 in 2000, increases overall to reach 66.3 in 2021, and is then projected to be negative in 2022 before increasing thereafter to reach 71.5 in 2050.
Total Revenues is 24.4 in 2000, increase overall to reach 121.9 in 2021, and are then projected to decrease in 2019 before increasing thereafter to reach 171.2 in 2050.
Expenditures is 19.7 in 2000, increase to 53.0 in 2021, and are projected to continue increasing to reach 111.3 in 2050.
| Year | Contributions | Net Investment Income | Expenditures | Total Revenues (Contrib. + Net Inv. Inc.) |
|---|---|---|---|---|
| 2000 | 19,977 | 4,446 | 19,683 | 24,423 |
| 2001 | 22,469 | 3,154 | 20,515 | 25,623 |
| 2002 | 24,955 | 187 | 21,666 | 25,142 |
| 2003 | 27,454 | 6,769 | 22,716 | 34,223 |
| 2004 | 28,459 | 6,475 | 23,833 | 34,934 |
| 2005 | 29,539 | 11,083 | 24,976 | 40,622 |
| 2006 | 31,000 | 14,300 | 26,080 | 45,300 |
| 2007 | 33,621 | 3,269 | 27,691 | 36,890 |
| 2008 | 36,053 | -18,350 | 29,259 | 17,703 |
| 2009 | 37,492 | 9,021 | 30,901 | 46,513 |
| 2010 | 35,885 | 11,804 | 32,023 | 47,689 |
| 2011 | 38,202 | 8,057 | 33,691 | 46,259 |
| 2012 | 40,682 | 15,664 | 36,321 | 56,346 |
| 2013 | 42,632 | 23,887 | 37,575 | 66,519 |
| 2014 | 44,181 | 32,136 | 38,808 | 76,317 |
| 2015 | 46,026 | 38,667 | 40,883 | 84,693 |
| 2016 | 46,492 | 12,244 | 42,561 | 58,736 |
| 2017 | 48,139 | 35,257 | 44,596 | 83,396 |
| 2018 | 49,594 | 28,364 | 46,591 | 77,958 |
| 2019 | 52,166 | 47,041 | 48,844 | 99,207 |
| 2020 | 52,833 | 51,320 | 51,322 | 104,153 |
| 2021 | 55,535 | 66,341 | 53,045 | 121,876 |
| Year | Contributions | Net Investment Income | Expenditures | Total Revenues (Contrib. + Net Inv. Inc.) |
|---|---|---|---|---|
| 2021 | 55,535 | 66,341 | 53,045 | 121,876 |
| 2022 | 61,050 | (49,808) | 56,005 | 11,242 |
| 2023 | 62,359 | 29,066 | 59,798 | 91,425 |
| 2024 | 63,783 | 30,304 | 61,970 | 94,087 |
| 2025 | 65,158 | 31,288 | 64,224 | 96,446 |
| 2026 | 66,501 | 32,562 | 66,621 | 99,063 |
| 2027 | 67,806 | 33,933 | 68,803 | 101,739 |
| 2028 | 69,155 | 34,850 | 70,914 | 104,005 |
| 2029 | 70,507 | 36,237 | 73,015 | 106,744 |
| 2030 | 71,813 | 37,607 | 75,069 | 109,420 |
| 2031 | 73,144 | 38,552 | 77,050 | 111,697 |
| 2032 | 74,512 | 39,973 | 78,932 | 114,485 |
| 2033 | 75,917 | 42,218 | 80,738 | 118,135 |
| 2034 | 77,345 | 43,586 | 82,502 | 120,931 |
| 2035 | 78,799 | 44,987 | 84,241 | 123,786 |
| 2036 | 80,076 | 46,423 | 85,954 | 126,499 |
| 2037 | 81,396 | 47,897 | 87,634 | 129,293 |
| 2038 | 82,749 | 49,412 | 89,275 | 132,161 |
| 2039 | 84,119 | 50,964 | 90,901 | 135,083 |
| 2040 | 85,468 | 52,579 | 92,534 | 138,047 |
| 2041 | 86,808 | 54,239 | 94,186 | 141,047 |
| 2042 | 88,198 | 55,948 | 95,853 | 144,146 |
| 2043 | 89,660 | 57,723 | 97,554 | 147,383 |
| 2044 | 91,089 | 59,542 | 99,303 | 150,631 |
| 2045 | 92,541 | 61,411 | 101,115 | 153,952 |
| 2046 | 93,994 | 63,331 | 102,995 | 157,325 |
| 2047 | 95,426 | 65,298 | 104,946 | 160,724 |
| 2048 | 96,891 | 67,311 | 106,979 | 164,201 |
| 2049 | 98,342 | 69,367 | 109,102 | 167,709 |
| 2050 | 99,764 | 71,461 | 111,319 | 171,225 |
| Year | Contributions | Net Investment Income Table 13 Footnote 1 | Total Revenues | Net Investment Income as % of Total Revenues (%) | Expenditures | Expenditures as % of Total Revenues (%) | Net Cash Flows (Contributions less Expenditures) | % of Net Investment Income Needed to Pay Expenditures (%) |
|---|---|---|---|---|---|---|---|---|
| 2022 | 61,050 | (49,808) | 11,242 | (443.0) | 56,005 | 498.2 | 5,045 | 0.0 |
| 2023 | 64,230 | 29,938 | 94,168 | 31.8 | 61,592 | 65.4 | 2,638 | 0.0 |
| 2024 | 67,339 | 31,994 | 99,332 | 32.2 | 65,425 | 65.9 | 1,914 | 0.0 |
| 2025 | 70,338 | 33,776 | 104,114 | 32.4 | 69,330 | 66.6 | 1,008 | 0.0 |
| 2026 | 73,224 | 35,854 | 109,077 | 32.9 | 73,356 | 67.3 | (132) | 0.4 |
| 2027 | 76,154 | 38,111 | 114,264 | 33.4 | 77,273 | 67.6 | (1,119) | 2.9 |
| 2028 | 79,223 | 39,924 | 119,146 | 33.5 | 81,237 | 68.2 | (2,015) | 5.0 |
| 2029 | 82,386 | 42,343 | 124,729 | 33.9 | 85,318 | 68.4 | (2,931) | 6.9 |
| 2030 | 85,591 | 44,822 | 130,413 | 34.4 | 89,472 | 68.6 | (3,882) | 8.7 |
| 2031 | 88,922 | 46,868 | 135,789 | 34.5 | 93,670 | 69.0 | (4,748) | 10.1 |
| 2032 | 92,396 | 49,567 | 141,963 | 34.9 | 97,877 | 68.9 | (5,480) | 11.1 |
| 2033 | 96,021 | 53,397 | 149,418 | 35.7 | 102,118 | 68.3 | (6,097) | 11.4 |
| 2034 | 99,784 | 56,231 | 156,014 | 36.0 | 106,436 | 68.2 | (6,652) | 11.8 |
| 2035 | 103,693 | 59,198 | 162,891 | 36.3 | 110,853 | 68.1 | (7,161) | 12.1 |
| 2036 | 107,480 | 62,310 | 169,791 | 36.7 | 115,370 | 67.9 | (7,890) | 12.7 |
| 2037 | 111,437 | 65,575 | 177,012 | 37.0 | 119,977 | 67.8 | (8,540) | 13.0 |
| 2038 | 115,555 | 69,002 | 184,557 | 37.4 | 124,669 | 67.6 | (9,114) | 13.2 |
| 2039 | 119,818 | 72,592 | 192,410 | 37.7 | 129,478 | 67.3 | (9,660) | 13.3 |
| 2040 | 124,174 | 76,391 | 200,564 | 38.1 | 134,439 | 67.0 | (10,266) | 13.4 |
| 2041 | 128,643 | 80,378 | 209,021 | 38.5 | 139,577 | 66.8 | (10,934) | 13.6 |
| 2042 | 133,317 | 84,570 | 217,887 | 38.8 | 144,889 | 66.5 | (11,572) | 13.7 |
| 2043 | 138,238 | 88,998 | 227,235 | 39.2 | 150,409 | 66.2 | (12,171) | 13.7 |
| 2044 | 143,249 | 93,638 | 236,888 | 39.5 | 156,167 | 65.9 | (12,918) | 13.8 |
| 2045 | 148,443 | 98,509 | 246,952 | 39.9 | 162,197 | 65.7 | (13,753) | 14.0 |
| 2046 | 153,790 | 103,620 | 257,409 | 40.3 | 168,516 | 65.5 | (14,727) | 14.2 |
| 2047 | 159,255 | 108,975 | 268,230 | 40.6 | 175,143 | 65.3 | (15,888) | 14.6 |
| 2048 | 164,934 | 114,581 | 279,515 | 41.0 | 182,108 | 65.2 | (17,174) | 15.0 |
| 2049 | 170,752 | 120,443 | 291,195 | 41.4 | 189,435 | 65.1 | (18,683) | 15.5 |
| 2050 | 176,687 | 126,560 | 303,246 | 41.7 | 197,151 | 65.0 | (20,464) | 16.2 |
| 2051 | 182,757 | 132,931 | 315,688 | 42.1 | 205,269 | 65.0 | (22,512) | 16.9 |
| 2052 | 189,067 | 139,560 | 328,627 | 42.5 | 213,791 | 65.1 | (24,724) | 17.7 |
| 2053 | 195,508 | 146,449 | 341,956 | 42.8 | 222,722 | 65.1 | (27,214) | 18.6 |
| 2054 | 202,058 | 153,593 | 355,651 | 43.2 | 232,103 | 65.3 | (30,046) | 19.6 |
| 2055 | 208,701 | 160,987 | 369,688 | 43.5 | 241,987 | 65.5 | (33,286) | 20.7 |
| 2060 | 244,991 | 201,589 | 446,580 | 45.1 | 298,489 | 66.8 | (53,498) | 26.5 |
| 2065 | 287,400 | 248,302 | 535,702 | 46.4 | 365,685 | 68.3 | (78,285) | 31.5 |
| 2070 | 338,777 | 302,454 | 641,230 | 47.2 | 441,724 | 68.9 | (102,947) | 34.0 |
| 2075 | 401,097 | 366,783 | 767,880 | 47.8 | 528,466 | 68.8 | (127,369) | 34.7 |
| 2080 | 475,589 | 444,660 | 920,249 | 48.3 | 628,102 | 68.3 | (152,513) | 34.3 |
| 2085 | 564,088 | 540,461 | 1,104,549 | 48.9 | 742,661 | 67.2 | (178,573) | 33.0 |
| 2090 | 667,715 | 659,172 | 1,326,887 | 49.7 | 879,465 | 66.3 | (211,750) | 32.1 |
| 2095 | 787,927 | 804,984 | 1,592,911 | 50.5 | 1,046,375 | 65.7 | (258,447) | 32.1 |
| 2100 | 928,529 | 982,413 | 1,910,942 | 51.4 | 1,246,767 | 65.2 | (318,238) | 32.4 |
|
Table 13 Footnotes
|
||||||||
5.5 Financial Projections with Minimum Contribution Rate
The results presented in Table 14 are based on the best-estimate assumptions, but use the MCR of 9.56% for 2025-2033 and 9.54% thereafter as opposed to the legislated contribution rate of 9.9% for 2022 and thereafter. The financial projections of the base Plan under the legislated rate of 9.9% were previously presented in Table 11. Under the MCR, the ratio of assets to the following year’s expenditures is projected to increase slightly from 8.1 in 2025 to 8.4 in 2034 and to be the same fifty years later in 2084.
In the case that the MCR, as determined by an actuarial report, exceeds the legislated rate, the insufficient rates provisions of the CPP statute would result in adjustments to the base CPP legislated contribution rate and possibly indexation of benefits in pay if the federal and provincial governments make no recommendation to either increase the legislated rate or maintain it. In respect of this 31st CPP Actuarial Report, the MCR is less than the legislated rate of 9.9%, and thus the insufficient rates provisions do not apply. Therefore, in the absence of specific action by the federal and provincial governments, the legislated contribution rate will remain at 9.9% for the year 2022 and thereafter.
| Year | PayGo Rate (%) | Contribution Rate (%) | Contributory Earnings ($ million) | Contributions ($ million) | Expenditures ($ million) | Net Cash Flows ($ million) | Net Investment Income Table 14 Footnote 1 ($ million) | Assets at 31 Dec. ($ million) | Assets/ Expenditures Ratio |
|---|---|---|---|---|---|---|---|---|---|
| 2022 | 9.08 | 9.90 | 616,668 | 61,050 | 56,005 | 5,045 | (49,808) | 498,962 | 8.1 |
| 2023 | 9.49 | 9.90 | 648,785 | 64,230 | 61,592 | 2,638 | 29,938 | 531,538 | 8.1 |
| 2024 | 9.62 | 9.90 | 680,189 | 67,339 | 65,425 | 1,914 | 31,994 | 565,445 | 8.2 |
| 2025 | 9.76 | 9.56 | 710,485 | 67,922 | 69,330 | (1,408) | 33,697 | 597,735 | 8.1 |
| 2026 | 9.92 | 9.56 | 739,632 | 70,709 | 73,356 | (2,647) | 35,625 | 630,713 | 8.2 |
| 2027 | 10.05 | 9.56 | 769,230 | 73,538 | 77,273 | (3,735) | 37,716 | 664,694 | 8.2 |
| 2028 | 10.15 | 9.56 | 800,229 | 76,502 | 81,237 | (4,735) | 39,353 | 699,312 | 8.2 |
| 2029 | 10.25 | 9.56 | 832,186 | 79,557 | 85,318 | (5,761) | 41,572 | 735,124 | 8.2 |
| 2030 | 10.35 | 9.56 | 864,552 | 82,651 | 89,472 | (6,821) | 43,833 | 772,136 | 8.2 |
| 2031 | 10.43 | 9.56 | 898,197 | 85,868 | 93,670 | (7,802) | 45,653 | 809,987 | 8.3 |
| 2032 | 10.49 | 9.56 | 933,295 | 89,223 | 97,877 | (8,654) | 48,091 | 849,424 | 8.3 |
| 2033 | 10.53 | 9.56 | 969,910 | 92,723 | 102,118 | (9,394) | 51,601 | 891,631 | 8.4 |
| 2034 | 10.56 | 9.54 | 1,007,917 | 96,155 | 106,436 | (10,281) | 54,117 | 935,467 | 8.4 |
| 2035 | 10.58 | 9.54 | 1,047,401 | 99,922 | 110,853 | (10,931) | 56,734 | 981,270 | 8.5 |
| 2036 | 10.63 | 9.54 | 1,085,658 | 103,572 | 115,370 | (11,798) | 59,466 | 1,028,938 | 8.6 |
| 2037 | 10.66 | 9.54 | 1,125,623 | 107,384 | 119,977 | (12,592) | 62,319 | 1,078,665 | 8.7 |
| 2038 | 10.68 | 9.54 | 1,167,224 | 111,353 | 124,669 | (13,316) | 65,301 | 1,130,650 | 8.7 |
| 2039 | 10.70 | 9.54 | 1,210,287 | 115,461 | 129,478 | (14,017) | 68,410 | 1,185,043 | 8.8 |
| 2040 | 10.72 | 9.54 | 1,254,280 | 119,658 | 134,439 | (14,781) | 71,689 | 1,241,951 | 8.9 |
| 2041 | 10.74 | 9.54 | 1,299,423 | 123,965 | 139,577 | (15,612) | 75,116 | 1,301,456 | 9.0 |
| 2042 | 10.76 | 9.54 | 1,346,635 | 128,469 | 144,889 | (16,420) | 78,703 | 1,363,739 | 9.1 |
| 2043 | 10.77 | 9.54 | 1,396,342 | 133,211 | 150,409 | (17,198) | 82,480 | 1,429,020 | 9.2 |
| 2044 | 10.79 | 9.54 | 1,446,964 | 138,040 | 156,167 | (18,127) | 86,419 | 1,497,312 | 9.2 |
| 2045 | 10.82 | 9.54 | 1,499,428 | 143,045 | 162,197 | (19,151) | 90,534 | 1,568,695 | 9.3 |
| 2046 | 10.85 | 9.54 | 1,553,431 | 148,197 | 168,516 | (20,319) | 94,833 | 1,643,209 | 9.4 |
| 2047 | 10.89 | 9.54 | 1,608,638 | 153,464 | 175,143 | (21,679) | 99,316 | 1,720,846 | 9.4 |
| 2048 | 10.93 | 9.54 | 1,666,000 | 158,936 | 182,108 | (23,171) | 103,984 | 1,801,659 | 9.5 |
| 2049 | 10.98 | 9.54 | 1,724,766 | 164,543 | 189,435 | (24,892) | 108,840 | 1,885,607 | 9.6 |
| 2050 | 11.05 | 9.54 | 1,784,712 | 170,262 | 197,151 | (26,889) | 113,876 | 1,972,593 | 9.6 |
| 2051 | 11.12 | 9.54 | 1,846,030 | 176,111 | 205,269 | (29,158) | 119,089 | 2,062,524 | 9.6 |
| 2052 | 11.19 | 9.54 | 1,909,767 | 182,192 | 213,791 | (31,599) | 124,476 | 2,155,401 | 9.7 |
| 2053 | 11.28 | 9.54 | 1,974,826 | 188,398 | 222,722 | (34,324) | 130,034 | 2,251,112 | 9.7 |
| 2054 | 11.37 | 9.54 | 2,040,986 | 194,710 | 232,103 | (37,393) | 135,754 | 2,349,473 | 9.7 |
| 2055 | 11.48 | 9.54 | 2,108,096 | 201,112 | 241,987 | (40,875) | 141,622 | 2,450,220 | 9.7 |
| 2060 | 12.06 | 9.54 | 2,474,655 | 236,082 | 298,489 | (62,407) | 172,854 | 2,984,644 | 9.6 |
| 2065 | 12.60 | 9.54 | 2,903,032 | 276,949 | 365,685 | (88,736) | 206,531 | 3,558,899 | 9.4 |
| 2070 | 12.91 | 9.54 | 3,421,988 | 326,458 | 441,724 | (115,266) | 242,642 | 4,175,026 | 9.1 |
| 2075 | 13.04 | 9.54 | 4,051,490 | 386,512 | 528,466 | (141,954) | 282,104 | 4,848,978 | 8.9 |
| 2080 | 13.07 | 9.54 | 4,803,930 | 458,295 | 628,102 | (169,807) | 325,822 | 5,596,049 | 8.6 |
| 2084 | 13.04 | 9.54 | 5,506,585 | 525,328 | 718,260 | (192,931) | 364,577 | 6,258,813 | 8.4 |
| 2085 | 13.03 | 9.54 | 5,697,857 | 543,576 | 742,661 | (199,085) | 374,859 | 6,434,587 | 8.4 |
| 2090 | 13.04 | 9.54 | 6,744,599 | 643,435 | 879,465 | (236,030) | 429,733 | 7,370,234 | 8.1 |
| 2095 | 13.15 | 9.54 | 7,958,860 | 759,275 | 1,046,375 | (287,099) | 488,645 | 8,367,616 | 7.7 |
| 2100 | 13.29 | 9.54 | 9,379,076 | 894,764 | 1,246,767 | (352,003) | 548,051 | 9,364,140 | 7.3 |
|
Table 14 Footnotes
|
|||||||||
Table 15 shows the progression of the MCR over time under the best-estimate assumptions of this report.
As shown in Table 15, the MCR is relatively stable over the periods considered. If the best-estimate assumptions of this report are realized, the MCR will increase between 0.01% and 0.05% for each of the next four reports and will remain below the legislated contribution rate of 9.9%. Thus, the current legislated contribution rate is projected to be sufficient over subsequent reports as long as the best-estimate assumptions remain the same and base Plan experience does not deviate materially from the assumptions.
| Valuation Year Table 15 Footnote 1 | Steady-State Target Years Table 15 Footnote 2 | Steady-State Target A/E Ratio Table 15 Footnote 3 | Steady-State Contribution Rate Table 15 Footnote 4 | Full Funding Rate Table 15 Footnote 5 | Minimum Contribution Rate (MCR) Table 15 Footnote 6 | Average PayGo Rate Over Target Years Period | ||
|---|---|---|---|---|---|---|---|---|
| Prior to 2034 | 2034+ | Prior to 2034 | 2034+ | |||||
| 2021 | 2034 and 2084 | 8.5 | 9.53% | 0.03% | 0.01% | 9.56% | 9.54% | 11.9 |
| 2024 | 2037 and 2087 | 8.8 | 9.54% | 0.03% | 0.01% | 9.57% | 9.55% | 12.0 |
| 2027 | 2040 and 2090 | 9.2 | 9.56% | 0.02% | 0.01% | 9.58% | 9.57% | 12.2 |
| 2030 | 2043 and 2093 | 9.6 | 9.60% | N/A | N/A Table 15 Footnote 7 | N/A | 9.60% | 12.3 |
| 2033 | 2046 and 2096 | 10.0 | 9.62% | N/A | N/A | N/A | 9.62% | 12.5 |
|
Table 15 Footnotes
|
||||||||
6 Results – Additional CPP
6.1 Overview
The key observations and findings of the actuarial projections of the financial state of the additional CPP presented in this report are as follows.
- With the legislated first and second additional contribution rates of 2.0% for 2023 and thereafter and 8.0% for 2024 and thereafter, respectively, contributions to the additional CPP are projected to be higher than expenditures up to the year 2057 inclusive. Thereafter, a portion of investment income is required to make up the difference between contributions and expenditures.
- With the legislated first and second additional contribution rates of 2.0% for 2023 and thereafter and 8.0% for 2024 and thereafter, total assets are expected to increase rapidly over the first several decades as contributions are projected to exceed expenditures. The additional CPP assets are projected to grow from $11 billion at the end of 2021 to $200 billion by 2030, $1.4 trillion by 2050, and $12 trillion by 2100. The ratio of assets to the following year’s expenditures is projected to increase rapidly until 2026 and then decrease after that, reaching a level of about 26 by 2080 and remaining close to that level for the years following up to 2100.
- Due to the financing approach of the additional Plan, as it matures, investment income will become the major source of revenues of the additional Plan. With the legislated first and second additional contribution rates of 2.0% for 2023 and thereafter and 8.0% for 2024 and thereafter, investment income is projected to represent about 50% of revenues (i.e. contributions and investment income) by 2040. This proportion is expected to continue increasing to about 61% of revenues by 2050 and 73% of revenues by 2100.
- The first additional minimum contribution rate (FAMCR) applicable to pensionable earnings between the YBE and YMPE is 1.97% for the year 2025 and thereafter. The second additional minimum contribution rate (SAMCR) applicable to pensionable earnings above the YMPE up to the YAMPE is 7.88% for the year 2025 and thereafter.
- Under the FAMCR and SAMCR of 1.97% and 7.88%, respectively, for 2025 and thereafter, the additional CPP open group assets represent 105% of its open group actuarial obligations as at 31 December 2021, and the ratio of invested assets to expenditures stabilizes at a value of 24 for the target years 2088 and 2098.
- The AMCRs determined for this report are slightly lower than the AMCRs of 1.98% and 7.92% determined under the 30th CPP Actuarial Report due to experience over the period 2019 to 2021 as well as changes in assumptions.
- The number of contributors to the additional CPP is the same as to the base CPP, since an individual cannot contribute to the additional Plan without also contributing to the base Plan. Under the legislated first and second additional contribution rates of 2.0% and 8.0%, respectively, additional contributions are expected to increase from $9.3 billion in 2022 to $22 billion in 2030, $45 billion in 2050, and $237 billion by 2100.
- The number of beneficiaries of additional retirement benefits is expected to increase from 0.8 million in 2022 to 1.7 million in 2025, 8.9 million in 2050, and to continue increasing thereafter.
- Total additional CPP expenditures are expected to steadily grow over time as the additional Plan matures and individuals accrue benefits. Total additional CPP expenditures are projected to increase from approximately $287 million in 2022 to $2.0 billion in 2030, $29 billion in 2050, and $446 billion by 2100.
6.2 Contributions
Projected additional contributions are the product of the additional contribution rates, the number of contributors, and the average first and second additional contributory earnings. The first and second additional contribution rates for the additional CPP are set by law and are 2.0% for 2023 and thereafter and 8.0% for 2024 and thereafter. The first additional contribution rate is phased in over the period 2019 to 2023 as: 0.3%, 0.6%, 1.0%, 1.5%, and 2.0%, and the second tier of the additional Plan starts in 2024.
Table 16 presents the projected number of contributors to the additional CPP, including retirement beneficiaries who receive retirement benefits and are working (working beneficiaries), their additional contributory earnings, and additional contributions.
As all contributors to the additional Plan are contributors to the base Plan, the number of contributors to the additional Plan is linked to the same assumed labour force participation rates applied to the working-age population and the job creation rates as for the base Plan. The number of working beneficiaries who are contributors is derived from the number of retirement beneficiaries in pay.
The additional contributory earnings relating to the first tier of the additional CPP are the same as the base CPP contributory earnings (pensionable earnings between the YBE and YMPE). As such, the projected total first additional contributory earnings shown in Table 16 are the same as the projected total base CPP contributory earnings shown in Table 4.
The second additional contributory earnings relating to pensionable earnings above the YMPE up to the YAMPE are based on the assumed annual increases in wages and the assumed proportion of individuals with pensionable earnings between the YMPE and YAMPE.
As shown in Table 16, total contributions to the additional CPP are expected to be $9.3 billion in 2022 and then are projected to increase to about $13 billion in 2023 following the phase-in of the first additional contribution rate. The total additional contributions are projected to reach $18 billion by 2025, following the full phase-in of the additional CPP. Thereafter, total contributions to the additional Plan are projected to continue increasing, reaching $22 billion in 2030, $45 billion in 2050, and $237 billion by 2100.
The projected YMPE and YAMPE are also shown, which are assumed to increase according to increases in the average weekly earnings assumption, with the YAMPE equal to 107% of the YMPE in 2024 and 114% of the YMPE from 2025 onward (rounded down to the nearest $100). The YMPE for 2023 reflects actual data up to April 2022. The YAMPE is projected to be $74,000 initially in 2024 and to then increase to $93,700 in 2030, $165,900 in 2050 and $693,300 by 2100.
After the end of the phase-in period in 2025, the first and second additional contributions to the additional CPP increase at the same rate as the first and second additional contributory earnings, respectively, throughout the projection period. This growth is reflected in the projected total additional contributions.
| Year | First Additional Contribution Rate (%) | Second Additional Contribution Rate (%) | YMPE ($) | YAMPE ($) | Number of Contributors (thousands) | First Additional Contributory Earnings ($ million) | Second Additional Contributory Earnings ($ million) | Additional Contributions ($ million) |
|---|---|---|---|---|---|---|---|---|
| 2022 | 1.5 | nil- | 64,900 | nil- | 15,235 | 616,668 | nil- | 9,250 |
| 2023 | 2.0 | nil- | 66,900 | nil- | 15,534 | 648,785 | nil- | 12,976 |
| 2024 | 2.0 | 8.0 | 69,200 | 74,000 | 15,751 | 680,189 | 24,669 | 15,577 |
| 2025 | 2.0 | 8.0 | 71,200 | 81,100 | 15,959 | 710,485 | 49,554 | 18,174 |
| 2026 | 2.0 | 8.0 | 73,300 | 83,500 | 16,114 | 739,632 | 51,488 | 18,912 |
| 2027 | 2.0 | 8.0 | 75,400 | 85,900 | 16,264 | 769,230 | 53,505 | 19,665 |
| 2028 | 2.0 | 8.0 | 77,600 | 88,400 | 16,419 | 800,229 | 55,539 | 20,448 |
| 2029 | 2.0 | 8.0 | 79,900 | 91,000 | 16,566 | 832,186 | 57,535 | 21,247 |
| 2030 | 2.0 | 8.0 | 82,200 | 93,700 | 16,708 | 864,552 | 60,075 | 22,097 |
| 2035 | 2.0 | 8.0 | 94,800 | 108,000 | 17,464 | 1,047,401 | 71,771 | 26,690 |
| 2040 | 2.0 | 8.0 | 109,400 | 124,700 | 18,057 | 1,254,280 | 85,518 | 31,927 |
| 2045 | 2.0 | 8.0 | 126,200 | 143,800 | 18,686 | 1,499,428 | 101,433 | 38,103 |
| 2050 | 2.0 | 8.0 | 145,600 | 165,900 | 19,263 | 1,784,712 | 120,070 | 45,300 |
| 2055 | 2.0 | 8.0 | 168,000 | 191,500 | 19,687 | 2,108,096 | 141,425 | 53,476 |
| 2060 | 2.0 | 8.0 | 193,800 | 220,900 | 19,992 | 2,474,655 | 165,270 | 62,715 |
| 2065 | 2.0 | 8.0 | 223,600 | 254,900 | 20,289 | 2,903,032 | 193,282 | 73,523 |
| 2070 | 2.0 | 8.0 | 258,000 | 294,100 | 20,699 | 3,421,988 | 226,782 | 86,582 |
| 2080 | 2.0 | 8.0 | 343,300 | 391,300 | 21,805 | 4,803,930 | 316,670 | 121,412 |
| 2090 | 2.0 | 8.0 | 457,000 | 520,900 | 22,975 | 6,744,599 | 442,520 | 170,294 |
| 2100 | 2.0 | 8.0 | 608,200 | 693,300 | 23,973 | 9,379,076 | 614,085 | 236,708 |
6.3 Expenditures
Under the additional CPP, there are only earnings-related benefits. There are no flat-rate components to the additional disability and survivor benefits, and no additional flat-rate children’s or death benefits.
The projected number of additional CPP beneficiaries by type of benefit is given in Table 17, while Table 18 presents information for male and female beneficiaries separately. The number of additional retirement beneficiaries increases over time as the number of contributors reaching age 60 (earliest retirement age) and over with at least one valid contribution to the additional CPP increases. The total number of retirement beneficiaries receiving additional retirement benefits is projected to increase from an estimated 819,000 in 2022 to 3.2 million in 2030, 8.9 million in 2050, and 15.3 million by 2100.
The total number of disability and survivor beneficiaries receiving additional benefits increases over time as well. Since eligibility to these benefits is harmonized between the base and additional CPP, all new disability and survivor beneficiaries of the base CPP are also entitled to additional benefits as long as they (in the case of disability beneficiaries) and their deceased partners (in the case of survivor beneficiaries) had made at least one contribution to the additional Plan. The total number of disability beneficiaries receiving additional benefits is projected to increase from an estimated 85,000 in 2022 to 258,000 in 2030, 546,000 in 2050, and 698,000 by 2100. The total number of survivor beneficiaries receiving additional benefits is projected to increase from about 85,000 in 2022 to 362,000 in 2030, 1.6 million in 2050, and 2.5 million by 2100.
| Year | Retirement Table 17 Footnote 2, Table 17 Footnote 3, Table 17 Footnote 4 | Disability Table 17 Footnote 5 | Survivor Table 17 Footnote 4, Table 17 Footnote 5 |
|---|---|---|---|
| 2022 | 819 | 85 | 85 |
| 2023 | 1,088 | 107 | 111 |
| 2024 | 1,373 | 130 | 140 |
| 2025 | 1,674 | 153 | 171 |
| 2026 | 1,979 | 177 | 205 |
| 2027 | 2,274 | 199 | 240 |
| 2028 | 2,571 | 220 | 278 |
| 2029 | 2,870 | 239 | 319 |
| 2030 | 3,174 | 258 | 362 |
| 2035 | 4,737 | 351 | 628 |
| 2040 | 6,219 | 432 | 952 |
| 2045 | 7,607 | 500 | 1,296 |
| 2050 | 8,926 | 546 | 1,601 |
| 2055 | 10,125 | 571 | 1,833 |
| 2060 | 11,189 | 575 | 1,996 |
| 2065 | 12,042 | 571 | 2,120 |
| 2070 | 12,652 | 585 | 2,232 |
| 2080 | 13,551 | 623 | 2,446 |
| 2090 | 14,266 | 674 | 2,554 |
| 2100 | 15,260 | 698 | 2,545 |
|
Table 17 Footnotes
|
|||
| Year | Males | Females | ||||
|---|---|---|---|---|---|---|
| Retirement Table 18 Footnote 2, Table 18 Footnote 3, Table 18 Footnote 4 | Disability Table 18 Footnote 5 | Survivor Table 18 Footnote 4, Table 18 Footnote 5 | Retirement Table 18 Footnote 2, Table 18 Footnote 3, Table 18 Footnote 4 | Disability Table 18 Footnote 5 | Survivor Table 18 Footnote 4, Table 18 Footnote 5 | |
| 2022 | 427 | 41 | 27 | 392 | 44 | 58 |
| 2023 | 566 | 51 | 36 | 522 | 55 | 75 |
| 2024 | 712 | 62 | 45 | 661 | 68 | 95 |
| 2025 | 866 | 73 | 55 | 809 | 81 | 116 |
| 2026 | 1,020 | 83 | 66 | 960 | 94 | 139 |
| 2027 | 1,168 | 93 | 77 | 1,106 | 106 | 163 |
| 2028 | 1,316 | 102 | 89 | 1,255 | 118 | 189 |
| 2029 | 1,464 | 111 | 101 | 1,406 | 129 | 217 |
| 2030 | 1,613 | 118 | 114 | 1,561 | 140 | 248 |
| 2035 | 2,351 | 155 | 191 | 2,386 | 195 | 437 |
| 2040 | 3,021 | 188 | 272 | 3,198 | 244 | 680 |
| 2045 | 3,629 | 217 | 344 | 3,978 | 284 | 952 |
| 2050 | 4,205 | 236 | 398 | 4,720 | 310 | 1,203 |
| 2055 | 4,740 | 246 | 437 | 5,385 | 325 | 1,396 |
| 2060 | 5,234 | 246 | 464 | 5,955 | 329 | 1,532 |
| 2065 | 5,636 | 242 | 488 | 6,407 | 329 | 1,632 |
| 2070 | 5,909 | 248 | 509 | 6,743 | 337 | 1,723 |
| 2080 | 6,296 | 265 | 537 | 7,255 | 358 | 1,909 |
| 2090 | 6,610 | 287 | 540 | 7,655 | 387 | 2,014 |
| 2100 | 7,090 | 297 | 536 | 8,170 | 401 | 2,009 |
|
Table 18 Footnotes
|
||||||
Table 19 shows the amount of projected additional CPP expenditures by type. Projected additional benefit expenditures are low over the first few years of the additional Plan as additional benefits start to accrue. As higher additional benefits become payable to a greater number of beneficiaries, projected additional expenditures will increase to reach $2.0 billion in 2030, $29 billion in 2050, and $446 billion by 2100. Table 20 presents the same information but in 2022 constant dollars.
| Year | Retirement Table 19 Footnote 1 | Disability | Survivor | Operating Expenses Table 19 Footnote 2 | Total |
|---|---|---|---|---|---|
| 2022 | 60 | 2 | 1 | 224 | 287 |
| 2023 | 119 | 5 | 2 | 252 | 377 |
| 2024 | 209 | 10 | 3 | 279 | 502 |
| 2025 | 325 | 18 | 5 | 291 | 640 |
| 2026 | 473 | 29 | 8 | 302 | 813 |
| 2027 | 659 | 44 | 13 | 313 | 1,030 |
| 2028 | 890 | 63 | 18 | 325 | 1,297 |
| 2029 | 1,166 | 86 | 25 | 337 | 1,615 |
| 2030 | 1,485 | 113 | 34 | 349 | 1,982 |
| 2031 | 1,853 | 143 | 45 | 362 | 2,403 |
| 2032 | 2,276 | 178 | 58 | 375 | 2,888 |
| 2033 | 2,765 | 217 | 73 | 389 | 3,444 |
| 2034 | 3,324 | 261 | 92 | 403 | 4,080 |
| 2035 | 3,951 | 310 | 114 | 418 | 4,792 |
| 2036 | 4,646 | 362 | 139 | 432 | 5,580 |
| 2037 | 5,413 | 420 | 168 | 447 | 6,448 |
| 2038 | 6,254 | 482 | 201 | 463 | 7,400 |
| 2039 | 7,178 | 550 | 240 | 479 | 8,446 |
| 2040 | 8,196 | 623 | 283 | 496 | 9,598 |
| 2041 | 9,319 | 701 | 333 | 513 | 10,866 |
| 2042 | 10,555 | 784 | 388 | 531 | 12,258 |
| 2043 | 11,913 | 872 | 451 | 550 | 13,786 |
| 2044 | 13,407 | 965 | 521 | 570 | 15,463 |
| 2045 | 15,051 | 1,062 | 601 | 590 | 17,303 |
| 2046 | 16,857 | 1,163 | 689 | 610 | 19,319 |
| 2047 | 18,836 | 1,267 | 786 | 632 | 21,521 |
| 2048 | 20,999 | 1,374 | 895 | 654 | 23,922 |
| 2049 | 23,358 | 1,486 | 1,015 | 677 | 26,535 |
| 2050 | 25,924 | 1,600 | 1,146 | 700 | 29,370 |
| 2051 | 28,713 | 1,715 | 1,291 | 723 | 32,442 |
| 2052 | 31,728 | 1,832 | 1,448 | 748 | 35,756 |
| 2053 | 34,977 | 1,949 | 1,620 | 772 | 39,318 |
| 2054 | 38,477 | 2,066 | 1,806 | 798 | 43,147 |
| 2055 | 42,250 | 2,180 | 2,008 | 823 | 47,261 |
| 2060 | 65,031 | 2,692 | 3,265 | 962 | 71,950 |
| 2065 | 92,923 | 3,111 | 5,000 | 1,124 | 102,158 |
| 2070 | 123,272 | 3,647 | 7,294 | 1,317 | 135,530 |
| 2075 | 156,308 | 4,349 | 10,202 | 1,555 | 172,414 |
| 2080 | 192,714 | 5,191 | 13,702 | 1,839 | 213,446 |
| 2085 | 232,804 | 6,267 | 17,642 | 2,176 | 258,889 |
| 2090 | 279,137 | 7,529 | 21,786 | 2,570 | 311,022 |
| 2095 | 335,014 | 8,842 | 25,964 | 3,029 | 372,848 |
| 2100 | 401,761 | 10,353 | 30,283 | 3,563 | 445,961 |
|
Table 19 Footnotes
|
|||||
| Year | Retirement Table 20 Footnote 2 | Disability | Survivor | Operating Expenses Table 20 Footnote 3 | Total |
|---|---|---|---|---|---|
| 2022 | 60 | 2 | 1 | 224 | 287 |
| 2023 | 116 | 5 | 2 | 245 | 366 |
| 2024 | 198 | 9 | 3 | 264 | 475 |
| 2025 | 301 | 17 | 5 | 270 | 593 |
| 2026 | 430 | 26 | 7 | 274 | 738 |
| 2027 | 587 | 39 | 12 | 279 | 917 |
| 2028 | 777 | 55 | 16 | 284 | 1,132 |
| 2029 | 998 | 74 | 21 | 288 | 1,382 |
| 2030 | 1,246 | 95 | 29 | 293 | 1,663 |
| 2031 | 1,524 | 118 | 37 | 298 | 1,977 |
| 2032 | 1,835 | 144 | 47 | 302 | 2,329 |
| 2033 | 2,186 | 172 | 58 | 308 | 2,723 |
| 2034 | 2,577 | 202 | 71 | 312 | 3,163 |
| 2035 | 3,002 | 236 | 87 | 318 | 3,642 |
| 2036 | 3,461 | 270 | 104 | 322 | 4,157 |
| 2037 | 3,954 | 307 | 123 | 326 | 4,710 |
| 2038 | 4,478 | 345 | 144 | 332 | 5,299 |
| 2039 | 5,039 | 386 | 168 | 336 | 5,930 |
| 2040 | 5,641 | 429 | 195 | 341 | 6,606 |
| 2041 | 6,288 | 473 | 225 | 346 | 7,332 |
| 2042 | 6,983 | 519 | 257 | 351 | 8,109 |
| 2043 | 7,727 | 566 | 293 | 357 | 8,942 |
| 2044 | 8,525 | 614 | 331 | 362 | 9,833 |
| 2045 | 9,383 | 662 | 375 | 368 | 10,787 |
| 2046 | 10,303 | 711 | 421 | 373 | 11,807 |
| 2047 | 11,287 | 759 | 471 | 379 | 12,895 |
| 2048 | 12,336 | 807 | 526 | 384 | 14,053 |
| 2049 | 13,453 | 856 | 585 | 390 | 15,282 |
| 2050 | 14,638 | 903 | 647 | 395 | 16,583 |
| 2051 | 15,895 | 949 | 715 | 400 | 17,959 |
| 2052 | 17,219 | 994 | 786 | 406 | 19,405 |
| 2053 | 18,610 | 1,037 | 862 | 411 | 20,920 |
| 2054 | 20,071 | 1,078 | 942 | 416 | 22,507 |
| 2055 | 21,607 | 1,115 | 1,027 | 421 | 24,170 |
| 2060 | 30,122 | 1,247 | 1,512 | 446 | 33,327 |
| 2065 | 38,984 | 1,305 | 2,098 | 472 | 42,859 |
| 2070 | 46,842 | 1,386 | 2,772 | 500 | 51,500 |
| 2075 | 53,796 | 1,497 | 3,511 | 535 | 59,339 |
| 2080 | 60,073 | 1,618 | 4,271 | 573 | 66,536 |
| 2085 | 65,729 | 1,769 | 4,981 | 614 | 73,094 |
| 2090 | 71,381 | 1,925 | 5,571 | 657 | 79,534 |
| 2095 | 77,594 | 2,048 | 6,014 | 702 | 86,357 |
| 2100 | 84,281 | 2,172 | 6,353 | 747 | 93,553 |
|
Table 20 Footnotes
|
|||||
6.4 Financial Projections with Legislated Additional Contribution Rates
Table 21 and Table 22 present the projected financial state of the additional CPP using the legislated first and second additional contribution rates of 2.0% and 8.0% in current dollars and in 2022 constant dollars, respectively. Historical results up to 31 December 2021 are also shown. The projected financial state of the additional CPP using the FAMCR and SAMCR of 1.97% and 7.88%, respectively is discussed in the next section 6.5.
The market value of additional CPP assets is $11 billion as at 31 December 2021. Additional CPP assets are projected to decrease in 2022 due to the market downturn observed in the first half of 2022 and assumed continued volatility for the remainder of 2022.
Under the legislated additional contribution rates, additional contributions are projected to be higher than additional expenditures up to the year 2057 inclusive. Over that period, the additional assets are therefore projected to grow rapidly, from $11 billion at the end of 2021 to $200 billion by 2030, $1.4 trillion by 2050, and $12 trillion by 2100.
In comparison with Table 11, additional CPP assets are projected to be 62% of base CPP assets by 2050, and this percentage is expected to increase to 70% by 2100.
| Year | First / Second Additional Contribution Rates Table 21 Footnote 1 (%) | First Additional Contributory Earnings ($ million) | Second Additional Contributory Earnings ($ million) | Contributions ($ million) | Expenditures ($ million) | Net Cash Flows ($ million) | Net Investment Income Table 21 Footnote 2 ($ million) | Assets at 31 Dec. ($ million) | Net Rate of Return Table 21 Footnote 2 (%) | Assets/ Expenditures Ratio |
|---|---|---|---|---|---|---|---|---|---|---|
| Historical Results: | ||||||||||
| 2019 | 0.3 | 533,626 | 0 | 1,601 | 130 | 1,471 | 62 | 1,533 | 5.61 | 8.1 |
| 2020 | 0.6 | 532,930 | 0 | 3,198 | 189 | 3,009 | 370 | 4,912 | 10.84 | 24.5 |
| 2021 | 1.0 | 568,840 | 0 | 5,688 | 201 | 5,488 | 645 | 11,045 | 4.75 | 38.5 |
| Projections: | ||||||||||
| 2022 | 1.5 | 616,668 | 0 | 9,250 | 287 | 8,963 | (1,249) | 18,758 | (7.72) | 49.7 |
| 2023 | 2.0 | 648,785 | 0 | 12,976 | 377 | 12,598 | 1,256 | 32,612 | 4.87 | 65.0 |
| 2024 | 2.0 / 8.0 | 680,189 | 24,669 | 15,577 | 502 | 15,076 | 2,042 | 49,730 | 4.98 | 77.8 |
| 2025 | 2.0 / 8.0 | 710,485 | 49,554 | 18,174 | 640 | 17,534 | 3,011 | 70,275 | 5.06 | 86.5 |
| 2026 | 2.0 / 8.0 | 739,632 | 51,488 | 18,912 | 813 | 18,099 | 4,131 | 92,505 | 5.14 | 89.8 |
| 2027 | 2.0 / 8.0 | 769,230 | 53,505 | 19,665 | 1,030 | 18,635 | 5,337 | 116,477 | 5.19 | 89.8 |
| 2028 | 2.0 / 8.0 | 800,229 | 55,539 | 20,448 | 1,297 | 19,151 | 6,601 | 142,229 | 5.19 | 88.0 |
| 2029 | 2.0 / 8.0 | 832,186 | 57,535 | 21,247 | 1,615 | 19,631 | 8,024 | 169,884 | 5.24 | 85.7 |
| 2030 | 2.0 / 8.0 | 864,552 | 60,075 | 22,097 | 1,982 | 20,115 | 9,564 | 199,564 | 5.28 | 83.0 |
| 2031 | 2.0 / 8.0 | 898,197 | 62,116 | 22,933 | 2,403 | 20,530 | 11,154 | 231,248 | 5.28 | 80.1 |
| 2032 | 2.0 / 8.0 | 933,295 | 64,289 | 23,809 | 2,888 | 20,921 | 12,944 | 265,113 | 5.32 | 77.0 |
| 2033 | 2.0 / 8.0 | 969,910 | 66,948 | 24,754 | 3,444 | 21,310 | 15,586 | 302,008 | 5.62 | 74.0 |
| 2034 | 2.0 / 8.0 | 1,007,917 | 69,114 | 25,687 | 4,080 | 21,608 | 17,673 | 341,289 | 5.62 | 71.2 |
| 2035 | 2.0 / 8.0 | 1,047,401 | 71,771 | 26,690 | 4,792 | 21,898 | 19,894 | 383,080 | 5.62 | 68.7 |
| 2036 | 2.0 / 8.0 | 1,085,658 | 74,256 | 27,654 | 5,580 | 22,074 | 22,253 | 427,407 | 5.62 | 66.3 |
| 2037 | 2.0 / 8.0 | 1,125,623 | 76,918 | 28,666 | 6,448 | 22,218 | 24,755 | 474,379 | 5.62 | 64.1 |
| 2038 | 2.0 / 8.0 | 1,167,224 | 79,614 | 29,714 | 7,400 | 22,313 | 27,403 | 524,096 | 5.62 | 62.0 |
| 2039 | 2.0 / 8.0 | 1,210,287 | 82,306 | 30,790 | 8,446 | 22,344 | 30,205 | 576,645 | 5.62 | 60.1 |
| 2040 | 2.0 / 8.0 | 1,254,280 | 85,518 | 31,927 | 9,598 | 22,329 | 33,165 | 632,139 | 5.62 | 58.2 |
| 2041 | 2.0 / 8.0 | 1,299,423 | 88,221 | 33,046 | 10,866 | 22,180 | 36,287 | 690,606 | 5.62 | 56.3 |
| 2042 | 2.0 / 8.0 | 1,346,635 | 91,652 | 34,265 | 12,258 | 22,007 | 39,577 | 752,190 | 5.62 | 54.6 |
| 2043 | 2.0 / 8.0 | 1,396,342 | 94,507 | 35,487 | 13,786 | 21,701 | 43,038 | 816,929 | 5.62 | 52.8 |
| 2044 | 2.0 / 8.0 | 1,446,964 | 98,023 | 36,781 | 15,463 | 21,318 | 46,675 | 884,922 | 5.62 | 51.1 |
| 2045 | 2.0 / 8.0 | 1,499,428 | 101,433 | 38,103 | 17,303 | 20,800 | 50,491 | 956,213 | 5.62 | 49.5 |
| 2046 | 2.0 / 8.0 | 1,553,431 | 104,868 | 39,458 | 19,319 | 20,139 | 54,490 | 1,030,842 | 5.62 | 47.9 |
| 2047 | 2.0 / 8.0 | 1,608,638 | 108,996 | 40,892 | 21,521 | 19,371 | 58,674 | 1,108,886 | 5.62 | 46.4 |
| 2048 | 2.0 / 8.0 | 1,666,000 | 112,501 | 42,320 | 23,922 | 18,398 | 63,044 | 1,190,329 | 5.62 | 44.9 |
| 2049 | 2.0 / 8.0 | 1,724,766 | 116,552 | 43,819 | 26,535 | 17,285 | 67,603 | 1,275,216 | 5.62 | 43.4 |
| 2050 | 2.0 / 8.0 | 1,784,712 | 120,070 | 45,300 | 29,370 | 15,930 | 72,349 | 1,363,494 | 5.62 | 42.0 |
| 2051 | 2.0 / 8.0 | 1,846,030 | 124,142 | 46,852 | 32,442 | 14,410 | 77,281 | 1,455,185 | 5.62 | 40.7 |
| 2052 | 2.0 / 8.0 | 1,909,767 | 128,148 | 48,447 | 35,756 | 12,692 | 82,401 | 1,550,278 | 5.62 | 39.4 |
| 2053 | 2.0 / 8.0 | 1,974,826 | 132,729 | 50,115 | 39,318 | 10,797 | 87,708 | 1,648,783 | 5.62 | 38.2 |
| 2054 | 2.0 / 8.0 | 2,040,986 | 136,795 | 51,763 | 43,147 | 8,617 | 93,199 | 1,750,598 | 5.62 | 37.0 |
| 2055 | 2.0 / 8.0 | 2,108,096 | 141,425 | 53,476 | 47,261 | 6,215 | 98,871 | 1,855,685 | 5.62 | 35.9 |
| 2060 | 2.0 / 8.0 | 2,474,655 | 165,270 | 62,715 | 71,950 | (9,235) | 129,839 | 2,428,147 | 5.62 | 31.3 |
| 2065 | 2.0 / 8.0 | 2,903,032 | 193,282 | 73,523 | 102,158 | (28,635) | 165,027 | 3,077,591 | 5.62 | 28.3 |
| 2070 | 2.0 / 8.0 | 3,421,988 | 226,782 | 86,582 | 135,530 | (48,948) | 205,013 | 3,816,454 | 5.62 | 26.8 |
| 2075 | 2.0 / 8.0 | 4,051,490 | 267,639 | 102,441 | 172,414 | (69,973) | 251,121 | 4,669,652 | 5.62 | 25.9 |
| 2080 | 2.0 / 8.0 | 4,803,930 | 316,670 | 121,412 | 213,446 | (92,034) | 304,991 | 5,667,826 | 5.62 | 25.5 |
| 2085 | 2.0 / 8.0 | 5,697,857 | 374,669 | 143,931 | 258,889 | (114,958) | 368,765 | 6,851,257 | 5.62 | 25.5 |
| 2090 | 2.0 / 8.0 | 6,744,599 | 442,520 | 170,294 | 311,022 | (140,728) | 445,078 | 8,268,331 | 5.62 | 25.6 |
| 2095 | 2.0 / 8.0 | 7,958,860 | 522,020 | 200,939 | 372,848 | (171,909) | 536,555 | 9,966,936 | 5.62 | 25.8 |
| 2100 | 2.0 / 8.0 | 9,379,076 | 614,085 | 236,708 | 445,961 | (209,252) | 646,104 | 12,001,190 | 5.62 | 26.0 |
|
Table 21 Footnotes
|
||||||||||
| Year | First / Second Additional Contribution Rates Table 22 Footnote 2 (%) | First Additional Contributory Earnings ($ million) | Second Additional Contributory Earnings ($ million) | Contributions ($ million) | Expenditures ($ million) | Net Cash Flows ($ million) | Net Investment Income Table 22 Footnote 3 ($ million) | Assets at 31 Dec. ($ million) |
|---|---|---|---|---|---|---|---|---|
| 2022 | 1.5 | 616,668 | 0 | 9,250 | 287 | 8,963 | (1,249) | 18,758 |
| 2023 | 2.0 | 629,888 | 0 | 12,598 | 366 | 12,231 | 1,219 | 31,662 |
| 2024 | 2.0 / 8.0 | 644,270 | 23,366 | 14,755 | 475 | 14,280 | 1,934 | 47,104 |
| 2025 | 2.0 / 8.0 | 658,158 | 45,904 | 16,836 | 592 | 16,243 | 2,789 | 65,099 |
| 2026 | 2.0 / 8.0 | 671,724 | 46,761 | 17,175 | 738 | 16,437 | 3,752 | 84,012 |
| 2027 | 2.0 / 8.0 | 684,907 | 47,640 | 17,509 | 917 | 16,592 | 4,752 | 103,709 |
| 2028 | 2.0 / 8.0 | 698,537 | 48,481 | 17,849 | 1,132 | 16,717 | 5,762 | 124,155 |
| 2029 | 2.0 / 8.0 | 712,189 | 49,239 | 18,183 | 1,383 | 16,800 | 6,867 | 145,388 |
| 2030 | 2.0 / 8.0 | 725,380 | 50,404 | 18,540 | 1,663 | 16,877 | 8,025 | 167,439 |
| 2031 | 2.0 / 8.0 | 738,833 | 51,095 | 18,864 | 1,977 | 16,888 | 9,175 | 190,218 |
| 2032 | 2.0 / 8.0 | 752,651 | 51,845 | 19,201 | 2,329 | 16,872 | 10,438 | 213,799 |
| 2033 | 2.0 / 8.0 | 766,842 | 52,931 | 19,571 | 2,723 | 16,848 | 12,323 | 238,777 |
| 2034 | 2.0 / 8.0 | 781,266 | 53,573 | 19,911 | 3,163 | 16,749 | 13,699 | 264,543 |
| 2035 | 2.0 / 8.0 | 795,952 | 54,541 | 20,282 | 3,642 | 16,641 | 15,118 | 291,114 |
| 2036 | 2.0 / 8.0 | 808,848 | 55,323 | 20,603 | 4,157 | 16,446 | 16,579 | 318,431 |
| 2037 | 2.0 / 8.0 | 822,179 | 56,183 | 20,938 | 4,710 | 16,228 | 18,081 | 346,497 |
| 2038 | 2.0 / 8.0 | 835,848 | 57,011 | 21,278 | 5,299 | 15,978 | 19,624 | 375,305 |
| 2039 | 2.0 / 8.0 | 849,692 | 57,783 | 21,617 | 5,930 | 15,687 | 21,206 | 404,838 |
| 2040 | 2.0 / 8.0 | 863,311 | 58,861 | 21,975 | 6,607 | 15,369 | 22,827 | 435,096 |
| 2041 | 2.0 / 8.0 | 876,846 | 59,531 | 22,299 | 7,332 | 14,967 | 24,487 | 466,019 |
| 2042 | 2.0 / 8.0 | 890,887 | 60,634 | 22,668 | 8,110 | 14,559 | 26,183 | 497,623 |
| 2043 | 2.0 / 8.0 | 905,658 | 61,296 | 23,017 | 8,941 | 14,075 | 27,914 | 529,855 |
| 2044 | 2.0 / 8.0 | 920,089 | 62,330 | 23,388 | 9,833 | 13,556 | 29,679 | 562,700 |
| 2045 | 2.0 / 8.0 | 934,755 | 63,234 | 23,754 | 10,787 | 12,967 | 31,477 | 596,111 |
| 2046 | 2.0 / 8.0 | 949,432 | 64,094 | 24,116 | 11,808 | 12,309 | 33,303 | 630,034 |
| 2047 | 2.0 / 8.0 | 963,896 | 65,310 | 24,503 | 12,896 | 11,607 | 35,157 | 664,445 |
| 2048 | 2.0 / 8.0 | 978,694 | 66,089 | 24,861 | 14,053 | 10,808 | 37,035 | 699,260 |
| 2049 | 2.0 / 8.0 | 993,349 | 67,126 | 25,237 | 15,282 | 9,955 | 38,935 | 734,438 |
| 2050 | 2.0 / 8.0 | 1,007,719 | 67,796 | 25,578 | 16,584 | 8,994 | 40,851 | 769,883 |
| 2051 | 2.0 / 8.0 | 1,021,904 | 68,721 | 25,936 | 17,959 | 7,977 | 42,780 | 805,544 |
| 2052 | 2.0 / 8.0 | 1,036,457 | 69,548 | 26,293 | 19,405 | 6,888 | 44,720 | 841,357 |
| 2053 | 2.0 / 8.0 | 1,050,751 | 70,621 | 26,665 | 20,920 | 5,745 | 46,667 | 877,272 |
| 2054 | 2.0 / 8.0 | 1,064,659 | 71,358 | 27,002 | 22,507 | 4,495 | 48,616 | 913,182 |
| 2055 | 2.0 / 8.0 | 1,078,104 | 72,326 | 27,348 | 24,170 | 3,178 | 50,564 | 949,018 |
| 2060 | 2.0 / 8.0 | 1,146,263 | 76,553 | 29,050 | 33,327 | (4,278) | 60,142 | 1,124,720 |
| 2065 | 2.0 / 8.0 | 1,217,925 | 81,089 | 30,846 | 42,859 | (12,013) | 69,235 | 1,291,159 |
| 2070 | 2.0 / 8.0 | 1,300,308 | 86,174 | 32,900 | 51,500 | (18,599) | 77,902 | 1,450,200 |
| 2075 | 2.0 / 8.0 | 1,394,382 | 92,112 | 35,257 | 59,339 | (24,082) | 86,427 | 1,607,132 |
| 2080 | 2.0 / 8.0 | 1,497,486 | 98,713 | 37,847 | 66,536 | (28,689) | 95,072 | 1,766,781 |
| 2085 | 2.0 / 8.0 | 1,608,706 | 105,782 | 40,637 | 73,094 | (32,457) | 104,115 | 1,934,352 |
| 2090 | 2.0 / 8.0 | 1,724,728 | 113,161 | 43,547 | 79,534 | (35,987) | 113,815 | 2,114,376 |
| 2095 | 2.0 / 8.0 | 1,843,378 | 120,907 | 46,540 | 86,357 | (39,816) | 124,273 | 2,308,475 |
| 2100 | 2.0 / 8.0 | 1,967,536 | 128,822 | 49,657 | 93,553 | (43,897) | 135,539 | 2,517,602 |
|
Table 22 Footnotes
|
||||||||
Chart 2 shows projected revenues and expenditures of the additional CPP for the period 2022 to 2072 on a year 2022 constant dollar basis.
Table 23 shows the sources of the revenues (contributions and investment income) required to cover the additional CPP expenditures. With the growth in the additional assets, the importance of the investment income increases rapidly. By 2080, investment income is projected to represent about 72% of revenues of the additional CPP. The importance of investment income as a source of revenues is directly related to the financing approach of the additional CPP.
A strong reliance of the additional CPP on investment income as a source of revenues results in the additional contribution rates being much more sensitive to financial market environments than is the case for the base CPP. The sensitivity of the base and additional CPP to investment experience is examined in Appendix E of this report.
Table 23 also shows the projected additional CPP expenditures as a percentage of total additional revenues. This percentage is projected to increase as the additional Plan matures from about 4% in 2022 to 10% in 2035. It continues to grow but at decreasing pace, and stabilizes at about 51% by 2086.
Chart 2 Revenues and Expenditures - Additional CPP, 2.0%/8.0% legislated contribution rates (billions of 2022 constant dollars)
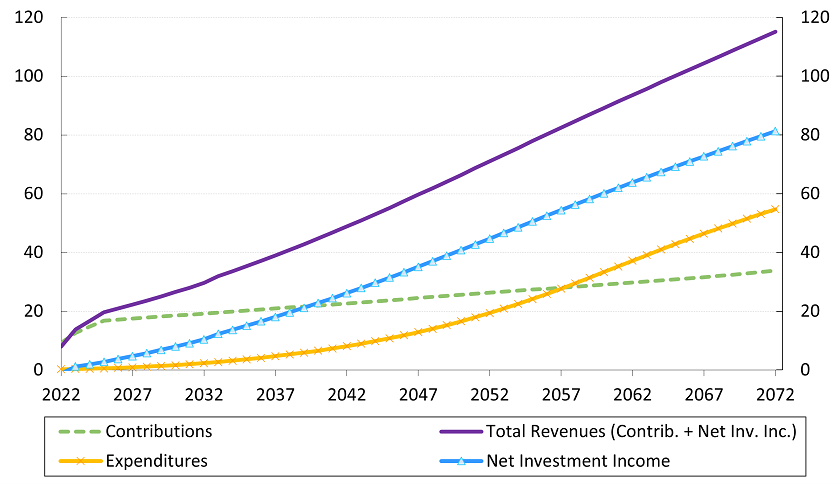
Text description: Chart 2 Revenues and Expenditures - Additional CPP, 2.0%/8.0% legislated contribution rates (billions of 2022 constant dollars)
Line chart showing the projected additional CPP’s revenues and expenditures by using 2.0% and 8.0% legislated contribution rates. Y axis represents billions of 2022 constant dollars. X axis represents the year.
Contributions start at 9.3 in 2022 and are projected to increase to 33.8 in 2072.
Investment Income starts from -1.2 in 2022 and grows to a projected 81.3 in 2072.
Total Revenues, which equals the sum of contributions and investment income, start at 8.0 in 2022 and are projected to be 115.1 in 2072.
Expenditures start at 0.3 in 2022 and are projected to increase to 54.7 in 2072.
| Year | Contributions | Net Investment Income | Expenditures | Total Revenues (Contrib. + Net Inv. Inc.) |
|---|---|---|---|---|
| 2022 | 9,250 | -1,249 | 287 | 8,001 |
| 2023 | 12,598 | 1,219 | 366 | 13,817 |
| 2024 | 14,755 | 1,934 | 475 | 16,689 |
| 2025 | 16,836 | 2,789 | 592 | 19,625 |
| 2026 | 17,175 | 3,752 | 738 | 20,927 |
| 2027 | 17,509 | 4,752 | 917 | 22,261 |
| 2028 | 17,849 | 5,762 | 1,132 | 23,612 |
| 2029 | 18,183 | 6,867 | 1,383 | 25,050 |
| 2030 | 18,540 | 8,025 | 1,663 | 26,565 |
| 2031 | 18,864 | 9,175 | 1,977 | 28,039 |
| 2032 | 19,201 | 10,438 | 2,329 | 29,639 |
| 2033 | 19,571 | 12,323 | 2,723 | 31,894 |
| 2034 | 19,911 | 13,699 | 3,163 | 33,610 |
| 2035 | 20,282 | 15,118 | 3,642 | 35,400 |
| 2036 | 20,603 | 16,579 | 4,157 | 37,182 |
| 2037 | 20,938 | 18,081 | 4,710 | 39,019 |
| 2038 | 21,278 | 19,624 | 5,299 | 40,901 |
| 2039 | 21,617 | 21,206 | 5,930 | 42,822 |
| 2040 | 21,975 | 22,827 | 6,607 | 44,803 |
| 2041 | 22,299 | 24,487 | 7,332 | 46,786 |
| 2042 | 22,668 | 26,183 | 8,110 | 48,851 |
| 2043 | 23,017 | 27,914 | 8,941 | 50,931 |
| 2044 | 23,388 | 29,679 | 9,833 | 53,068 |
| 2045 | 23,754 | 31,477 | 10,787 | 55,230 |
| 2046 | 24,116 | 33,303 | 11,808 | 57,419 |
| 2047 | 24,503 | 35,157 | 12,896 | 59,660 |
| 2048 | 24,861 | 37,035 | 14,053 | 61,896 |
| 2049 | 25,237 | 38,935 | 15,282 | 64,172 |
| 2050 | 25,578 | 40,851 | 16,584 | 66,429 |
| 2051 | 25,936 | 42,780 | 17,959 | 68,716 |
| 2052 | 26,293 | 44,720 | 19,405 | 71,013 |
| 2053 | 26,665 | 46,667 | 20,920 | 73,332 |
| 2054 | 27,002 | 48,616 | 22,507 | 75,618 |
| 2055 | 27,348 | 50,564 | 24,170 | 77,912 |
| 2056 | 27,691 | 52,506 | 25,902 | 80,196 |
| 2057 | 28,033 | 54,437 | 27,691 | 82,470 |
| 2058 | 28,373 | 56,356 | 29,529 | 84,729 |
| 2059 | 28,706 | 58,258 | 31,410 | 86,964 |
| 2060 | 29,050 | 60,142 | 33,327 | 89,191 |
| 2061 | 29,393 | 62,004 | 35,266 | 91,397 |
| 2062 | 29,745 | 63,843 | 37,202 | 93,588 |
| 2063 | 30,100 | 65,661 | 39,119 | 95,761 |
| 2064 | 30,474 | 67,458 | 41,006 | 97,932 |
| 2065 | 30,846 | 69,235 | 42,859 | 100,080 |
| 2066 | 31,225 | 70,994 | 44,677 | 102,219 |
| 2067 | 31,621 | 72,737 | 46,447 | 104,359 |
| 2068 | 32,045 | 74,468 | 48,166 | 106,513 |
| 2069 | 32,454 | 76,189 | 49,848 | 108,643 |
| 2070 | 32,900 | 77,902 | 51,500 | 110,802 |
| 2071 | 33,338 | 79,610 | 53,120 | 112,948 |
| 2072 | 33,805 | 81,314 | 54,710 | 115,119 |
| Year | Contributions | Net Investment Income Table 23 Footnote 1 | Total Revenues | Net Investment Income as % of Revenues (%) | Expenditures | Expenditures as % of Revenues (%) | Net Cash Flows (Contributions less Expenditures) | % of Net Investment Income Needed to Pay Expenditures (%) | ||
|---|---|---|---|---|---|---|---|---|---|---|
| 2022 | 9,250 | (1,249) | 8,001 | (15.6) | 287 | 3.6 | 8,963 | 0.0 | ||
| 2023 | 12,976 | 1,256 | 14,231 | 8.8 | 377 | 2.7 | 12,598 | 0.0 | ||
| 2024 | 15,577 | 2,042 | 17,619 | 11.6 | 502 | 2.8 | 15,076 | 0.0 | ||
| 2025 | 18,174 | 3,011 | 21,185 | 14.2 | 640 | 3.0 | 17,534 | 0.0 | ||
| 2026 | 18,912 | 4,131 | 23,043 | 17.9 | 813 | 3.5 | 18,099 | 0.0 | ||
| 2027 | 19,665 | 5,337 | 25,002 | 21.3 | 1,030 | 4.1 | 18,635 | 0.0 | ||
| 2028 | 20,448 | 6,601 | 27,049 | 24.4 | 1,297 | 4.8 | 19,151 | 0.0 | ||
| 2029 | 21,247 | 8,024 | 29,271 | 27.4 | 1,615 | 5.5 | 19,631 | 0.0 | ||
| 2030 | 22,097 | 9,564 | 31,661 | 30.2 | 1,982 | 6.3 | 20,115 | 0.0 | ||
| 2031 | 22,933 | 11,154 | 34,087 | 32.7 | 2,403 | 7.0 | 20,530 | 0.0 | ||
| 2032 | 23,809 | 12,944 | 36,753 | 35.2 | 2,888 | 7.9 | 20,921 | 0.0 | ||
| 2033 | 24,754 | 15,586 | 40,340 | 38.6 | 3,444 | 8.5 | 21,310 | 0.0 | ||
| 2034 | 25,687 | 17,673 | 43,360 | 40.8 | 4,080 | 9.4 | 21,608 | 0.0 | ||
| 2035 | 26,690 | 19,894 | 46,584 | 42.7 | 4,792 | 10.3 | 21,898 | 0.0 | ||
| 2036 | 27,654 | 22,253 | 49,907 | 44.6 | 5,580 | 11.2 | 22,074 | 0.0 | ||
| 2037 | 28,666 | 24,755 | 53,420 | 46.3 | 6,448 | 12.1 | 22,218 | 0.0 | ||
| 2038 | 29,714 | 27,403 | 57,117 | 48.0 | 7,400 | 13.0 | 22,313 | 0.0 | ||
| 2039 | 30,790 | 30,205 | 60,995 | 49.5 | 8,446 | 13.8 | 22,344 | 0.0 | ||
| 2040 | 31,927 | 33,165 | 65,092 | 51.0 | 9,598 | 14.7 | 22,329 | 0.0 | ||
| 2041 | 33,046 | 36,287 | 69,334 | 52.3 | 10,866 | 15.7 | 22,180 | 0.0 | ||
| 2042 | 34,265 | 39,577 | 73,842 | 53.6 | 12,258 | 16.6 | 22,007 | 0.0 | ||
| 2043 | 35,487 | 43,038 | 78,525 | 54.8 | 13,786 | 17.6 | 21,701 | 0.0 | ||
| 2044 | 36,781 | 46,675 | 83,456 | 55.9 | 15,463 | 18.5 | 21,318 | 0.0 | ||
| 2045 | 38,103 | 50,491 | 88,594 | 57.0 | 17,303 | 19.5 | 20,800 | 0.0 | ||
| 2046 | 39,458 | 54,490 | 93,948 | 58.0 | 19,319 | 20.6 | 20,139 | 0.0 | ||
| 2047 | 40,892 | 58,674 | 99,566 | 58.9 | 21,521 | 21.6 | 19,371 | 0.0 | ||
| 2048 | 42,320 | 63,044 | 105,364 | 59.8 | 23,922 | 22.7 | 18,398 | 0.0 | ||
| 2049 | 43,819 | 67,603 | 111,422 | 60.7 | 26,535 | 23.8 | 17,285 | 0.0 | ||
| 2050 | 45,300 | 72,349 | 117,648 | 61.5 | 29,370 | 25.0 | 15,930 | 0.0 | ||
| 2051 | 46,852 | 77,281 | 124,133 | 62.3 | 32,442 | 26.1 | 14,410 | 0.0 | ||
| 2052 | 48,447 | 82,401 | 130,848 | 63.0 | 35,756 | 27.3 | 12,692 | 0.0 | ||
| 2053 | 50,115 | 87,708 | 137,823 | 63.6 | 39,318 | 28.5 | 10,797 | 0.0 | ||
| 2054 | 51,763 | 93,199 | 144,962 | 64.3 | 43,147 | 29.8 | 8,617 | 0.0 | ||
| 2055 | 53,476 | 98,871 | 152,347 | 64.9 | 47,261 | 31.0 | 6,215 | 0.0 | ||
| 2060 | 62,715 | 129,839 | 192,554 | 67.4 | 71,950 | 37.4 | (9,235) | 7.1 | ||
| 2065 | 73,523 | 165,027 | 238,550 | 69.2 | 102,158 | 42.8 | (28,635) | 17.4 | ||
| 2070 | 86,582 | 205,013 | 291,596 | 70.3 | 135,530 | 46.5 | (48,948) | 23.9 | ||
| 2075 | 102,441 | 251,121 | 353,561 | 71.0 | 172,414 | 48.8 | (69,973) | 27.9 | ||
| 2080 | 121,412 | 304,991 | 426,403 | 71.5 | 213,446 | 50.1 | (92,034) | 30.2 | ||
| 2085 | 143,931 | 368,765 | 512,696 | 71.9 | 258,889 | 50.5 | (114,958) | 31.2 | ||
| 2090 | 170,294 | 445,078 | 615,371 | 72.3 | 311,022 | 50.5 | (140,728) | 31.6 | ||
| 2095 | 200,939 | 536,555 | 737,494 | 72.8 | 372,848 | 50.6 | (171,909) | 32.0 | ||
| 2100 | 236,708 | 646,104 | 882,813 | 73.2 | 445,961 | 50.5 | (209,252) | 32.4 | ||
|
Table 23 Footnotes
|
||||||||||
6.5 Financial Projections with Additional Minimum Contribution Rates
The results presented in Table 24 are based on the best-estimate assumptions, but use the FAMCR of 1.97% for 2025 and thereafter and SAMCR of 7.88% for 2025 and thereafter as opposed to the legislated first and second additional contribution rates of 2.0% and 8.0%, respectively. The financial projections of the additional Plan under the legislated rates were previously presented in Table 21. Under the AMCRs, the additional CPP open group assets represent 105% of its open group actuarial obligations as at 31 December 2021, and the ratio of invested assets to expenditures stabilizes at a value of 24 for the target years 2088 and 2098.
Table 25 shows the progression of the AMCRs over time under the best-estimate assumptions of this report. As shown in Table 25, if the best-estimate assumptions of this report are realized, the FAMCR and SAMCR will remain at about 1.97% and 7.88%, respectively for each of the next four reports, which are below and very close to the legislated additional contribution rates of 2.0% and 8.0%. Thus, the current legislated additional contribution rates are projected to be sufficient over subsequent reports as long as the best-estimate assumptions remain the same and additional Plan experience does not deviate materially from the assumptions.
In the event that the AMCRs, as determined under a CPP actuarial report, deviate to a certain extent from their respective legislated additional rates and the federal and provincial Ministers of Finance do not reach an agreement on how to address such deviation, certain provisions of the Additional Canada Pension Plan Sustainability Regulations would be activated. The deviation in the rates is quantified in the regulations with respect to both the magnitude (absolute basis points difference between the legislated rates and AMCRs) and duration of time that a deviation exists. In such case, adjustments would be made to current and future benefits and possibly to the contribution rates. In respect of this 31st CPP Actuarial Report, the AMCRs do not deviate materially from their respective legislated rates, and thus the provisions under the sustainability regulations do not apply. Therefore, in the absence of specific action by the federal and provincial governments, the legislated additional contribution rates will remain as scheduled.
| Year | First / Second Additional Contribution Rates Table 24 Footnote 1 (%) | First Additional Contributory Earnings ($ million) | Second Additional Contributory Earnings ($ million) | Contributions ($ million) | Expenditures ($ million) | Net Cash Flows ($ million) | Net Investment Income Table 24 Footnote 2 ($ million) | Assets at 31 Dec. ($ million) | Assets/ Expenditures Ratio |
|---|---|---|---|---|---|---|---|---|---|
| 2022 | 1.50 | 616,668 | 0 | 9,250 | 287 | 8,963 | (1,249) | 18,758 | 49.7 |
| 2023 | 2.00 | 648,785 | 0 | 12,976 | 377 | 12,598 | 1,256 | 32,612 | 65.0 |
| 2024 | 2.00 / 8.00 | 680,189 | 24,669 | 15,577 | 502 | 15,076 | 2,042 | 49,730 | 77.8 |
| 2025 | 1.97 / 7.88 | 710,485 | 49,554 | 17,901 | 640 | 17,262 | 3,003 | 69,995 | 86.1 |
| 2026 | 1.97 / 7.88 | 739,632 | 51,488 | 18,628 | 813 | 17,815 | 4,109 | 91,918 | 89.3 |
| 2027 | 1.97 / 7.88 | 769,230 | 53,505 | 19,370 | 1,030 | 18,340 | 5,298 | 115,557 | 89.1 |
| 2028 | 1.97 / 7.88 | 800,229 | 55,539 | 20,141 | 1,297 | 18,844 | 6,545 | 140,946 | 87.2 |
| 2029 | 1.97 / 7.88 | 832,186 | 57,535 | 20,928 | 1,615 | 19,312 | 7,948 | 168,206 | 84.9 |
| 2030 | 1.97 / 7.88 | 864,552 | 60,075 | 21,766 | 1,982 | 19,784 | 9,466 | 197,455 | 82.2 |
| 2031 | 1.97 / 7.88 | 898,197 | 62,116 | 22,589 | 2,403 | 20,186 | 11,032 | 228,674 | 79.2 |
| 2032 | 1.97 / 7.88 | 933,295 | 64,289 | 23,452 | 2,888 | 20,564 | 12,796 | 262,034 | 76.1 |
| 2033 | 1.97 / 7.88 | 969,910 | 66,948 | 24,383 | 3,444 | 20,938 | 15,401 | 298,374 | 73.1 |
| 2034 | 1.97 / 7.88 | 1,007,917 | 69,114 | 25,302 | 4,080 | 21,222 | 17,456 | 337,053 | 70.3 |
| 2035 | 1.97 / 7.88 | 1,047,401 | 71,771 | 26,289 | 4,792 | 21,497 | 19,643 | 378,193 | 67.8 |
| 2036 | 1.97 / 7.88 | 1,085,658 | 74,256 | 27,239 | 5,580 | 21,659 | 21,966 | 421,818 | 65.4 |
| 2037 | 1.97 / 7.88 | 1,125,623 | 76,918 | 28,236 | 6,448 | 21,788 | 24,427 | 468,032 | 63.2 |
| 2038 | 1.97 / 7.88 | 1,167,224 | 79,614 | 29,268 | 7,400 | 21,867 | 27,033 | 516,933 | 61.2 |
| 2039 | 1.97 / 7.88 | 1,210,287 | 82,306 | 30,328 | 8,446 | 21,882 | 29,788 | 568,603 | 59.2 |
| 2040 | 1.97 / 7.88 | 1,254,280 | 85,518 | 31,448 | 9,598 | 21,850 | 32,698 | 623,151 | 57.3 |
| 2041 | 1.97 / 7.88 | 1,299,423 | 88,221 | 32,550 | 10,866 | 21,684 | 35,767 | 680,602 | 55.5 |
| 2042 | 1.97 / 7.88 | 1,346,635 | 91,652 | 33,751 | 12,258 | 21,493 | 38,998 | 741,093 | 53.8 |
| 2043 | 1.97 / 7.88 | 1,396,342 | 94,507 | 34,955 | 13,786 | 21,169 | 42,397 | 804,659 | 52.0 |
| 2044 | 1.97 / 7.88 | 1,446,964 | 98,023 | 36,229 | 15,463 | 20,766 | 45,968 | 871,393 | 50.4 |
| 2045 | 1.97 / 7.88 | 1,499,428 | 101,433 | 37,532 | 17,303 | 20,229 | 49,713 | 941,335 | 48.7 |
| 2046 | 1.97 / 7.88 | 1,553,431 | 104,868 | 38,866 | 19,319 | 19,547 | 53,635 | 1,014,517 | 47.1 |
| 2047 | 1.97 / 7.88 | 1,608,638 | 108,996 | 40,279 | 21,521 | 18,758 | 57,737 | 1,091,011 | 45.6 |
| 2048 | 1.97 / 7.88 | 1,666,000 | 112,501 | 41,685 | 23,922 | 17,763 | 62,020 | 1,170,794 | 44.1 |
| 2049 | 1.97 / 7.88 | 1,724,766 | 116,552 | 43,162 | 26,535 | 16,628 | 66,484 | 1,253,906 | 42.7 |
| 2050 | 1.97 / 7.88 | 1,784,712 | 120,070 | 44,620 | 29,370 | 15,250 | 71,129 | 1,340,286 | 41.3 |
| 2051 | 1.97 / 7.88 | 1,846,030 | 124,142 | 46,149 | 32,442 | 13,707 | 75,955 | 1,429,947 | 40.0 |
| 2052 | 1.97 / 7.88 | 1,909,767 | 128,148 | 47,720 | 35,756 | 11,965 | 80,960 | 1,522,872 | 38.7 |
| 2053 | 1.97 / 7.88 | 1,974,826 | 132,729 | 49,363 | 39,318 | 10,045 | 86,144 | 1,619,060 | 37.5 |
| 2054 | 1.97 / 7.88 | 2,040,986 | 136,795 | 50,987 | 43,147 | 7,840 | 91,504 | 1,718,405 | 36.4 |
| 2055 | 1.97 / 7.88 | 2,108,096 | 141,425 | 52,674 | 47,261 | 5,413 | 97,037 | 1,820,854 | 35.2 |
| 2060 | 1.97 / 7.88 | 2,474,655 | 165,270 | 61,774 | 71,950 | (10,176) | 127,154 | 2,377,281 | 30.6 |
| 2065 | 1.97 / 7.88 | 2,903,032 | 193,282 | 72,420 | 102,158 | (29,738) | 161,178 | 3,004,773 | 27.7 |
| 2070 | 1.97 / 7.88 | 3,421,988 | 226,782 | 85,284 | 135,530 | (50,246) | 199,577 | 3,713,739 | 26.0 |
| 2075 | 1.97 / 7.88 | 4,051,490 | 267,639 | 100,904 | 172,414 | (71,510) | 243,531 | 4,526,368 | 25.1 |
| 2080 | 1.97 / 7.88 | 4,803,930 | 316,670 | 119,591 | 213,446 | (93,855) | 294,488 | 5,469,686 | 24.6 |
| 2085 | 1.97 / 7.88 | 5,697,857 | 374,669 | 141,772 | 258,889 | (117,117) | 354,336 | 6,579,194 | 24.5 |
| 2088 | 1.97 / 7.88 | 6,307,071 | 414,388 | 156,903 | 289,120 | (132,217) | 395,475 | 7,342,365 | 24.5 |
| 2090 | 1.97 / 7.88 | 6,744,599 | 442,520 | 167,739 | 311,022 | (143,283) | 425,372 | 7,896,954 | 24.5 |
| 2095 | 1.97 / 7.88 | 7,958,860 | 522,020 | 197,925 | 372,848 | (174,923) | 509,780 | 9,462,519 | 24.5 |
| 2098 | 1.97 / 7.88 | 8,781,992 | 575,494 | 218,354 | 415,281 | (196,927) | 567,782 | 10,538,204 | 24.5 |
| 2100 | 1.97 / 7.88 | 9,379,076 | 614,085 | 233,158 | 445,961 | (212,803) | 609,879 | 11,318,995 | 24.5 |
|
Table 24 Footnotes
|
|||||||||
| Valuation Year Table 25 Footnote 1 | Target Years Table 25 Footnote 2 | Target A/E Ratio Table 25 Footnote 3 | Additional Minimum Contribution Rates | Years Additional Minimum Contribution Rates Applicable Table 25 Footnote 4 | Assets as a % of Obligations on an Open Group Basis Table 25 Footnote 5 |
|---|---|---|---|---|---|
| 2021 | 2088 and 2098 | 24.5 | 1.97%/7.88% | 2025+ | 105.2% |
| 2024 | 2088 and 2098 | 24.5 | 1.97%/7.88% | 2028+ | 104.9% |
| 2027 | 2088 and 2098 | 24.5 | 1.97%/7.88% | 2031+ | 104.7% |
| 2030 | 2088 and 2098 | 24.6 | 1.96%/7.84% | 2034+ | 104.1% |
| 2033 | 2088 and 2098 | 24.6 | 1.96%/7.84% | 2037+ | 104.2% |
|
Table 25 Footnotes
|
|||||
7 Reconciliation with Previous Triennial Report
7.1 Base CPP
7.1.1 Introduction
The results presented in this report differ from those previously projected for a variety of reasons. Differences between the actual experience for 2019 through 2021 and that projected in the 30th CPP Actuarial Report are addressed in section 7.1.2 below. Since historical results provide the starting point for the projections shown in this report, these historical differences between actual and projected experience have an effect on the projections. The impact of experience since the last triennial valuation of the base Plan (that is, the experience update from the period 2019-2021) and changes in the assumptions and methodology on the base CPP minimum contribution rate are addressed in section 7.1.3. Detailed reconciliations of the projected minimum contribution rate is presented in Appendix D.
7.1.2 Experience Update – 31 December 2018 to 31 December 2021
The major components of the change in the base CPP assets from 31 December 2018 to 31 December 2021 are summarized in Table 26.
Contributions during the period 2019 to 2021 were not materially different than expected.
Expenditures during the period were $3.4 billion lower than expected. The difference between actual and expected expenditures is mainly due to retirement benefits (lower take-up of retirement benefits at age 60 than expected), disability benefits (lower disability incidence rates than expected), and survivor benefits. The details by type of expenditure are given in Table 27.
Due to the strong investment performance over the period (actual average annual nominal rate of return of 12.7% compared to the anticipated 5.2%), investment income on base CPP assets was $103 billion higher than expected.
The resulting base CPP assets as at 31 December 2021 are about $106 billion higher than projected under the 30th CPP Actuarial Report.
| blank | Actual | Expected Table 26 Footnote 2 | Difference: Actual – Expected |
|---|---|---|---|
| Assets at 31 December 2018 | 371,700 | 371,700 | nil- |
|
+ Contributions
|
160,534 | 161,101 | (567) |
|
- Expenditures
|
153,211 | 156,565 | (3,354) |
|
+ Investment Income
|
164,701 | 61,801 | 102,900 |
| Change in Assets | 172,024 | 66,337 | 105,687 |
| Assets at 31 December 2021 | 543,725 | 438,037 | 105,687 |
|
Table 26 Footnotes
|
|||
| blank | Actual Table 27 Footnote 2 | Expected Table 27 Footnote 3 | Difference: Actual – Expected |
|---|---|---|---|
| Retirement | 121,016 | 123,434 | (2,418) |
| Disability | 13,083 | 13,491 | (408) |
| Survivors | 14,334 | 14,703 | (369) |
| Children | 1,588 | 1,664 | (76) |
| Death | 1,251 | 1,224 | 27 |
| Operating Expenses | 1,939 | 2,049 | (110) |
| Total Expenditures | 153,211 | 156,565 | (3,354) |
|
Table 27 Footnotes
|
|||
7.1.3 Changes in the Minimum Contribution Rate
Table 28 presents the main elements of change in the base Plan MCR since the 30th CPP Actuarial Report and shows an overall decrease in the rate.
Experience over the period 2019 to 2021 was better than anticipated overall. The main contributing factor for this was better than expected investment experience, which lowers the MCR by 0.35 percentage points. Changes made to the demographic assumptions also act to lower the MCR. However, these reductions in the MCR are partially offset by changes made to benefit, economic and investment assumptions.
The impacts on the MCR resulting from changes in assumptions include the subsequent event disclosed in section 2.3. Overall, changes to the assumptions to reflect the subsequent event resulted in an increase in the MCR of 0.31 percentage points. A large portion of this increase is due to reductions in the 2022 assumed nominal rate of return. The reduction in MCR of 0.35 percentage points due to 2019-2021 investment experience is therefore partially offset by lower assumed returns in 2022.
A more detailed reconciliation of changes in the MCR is provided in Table 107 in Appendix D of this report.
| blank | Steady-State Rate | Full Funding Rates Table 28 Footnote 2 | MCR | ||
|---|---|---|---|---|---|
| 2025-2033 | 2034+ | 2025-2033 | 2034+ | ||
| 30th CPP Actuarial Report - After Rounding | 9.71 | 0.04 | 0.01 | 9.75 | 9.72 |
| 30th CPP Actuarial Report - Before Rounding | 9.708 | 0.035 | 0.007 | 9.743 | 9.715 |
| Improvements in Methodology | 0.048 | (0.001) | (0.001) | 0.046 | 0.046 |
| Experience (2019 to 2021) | (0.544) | (0.005) | (0.001) | (0.550) | (0.545) |
| Changes in Demographic Assumptions | (0.121) | 0.002 | 0.001 | (0.119) | (0.120) |
| Changes in Benefit Assumptions | 0.016 | 0.003 | 0.002 | 0.019 | 0.018 |
| Changes in Economic Assumptions | 0.064 | 0.001 | 0.001 | 0.066 | 0.065 |
| Changes in Investment Assumptions | 0.373 | 0.001 | 0.000 | 0.373 | 0.373 |
| Changes in Other Assumptions | (0.009) | 0.001 | 0.000 | (0.008) | (0.009) |
| Change in Funding Target from 2031-2081 to 2034-2084 | (0.009) | (0.002) | 0.000 | (0.011) | (0.008) |
| Rate before Rounding | 9.526 | 0.035 | 0.009 | 9.560 | 9.535 |
| Rounded Rate, in Accordance with the Calculation of Contribution Rates Regulations, 2021 | 9.53 | 0.03 | 0.01 | 9.56 | 9.54 |
| 31st CPP Actuarial Report | 9.53 | 0.03 | 0.01 | 9.56 | 9.54 |
|
Table 28 Footnotes
|
|||||
7.2 Additional CPP
7.2.1 Introduction
The results presented in this report differ from those previously projected for a variety of reasons. Differences between the actual experience for 2019 through 2021 and that projected in the 30th CPP Actuarial Report are addressed in section 7.2.2 below. Since historical results provide the starting point for the projections shown in this report, these historical differences between actual and projected experience over the period 2019-2021 have an effect on the projections. The impact of experience since the previous triennial valuation of the additional Plan and changes in the assumptions and methodology on the additional CPP first and second additional minimum contribution rates are addressed in section 7.2.3. Detailed reconciliations of the additional minimum contribution rates are presented in Appendix D.
7.2.2 Experience Update – 1 January 2019 to 31 December 2021
The major components of the change in the additional CPP assets from the start of the additional Plan on 1 January 2019 to 31 December 2021 are summarized in Table 29.
Contributions during the period 2019 to 2021 were not materially different than expected.
As the additional Plan started only recently, administrative processes regarding benefits are yet to be finalized. As such, only partial experience data regarding benefit expenditures were available at the time this CPP Actuarial Report was prepared. Operating expenses over the period 2019 to 2021 were $256 million higher than expected.
Due to the strong investment performance over the period (actual average annual nominal rate of return of 7.1% compared to the anticipated 2.6%), investment income on the additional CPP assets was $657 million higher than expected.
The resulting additional CPP assets as at 31 December 2021, are $459 million higher than projected under the 30th CPP Actuarial Report.
| blank | Actual | Expected Table 29 Footnote 2 | Difference: Actual – Expected |
|---|---|---|---|
| Assets at 1 January 2019 | 0 | 0 | nil- |
|
+ Contributions
|
10,487 | 10,451 | 36 |
|
- Expenditures
|
520 | 286 | 234 |
|
+ Investment Income
|
1,078 | 421 | 657 |
| Change in Assets | 11,045 | 10,586 | 459 |
| Assets at 31 December 2021 | 11,045 | 10,586 | 459 |
|
Table 29 Footnotes
|
|||
7.2.3 Changes in the Additional Minimum Contribution Rates
Table 30 presents the main elements of change in the first and second additional minimum contribution rates (FAMCR, SAMCR) since the 30th CPP Actuarial Report and shows an overall decrease in the rates.
Economic, and investment experience both acted to lower the AMCRs. Changes made to the demographic, economic, and investments assumptions also acted to lower the AMCRs. However, these reductions in the rates are partially offset by changes in other assumptions (e.g. operating expenses). The net result of all changes since the 30th CPP Actuarial Report is a decrease in the FAMCR of 0.01 percentage points and corresponding decrease in the SAMCR of 0.04 percentage points.
The impacts on the AMCRs resulting from changes in assumptions include the subsequent event disclosed in section 2.3. Overall, changes to the assumptions to reflect the subsequent event resulted in decreases of less than 0.005 percentage points and 0.02 percentage points in the FAMCR and SAMCR, respectively.
A more detailed reconciliation of changes in the AMCRs is provided in Table 108 in Appendix D of this report.
| blank | First Additional Minimum Contribution Rate | Second Additional Minimum Contribution Rate |
|---|---|---|
| 30th CPP Actuarial Report - After Rounding | 1.98 | 7.92 |
| 30th CPP Actuarial Report - Before Rounding | 1.977 | 7.907 |
| Improvements in Methodology | 0.027 | 0.108 |
| Experience (2019 to 2021) | (0.006) | (0.025) |
| Changes in Demographic Assumptions | (0.010) | (0.038) |
| Changes in Benefit Assumptions | 0.004 | 0.014 |
| Changes in Economic Assumptions | (0.025) | (0.099) |
| Changes in Investment Assumptions | (0.016) | (0.062) |
| Changes in Other Assumptions | 0.019 | 0.075 |
| Rate before Rounding | 1.970 | 7.879 |
| Rounded Rates, in Accordance with the Calculation of Contribution Rates Regulations, 2021 | 1.97 | 7.88 |
| 31st CPP Actuarial Report | 1.97 | 7.88 |
|
Table 30 Footnotes
|
||
8 Actuarial Opinion
In our opinion, considering that this 31st Actuarial Report on the Canada Pension Plan as at 31 December 2021 was prepared pursuant to the Canada Pension Plan:
- the data on which this report is based are sufficient and reliable for the purposes of this report;
- the assumptions used are, individually and in aggregate, reasonable and appropriate for the purposes of this report; and
- the methods employed are appropriate for the purposes of this report.
Based on the results of this valuation, we hereby certify that:
- the minimum contribution rate required to finance the base CPP is 9.56% for years 2025 to 2033 and 9.54% for the year 2034 and thereafter.
- the additional minimum contribution rates that result in projected contributions being sufficient, along with projected investment income, to fully pay projected expenditures of the additional CPP are determined to be:
- first additional minimum contribution rate: 1.97% for the year 2025 and thereafter, and
- second additional minimum contribution rate: 7.88% for the year 2025 and thereafter.
- the insufficient rates provisions of the Canada Pension Plan and the provisions under the Additional Canada Pension Plan Sustainability Regulations do not apply. Therefore, in the absence of specific action by the federal and provincial governments, the legislated contribution rates will remain for both the base CPP and the additional CPP.
This report has been prepared, and our opinions given, in accordance with accepted actuarial practice in Canada, in particular, the General Standards and the Practice-Specific Standards for Social Security Programs of the Standards of Practice of the Canadian Institute of Actuaries.
As of the date of the signing of this report, we have not learned of any events, other than the events already accounted for in section 2.3 of this report, that would have a material impact on the financial states of the base or additional CPP as at 31 December 2021.
Assia Billig, FCIA, FSA
Chief Actuary
Christine Dunnigan, FCIA, FSA
Senior Actuary
Michel Montambeault, FCIA, FSA
Senior Actuary
Ottawa, Canada
14 November 2022
Appendix A – Summary of Plan Provisions
A.1 Introduction
The Canada Pension Plan came into force on 1 January 1966. Since its inception, the CPP has been amended a number of times. The amendments include an enhancement of the CPP (the additional CPP) such that, effective 1 January 2019, the CPP consists of two components: the base CPP and additional CPP.
The most recent amendments to the Canada Pension Plan are the following:
The Budget Implementation Act, 2019, No. 1, which received Royal Assent on 21 June 2019, amends the CPP statute such that the application for a CPP retirement pension is waived upon reaching age 70, effective 1 January 2020. This amendment was considered to be a subsequent event for the purpose of the 30th CPP Actuarial Report since the amendment became known to the Chief Actuary after the valuation date but before the report date. The amendment was taken into account for the 30th CPP Actuarial Report since it was determined to have a material impact on the financial state of the CPP.
Regulations regarding the CPP contribution rates and financial sustainability of the additional Plan, specifically the Calculation of Contribution Rates Regulations, 2021 and the Additional Canada Pension Plan Sustainability Regulations, which both received formal provincial approval. These Regulations were originally introduced in 2018 and were taken into account for the 30th CPP Actuarial Report. Both Regulations became effective 1 February 2021.
The Budget Implementation Act, 2022, No. 1, which received Royal Assent on 23 June 2022, contains technical amendments regarding eligibility for the base CPP post-retirement disability benefit and determination of the additional CPP drop-in provisions under the CPP statute.Footnote 2 The amendments reflect the original intent of the given benefit and provisions and were thus included in the projections of previous CPP actuarial reports.
This 31st CPP Actuarial Report takes into account all the above listed amendments and Regulations.
This appendix presents a summary of the provisions of the Plan inclusive of all amendments. The legislation shall prevail if there is a discrepancy between it and this summary.
A.2 Participation
The CPP includes virtually all members of the labour force in Canada, including both employees and self-employed persons between the ages of 18 and 70 with employment earnings, other than those covered by the Québec Pension Plan (QPP). The main exceptions are persons with annual earnings lower than $3,500 (the Year’s Basic Exemption, defined below), members of certain religious groups, and other persons who qualify under excepted employment. It should be noted that the CPP covers all members of the Canadian Forces and the Royal Canadian Mounted Police, including those residing in the province of Québec. The persons to whom a CPP disability benefit is payable are not required to contribute.
A.3 Definitions
A.3.1 Base and Additional CPP
The base CPP or base Plan refers to that part of the CPP other than the part relating to the additional CPP. Prior to 1 January 2019, the CPP consisted only of the base Plan.
The additional CPP or additional Plan refers to the enhancement to the CPP introduced in An Act to Amend the Canada Pension Plan, the Canada Pension Plan Investment Board Act and the Income Tax Act. The additional CPP was implemented as of 1 January 2019. The additional CPP has two (first and second) parts or tiers, and the corresponding first and second additional contribution rates and pensionable earnings on which contributions are made will be phased in over the seven-year period 2019 to 2025, as described below.
Since 1 January 2019, the CPP comprises the base and additional Plans.
A.3.2 Year’s Maximum Pensionable Earnings (YMPE) and Year’s Additional Maximum Pensionable Earnings (YAMPE)
The YMPE for a calendar year is the limit to which employment and self-employment earnings are subject to contributions and first additional contributions for purposes of the base Plan and additional Plan, respectively. The YMPE increases each year to the extent warranted by the percentage increase, as at 30 June of the preceding year, in the 12-month average of the average weekly earnings of the Industrial Aggregate (as published by Statistics Canada). If the amount so calculated is not a multiple of $100, the next lower multiple of $100 is used. The YMPE is set at $64,900 in 2022.
The YAMPE for a calendar year is the limit to which employment and self-employment earnings are subject to second additional contributions above the YMPE for the purposes of the additional Plan. The YAMPE will be introduced in the year 2024. The YAMPE will first be set at 107% of the YMPE in 2024, and then at 114% of the YMPE in 2025 and thereafter. The YAMPE is thus set to increase in tandem with the YMPE after 2025. If the YAMPE so calculated is not a multiple of $100, the next lower multiple of $100 is used.
In this report, the YMPE and YAMPE in the year 2025 are projected to be $71,200 and $81,100, respectively.
A.3.3 Year’s Basic Exemption (YBE)
The YBE for a calendar year is the minimum employment earnings required to participate in the Plan. As well, contributions are waived on earnings up to the YBE. The YBE is $3,500 in 2022.
A.3.4 Contributory Period and Additional Contributory Periods of the CPP
The contributory period is in respect of the base CPP and is the number of months from attainment of age 18 or from 1 January 1966, if later, to the earliest of the month in which the contributor dies, the month before the one in which the retirement pension commences and the month before the one in which the contributor reaches 70 years of age, less the number of months during which the contributor received a CPP or QPP disability benefit (including the three-month waiting period), or during which the contributor had at least one eligible child under seven years of age and had earnings for that year lower than the YBE. The contributory period excludes periods on or after 1 January 2012 during which beneficiaries contribute while in receipt of a retirement pension.
The first additional contributory period in respect of the additional CPP is the number of months from attainment of age 18 or from 1 January 2019, if later, to the earliest of the month in which the contributor dies, the month before the one in which the retirement pension commences and the month before the one in which the contributor reaches 70 years of age.
The second additional contributory period in respect of the additional CPP is the number of months from attainment of age 18 or from 1 January 2024, if later, to the earliest of the month in which the contributor dies, the month before the one in which the retirement pension commences and the month before the one in which the contributor reaches 70 years of age.
A.3.5 Pension Index
The Pension Index for a given calendar year is equal to the Consumer Price Index averaged over the 12-month period ending with October of the preceding year; however, the Pension Index of a given year may not be less than the previous year’s Pension Index.
A.4 Contribution Rate and Additional Contribution Rates of the CPP
In respect of the base CPP, from 1966 to 1986, the annual contribution rate applicable to contributory earnings was 1.8% for employees (and the same amount for their employers) and 3.6% in respect of self-employed earnings. This combined employee-employer contribution rate of 3.6% was subject to an annual increase of 0.2 percentage points from 1987 to 1996, attaining 5.6% in the last year of that period. From 1997 to 2003, the combined employee-employer contribution rate for the base CPP then increased in steps to reach a rate of 9.9% by 2003, with no subsequent increases scheduled thereafter.
The first additional contribution rate of the additional CPP applies to earnings between the YBE and the YMPE. The first additional combined employee-employer contribution rate is being phased in over the 5-year period 2019 to 2023 and will be equal to 2.0% from the year 2023 onward. The first additional contribution rate during the phase-in period from 2019 to 2023 is shown in Table 31.
The second additional contribution rate of the additional CPP applies to earnings between the YMPE and YAMPE and will be applied starting in the year 2024. The second additional combined employee-employer contribution rate is equal to 8.0% for the year 2024 and thereafter.
Employees and employers pay equal shares of the base and additional contribution rates of the CPP, and the self-employed pay the full rates.
Table 31 shows the legislated contribution rates for the CPP.
| Year | Pensionable Earnings above YBE up to YMPE | Pensionable Earnings above YMPE up to YAMPE | |
|---|---|---|---|
| Base Contribution Rate | First Additional Contribution Rate | Second Additional Contribution Rate | |
| 2003-2018 | 9.9 | nil – | nil – |
| 2019 | 9.9 | 0.3 | nil – |
| 2020 | 9.9 | 0.6 | nil – |
| 2021 | 9.9 | 1.0 | nil – |
| 2022 | 9.9 | 1.5 | nil – |
| 2023 | 9.9 | 2.0 | nil – |
| 2024+ | 9.9 | 2.0 | 8.0 |
The CPP statute gives the federal and provincial ministers of finance the authority to make changes to the Plan’s contribution rates through regulation, in connection with a triennial review. However, year-over-year rate increases cannot exceed 0.2 percentage points; beyond that, legislation is required.
For the base Plan, if a triennial CPP actuarial report projects a minimum contribution rate in excess of the scheduled (legislated) rate and the finance ministers do not make a recommendation to either increase the legislated rate or maintain it, the insufficient rates provisions of the Canada Pension Plan would apply. The base CPP contribution rate would then be increased in stages and a possible temporary freeze on inflation adjustments to benefits in pay would apply.
For the additional Plan, if a triennial CPP actuarial report projects that the additional minimum contribution rates deviate to a certain extent from their respective legislated additional rates and the finance ministers do not agree on how to address the deviation, then sustainability Regulations in respect of the additional Plan would provide the actions to take: changes to benefits and possibly the additional contributions rates. The sustainability Regulations – the Additional Canada Pension Plan Sustainability Regulations,became effective 1 February 2021.
A.5 Retirement Pension
A.5.1 Eligibility Requirements
A person aged 60 or over becomes eligible for a base CPP retirement pension provided contributions have been made during at least one calendar year. Further, an individual must apply for a retirement pension in order to receive it. However, since 1 January 2020, the requirement to apply is waived for an eligible person if he or she is aged 70 or older and is in receipt of another benefit from the CPP, OAS program, or a provincial plan and/or had an income tax return filed in respect of the year before the year in which granting the waiver is considered.
Prior to 2012, a work cessation test applied in order for a retirement pension to become payable before age 65. This test required individuals who applied to take their CPP retirement benefit early (i.e. before age 65) to either stop working or materially reduce their earnings both in the month immediately preceding and the month of benefit take-up. In the month following the start of pension payment, an individual could return to work and/or earn more without affecting the eligibility for or amount of the benefit. However, no further contributions to the CPP were allowed once benefits started being paid. There was no work cessation test for those aged 65 or older.
Since 1 January 2012, the work cessation test no longer applies, and individuals younger than 65 who choose to work in Canada outside of Québec while receiving a CPP or QPP retirement pension are required, along with their employers, to contribute to the CPP. Working beneficiaries aged 65 or older are given the option of continuing to contribute to the Plan; however, employers of those opting to do so are also required to contribute. The contributions from working beneficiaries are applied toward providing post-retirement benefits from the base and additional CPP and do not affect eligibility for other CPP benefits, except the post-retirement disability benefit. Upon attaining age 70, contributions are no longer permitted under the Plan.
The eligibility requirements for the additional retirement benefit are those of the base CPP. That is, a contributor is deemed to be eligible for the additional CPP retirement benefit if they are eligible for the base CPP retirement benefit.
A.5.2 Amount of Pension
The initial amount of the monthly retirement pension payable to a contributor under the CPP is equal to the sum of their retirement benefits payable under the base and additional Plans.
Base CPP
The initial monthly retirement pension payable under the base Plan is based on the contributor’s entire history of pensionable earnings during the contributory period. The retirement pension under the base Plan is equal to 25% of the average of the YMPE for the year of retirement and the four previous years, referred to as the Maximum Pensionable Earnings Average (MPEA), adjusted to take into account the contributor’s pensionable earnings. For this purpose, the contributor’s pensionable earnings for any given month are indexed by the ratio of the MPEA for the year of retirement to the YMPE for the year to which the given month belongs.
Some periods with low pensionable earnings may be excluded from the calculation of benefits by reason of pensions commencing after age 65, disability, child-rearing for a child less than seven years of age, and the general drop-out provision.
The general drop-out provision allows for a number of years with low or zero earnings to be dropped from the calculation of the retirement benefit. For example, for someone who started their retirement benefit at age 65 in 2022, the provision allows for 17% of the number of months with the lowest earnings (up to a maximum of about eight years) to be dropped from the calculation of the benefit. The general drop-out percentage was 15% from 1966 to 2011, 16% in 2012 and 2013, and has been 17% since 2014. As a result, the maximum number of years of low or zero earnings that may be dropped from the calculation of the retirement benefit for those contributors who take their benefit at age 65 has increased from about seven to eight years. The actual drop-out percentage that applies is based on the year of benefit take-up. The increase in the general drop-out provision increases the retirement pension, as well as the CPP disability and survivor pensions, since the determination of these benefits depends on the retirement pension.
The maximum retirement benefit payable under the base CPP at age 65 in 2022 is $1,243.75 per month or $14,925 per year.
Additional CPP
The calculation of the additional CPP retirement benefit is based on the first and second additional monthly pensionable earnings. The first additional monthly pensionable earnings are equal to the total of the highest 480 months or the total number of months, if lower, in the first additional contributory period of monthly adjusted pensionable earnings up to the YMPE divided by 480. Similarly, the second additional monthly pensionable earnings are equal to the total of the highest 480 or total number of months, if lower, in the second additional contributory period of monthly adjusted pensionable earnings between the YMPE and the YAMPE divided by 480. These calculations provide for a monthly accrual of 1/480 of the total additional retirement benefit.
The additional monthly retirement benefit is calculated as the sum of 8.33% of the first additional monthly pensionable earnings and 33.33% of the second additional monthly pensionable earnings.
The pensionable earnings used for the calculation of additional retirement benefits are adjusted to the date of retirement in the same way as for the base CPP, that is, indexing by the ratio of the MPEA to the YMPE as described above. Further, to account for the lower first additional contribution rates during the first four years of the phase-in period (from 2019 to 2022), the first additional monthly pensionable earnings are multiplied by 0.15 in 2019, 0.30 in 2020, 0.50 in 2021, and 0.75 in 2022.
Unlike the base CPP, there are no drop-out provisions for the additional Plan. However, there are “drop-in” provisions for the additional CPP to protect the additional benefits from periods of low pensionable earnings resulting from disability or child-rearing for a child less than seven years of age.
Specifically, for individuals who become disabled after 1 January 2019, an imputed income will be assigned to those disability periods of low or zero earnings for the purpose of calculating the additional CPP retirement (and survivor) benefits. The drop-in amount will be equal to 70 per cent of an individual’s average earnings in the six years prior to the onset of the disability.
The disability drop-in amount is calculated based on months of earnings after 2018 and prior to the onset of disability. If, however, there are fewer than 72 months (6 years) of such earnings, then the drop-in will be calculated based on the actual number of earnings months after 2018, prior to the onset of disability.
For parents of children under the age of seven on or after 1 January 2019, an imputed income will be assigned to child-rearing periods of low or zero earnings on or after 1 January 2019 for the purpose of calculating additional CPP benefits. The drop-in amount is equal to the parent’s average earnings during the five years prior to the birth or adoption of the child if that amount is higher than their actual earnings during the period the child was younger than age seven.
The child-rearing drop-in amount is calculated based on months of earnings after 2018 and prior to birth or adoption of a child. If, however, there are fewer than 60 such months (5 years), then the drop-in is calculated based on the actual number of earnings months, but not lower than 36. If there are less than 36 such months of earnings, the drop-in will be calculated using imputed earnings of 40% of the YMPE for the number of months missing from the minimum of 36.
Additional CPP retirement benefits will initially be low in the early years of the additional Plan due to the lower accrual rates during the phase-in period and few years of contributions. Contributions made over time to the additional CPP allow individuals to accrue partial additional benefits. Full additional retirement benefits are accrued after about 40 years of making contributions.
The maximum additional retirement benefit at age 65 in January 2022 is $9.84 per month or $118.08 per year, and is projected to increase over time. Additional CPP retirement benefits are initially low in the early years of the additional Plan due to the lower accrual rates during the phase-in period and few years of contributions.
The projected maximum additional retirement benefits are shown in Table 32. An individual, with pensionable earnings at or above the YAMPE, who contributed to the additional Plan for at least 40 years starting in the year 2025 or later, would receive the maximum additional retirement benefit payable of $647 per month or $7,759 per year, in 2022 wage-adjusted dollarsFootnote 8. Table 32 accounts for the phase-in period of the additional Plan from 2019 to 2025. The maximum additional CPP retirement benefit represents an increase of 52% over the maximum base CPP retirement pension.
| Pensionable Earnings at or above YMPE before 2024, YAMPE thereafter All amounts in 2022 wage-adjusted dollars Maximum Basic CPP Retirement Benefit in 2022: $15,043.08 per year ($1,253.59 per month) |
|||||||
| Start Retirement Pension at Age 65 on January 1 | Number of Years of Contributions to Additional CPP Table 32 footnote 1 | Additional CPP Retirement Benefit | |||||
|---|---|---|---|---|---|---|---|
| Year | Monthly | Annual | |||||
| 2024 | 5 | $28 | $336 | ||||
| 2029 | 10 | $106 | $1,271 | ||||
| 2044 | 25 | $348 | $4,180 | ||||
| 2065 | 46 Table 32 footnote 2 | $647 | $7,759 | ||||
|
Table 32 footnotes
|
|||||||
A.5.3 Adjustment for Early or Postponed Retirement Benefit
The CPP retirement pension is subject to an actuarial adjustment that depends on the year and contributor’s age at commencement of the pension. As the initial monthly retirement pension is the sum of the retirement benefits under the base and additional Plans, the actuarial adjustment is applied to each component’s benefit.
The retirement pension is permanently adjusted downward or upward by a factor for each month respectively before or after age 65 and the age when the pension commences or, if earlier, age 70. Prior to 2011, the adjustment factor for both pre-65 and post-65 pension take-up was 0.5% per month. Starting in 2011, the adjustment factors were changed. For contributors who take their retirement benefit early (before age 65), the adjustment factor gradually increased to 0.6% per month over the five-year period 2012 to 2016. For those who take their benefit after age 65, the factor gradually increased to 0.7% per month over the three-year period 2011 to 2013. Table 33 shows the legislated pension adjustment factors for the CPP.
| Effective date | Pre-65 Downward Monthly Adjustment Factor | Post-65 Upward Monthly Adjustment Factor |
|---|---|---|
| Pre-2011 | 0.50 | 0.50 |
| 1 January 2011 | 0.50 | 0.57 |
| 1 January 2012 | 0.52 | 0.64 |
| 1 January 2013 | 0.54 | 0.70 |
| 1 January 2014 | 0.56 | 0.70 |
| 1 January 2015 | 0.58 | 0.70 |
| 1 January 2016 | 0.60 | 0.70 |
The downward pension adjustment factor of 0.6% per month, applicable for the year 2016 and thereafter, results in a pension that is reduced by 36% for pension take-up at age 60. The upward factor of 0.7% per month, applicable for 2013 and thereafter, results in a pension increased by 42% for pension take-up at age 70.
In accordance with subsection 115(1.11) of the Canada Pension Plan, the Chief Actuary shall calculate the pension adjustment factors and specify them in every third triennial CPP actuarial report prepared, starting with the Actuarial Report on the Canada Pension Plan as at 31 December 2015. The Chief Actuary may also, if deems it necessary, specify the factors in any supplemental CPP actuarial report after 2015.
In accordance with the legislation, the first CPP actuarial report to specify the pension adjustment factors was the 27th CPP Actuarial Report as at 31 December 2015, which was tabled in the House of Commons on 27 September 2016. The methodology used to calculate the factors is described in the study: “Canada Pension Plan Actuarial Adjustment Factors as specified in the 27th Actuarial Report on the Canada Pension as at 31 December 2015 – Actuarial Study No. 18”, which was published by the OCA in April 2017. The pension adjustment factors are reviewed with each triennial actuarial valuation. In accordance with the CPP statute, the factors are specified in every third triennial actuarial report or more frequently if deemed necessary by the Chief Actuary. The pension adjustment factors will next be specified in the CPP Actuarial Report as at 31 December 2024.
A.5.4 Working Beneficiaries – Post-Retirement Benefit
Prior to 2012, those who received a CPP retirement pension and then returned to work (i.e. working beneficiaries) did not pay contributions and therefore did not continue to build their CPP pension. Commencing 1 January 2012, individuals under the age of 65 who receive either a CPP or QPP retirement pension and continue to work in Canada outside of Québec are required, along with their employers, to contribute to the CPP. Working beneficiaries aged 65 to 69 are not required to contribute, but are given the option to do so. Employers of those working beneficiaries opting to contribute are also required to contribute.
The contributions paid by working beneficiaries provide for a post-retirement benefit. The total post-retirement benefit is equal to the sum of the benefits earned during retirement under the base and additional Plans.
The post-retirement benefit is earned at a rate of 1/40 of the maximum retirement pension per year of post-retirement contributions and is adjusted for the applicable earnings level and age of the contributor.
For both the base and additional CPP, contributions paid by working beneficiaries toward accruing the post-retirement benefit do not affect eligibility for other CPP benefits, except the post-retirement disability benefit described below. Pensionable earnings and additional pensionable earnings of working beneficiaries do not qualify for credit splitting.
A post-retirement benefit becomes payable the year following the year in which contributions are made, and multiple post-retirement benefits may accumulate over time. The total pension payable resulting from the combination of the retirement pension and post-retirement benefit may be greater than the maximum CPP or QPP pension payable. As for the CPP retirement pension, the post-retirement benefit is payable for a beneficiary’s lifetime.
The maximum base and additional CPP post-retirement benefits at age 65 in January 2022 for a working beneficiary who started their retirement pension at age 64 are, respectively, $31.09 and $5.17 per month for a total post-retirement benefit of $36.26 per month or $453.12 per year.
A.6 Disability Pension
A.6.1 Eligibility Requirements
A person is considered disabled if he or she is suffering from a severe and prolonged mental or physical disability. A disability is considered severe if by reason of it the person is regularly incapable of pursuing any substantially gainful occupation; a disability is considered prolonged if it is likely to be long-continuing and of indefinite duration or likely to result in death.
A person who becomes disabled prior to age 65 and is not receiving a CPP retirement pension is eligible for a disability pension provided that contributions have been made, at the time of disablement, for at least four of the previous six calendar years, counting years included wholly or partly in the contributory period. Contributions must be on earnings that are not less than 10% of the YMPE rounded, if necessary, to the next lower multiple of $100. Since 2008, contributors with 25 or more years of contributions to the Plan can meet the eligibility requirement with contributions in three of the last six years.
The eligibility requirements for the additional disability pension are those of the base CPP. That is, a contributor is deemed to be eligible for the additional CPP disability pension if they are eligible for the base CPP disability pension.
A.6.2 Amount of Pension
The initial amount of the monthly disability pension payable is the sum of the disability benefits payable under the base and additional Plans.
The initial base CPP monthly disability pension is the sum of a flat-rate portion payable ($524.64 per month in 2022) depending only on the year in which the benefit is payable and an earnings-related portion equal to 75% of the base CPP retirement pension that would be payable at the onset of disability if the contributory period ended on that date and no actuarial adjustment applied.
The initial amount of the additional CPP monthly disability pension is strictly earnings-related and is equal to 75% of the additional retirement pension that would be payable at the onset of disability if the first and second additional contributory periods ended on that date and no actuarial adjustment applied.
The automatic conversion of the CPP disability pension into a retirement pension at age 65 is determined by base and additional pensionable earnings at the time of disablement, price-indexed to age 65. In other words, the indexing from the time of disablement to age 65, which determines the initial rate of the CPP retirement pension, is in line with increases in prices rather than wages.
The maximum base and additional monthly CPP disability pensions payable in January 2022 are, respectively, $1,457.45 and $7.38, for a total of $1,464.83 per month or $17,577.96 for the year.
The additional CPP disability benefits are initially low in the early years of the additional Plan due to the lower accrual rates during the phase-in period and few years of contributions. The projected maximum additional CPP disability benefits, in 2022 wage-adjusted dollars, are shown in Table 34. The table accounts for the phase-in period of the additional Plan from 2019 to 2025. The maximum additional disability benefit payable is $5,819 per year or $485 per month, in 2022 wage-adjusted dollars.
| Pre-Disability Pensionable Earnings at or above YMPE before 2024, YAMPE thereafter All amounts in 2022 wage-adjusted dollars |
|||
| As at January 1 Year |
Number of Years of Contributions to Additional CPPTable 34 Footnote 1 | Additional CPP Disability Benefit | |
|---|---|---|---|
| Monthly | Annual | ||
| 2024 | 5 | $21 | $252 |
| 2029 | 10 | $79 | $953 |
| 2044 | 25 | $261 | $3,135 |
| 2065+ | 46Table 34 Footnote 2 | $485 | $5,819 |
|
Table 34 Footnotes
|
|||
A.6.3 Post-Retirement Disability Benefit (Base CPP only)
Prior to 2019, base CPP retirement beneficiaries who were deemed disabled after the start of their retirement pension could not receive the CPP disability pension, even if they were still under age 65 and otherwise met eligibility requirements. Commencing 1 January 2019, a post-retirement disability benefit equal to the flat-rate portion of the disability pension ($524.64 per month in 2022) is payable under the base CPP to retirement beneficiaries who are deemed disabled while under age 65. Contributions paid by working beneficiaries toward post-retirement benefits are used in determining eligibility for the post-retirement disability benefit. Eligible disabled retirement beneficiaries receive the post-retirement disability benefit in addition to their retirement pension, and the dependent children of disabled retirees receive children’s benefits.
The post-retirement disability benefit pertains only to the base Plan. There is no additional post-retirement disability benefit payable under the additional Plan.
A.7 Survivor’s Pension
A.7.1 Eligibility Requirements
A person who was married to a contributor or was a common-law partner of a contributor at the time of the contributor’s death is considered to be a survivor of the deceased contributor. The survivor is eligible for a survivor’s pension if the following conditions are met as at the date of the contributor’s death:
- The deceased contributor must have made contributions during the lesser of: (i) ten calendar years, or (ii) one-third of the total number of years included wholly or partly in their contributory period, but not for less than three years.
- If the survivor is the separated spouse of the deceased contributor, there must be no cohabiting common-law partner of the contributor at the time of death. If the survivor is the common-law partner of the deceased contributor, the couple must have cohabited for not less than one year immediately before the death of the contributor. If the common-law partner is of the same sex as the deceased contributor, the death must have occurred on or after 17 April 1985.
- Prior to 2019, the surviving spouse or common-law partner must have had dependent children, been disabled, or been at least 35 years of age. As of 1 January 2019, these conditions no longer apply.
The eligibility requirements for the additional survivor’s pension are those of the base CPP. That is, a person is eligible for an additional CPP survivor’s pension if they are eligible for the base CPP survivor’s pension.
A.7.2 Amount of Pension
The initial amount of the monthly survivor’s pension payable under the CPP is equal to the sum of the survivor’s benefits payable under the base and additional Plans.
Prior to 2019, survivors who were not disabled and did not have dependent children had their survivor’s pension reduced by 10 per cent for each year they were under the age of 45 when their spouse or common-law partner died. This reduction lasted until age 65, when the survivor’s pension was then recalculated. This meant that survivors under the age of 35 who were not disabled and did not have dependent children did not receive a survivor’s pension until age 65.
As of 1 January 2019, reductions are no longer applied to the survivor’s pension for survivors under age 45 who are neither disabled nor have dependent children. A surviving spouse and common-law partner of any CPP contributor who has made sufficient contributions will receive an unreduced survivor’s pension.
The amount of the pension changes depending on whether the survivor is younger or older than age 65 as described below. Additional survivor’s benefits regardless of age will initially be low in the early years of the additional Plan due to the lower accrual rates during the phase-in period and few years of additional contributions previously made by the deceased contributor.
A.7.2.1 New Survivor under Age 65
The initial monthly survivor’s pension payable until the surviving spouse or common-law partner attains age 65 is the sum of a base CPP flat-rate benefit and base and additional CPP earnings-related benefits. There is no additional CPP flat-rate benefit.
The base CPP flat-rate survivor’s benefit depends only on the year in which the survivor’s benefit is payable ($204.69 per month in 2022).
The earnings-related benefits payable under the base and additional CPP depend initially only on the contributor’s record of pensionable and additional pensionable earnings, respectively as at the date of death. The initial earnings-related survivor’s benefit is equal to 37.5% of either the retirement pension of the deceased contributor if they had been receiving a pension, or the retirement pension that would have been payable to the deceased contributor if the contributory and additional contributory periods had ended at the time of death, with no actuarial adjustment in either case.
The maximum base and additional monthly CPP earnings-related survivor’s benefit for new survivors under age 65 are, respectively, $466.41 and $3.69 in January 2022. In total, including the base CPP flat-rate amount, the maximum CPP survivor’s pension payable in January 2022 for new survivors under age 65 is $674.79 per month or $8,097.48 for the year.
Additional CPP survivor benefits are initially low in the early years of the additional Plan due to the lower accrual rates during the phase-in period and few years of contributions. The projected maximum additional CPP survivor’s benefits, in 2022 wage-adjusted dollars, are shown in Table 35. The table accounts for the phase-in period of the additional Plan from 2019 to 2025. The maximum additional survivor’s benefit payable for survivors younger than age 65 is $2,910 per year or $243 per month, in 2022 wage-adjusted dollars.
| Prior Earnings of Deceased Contributor at or above YMPE before 2024, YAMPE thereafter All amounts in 2022 wage-adjusted dollars |
|||
| As at January 1 Year |
Number of Years of Prior Contributions by Deceased Contributor to Additional CPPTable 35 Footnote 1 | Additional CPP Survivor's Benefit | |
|---|---|---|---|
| Monthly | Annual | ||
| 2024 | 5 | $11 | $126 |
| 2029 | 10 | $40 | $477 |
| 2044 | 25 | $131 | $1,568 |
| 2065+ | 46Table 35 Footnote 2 | $243 | $2,910 |
|
Table 35 Footnotes
|
|||
A.7.2.2 Survivor Age 65 or Over
At age 65, or upon becoming widowed at a later age, an eligible surviving spouse or common-law partner is entitled to a monthly survivor’s benefit equal to 60% of either the retirement pension of the deceased contributor if they had been receiving a pension, or the retirement pension that would have been payable to the deceased contributor if the contributory and additional contributory periods had ended at the time of death, with no actuarial adjustment in either case.
The maximum base and additional monthly CPP survivor’s pensions payable in January 2022 for new survivors aged 65 or older are, respectively, $746.25 and $5.90, for a total of $752.15 per month or $9,025.80 for the year.
As for survivors benefits payable to survivors younger than 65, survivor benefits for those age 65 and older are initially low in the early years of the additional Plan due to the lower accrual rates during the phase-in period and few years of contributions. The projected additional CPP survivor’s benefits, in 2022 wage-adjusted dollars, are shown in Table 36. The table accounts for the phase-in period of the additional Plan from 2019 to 2025. The maximum additional survivor’s benefit payable for survivors aged 65 or older is $4,655 per year or $388 per month, in 2022 wage-adjusted dollars.
| Prior Earnings of Deceased Contributor at or above YMPE before 2024, YAMPE thereafter All amounts in 2022 wage-adjusted dollars |
|||
| As at January 1 Year |
Number of Years of Prior Contributions by Deceased Contributor to Additional CPPTable 36 Footnote 1 | Additional CPP Survivor's Benefit | |
|---|---|---|---|
| Monthly | Annual | ||
| 2024 | 5 | $17 | $201 |
| 2029 | 10 | $64 | $762 |
| 2044 | 25 | $209 | $2,508 |
| 2065+ | 46Table 36 Footnote 2 | $388 | $4,655 |
|
Table 36 Footnotes
|
|||
A.8 Death Benefit (Base CPP only)
A lump sum benefit is payable to the estate of a deceased contributor if the eligibility rules for the survivor’s benefit are met. Prior to 2019, the amount of the death benefit was equal to six times the monthly amount of the CPP retirement pension accrued or payable in the year of death, adjusted to exclude any actuarial adjustments, and subject to a maximum of ten percent of the YMPE for the year of death prior to 1998, and $2,500 thereafter. As of 1 January 2019, the death benefit equals the flat-rate amount of $2,500.
The death benefit pertains only to the base CPP. There is no additional CPP death benefit.
A.9 Child’s Benefits (Base CPP only)
Each child under age 18 and each full-time student aged 18 to 25 who is dependent on a contributor eligible for a CPP disability benefit (the disability pension or post-retirement disability benefit) or who was dependent on a deceased contributor who satisfied the requirements for a survivor’s pension is entitled to a flat-rate monthly benefit ($264.53 in 2022). Furthermore a child may receive more than one child’s benefit simultaneously.
The child’s benefits pertain only to the base CPP. There are no additional CPP child’s benefits.
A.10 Combined Benefits
The combined benefits rules of the CPP regarding the simultaneous payment of disability and survivor’s pensions or retirement and survivor’s pensions are complex and involve calculations and comparisons of various amounts.
For combined benefits under the base CPP, if there are two flat-rate components, then the beneficiary receives the larger one. For the earnings-related components, the beneficiary receives the larger one and 60% of the smaller one.
As well, the total combined earnings-related component is limited to the maximum retirement pension at age 65 for combined survivor-retirement benefits and to the maximum disability pension for combined survivor-disability benefits. In the case of combined survivor-retirement benefits where the retirement pension is taken early (before age 65), the final retirement amount is actuarially adjusted.
The combined benefits under the additional CPP follow the same rules as for the base CPP, except that there are no flat rate benefits payable, and the limits on the earnings-related amounts do not apply.
A.11 Inflation Adjustments
All monthly CPP benefits are indexed annually in accordance with inflation, as measured by the Pension Index. Benefits are multiplied on 1 January of each calendar year by the ratio of the Pension Index applicable for that calendar year to the Pension Index for the preceding year. As the Pension Index for a year is at least equal to the value of the previous year’s Pension Index, benefits are either held constant or increased from one year to the next.
A.12 Credit Splitting
Pensionable and additional pensionable earnings may be split between separated or divorced couples (legal spouses or common-law partners) for each month the couple lived together. Pensionable earnings (of the base CPP) are used to establish eligibility for CPP benefits, and both pensionable and additional pensionable earnings are used to calculate the amounts of benefits.
Contributors may obtain a credit split even if they have remarried. However, pensionable and additional pensionable earnings cannot be split for any year in which the total earnings of the former couple do not exceed twice the YBE. Credit splitting also does not apply for any period of cohabitation during which a former spouse or common-law partner received a CPP retirement pension.
A.13 Pension Sharing
Couples (legal spouses or common-law partners) in an ongoing relationship may voluntarily (at the request of one of them) share their CPP retirement pensions corresponding to the number of years during which they cohabited. This applies provided both spouses have reached the minimum age requirement to receive a retirement pension. Sharing is possible even if only one of the spouses participated in the Plan. Pension sharing ceases upon separation, divorce, or death.
Appendix B – Data, Assumptions and Methodology
B.1 Introduction and Context
This section describes the data, assumptions, and methodology that underlie the financial projections in the Results sections of this report.
Future cash flows for the base and additional Plans are projected over a long period of time, i.e. over more than 75 years, and depend on assumptions such as those regarding fertility, mortality, migration, labour force participation, job creation, unemployment, inflation, employment earnings, and investment returns. These assumptions form the basis for the projections of future income and expenditures of both components of the CPP.
Over the years, the cumulative difference between revenues from contributions and investment income and the expenditures of the base and additional CPP generates the respective accumulated assets. The ratio of the end-of-year assets to the following year’s expenditures (the A/E ratio) is then calculated for each component of the Plan.
For the base CPP, the A/E ratio is used to determine the steady-state contribution rate, which is the lowest contribution rate that, in the long term, would generally stabilize the A/E ratio. The steady-state contribution rate is determined in this way before the consideration of any full funding requirement for increased or new benefits. The full funding rate for increased or new benefits is determined independently of the steady-state rate. It is added to the steady-state rate to produce the minimum contribution rate.
For the additional CPP, the A/E ratio combined with a funding ratio of at least 100% on an open-group basis are used to determine the first and second additional minimum contribution rates together with any permanent full funding requirement for increased or new benefits. Temporary increases in the additional minimum contribution rates to fully amortize any past costs resulting from increased or new benefits would be determined separately.
Although the demographic, economic, and investment assumptions represent the Chief Actuary’s best estimates, the resulting future financial states of the base and additional CPP presented in this report should be interpreted with caution. This information is not intended to be predictions, but rather projections of the future financial states of the base and additional CPP.
The future revenues and expenditures of the CPP depend on many economic factors. It is important to define the individual economic assumptions in the context of a long term overall economic perspective. For this report, it is assumed that, despite the current uncertain outlook for major economies, a moderate and sustainable growth in the Canadian economy will persist throughout the projection period.
The actuarial examination of the CPP involves the projection of its revenues and expenditures over a long period of time. Although best judgment is used regarding future economic trends, it is nonetheless difficult to anticipate all economic changes that may occur during the projection period. There will always be some degree of uncertainty.
The COVID-19 pandemic affected the labour markets deeply during 2020 and 2021 because of sanitary measures and lockdowns. Significant job losses and elevated unemployment rates were also observed. However, by the end 2021, main labour market measures had rebounded to pre-pandemic levels in most sectors of the economy. Short-term uncertainty due to the pandemic exists with other variables such as mortality, migration and wages.
The financial market performed well through 2021 after an initial pandemic-related decline at the end of fiscal year 2019-2020. However, there have been significant disruptions in the financial markets in 2022, which are likely attributable to the escalation of the conflict in Ukraine. In addition, the uncertainty surrounding high inflation due to the demand and supply shocks caused by the pandemic, has been exacerbated by the conflict in Ukraine. Given the significant effects on the financial projections for the CPP, the escalation of the conflict in Ukraine is considered a subsequent event that was taken into account for the purpose of this 31st CPP Actuarial Report.
Furthermore, the projected aging of the population combined with the continued retirement of the baby boom generation over the next few decades will certainly create significant social and economic changes. It is possible that the evolution of the working-age population, especially the active population, will be quite different from what has been historically observed and what has been assumed for the purpose of this report.
Other factors that add to the uncertainty include the timing and pace of transition to a green economy, the pace of technological advances and innovation as well as worldwide policies on protectionism vs. globalization.
As all these events evolve, the economic, demographic and investment environments continue to be subject to sustained volatility and unpredictability. The OCA will continue to monitor current and emerging trends and will adjust assumptions as needed in future reports.
B.2 Data
Table 37 lists the sources of data used for this report categorized by major assumptions. The most recent years of data are also listed.
| Major Assumptions | Source of Data | Last Experience Year |
|---|---|---|
| PopulationTable 37 Footnote 1 | ||
|
Fertility
|
Statistics Canada, Institut de la statistique du Québec | 2020 |
|
Migration
|
Statistics Canada | 2021 |
|
Mortality
|
Statistics Canada Life Tables | 2020Table 37 Footnote 1 |
|
Initial population
|
Statistics Canada | 2021 |
| Economic | ||
|
CPI
|
Statistics Canada | 2022Table 37 Footnote 2 |
|
Real Wage Increases
|
Statistics Canada | 2022Table 37 Footnote 3 |
| Records of Earnings file from ESDC | 2020 | |
|
Labour Force (participation, employment, and unemployment rates)
|
Statistics Canada | 2021 |
|
Total Earnings and Contributory Earnings
|
Records of Earnings file from ESDC | 2020 |
| Contributions | ESDC | 2020 |
| Canada Revenue Agency | 2020 | |
| Benefits | Administrative data from ESDC | 2021 |
| Assets and Investment | CPPIB Canadian Institute of Actuaries’ Report on Canadian Economic Statistics 1924-2021 |
2022Table 37 Footnote 4 |
| Operating Expenses | ESDC and CPPIB | 2021 |
|
Table 37 Footnotes
|
||
In addition to the data sources listed above, other data and reference sources were consulted for the development of the assumptions used in this report, such as mortality data from the United Kingdom and United States and various economic forecasts.
B.3 Demographic Assumptions
Both the historical and projected populations of Canada less Québec are required for the calculation of future CPP contributions and benefits of the relevant cohorts of contributors and beneficiaries.
The populations of Canada and Québec as at 1 July 2021 are used as a starting point. The populations are then projected by age and sex from one year to the next by adding births and net migrants and subtracting deaths. Applying the fertility, migration, and mortality assumptions to the starting population develops the annual numbers of births, net migrants, and deaths. The relevant population for the CPP, which is the population of Canada less Québec, is obtained by subtracting the projected population of Québec from the projected population of Canada.
The population covered by the CPP pertains to Canada less Québec, but includes all members of the Canadian Forces (CF) and the Royal Canadian Mounted Police (RCMP). The approach used above to determine the CPP population does not make an explicit allowance for the members of the CF or RCMP residing in Québec or outside Canada. However, provision for this group is made implicitly through the development of the number of people with earnings and the proportion of contributors as described in section B.5 of this appendix.
B.3.1 Initial Population as at 1 July 2021
The starting point for the demographic projections is based on the most recent Statistics Canada population estimates as at 1 July 2021 for Canada and Québec, by age and sex. The estimates are based on the 2016 Census. These estimates are adjusted by ungrouping ages 100 and older into individual ages using the observed distribution of Old Age Security program beneficiaries by age for ages 100 and older.
B.3.2 Fertility Rates
There are two definitions for the fertility rate: the total fertility rate and the cohort fertility rate. The total fertility rate corresponds to the average number of children born in a given calendar year. Specifically, it is the sum of the fertility rates by age group for women aged 15 to 49 in a given calendar year. In comparison, the cohort fertility rate is the average number of children born to a woman in her lifetime, for women born in a specific year. It gives an idea of trends and variations between different generations over time.
The total fertility rate in Canada has declined significantly since the baby boom period, when the rate peaked at nearly 4.0 per woman in the late 1950s. The baby bust period that followed in the mid-1960s initiated a decline in total fertility rates, resulting in a then-record low of 1.6 children per woman by the mid-1980s. The total fertility rate rose slightly in the early 1990s, but then generally declined further to a level of 1.5 by the late 1990s. Starting in the 2000s, Canada was one of many industrialized countries that saw their total fertility rates increase. By 2008, the total fertility rate for Canada had reached 1.68. However, in some industrialized countries, including Canada, the total fertility rate has decreased since 2008, which could be attributable to the 2008 economic downturn, continued economic uncertainty, as well as other factors.
The total fertility rate for Canada was 1.47 in 2019 and 1.40 in 2020. The significant decrease in 2020 could be due to the high level of uncertainty and much lower immigration caused by the COVID-19 pandemic.
Similar to Canada, the total fertility rate in Québec fell from a high of 4.0 per woman in the 1950s; however, the rate for Québec fell to a greater degree, reaching 1.4 by the mid-1980s. The rate for Québec then recovered somewhat in the early 1990s to over 1.6 and subsequently declined to below 1.5 by the late 1990s. The fertility rate for Québec increased with the introduction of the Québec Childcare Centres in 1997 and with the introduction of the Québec Parentale Insurance Plan (QPIP) in 2006. There was a significant increase in the rate after the year 2000, with the rate reaching 1.74 by 2008. In 2006, the rate for Québec exceeded Canada’s level for the first time since 1958. However, similar to Canada’s fertility rate, the fertility rate for Québec has been decreasing in recent years. The total fertility rate for Québec was 1.57 in 2019 and 1.52 in 2020.
Fertility rates are affected by many factors, including social attitudes, reproductive technologies, as well as economic and environmental conditions. Although there have been periods of growth in the total fertility rates in recent decades, it is unlikely that the rates will return to historical levels in the absence of significant societal changes. It is assumed for this report that the continued economic uncertainty and the COVID-19 pandemic have caused a temporary downward effect on total fertility rates, with couples choosing to postpone having any or more children until conditions improve. These effects were taken into consideration along with historical trends in age-specific fertility rates over the last 15 years. Given the uncertainty surrounding the effect of the COVID-19 pandemic on fertility rates in the year 2020, the data for that year were excluded from the analysis for purposes of setting the fertility rates for years 2021 and beyond. The historical data considered are therefore from the 15-year period ending in 2019.
In 2021, the Government of Canada announced that it would work with provinces and territories to establish a Canada-Wide Early Learning and Child Care PlanFootnote 9. The fertility rate assumptions for this 31st CPP Actuarial Report take into account the proposed plan. Consistent with what was experienced in Québec with the introduction of the QPIP, the plan could lead to an increase in fertility rates for certain age groups and hence was considered in setting the assumptions for this report. The effect on the fertility rates is assumed to occur over the first several years following the adoption of the system before leveling out.
To determine the ultimate total fertility rate for Canada, the historical fertility rate of each age group was studied and projected independently. Based on historical analysis and the factors mentioned above, it is assumed that the total fertility rate from 2029 onward for Canada will be 1.54 children per woman, which is lower than the ultimate rate of 1.62 assumed for the 30th CPP Actuarial Report.
For Québec, the assumption was set by analyzing both the historical fertility rate as well as the difference between Canada’s and Québec’s fertility rates for each age group. The introduction of the Canada-Wide Early Learning and Child Care Plan is expected to reduce this difference. It is therefore assumed that the difference in the rates will decrease until 2029 and remain stable thereafter. As a result, the total fertility rate from 2029 onward for Québec is assumed to be 1.55 children per woman, which is lower than the assumed ultimate rate of 1.65 in the 30th CPP Actuarial Report.
Although the historical total fertility rates, based on age-group rates, are used to set the assumptions for the future, it is nonetheless useful and informative to consider the historical progression of the cohort fertility rates. Over time, the assumed age-group rates lead to cohort fertility rates which converge to the total fertility rate assumption, as shown for Canada in Table 38.
The cohort fertility rates in both Canada and Québec have declined over time. For females born in 1940, who reached the end of their childbearing years (turned age 49) in 1989, the cohort rates were 2.69 and 2.34 for Canada and Québec, respectively. However, for females reaching the end of their childbearing years in 2019 (born in 1970), the Canada and Québec cohort fertility rates were 1.78 and 1.74, respectively.
| Year of Birth of WomanTable 38 Footnote 1 | Annual Fertility Rates by Age and Year of Birth (per 1,000 women) |
Cohort Fertility Rate per WomanTable 38 Footnote 2 | ||||||
|---|---|---|---|---|---|---|---|---|
| 15-19 | 20-24 | 25-29 | 30-34 | 35-39 | 40-44 | 45-49 | ||
| 1940 | 59.7 | 231.6 | 152.6 | 70.5 | 20.3 | 3.1 | 0.1 | 2.69 |
| 1945 | 54.7 | 161.4 | 130.4 | 65.7 | 19.9 | 3.3 | 0.1 | 2.18 |
| 1950 | 45.0 | 118.9 | 126.2 | 67.6 | 23.3 | 4.2 | 0.2 | 1.93 |
| 1955 | 37.4 | 103.7 | 121.1 | 73.6 | 29.0 | 5.2 | 0.2 | 1.85 |
| 1960 | 31.3 | 91.3 | 117.5 | 86.1 | 32.6 | 6.2 | 0.4 | 1.83 |
| 1965 | 26.0 | 76.8 | 121.2 | 84.9 | 36.4 | 7.9 | 0.5 | 1.77 |
| 1970 | 22.7 | 76.5 | 104.7 | 91.3 | 48.5 | 10.6 | 0.8Table 38 Footnote 2 | 1.78Table 38 Footnote 2 |
| 1975 | 25.6 | 64.6 | 97.9 | 106.1 | 53.4 | 11.7Table 38 Footnote 2 | 0.9 | 1.80 |
| 1980 | 20.0 | 54.2 | 101.9 | 107.7 | 57.1Table 38 Footnote 2 | 13.6 | 1.0 | 1.78 |
| 1985 | 14.9 | 52.6 | 96.3 | 108.0Table 38 Footnote 2 | 61.0 | 15.6 | 1.0 | 1.75 |
| 1990 | 13.9 | 44.6 | 87.2Table 38 Footnote 2 | 108.0 | 69.7 | 16.5 | 1.0 | 1.70 |
| 1995 | 12.1 | 37.1Table 38 Footnote 2 | 78.7 | 115.4 | 73.2 | 16.5 | 1.0 | 1.67 |
| 2000 | 7.8Table 38 Footnote 2 | 28.5 | 75.6 | 118.3 | 73.2 | 16.5 | 1.0 | 1.60 |
| 2005 | 5.7 | 23.1 | 74.5 | 118.3 | 73.2 | 16.5 | 1.0 | 1.56 |
| 2006 | 5.5 | 22.0 | 74.5 | 118.3 | 73.2 | 16.5 | 1.0 | 1.55 |
| 2007 | 5.3 | 20.9 | 74.5 | 118.3 | 73.2 | 16.5 | 1.0 | 1.55 |
| 2008 | 5.2 | 20.9 | 74.5 | 118.3 | 73.2 | 16.5 | 1.0 | 1.55 |
| 2009 | 5.0 | 20.9 | 74.5 | 118.3 | 73.2 | 16.5 | 1.0 | 1.55 |
| 2010 | 4.8 | 20.9 | 74.5 | 118.3 | 73.2 | 16.5 | 1.0 | 1.55 |
| 2011 | 4.7 | 20.9 | 74.5 | 118.3 | 73.2 | 16.5 | 1.0 | 1.54 |
| 2012+ | 4.5 | 20.9 | 74.5 | 118.3 | 73.2 | 16.5 | 1.0 | 1.54 |
|
Table 38 Footnotes
|
||||||||
Table 39 below shows the assumed fertility rates of each age group and the resulting assumed total fertility rates by calendar year.
| Year | Annual Fertility Rates by Age Group (per 1,000 women) |
Total | ||||||
|---|---|---|---|---|---|---|---|---|
| 15-19 | 20-24 | 25-29 | 30-34 | 35-39 | 40-44 | 45-49 | ||
| 2022 | 5.7 | 28.5 | 78.7 | 108.0 | 61.0 | 13.6 | 0.9 | 1.48 |
| 2023 | 5.5 | 27.4 | 78.0 | 109.5 | 62.8 | 14.0 | 0.9 | 1.49 |
| 2024 | 5.3 | 26.3 | 77.4 | 110.9 | 64.5 | 14.4 | 0.9 | 1.50 |
| 2025 | 5.2 | 25.3 | 76.8 | 112.4 | 66.3 | 14.8 | 0.9 | 1.51 |
| 2026 | 5.0 | 24.2 | 76.2 | 113.9 | 68.0 | 15.2 | 0.9 | 1.52 |
| 2027 | 4.8 | 23.1 | 75.6 | 115.4 | 69.7 | 15.6 | 1.0 | 1.53 |
| 2028 | 4.7 | 22.0 | 75.0 | 116.8 | 71.4 | 16.1 | 1.0 | 1.53 |
| 2029+ | 4.5 | 20.9 | 74.5 | 118.3 | 73.2 | 16.5 | 1.0 | 1.54 |
Chart 3 shows the historical and projected total and cohort fertility rates for Canada.
Chart 3 Historical and Projected Total and Cohort Fertility Rates for CanadaChart 3 Footnote 1
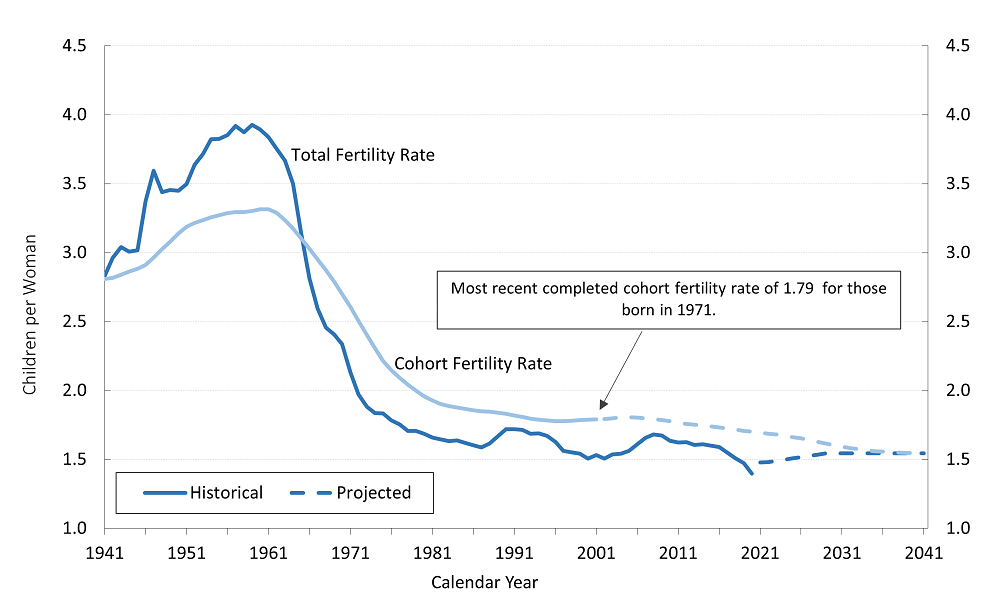
Chart 3 Footnotes
- Chart 3 Footnote 1
-
Cohort fertility rates are based on the age of a woman being 30 in a given calendar year. For instance, the cohort fertility rate for the year 2016 pertains to women born in 1986.
Text description: Chart 3 Historical and Projected Total and Cohort Fertility Rates for Canada
Line chart showing the historical and projected total and cohort fertility rates for Canada, where the cohort fertility rates are based on a woman being age 30 in a given calendar year. Y axis represents the rate in number of children per women. X axis represents the year.
The Total Fertility Rate is 2.8 children per woman in 1941, increases overall to reach its highest point of 3.9 in 1959, and then decreases significantly to 1.6 by the mid-1980s. From the mid-1980s until 2019, the Total Fertility Rate has periods of growth and decline, fluctuating between 1.5 and 1.7, with a value of 1.40 in 2020. After 2020, the rate is projected to gradually increase to reach 1.54 in 2029 and remain at that level thereafter.
The cohort fertility rate is 2.8 children per woman in 1941, increases to its highest point of 3.3 in 1960, then decreases thereafter, reaching a projected value of 1.55 by 2041.
The most recent completed cohort fertility rate of 1.79 in 2001 is for those born in 1971.
| Calendar Year | Cohort Fertility Rates Historical | Total Fertility Rates Historical |
|---|---|---|
| 1941 | 2,808 | 2,831 |
| 1942 | 2,816 | 2,962 |
| 1943 | 2,839 | 3,040 |
| 1944 | 2,864 | 3,008 |
| 1945 | 2,883 | 3,017 |
| 1946 | 2,911 | 3,373 |
| 1947 | 2,963 | 3,594 |
| 1948 | 3,026 | 3,440 |
| 1949 | 3,080 | 3,455 |
| 1950 | 3,140 | 3,451 |
| 1951 | 3,186 | 3,498 |
| 1952 | 3,216 | 3,637 |
| 1953 | 3,237 | 3,715 |
| 1954 | 3,256 | 3,823 |
| 1955 | 3,271 | 3,826 |
| 1956 | 3,288 | 3,854 |
| 1957 | 3,295 | 3,920 |
| 1958 | 3,295 | 3,875 |
| 1959 | 3,302 | 3,928 |
| 1960 | 3,316 | 3,893 |
| 1961 | 3,316 | 3,838 |
| 1962 | 3,289 | 3,755 |
| 1963 | 3,236 | 3,668 |
| 1964 | 3,174 | 3,500 |
| 1965 | 3,104 | 3,145 |
| 1966 | 3,028 | 2,811 |
| 1967 | 2,951 | 2,595 |
| 1968 | 2,873 | 2,457 |
| 1969 | 2,791 | 2,409 |
| 1970 | 2,699 | 2,336 |
| 1971 | 2,606 | 2,130 |
| 1972 | 2,505 | 1,971 |
| 1973 | 2,403 | 1,883 |
| 1974 | 2,305 | 1,837 |
| 1975 | 2,214 | 1,833 |
| 1976 | 2,147 | 1,783 |
| 1977 | 2,093 | 1,756 |
| 1978 | 2,043 | 1,706 |
| 1979 | 1,998 | 1,706 |
| 1980 | 1,959 | 1,686 |
| 1981 | 1,927 | 1,658 |
| 1982 | 1,904 | 1,646 |
| 1983 | 1,888 | 1,634 |
| 1984 | 1,877 | 1,637 |
| 1985 | 1,867 | 1,621 |
| 1986 | 1,857 | 1,603 |
| 1987 | 1,850 | 1,587 |
| 1988 | 1,846 | 1,615 |
| 1989 | 1,840 | 1,668 |
| 1990 | 1,830 | 1,721 |
| 1991 | 1,819 | 1,721 |
| 1992 | 1,809 | 1,714 |
| 1993 | 1,797 | 1,688 |
| 1994 | 1,787 | 1,690 |
| 1995 | 1,783 | 1,673 |
| 1996 | 1,778 | 1,628 |
| 1997 | 1,779 | 1,561 |
| 1998 | 1,781 | 1,552 |
| 1999 | 1,785 | 1,541 |
| 2000 | 1,788 | 1,506 |
| 2001 | 1,791 | 1,532 |
| 2002 | blank | 1,506 |
| 2003 | blank | 1,536 |
| 2004 | blank | 1,542 |
| 2005 | blank | 1,562 |
| 2006 | blank | 1,611 |
| 2007 | blank | 1,657 |
| 2008 | blank | 1,682 |
| 2009 | blank | 1,674 |
| 2010 | blank | 1,636 |
| 2011 | blank | 1,623 |
| 2012 | blank | 1,626 |
| 2013 | blank | 1,606 |
| 2014 | blank | 1,610 |
| 2015 | blank | 1,600 |
| 2016 | blank | 1,589 |
| 2017 | blank | 1,549 |
| 2018 | blank | 1,508 |
| 2019 | blank | 1,473 |
| 2020 | blank | 1,398 |
| Calendar Year | Cohort Fertility Rates Projected | Total Fertility Rates Projected |
|---|---|---|
| 2002 | 1,794 | blank |
| 2003 | 1,799 | blank |
| 2004 | 1,805 | blank |
| 2005 | 1,807 | blank |
| 2006 | 1,805 | blank |
| 2007 | 1,798 | blank |
| 2008 | 1,793 | blank |
| 2009 | 1,786 | blank |
| 2010 | 1,778 | blank |
| 2011 | 1,765 | blank |
| 2012 | 1,759 | blank |
| 2013 | 1,753 | blank |
| 2014 | 1,745 | blank |
| 2015 | 1,739 | blank |
| 2016 | 1,732 | blank |
| 2017 | 1,725 | blank |
| 2018 | 1,717 | blank |
| 2019 | 1,708 | blank |
| 2020 | 1,701 | blank |
| 2021 | 1,695 | 1,478 |
| 2022 | 1,688 | 1,482 |
| 2023 | 1,681 | 1,490 |
| 2024 | 1,672 | 1,499 |
| 2025 | 1,662 | 1,508 |
| 2026 | 1,653 | 1,517 |
| 2027 | 1,641 | 1,526 |
| 2028 | 1,628 | 1,535 |
| 2029 | 1,615 | 1,544 |
| 2030 | 1,603 | 1,544 |
| 2031 | 1,592 | 1,544 |
| 2032 | 1,583 | 1,544 |
| 2033 | 1,574 | 1,544 |
| 2034 | 1,567 | 1,544 |
| 2035 | 1,560 | 1,544 |
| 2036 | 1,556 | 1,544 |
| 2037 | 1,552 | 1,544 |
| 2038 | 1,549 | 1,544 |
| 2039 | 1,547 | 1,544 |
| 2040 | 1,546 | 1,544 |
| 2041 | 1,545 | 1,544 |
Finally, in accordance with the average experience over the last 10, 20, and 30 years, the assumed ratio of male to female newborns is 1.053, which is the same as for the 30th CPP Actuarial Report.
B.3.3 Mortality
For this report, the mortality rate projections start from the year 2019 mortality rates of Statistics Canada (2019 Canada Life Tables or 2019 CLT). According to Statistics Canada, life expectancies at birth in 2019 without any assumed future improvements in mortality (i.e. reductions in mortality) for males and females in Canada were 80.3 and 84.4 years, respectively, compared to 80.8 and 84.6 years projected under the 30th CPP Actuarial Report. At age 65 in 2019, life expectancies were 19.6 and 22.4 years according to Statistics Canada, compared to 20.0 and 22.6 years projected under the 30th CPP Actuarial Report for males and females, respectively.
Although Statistics Canada’s 2020 CLT were published in January 2022, they were not used as the starting point for mortality rates nor for developing mortality improvement rates beyond 2020 given that they reflect significant increases related to COVID-19 deaths. However, 2020 mortality rates and mortality improvement rates reflect Statistics Canada’s 2020 CLT. In 2020, life expectancy at birth (without future mortality improvements) stood at 79.5 for males and 84.0 for females, a decrease from 2019 of 0.7 and 0.4 for males and females respectively.
The average annual mortality improvement rates experienced in Canada over the 15-year period from 2004 to 2019 by age and sex were used as the basis for projecting annual mortality improvement rates from 2021 onward. Improvement rates by age and sex for years 2021 to 2039 were determined by cubic interpolation between:
- the improvement rates of year 2019 and
- the assumed ultimate improvement rates described below in respect of the period 2039 and thereafter.
For the year 2039 and thereafter for Canada, the assumed ultimate annual rates of mortality improvement vary by age only and not by sex or calendar year. The assumed ultimate mortality improvement rates are derived using a combination of backward- and forward-looking approaches. The analysis of the Canadian experience over the period from 1921 to 2019 was combined with an analysis of the possible drivers of future mortality improvements. Mortality improvement rates for males at most ages are currently higher than those for females but are assumed to decrease to the same level as female rates from 2039 onward. The mortality improvement rates for Québec are assumed to be the same as for Canada from 2021 onward.
The ultimate rate for both sexes for ages 0 to 89 is set at 0.8% per year from 2039 onward for Canada and Québec. For ages above 89, the ultimate improvement rate is set to reduce from 0.5% for the age group 90-94 to 0.2% for those aged 95 and older.
Once the projected mortality rates were calculated using the assumed mortality improvement rates, additional factors were then applied to the mortality rates for both Canada and Québec in order to reflect the additional increase in mortality rates due to the COVID-19 pandemic as well as the impact of the opioid crisis.
For 2021, COVID-19 mortality adjustment factors by age group were determined using data on the number of COVID-19 deaths from both Health Canada and Statistics Canada. Due to the uncertainty of the effects of COVID-19 on mortality, these adjustement factors were phased out over the two year period 2022-2023. The pandemic is therefore assumed to have a residual effect on mortality in 2022, followed by an assumed full recovery and reversion to the projected unadjusted mortality rates for years 2023 and onward.
Over the last decade, Canada has been faced with an important increase in accidental drug poisoning deaths and the COVID-19 pandemic has exacerbated the issue. Opioid overdose is a relatively new cause of death, and it is a subset of accidental drug poisoning deaths. It is more prevalent in the 25 to 49 age group and among men. In order to reflect the impact of the pandemic on the opioid-related deaths, opioid-related mortality adjustment factors were derived using data from both Health Canada and Statistics Canada. These mortality adjustment factors apply only to the year 2021 (they are assumed to be 0 for years 2022 and beyond). It is further assumed that, over the next decade, the opioid crisis in Canada will subside, due to several government initiatives to increase awareness and reduce opioid supply. Projected mortality rates of those age groups affected by the opioid crisis are assumed to revert back to normal levels, leading to a period of high growth in mortality improvement rates.
Table 40 shows the total adjustment factors, i.e. taking into account the assumed increase in COVID-19 deaths and in opioid-related deaths resulting from the pandemic, that were applied to the mortality rates for the period 2021-2022. For reference purpose, the table also shows the actual increases in mortality rates for 2020. Table 41 shows the total adjustments by age, which amount to increases in mortality rates of 6.0% in 2020, 5.5% in 2021, and 2.0% in 2022.
| Age Group | 2020 | 2021 | 2022 |
|---|---|---|---|
| 0-19 | 1.0 | 1.0 | 0.0 |
| 20-29 | 12.0 | 12.0 | 0.0 |
| 30-39 | 13.0 | 13.0 | 1.0 |
| 40-49 | 8.0 | 8.0 | 1.0 |
| 50-59 | 5.0 | 5.0 | 1.0 |
| 60-69 | 5.0 | 3.0 | 1.0 |
| 70-79 | 4.0 | 4.0 | 2.0 |
| 80+ | 7.0 | 6.0 | 2.0 |
| Total | 6.0 | 5.5 | 2.0 |
Table 41 shows historical (2019 and 2020),the resulting initial adjusted (2021 2022), intermediate (2023-2038) and ultimate (2039+) assumed annual mortality improvement rates for Canada. The mortality improvement rates shown for 2023 2038 represents the average rates over this period.
| Age | Males | Females | ||||||||||
|---|---|---|---|---|---|---|---|---|---|---|---|---|
| 2019 | 2020 | 2021 | 2022 | 2023-2038Table 41 Footnote 1 | 2039+ | 2019 | 2020 | 2021 | 2022 | 2023-2038Table 41 Footnote 1 | 2039+ | |
| 0 | 1.2 | 4.3 | (3.1) | 2.1 | 1.0 | 0.8 | 1.2 | (2.6) | 3.9 | 2.2 | 1.0 | 0.8 |
| 1-19 | 2.4 | (1.4) | 4.9 | 3.3 | 1.5 | 0.8 | 0.9 | 7.3 | (7.8) | 1.8 | 0.8 | 0.8 |
| 20-39 | (0.6) | (21.5) | 6.7 | 10.7 | 1.3 | 0.8 | (1.0) | (18.3) | 3.8 | 10.5 | 1.2 | 0.8 |
| 40-64 | 1.3 | (13.4) | 9.1 | 5.7 | 1.1 | 0.8 | 1.4 | (5.8) | 2.7 | 5.8 | 1.1 | 0.8 |
| 65-74 | 1.8 | (3.3) | 3.3 | 3.6 | 1.3 | 0.8 | 1.3 | (2.9) | 2.0 | 3.2 | 1.1 | 0.8 |
| 75-84 | 1.8 | (2.0) | 0.6 | 4.5 | 1.3 | 0.8 | 1.1 | (2.9) | 0.3 | 3.9 | 1.1 | 0.8 |
| 85-89 | 1.9 | (2.9) | 0.9 | 5.5 | 1.4 | 0.8 | 1.6 | (3.5) | 0.7 | 5.2 | 1.2 | 0.8 |
| 90-94 | 1.4 | (4.3) | 1.3 | 5.2 | 1.1 | 0.5 | 1.3 | (4.0) | 0.7 | 5.0 | 1.0 | 0.5 |
| 95+ | 0.6 | (1.6) | (2.8) | 4.1 | 0.5 | 0.2 | 0.6 | (2.8) | (1.4) | 4.2 | 0.5 | 0.2 |
|
Table 41 Footnotes
|
||||||||||||
The resulting projected mortality rates in Table 42 indicate a continuous decrease in mortality rates over the long term. For example, the mortality rate at age 65 for males is expected to decrease from about 10 deaths per thousand people in 2022 to 6 deaths per thousand people by 2075. The gap in mortality rates between males and females at most ages is also expected to decrease over the projection period.
| Age | Males | Females | ||||||
|---|---|---|---|---|---|---|---|---|
| 2022 | 2025 | 2050 | 2075 | 2022 | 2025 | 2050 | 2075 | |
| 0 | 4.71 | 4.56 | 3.67 | 3.00 | 3.74 | 3.61 | 2.90 | 2.37 |
| 10 | 0.07 | 0.07 | 0.05 | 0.04 | 0.07 | 0.07 | 0.06 | 0.05 |
| 20 | 0.60 | 0.56 | 0.43 | 0.35 | 0.29 | 0.28 | 0.22 | 0.18 |
| 30 | 1.05 | 1.03 | 0.77 | 0.63 | 0.49 | 0.49 | 0.37 | 0.30 |
| 40 | 1.40 | 1.36 | 1.12 | 0.92 | 0.79 | 0.76 | 0.62 | 0.51 |
| 50 | 2.77 | 2.63 | 2.09 | 1.71 | 1.76 | 1.68 | 1.34 | 1.10 |
| 60 | 6.54 | 6.15 | 4.80 | 3.93 | 4.15 | 3.92 | 3.09 | 2.53 |
| 65 | 10.43 | 9.84 | 7.75 | 6.34 | 6.68 | 6.36 | 5.06 | 4.14 |
| 70 | 16.96 | 15.81 | 12.40 | 10.14 | 11.12 | 10.49 | 8.38 | 6.86 |
| 75 | 27.85 | 26.03 | 20.49 | 16.76 | 18.86 | 17.89 | 14.43 | 11.80 |
| 80 | 46.45 | 43.46 | 34.27 | 28.04 | 32.71 | 31.07 | 25.11 | 20.55 |
| 85 | 77.88 | 72.27 | 56.24 | 46.01 | 57.47 | 54.06 | 43.01 | 35.19 |
| 90 | 135.60 | 127.09 | 104.10 | 89.11 | 104.95 | 98.79 | 81.50 | 69.76 |
| 100 | 336.40 | 323.16 | 295.32 | 275.48 | 292.54 | 280.40 | 255.29 | 238.14 |
Chart 4 and Chart 5 show the historical and projected life expectancies at birth and age 65, respectively since the Plan’s inception in 1966, based on each given year’s mortality rates (i.e. without future mortality improvements). Table 43 shows the projected Canadian life expectancies at various ages for the specified calendar years, also based on each given year’s mortality rates (without future improvements). Table 44 is similar to Table 43, the only difference being that it takes into account the assumed mortality improvements after the specified calendar years (with future improvements).
Given the continuing trend in increased longevity, Table 44 is considered to be more realistic than Table 43, especially for the older ages. At the same time, the extended length of the projection period increases the uncertainty of the results presented in Table 44 for younger ages.
From 2022 to 2075, Canadian life expectancy at age 65 (with assumed future mortality improvements) is projected to grow from 21.3 to 24.5 years for males and from 23.8 to 26.7 years for females, as shown in Table 44.
Chart 4 Life Expectancies at Birth for Canada, without mortality improvements after the year shownChart 4 Footnote 1
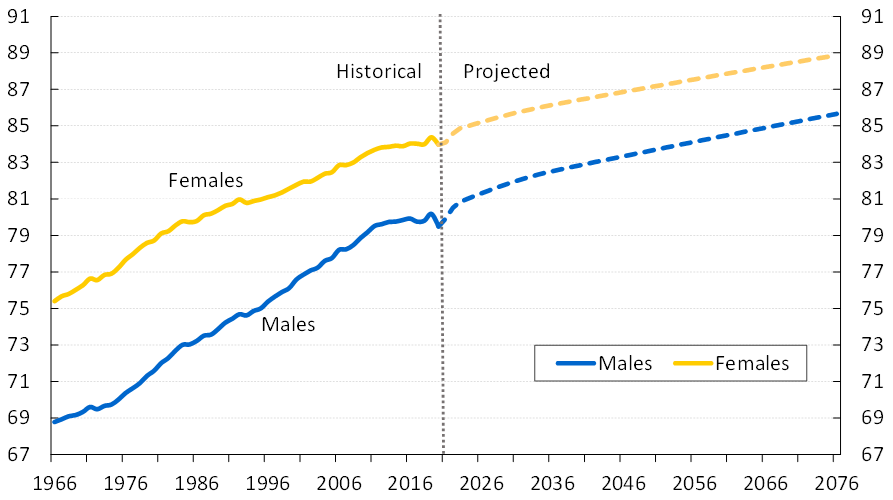
Chart 4 Footnotes
- Chart 4 Footnote 1
-
These are calendar year life expectancies based on the mortality rates of the given attained year.
Text description: Chart 4 Life Expectancies at Birth for Canada, without mortality improvements after the year shown
Line chart showing the historical and projected life expectancies at birth for Canada, without improvements after the year shown. Y axis represents the life expectancy in number of years. X axis represents the year.
Life expectancy at birth for males is 68.8 years in 1966, increases to 79.5 in 2020, and is projected to increase to 85.7 years in 2076.
Life expectancy at birth for females is 75.4 years in 1966, increases to 84.0 in 2020, and is projected to increase to 88.9 years in 2076.
| Year | Males-historical | Females-historical |
|---|---|---|
| 1966 | 68.8 | 75.4 |
| 1967 | 68.9 | 75.7 |
| 1968 | 69.1 | 75.8 |
| 1969 | 69.2 | 76.0 |
| 1970 | 69.3 | 76.3 |
| 1971 | 69.6 | 76.6 |
| 1972 | 69.5 | 76.6 |
| 1973 | 69.7 | 76.8 |
| 1974 | 69.7 | 76.9 |
| 1975 | 70.0 | 77.2 |
| 1976 | 70.4 | 77.7 |
| 1977 | 70.6 | 78.0 |
| 1978 | 70.9 | 78.3 |
| 1979 | 71.3 | 78.6 |
| 1980 | 71.6 | 78.7 |
| 1981 | 72.0 | 79.1 |
| 1982 | 72.3 | 79.2 |
| 1983 | 72.7 | 79.5 |
| 1984 | 73.0 | 79.8 |
| 1985 | 73.0 | 79.7 |
| 1986 | 73.2 | 79.8 |
| 1987 | 73.5 | 80.1 |
| 1988 | 73.6 | 80.2 |
| 1989 | 73.9 | 80.4 |
| 1990 | 74.2 | 80.6 |
| 1991 | 74.4 | 80.7 |
| 1992 | 74.7 | 81.0 |
| 1993 | 74.6 | 80.8 |
| 1994 | 74.9 | 80.9 |
| 1995 | 75.0 | 81.0 |
| 1996 | 75.4 | 81.1 |
| 1997 | 75.7 | 81.2 |
| 1998 | 75.9 | 81.4 |
| 1999 | 76.1 | 81.6 |
| 2000 | 76.6 | 81.8 |
| 2001 | 76.9 | 81.9 |
| 2002 | 77.1 | 82.0 |
| 2003 | 77.2 | 82.2 |
| 2004 | 77.6 | 82.4 |
| 2005 | 77.8 | 82.5 |
| 2006 | 78.2 | 82.8 |
| 2007 | 78.2 | 82.8 |
| 2008 | 78.5 | 83.0 |
| 2009 | 78.9 | 83.3 |
| 2010 | 79.2 | 83.5 |
| 2011 | 79.5 | 83.7 |
| 2012 | 79.6 | 83.8 |
| 2013 | 79.7 | 83.9 |
| 2014 | 79.8 | 83.9 |
| 2015 | 79.8 | 83.9 |
| 2016 | 79.9 | 84.0 |
| 2017 | 79.8 | 84.0 |
| 2018 | 79.8 | 84.0 |
| 2019 | 80.2 | 84.4 |
| 2020 | 79.5 | 84.0 |
| Year | Males-projected | Females-projected |
|---|---|---|
| 2020 | 79.5 | 84.0 |
| 2021 | 79.9 | 84.1 |
| 2022 | 80.5 | 84.6 |
| 2023 | 80.8 | 84.9 |
| 2024 | 81.0 | 85.0 |
| 2025 | 81.2 | 85.1 |
| 2026 | 81.3 | 85.2 |
| 2027 | 81.5 | 85.3 |
| 2028 | 81.6 | 85.4 |
| 2029 | 81.7 | 85.5 |
| 2030 | 81.9 | 85.6 |
| 2031 | 82.0 | 85.7 |
| 2032 | 82.1 | 85.8 |
| 2033 | 82.2 | 85.9 |
| 2034 | 82.3 | 86.0 |
| 2035 | 82.4 | 86.1 |
| 2036 | 82.5 | 86.2 |
| 2037 | 82.6 | 86.2 |
| 2038 | 82.7 | 86.3 |
| 2039 | 82.8 | 86.4 |
| 2040 | 82.9 | 86.4 |
| 2041 | 82.9 | 86.5 |
| 2042 | 83.0 | 86.6 |
| 2043 | 83.1 | 86.7 |
| 2044 | 83.2 | 86.7 |
| 2045 | 83.3 | 86.8 |
| 2046 | 83.3 | 86.9 |
| 2047 | 83.4 | 86.9 |
| 2048 | 83.5 | 87.0 |
| 2049 | 83.6 | 87.1 |
| 2050 | 83.7 | 87.1 |
| 2051 | 83.7 | 87.2 |
| 2052 | 83.8 | 87.3 |
| 2053 | 83.9 | 87.3 |
| 2054 | 84.0 | 87.4 |
| 2055 | 84.1 | 87.5 |
| 2056 | 84.1 | 87.6 |
| 2057 | 84.2 | 87.6 |
| 2058 | 84.3 | 87.7 |
| 2059 | 84.4 | 87.8 |
| 2060 | 84.4 | 87.8 |
| 2061 | 84.5 | 87.9 |
| 2062 | 84.6 | 88.0 |
| 2063 | 84.7 | 88.0 |
| 2064 | 84.8 | 88.1 |
| 2065 | 84.8 | 88.2 |
| 2066 | 84.9 | 88.2 |
| 2067 | 85.0 | 88.3 |
| 2068 | 85.1 | 88.4 |
| 2069 | 85.1 | 88.4 |
| 2070 | 85.2 | 88.5 |
| 2071 | 85.3 | 88.5 |
| 2072 | 85.4 | 88.6 |
| 2073 | 85.4 | 88.7 |
| 2074 | 85.5 | 88.7 |
| 2075 | 85.6 | 88.8 |
| 2076 | 85.7 | 88.9 |
| 2077 | 85.7 | 88.9 |
| 2078 | 85.8 | 89.0 |
| 2079 | 85.9 | 89.1 |
Chart 5 Life Expectancies at Age 65 for Canada, without mortality improvements after the year shownChart 5 Footnote 1
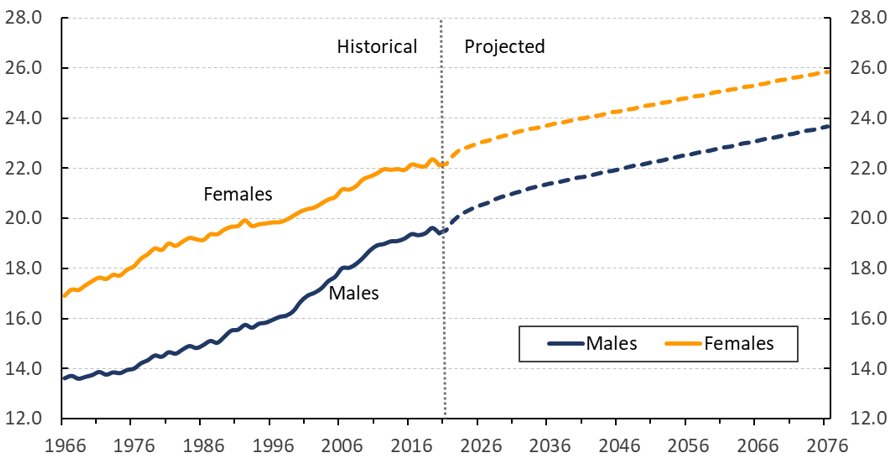
Chart 5 Footnotes
- Chart 5 Footnote 1
-
These are calendar year life expectancies based on the mortality rates of the given attained year.
Text description: Chart 5 Life Expectancies at Age 65 for Canada, without mortality improvements after the year shown
Line chart showing the historical and projected life expectancies at age 65 for Canada, without improvements after the year shown. Y axis represents the life expectancy in number of years. X axis represents the year.
Life expectancy at age 65 for males is 13.6 years in 1966, increases to 19.4 in 2020, and is projected to increase to 23.7 years in 2076.
Life expectancy at age 65 for females is 16.9 years in 1966, increases to 22.1 in 2020, and is projected to increase to 25.9 years in 2076.
| Year | Males | Females |
|---|---|---|
| 1966 | 13.6 | 16.9 |
| 1967 | 13.7 | 17.2 |
| 1968 | 13.6 | 17.1 |
| 1969 | 13.7 | 17.3 |
| 1970 | 13.8 | 17.5 |
| 1971 | 13.9 | 17.6 |
| 1972 | 13.8 | 17.6 |
| 1973 | 13.9 | 17.7 |
| 1974 | 13.8 | 17.7 |
| 1975 | 14.0 | 17.9 |
| 1976 | 14.0 | 18.1 |
| 1977 | 14.2 | 18.4 |
| 1978 | 14.4 | 18.6 |
| 1979 | 14.5 | 18.8 |
| 1980 | 14.5 | 18.7 |
| 1981 | 14.7 | 19.0 |
| 1982 | 14.6 | 18.9 |
| 1983 | 14.8 | 19.1 |
| 1984 | 14.9 | 19.2 |
| 1985 | 14.8 | 19.2 |
| 1986 | 15.0 | 19.1 |
| 1987 | 15.1 | 19.4 |
| 1988 | 15.0 | 19.4 |
| 1989 | 15.3 | 19.5 |
| 1990 | 15.5 | 19.7 |
| 1991 | 15.6 | 19.7 |
| 1992 | 15.8 | 19.9 |
| 1993 | 15.6 | 19.7 |
| 1994 | 15.8 | 19.8 |
| 1995 | 15.9 | 19.8 |
| 1996 | 16.0 | 19.8 |
| 1997 | 16.1 | 19.9 |
| 1998 | 16.1 | 20.0 |
| 1999 | 16.3 | 20.1 |
| 2000 | 16.7 | 20.3 |
| 2001 | 16.9 | 20.4 |
| 2002 | 17.0 | 20.4 |
| 2003 | 17.2 | 20.6 |
| 2004 | 17.5 | 20.8 |
| 2005 | 17.7 | 20.9 |
| 2006 | 18.0 | 21.2 |
| 2007 | 18.0 | 21.1 |
| 2008 | 18.2 | 21.3 |
| 2009 | 18.4 | 21.6 |
| 2010 | 18.7 | 21.7 |
| 2011 | 18.9 | 21.8 |
| 2012 | 19.0 | 22.0 |
| 2013 | 19.1 | 21.9 |
| 2014 | 19.1 | 22.0 |
| 2015 | 19.2 | 21.9 |
| 2016 | 19.4 | 22.2 |
| 2017 | 19.3 | 22.1 |
| 2018 | 19.4 | 22.1 |
| 2019 | 19.6 | 22.4 |
| 2020 | 19.4 | 22.1 |
| Year | Males | Females |
|---|---|---|
| 2020 | 19.4 | 22.1 |
| 2021 | 19.5 | 22.2 |
| 2022 | 19.9 | 22.5 |
| 2023 | 20.2 | 22.8 |
| 2024 | 20.3 | 22.8 |
| 2025 | 20.4 | 22.9 |
| 2026 | 20.5 | 23.0 |
| 2027 | 20.6 | 23.1 |
| 2028 | 20.7 | 23.2 |
| 2029 | 20.8 | 23.3 |
| 2030 | 20.9 | 23.3 |
| 2031 | 21.0 | 23.4 |
| 2032 | 21.1 | 23.5 |
| 2033 | 21.2 | 23.6 |
| 2034 | 21.2 | 23.6 |
| 2035 | 21.3 | 23.7 |
| 2036 | 21.4 | 23.7 |
| 2037 | 21.4 | 23.8 |
| 2038 | 21.5 | 23.8 |
| 2039 | 21.6 | 23.9 |
| 2040 | 21.6 | 24.0 |
| 2041 | 21.7 | 24.0 |
| 2042 | 21.7 | 24.1 |
| 2043 | 21.8 | 24.1 |
| 2044 | 21.8 | 24.2 |
| 2045 | 21.9 | 24.2 |
| 2046 | 22.0 | 24.3 |
| 2047 | 22.0 | 24.3 |
| 2048 | 22.1 | 24.4 |
| 2049 | 22.1 | 24.4 |
| 2050 | 22.2 | 24.5 |
| 2051 | 22.3 | 24.5 |
| 2052 | 22.3 | 24.6 |
| 2053 | 22.4 | 24.7 |
| 2054 | 22.4 | 24.7 |
| 2055 | 22.5 | 24.8 |
| 2056 | 22.5 | 24.8 |
| 2057 | 22.6 | 24.9 |
| 2058 | 22.6 | 24.9 |
| 2059 | 22.7 | 25.0 |
| 2060 | 22.8 | 25.0 |
| 2061 | 22.8 | 25.1 |
| 2062 | 22.9 | 25.1 |
| 2063 | 22.9 | 25.2 |
| 2064 | 23.0 | 25.2 |
| 2065 | 23.0 | 25.3 |
| 2066 | 23.1 | 25.3 |
| 2067 | 23.2 | 25.4 |
| 2068 | 23.2 | 25.4 |
| 2069 | 23.3 | 25.5 |
| 2070 | 23.3 | 25.5 |
| 2071 | 23.4 | 25.6 |
| 2072 | 23.4 | 25.6 |
| 2073 | 23.5 | 25.7 |
| 2074 | 23.5 | 25.8 |
| 2075 | 23.6 | 25.8 |
| 2076 | 23.7 | 25.9 |
| 2077 | 23.7 | 25.9 |
| 2078 | 23.8 | 26.0 |
| 2079 | 23.8 | 26.0 |
| Age | Males | Females | ||||||
|---|---|---|---|---|---|---|---|---|
| 2022 | 2025 | 2050 | 2075 | 2022 | 2025 | 2050 | 2075 | |
| 0 | 80.5 | 81.2 | 83.7 | 85.6 | 84.6 | 85.1 | 87.1 | 88.8 |
| 10 | 71.0 | 71.6 | 74.0 | 75.9 | 75.0 | 75.5 | 77.5 | 79.1 |
| 20 | 61.1 | 61.7 | 64.1 | 66.0 | 65.1 | 65.6 | 67.5 | 69.1 |
| 30 | 51.6 | 52.2 | 54.5 | 56.3 | 55.3 | 55.8 | 57.7 | 59.3 |
| 40 | 42.2 | 42.8 | 44.9 | 46.7 | 45.6 | 46.1 | 47.9 | 49.5 |
| 50 | 32.9 | 33.5 | 35.5 | 37.2 | 36.1 | 36.6 | 38.3 | 39.8 |
| 60 | 24.0 | 24.6 | 26.5 | 28.0 | 26.9 | 27.3 | 29.0 | 30.4 |
| 65 | 19.9 | 20.4 | 22.2 | 23.6 | 22.5 | 22.9 | 24.5 | 25.8 |
| 70 | 16.0 | 16.5 | 18.1 | 19.4 | 18.3 | 18.7 | 20.2 | 21.4 |
| 75 | 12.5 | 12.9 | 14.4 | 15.5 | 14.5 | 14.8 | 16.1 | 17.2 |
| 80 | 9.4 | 9.8 | 11.0 | 11.9 | 11.0 | 11.3 | 12.4 | 13.4 |
| 85 | 6.8 | 7.1 | 8.0 | 8.7 | 8.0 | 8.2 | 9.1 | 9.9 |
| 90 | 4.6 | 4.9 | 5.5 | 5.9 | 5.5 | 5.7 | 6.3 | 6.8 |
| 100 | 2.2 | 2.3 | 2.5 | 2.6 | 2.5 | 2.6 | 2.8 | 3.0 |
|
Table 43 Footnotes
|
||||||||
| Age | Males | Females | ||||||
|---|---|---|---|---|---|---|---|---|
| 2022 | 2025 | 2050 | 2075 | 2022 | 2025 | 2050 | 2075 | |
| 0 | 86.7 | 86.9 | 88.7 | 90.4 | 90.0 | 90.2 | 91.7 | 93.1 |
| 10 | 76.4 | 76.6 | 78.4 | 80.1 | 79.8 | 80.0 | 81.5 | 82.9 |
| 20 | 65.8 | 66.0 | 67.9 | 69.5 | 69.2 | 69.4 | 71.0 | 72.4 |
| 30 | 55.5 | 55.7 | 57.5 | 59.2 | 58.8 | 59.0 | 60.6 | 62.0 |
| 40 | 45.3 | 45.5 | 47.3 | 49.0 | 48.5 | 48.7 | 50.2 | 51.7 |
| 50 | 35.3 | 35.6 | 37.3 | 38.9 | 38.3 | 38.5 | 40.0 | 41.4 |
| 60 | 25.8 | 26.0 | 27.6 | 29.1 | 28.5 | 28.7 | 30.1 | 31.5 |
| 65 | 21.3 | 21.5 | 23.1 | 24.5 | 23.8 | 24.0 | 25.4 | 26.7 |
| 70 | 17.2 | 17.4 | 18.8 | 20.1 | 19.4 | 19.6 | 20.8 | 22.1 |
| 75 | 13.4 | 13.6 | 14.8 | 16.0 | 15.3 | 15.4 | 16.6 | 17.7 |
| 80 | 10.0 | 10.2 | 11.2 | 12.2 | 11.6 | 11.7 | 12.7 | 13.7 |
| 85 | 7.1 | 7.3 | 8.1 | 8.9 | 8.3 | 8.5 | 9.3 | 10.0 |
| 90 | 4.8 | 5.0 | 5.5 | 6.0 | 5.7 | 5.8 | 6.4 | 6.8 |
| 100 | 2.2 | 2.3 | 2.5 | 2.6 | 2.6 | 2.6 | 2.8 | 3.0 |
|
Table 44 Footnotes
|
||||||||
B.3.4 Net Migration
The net migration rate refers to the net effect relative to the population of the number of immigrants less the number of total (net) emigrants, plus the net increase in the number of non-permanent residents.
Immigration and emigration are generally recognized as being volatile parameters of future population growth since they are subject to a variety of demographic, economic, social, and political factors. During the period from 1972 to 2021, annual immigration to Canada varied between 84,000 and 323,000, annual emigration from Canada fluctuated between 35,000 and 95,000, and the annual number of returning Canadians fluctuated between 8,000 and 55,000. The 2020 and 2021 data are especially volatile compared to historical experience due to the COVID-19 pandemic, and they were thus excluded from our analysis in setting the net migration rate assumption. The net migration rate for year ending June 2021 stands at 0.41% of the population, well below pre-pandemic levels. In the 2020 Annual Report to Parliament, the Government of Canada released details on its Immigration Levels Plan for 2021-2023. The target numbers of new permanent residents are set at 401,000 in 2021, 411,000 in 2023 and 421,000 in 2023.
Over the same period, the annual net increase in the number of non-permanent residents fluctuated between -71,000 and 169,000. In the most recent years, the number of international students and temporary workers with permits under the International Mobility Program have grown substantially. They represent the two largest groups of non-permanent residents, accounting for more than half of non-permanent residents.
The number of temporary workers is assumed to stabilize in future as the aging of the labour force and related labour shortages subside. It is also expected that the number of foreign students will stabilize over the next five years. Therefore, the annual net increase in the number of non-permanent residents is projected to fall gradually to reach zero in 2026 and to remain at that level thereafter.
The actual 2021 net migration rate of 0.41% is assumed to increase to 1.04% of the Canadian population in 2022, 1.05% in 2023, and 0.93% in 2024. From 2025 to 2031, the net migration rate is assumed to decrease gradually to reach an ultimate level of 0.64%, which corresponds to the average rate experienced over the ten-year period 2010-2019, excluding the net increase in non-permanent residents during that period. The assumed short-term net migration rate is higher than the ultimate rate of 0.64% due to the federal government’s short-term targets and the assumed gradual decrease to zero for the net increase in the number of non-permanent residents from 2022 through 2026. Chart 6 shows the net migration experience since 1972 and the projected rates.
Chart 6 Net Migration Rate (Canada)
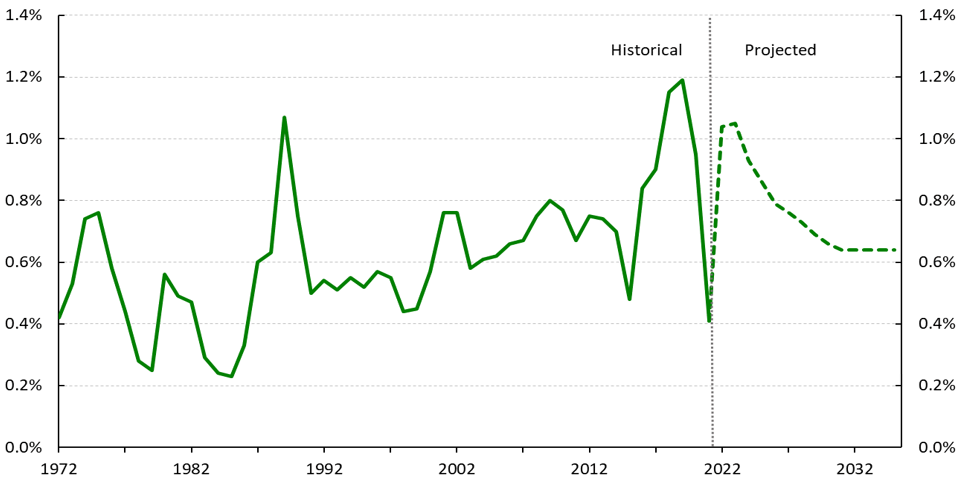
Text description: Chart 6 Net Migration Rate (Canada)
Line chart showing the historical and projected net migration rate for Canada, including non-permanent residents. Y axis represents the net migration rate as a percentage of the population. X axis represents the year.
The net migration rate for Canada is 0.4% in 1972, and then is shown to fluctuate over time but increase overall, reaching its highest point of 1.2% in 2019 after which it falls to 0.4% in 2021. The net migration rate is then projected rebound over the next 2 years to then slowly decrease to the ultimate value of 0.64% in 2031 and to remain at that value thereafter.
| Year | Migration rate, including NPR |
|---|---|
| 1972 | 0.42% |
| 1973 | 0.53% |
| 1974 | 0.74% |
| 1975 | 0.76% |
| 1976 | 0.58% |
| 1977 | 0.44% |
| 1978 | 0.28% |
| 1979 | 0.25% |
| 1980 | 0.56% |
| 1981 | 0.49% |
| 1982 | 0.47% |
| 1983 | 0.29% |
| 1984 | 0.24% |
| 1985 | 0.23% |
| 1986 | 0.33% |
| 1987 | 0.60% |
| 1988 | 0.63% |
| 1989 | 1.07% |
| 1990 | 0.75% |
| 1991 | 0.50% |
| 1992 | 0.54% |
| 1993 | 0.51% |
| 1994 | 0.55% |
| 1995 | 0.52% |
| 1996 | 0.57% |
| 1997 | 0.55% |
| 1998 | 0.44% |
| 1999 | 0.45% |
| 2000 | 0.57% |
| 2001 | 0.76% |
| 2002 | 0.76% |
| 2003 | 0.58% |
| 2004 | 0.61% |
| 2005 | 0.62% |
| 2006 | 0.66% |
| 2007 | 0.67% |
| 2008 | 0.75% |
| 2009 | 0.80% |
| 2010 | 0.77% |
| 2011 | 0.67% |
| 2012 | 0.75% |
| 2013 | 0.74% |
| 2014 | 0.70% |
| 2015 | 0.48% |
| 2016 | 0.84% |
| 2017 | 0.90% |
| 2018 | 1.15% |
| 2019 | 1.19% |
| 2020 | 0.95% |
| 2021 | 0.41% |
| Year | Migration rate, including NPR (Projected) |
|---|---|
| 2022 | 1.04% |
| 2023 | 1.05% |
| 2024 | 0.93% |
| 2025 | 0.86% |
| 2026 | 0.79% |
| 2027 | 0.76% |
| 2028 | 0.73% |
| 2029 | 0.69% |
| 2030 | 0.66% |
| 2031 | 0.64% |
| 2032 | 0.64% |
| 2033 | 0.64% |
| 2034 | 0.64% |
| 2035 | 0.64% |
To project Québec’s population, the same migration components of immigration, total emigration and net increase in non-permanent residents are considered. An additional component consisting of the net interprovincial migration for Québec is also included. It is assumed that the 2021 net migration rate of 0.16% for Québec will increase gradually to reach an ultimate level of 0.43% in 2031, assuming a decline in the net increase of non-permanent residents to zero by 2026. The ultimate net migration rate for Québec of 0.43% corresponds to the average experience over the last 10 years ending in 2019, excluding the net increase in non-permanent residents.
For both Canada and Québec, the distributions of immigrants, total emigrants, and non-permanent residents by age and sex used for the demographic projections were derived from Statistics Canada data averaged over the period 2010 to 2019.
B.3.5 Projected Population and its Characteristics
The historical and projected evolution of the Canada less Québec population age distribution since the inception of the Plan is shown in Chart 7. One can easily observe that the triangular shape of the 1960s has become more rectangular over time. This is projected to continue and indicates an aging population. The chart also reveals that the number of people aged 85 and over is expected to increase dramatically over the coming decades.
Chart 7 Age Distribution of the Population of Canada less Québec (thousands)
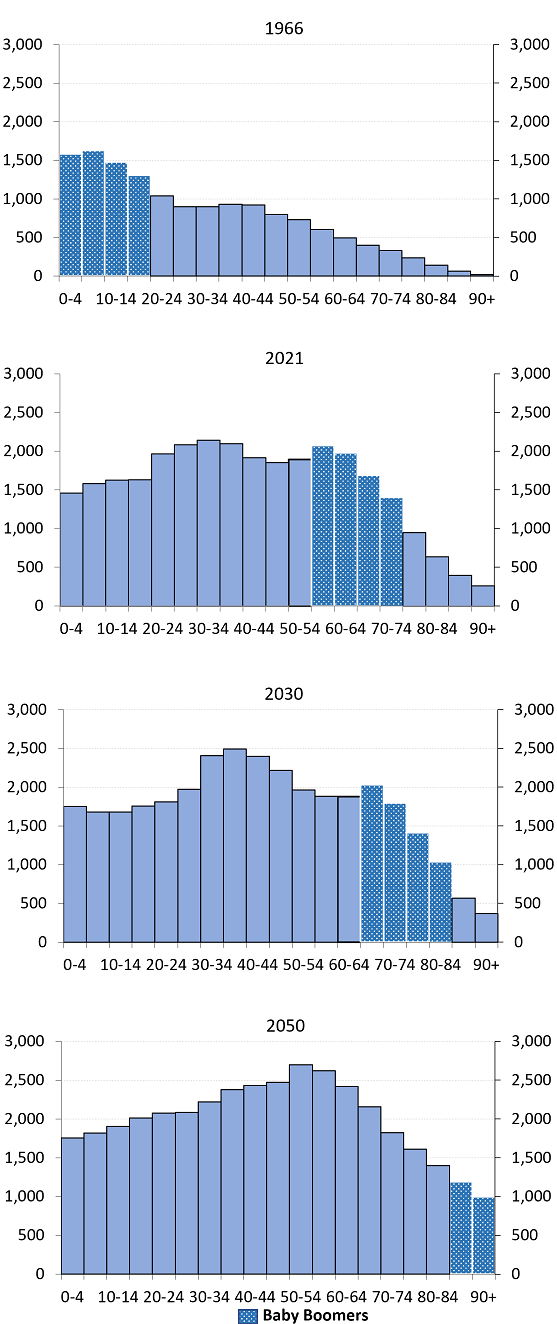
Text description: Chart 7 Age Distribution of the Population of Canada less Québec (thousands)
Succession of four bar charts showing the evolution of the age distribution of the population of Canada less Québec. Y axis represents the number of individuals in thousands. X axis represents the quinquennial age groups.
The first bar chart represents the age distribution of the population in 1966. For age groups below age 20, the baby-boom generation, the population of each group is between 1.3 and 1.6 million, with the age group 5 to 9 years being the largest. For age groups above age 19, the population gradually decreases from about 1 million to almost zero for age group 90 and older.
The second bar chart represents the age distribution of the population in 2021 For age groups 55 to 59 up to 70 to 74, the baby boomers, the population of each group is between 1.4 and 2.1 million, with the age group 55 to 59 being the largest. For ages below 55, the effects of the baby bust and echo generation are seen. The population increases from 1.5 to 2.1 million for groups 0 to 4 up to 30 to 34, remains at 2.1 million for group 35 to 39, and then decreases somewhat before rising again for the baby boomers. For age groups above 74 (older than the baby boomers), the population gradually decreases from 950,000 to about 260,000 for age group 90 and older.
The third bar chart represents the age distribution of the population in 2030. For age groups 65 to 84, the baby boomers, the population decreases from 2.0 to 1.0 million. For age groups below age 65, the effects of the baby bust and echo generation are seen. The population increases from about 1.8 to 2.5 million for groups 0 to 4 up to 35 to 39 and then decreases to 1.9 million before rising again for the baby boomers. For age groups above age 85 (older than the boomers), the population gradually decreases from about 570,000 to 370,000 for age group 90 and older.
Lastly, the fourth bar chart represents the age distribution of the population in 2050. For age groups 85 and over, the baby boomers, the population decreases from 1.2 and 1 million. The population increases from 1.8 to 2.7 million for age groups 0 to 4 up to 50 to 54, and then decreases to 1.4 million for age group 80 to 84.
| Age Group | 1966 | 2021 | 2030 | 2050 |
|---|---|---|---|---|
| 0-4 | 1,585,423 | 1,460,901 | 1,751,000 | 1,754,529 |
| 5-9 | 1,630,472 | 1,581,846 | 1,680,142 | 1,820,283 |
| 10-14 | 1,479,183 | 1,626,556 | 1,677,075 | 1,905,308 |
| 15-19 | 1,306,941 | 1,632,639 | 1,757,610 | 2,013,529 |
| 20-24 | 1,042,168 | 1,966,573 | 1,809,073 | 2,077,312 |
| 25-29 | 899,017 | 2,084,777 | 1,971,369 | 2,086,590 |
| 30-34 | 897,837 | 2,140,658 | 2,404,358 | 2,221,097 |
| 35-39 | 929,325 | 2,096,750 | 2,490,511 | 2,376,705 |
| 40-44 | 920,538 | 1,917,880 | 2,396,254 | 2,430,956 |
| 45-49 | 801,523 | 1,851,481 | 2,218,024 | 2,473,487 |
| 50-54 | 730,747 | 1,894,690 | 1,962,285 | 2,699,215 |
| 55-59 | 602,941 | 2,076,452 | 1,880,087 | 2,619,894 |
| 60-64 | 494,436 | 1,979,011 | 1,880,276 | 2,416,883 |
| 65-69 | 401,997 | 1,691,356 | 2,029,378 | 2,155,393 |
| 70-74 | 330,969 | 1,400,638 | 1,796,392 | 1,822,676 |
| 75-79 | 238,561 | 949,859 | 1,414,965 | 1,612,426 |
| 80-84 | 143,973 | 634,180 | 1,031,455 | 1,400,358 |
| 85-89 | 63,212 | 395,548 | 567,281 | 1,191,877 |
| 90+ | 21,997 | 259,818 | 369,539 | 999,232 |
The population of Canada as at 1 July 2021 is 38.2 million, while the population of Canada less Québec is 29.6 million. Table 45 and Table 46 present the projected populations of Canada and Canada less Québec as at 1 July for selected age groups and years, while Chart 8 shows the evolution of the population of Canada less Québec, split by ages groups 0 to 19, 20 to 64, and 65 and above, from 1975 to 2100. Table 47 shows the variations in the relative proportions of various age groups for Canada less Québec throughout the projection period.
The proportion of people aged 65 and over for Canada less Québec is expected to be 18.4% of the total population in 2022 and to increase significantly thereafter to 28.4% by 2100. The number of people aged 65 and older as a proportion of the number of people aged 20 to 64 also increases significantly over the same period, from a projected 30.4% in 2022 to 53.7% by 2100. This proportion affects the ratio of benefits to contributions under the CPP.
| Year | 0-17 | 18-69 | 70+ | 0-19 | 20-64 | 65+ | Total |
|---|---|---|---|---|---|---|---|
| 2022 | 7,297 | 26,401 | 5,037 | 8,115 | 23,273 | 7,347 | 38,735 |
| 2023 | 7,391 | 26,616 | 5,240 | 8,226 | 23,400 | 7,621 | 39,247 |
| 2024 | 7,469 | 26,791 | 5,456 | 8,319 | 23,504 | 7,893 | 39,716 |
| 2025 | 7,531 | 26,947 | 5,682 | 8,399 | 23,591 | 8,169 | 40,160 |
| 2026 | 7,578 | 27,093 | 5,908 | 8,467 | 23,667 | 8,445 | 40,579 |
| 2027 | 7,626 | 27,222 | 6,139 | 8,528 | 23,748 | 8,711 | 40,987 |
| 2028 | 7,674 | 27,334 | 6,374 | 8,580 | 23,821 | 8,981 | 41,382 |
| 2029 | 7,728 | 27,428 | 6,606 | 8,631 | 23,892 | 9,239 | 41,762 |
| 2030 | 7,775 | 27,508 | 6,841 | 8,678 | 23,973 | 9,474 | 42,124 |
| 2035 | 7,976 | 27,870 | 7,913 | 8,886 | 24,608 | 10,264 | 43,758 |
| 2040 | 8,204 | 28,505 | 8,465 | 9,100 | 25,289 | 10,784 | 45,173 |
| 2045 | 8,263 | 29,383 | 8,766 | 9,246 | 25,947 | 11,219 | 46,412 |
| 2050 | 8,268 | 30,240 | 9,035 | 9,271 | 26,516 | 11,755 | 47,543 |
| 2055 | 8,343 | 30,837 | 9,460 | 9,335 | 26,911 | 12,394 | 48,640 |
| 2060 | 8,505 | 31,243 | 10,043 | 9,498 | 27,088 | 13,204 | 49,790 |
| 2065 | 8,713 | 31,486 | 10,818 | 9,720 | 27,279 | 14,018 | 51,017 |
| 2070 | 8,923 | 31,773 | 11,566 | 9,947 | 27,781 | 14,534 | 52,262 |
| 2080 | 9,227 | 33,063 | 12,295 | 10,314 | 28,877 | 15,395 | 54,586 |
| 2090 | 9,509 | 34,487 | 12,777 | 10,626 | 30,146 | 16,000 | 56,773 |
| 2100 | 9,917 | 35,754 | 13,541 | 11,068 | 31,153 | 16,991 | 59,212 |
| Year | 0-17 | 18-69 | 70+ | 0-19 | 20-64 | 65+ | Total |
|---|---|---|---|---|---|---|---|
| 2022 | 5,684 | 20,605 | 3,785 | 6,335 | 18,203 | 5,536 | 30,074 |
| 2023 | 5,763 | 20,814 | 3,942 | 6,429 | 18,344 | 5,746 | 30,519 |
| 2024 | 5,835 | 20,994 | 4,108 | 6,510 | 18,471 | 5,957 | 30,937 |
| 2025 | 5,895 | 21,156 | 4,283 | 6,581 | 18,579 | 6,173 | 31,333 |
| 2026 | 5,944 | 21,307 | 4,458 | 6,644 | 18,674 | 6,390 | 31,708 |
| 2027 | 5,996 | 21,442 | 4,636 | 6,705 | 18,768 | 6,600 | 32,073 |
| 2028 | 6,049 | 21,560 | 4,817 | 6,759 | 18,851 | 6,815 | 32,426 |
| 2029 | 6,107 | 21,662 | 4,996 | 6,814 | 18,929 | 7,022 | 32,764 |
| 2030 | 6,159 | 21,748 | 5,180 | 6,866 | 19,012 | 7,209 | 33,087 |
| 2035 | 6,387 | 22,135 | 6,036 | 7,105 | 19,580 | 7,873 | 34,557 |
| 2040 | 6,619 | 22,722 | 6,513 | 7,328 | 20,191 | 8,335 | 35,854 |
| 2045 | 6,679 | 23,529 | 6,800 | 7,474 | 20,836 | 8,699 | 37,008 |
| 2050 | 6,676 | 24,375 | 7,027 | 7,494 | 21,402 | 9,182 | 38,078 |
| 2055 | 6,741 | 24,974 | 7,413 | 7,548 | 21,797 | 9,783 | 39,128 |
| 2060 | 6,901 | 25,373 | 7,956 | 7,706 | 22,020 | 10,504 | 40,229 |
| 2065 | 7,116 | 25,647 | 8,635 | 7,932 | 22,211 | 11,255 | 41,398 |
| 2070 | 7,332 | 25,930 | 9,320 | 8,167 | 22,665 | 11,750 | 42,581 |
| 2080 | 7,632 | 27,165 | 10,001 | 8,531 | 23,763 | 12,505 | 44,799 |
| 2090 | 7,900 | 28,591 | 10,403 | 8,829 | 25,021 | 13,045 | 46,894 |
| 2100 | 8,307 | 29,828 | 11,094 | 9,267 | 25,996 | 13,966 | 49,228 |
Chart 8 Population of Canada less Québec (millions)
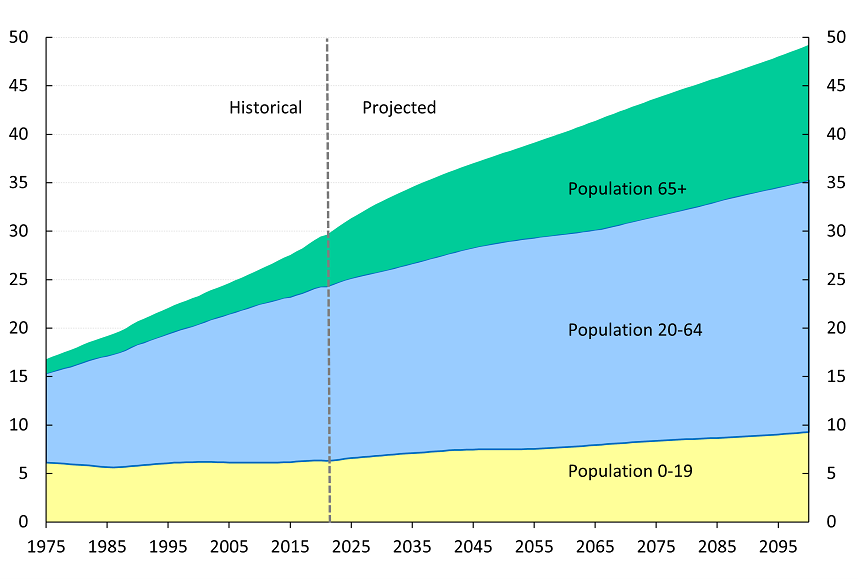
Text description: Chart 8 Population of Canada less Québec (millions)
Stacked area chart showing the historical and projected population of Canada less Québec by age group. Y axis represents the number of individuals in millions. X axis represents the year.
The population aged 0 to 19 years is 6.1 million in 1975, reaches 6.3 in 2021, and is projected to increase to 9.3 million in 2100. The population aged 0 to 19 represents 36% of the total population in 1975, 21% in 2021, and 19% in 2100.
The population aged 20 to 64 is 9.2 million in 1975, reaches 18.0 in 2021, and is projected to increase to 26.0 million in 2100. The population aged 20 to 64 represents 55% of the total population in 1975, 61% in 2021, and 53% in 2100.
The population aged 65 and over is 1.5 million in 1975, reaches 5.3 in 2021, and is projected to increase to 14.0 million in 2100. The population aged 65 and over represents 9% of the total population in 1975, 18% in 2021, and 28% in 2100.
| Year | Population 0-19 | Population 20-64 | Population 65+ |
|---|---|---|---|
| 1975 | 6,124,266 | 9,202,837 | 1,485,869 |
| 1976 | 6,093,541 | 9,425,810 | 1,533,696 |
| 1977 | 6,060,162 | 9,648,081 | 1,584,467 |
| 1978 | 6,016,339 | 9,870,769 | 1,635,636 |
| 1979 | 5,958,819 | 10,083,892 | 1,692,837 |
| 1980 | 5,915,814 | 10,342,644 | 1,751,212 |
| 1981 | 5,863,694 | 10,605,114 | 1,803,900 |
| 1982 | 5,820,851 | 10,863,114 | 1,852,346 |
| 1983 | 5,762,628 | 11,105,213 | 1,895,634 |
| 1984 | 5,701,591 | 11,329,606 | 1,944,636 |
| 1985 | 5,651,029 | 11,514,283 | 2,011,002 |
| 1986 | 5,628,904 | 11,684,398 | 2,078,806 |
| 1987 | 5,648,705 | 11,860,023 | 2,155,889 |
| 1988 | 5,689,656 | 12,042,425 | 2,222,589 |
| 1989 | 5,756,951 | 12,298,390 | 2,296,312 |
| 1990 | 5,819,878 | 12,507,303 | 2,366,971 |
| 1991 | 5,858,033 | 12,680,641 | 2,431,350 |
| 1992 | 5,921,059 | 12,848,876 | 2,491,319 |
| 1993 | 5,968,591 | 13,011,820 | 2,547,816 |
| 1994 | 6,023,769 | 13,184,442 | 2,600,049 |
| 1995 | 6,068,615 | 13,359,719 | 2,654,758 |
| 1996 | 6,115,933 | 13,537,128 | 2,710,260 |
| 1997 | 6,142,329 | 13,724,795 | 2,764,213 |
| 1998 | 6,164,880 | 13,879,517 | 2,814,841 |
| 1999 | 6,170,750 | 14,047,934 | 2,859,352 |
| 2000 | 6,182,011 | 14,240,897 | 2,905,871 |
| 2001 | 6,193,812 | 14,473,036 | 2,957,598 |
| 2002 | 6,194,019 | 14,713,503 | 3,010,901 |
| 2003 | 6,171,356 | 14,921,171 | 3,065,748 |
| 2004 | 6,153,715 | 15,127,988 | 3,123,362 |
| 2005 | 6,140,107 | 15,341,194 | 3,180,976 |
| 2006 | 6,131,083 | 15,551,164 | 3,256,961 |
| 2007 | 6,121,301 | 15,747,606 | 3,327,202 |
| 2008 | 6,129,640 | 15,945,821 | 3,409,932 |
| 2009 | 6,134,464 | 16,151,770 | 3,499,278 |
| 2010 | 6,134,228 | 16,349,977 | 3,591,462 |
| 2011 | 6,136,342 | 16,498,886 | 3,699,010 |
| 2012 | 6,136,159 | 16,663,562 | 3,853,400 |
| 2013 | 6,139,737 | 16,823,666 | 4,008,671 |
| 2014 | 6,154,256 | 16,979,733 | 4,153,263 |
| 2015 | 6,171,685 | 17,063,243 | 4,292,708 |
| 2016 | 6,228,207 | 17,211,302 | 4,444,028 |
| 2017 | 6,271,892 | 17,364,198 | 4,607,083 |
| 2018 | 6,322,163 | 17,565,067 | 4,776,116 |
| 2019 | 6,352,622 | 17,781,369 | 4,963,756 |
| 2020 | 6,361,714 | 17,943,375 | 5,153,815 |
| 2021 | 6,301,942 | 18,008,272 | 5,331,399 |
| 2022 | 6,335,216 | 18,203,135 | 5,535,712 |
| 2023 | 6,429,083 | 18,343,831 | 5,746,437 |
| 2024 | 6,509,560 | 18,470,545 | 5,956,673 |
| 2025 | 6,581,158 | 18,579,372 | 6,172,767 |
| 2026 | 6,644,372 | 18,674,353 | 6,389,590 |
| 2027 | 6,704,632 | 18,768,100 | 6,600,176 |
| 2028 | 6,758,944 | 18,851,358 | 6,815,335 |
| 2029 | 6,813,679 | 18,928,902 | 7,021,854 |
| 2030 | 6,865,828 | 19,012,236 | 7,209,008 |
| 2031 | 6,919,240 | 19,107,197 | 7,366,854 |
| 2032 | 6,968,806 | 19,225,218 | 7,500,171 |
| 2033 | 7,016,366 | 19,346,113 | 7,626,399 |
| 2034 | 7,062,044 | 19,464,203 | 7,750,592 |
| 2035 | 7,104,985 | 19,579,650 | 7,872,849 |
| 2036 | 7,145,274 | 19,694,972 | 7,990,169 |
| 2037 | 7,186,212 | 19,820,958 | 8,088,920 |
| 2038 | 7,229,694 | 19,949,635 | 8,175,897 |
| 2039 | 7,277,188 | 20,075,009 | 8,255,836 |
| 2040 | 7,328,182 | 20,191,377 | 8,334,899 |
| 2041 | 7,385,052 | 20,299,730 | 8,409,921 |
| 2042 | 7,417,675 | 20,431,959 | 8,479,920 |
| 2043 | 7,441,263 | 20,571,196 | 8,547,388 |
| 2044 | 7,459,994 | 20,706,728 | 8,619,257 |
| 2045 | 7,473,885 | 20,835,771 | 8,698,541 |
| 2046 | 7,483,134 | 20,960,515 | 8,783,195 |
| 2047 | 7,488,578 | 21,081,042 | 8,872,965 |
| 2048 | 7,491,096 | 21,194,268 | 8,970,678 |
| 2049 | 7,492,026 | 21,301,976 | 9,073,616 |
| 2050 | 7,493,649 | 21,402,139 | 9,181,963 |
| 2051 | 7,497,468 | 21,494,487 | 9,294,918 |
| 2052 | 7,504,121 | 21,586,086 | 9,405,490 |
| 2053 | 7,514,323 | 21,671,760 | 9,518,933 |
| 2054 | 7,528,594 | 21,742,490 | 9,644,387 |
| 2055 | 7,547,541 | 21,796,901 | 9,783,272 |
| 2056 | 7,571,596 | 21,848,091 | 9,922,681 |
| 2057 | 7,600,073 | 21,898,511 | 10,061,109 |
| 2058 | 7,632,017 | 21,945,206 | 10,202,580 |
| 2059 | 7,667,268 | 21,986,957 | 10,348,696 |
| 2060 | 7,705,976 | 22,019,561 | 10,503,645 |
| 2061 | 7,748,091 | 22,051,190 | 10,659,357 |
| 2062 | 7,792,592 | 22,089,606 | 10,808,634 |
| 2063 | 7,838,342 | 22,129,797 | 10,956,960 |
| 2064 | 7,884,961 | 22,171,456 | 11,104,565 |
| 2065 | 7,932,271 | 22,211,190 | 11,254,530 |
| 2066 | 7,980,076 | 22,267,173 | 11,388,394 |
| 2067 | 8,027,789 | 22,352,707 | 11,492,849 |
| 2068 | 8,074,893 | 22,456,332 | 11,579,264 |
| 2069 | 8,121,208 | 22,559,534 | 11,665,830 |
| 2070 | 8,166,573 | 22,664,856 | 11,749,707 |
| 2071 | 8,210,905 | 22,771,923 | 11,830,981 |
| 2072 | 8,253,889 | 22,876,353 | 11,914,055 |
| 2073 | 8,295,161 | 22,976,410 | 12,000,798 |
| 2074 | 8,334,545 | 23,079,615 | 12,083,708 |
| 2075 | 8,371,878 | 23,185,335 | 12,163,502 |
| 2076 | 8,407,045 | 23,298,426 | 12,235,462 |
| 2077 | 8,440,283 | 23,411,502 | 12,306,857 |
| 2078 | 8,471,910 | 23,526,488 | 12,375,604 |
| 2079 | 8,502,038 | 23,643,713 | 12,441,467 |
| 2080 | 8,530,793 | 23,762,721 | 12,505,031 |
| 2081 | 8,558,326 | 23,883,723 | 12,566,268 |
| 2082 | 8,585,221 | 24,008,830 | 12,622,876 |
| 2083 | 8,612,153 | 24,138,529 | 12,674,102 |
| 2084 | 8,639,487 | 24,273,751 | 12,719,046 |
| 2085 | 8,667,550 | 24,413,935 | 12,758,356 |
| 2086 | 8,696,619 | 24,561,058 | 12,790,226 |
| 2087 | 8,727,051 | 24,686,021 | 12,843,866 |
| 2088 | 8,759,151 | 24,802,446 | 12,905,795 |
| 2089 | 8,793,057 | 24,914,013 | 12,972,606 |
| 2090 | 8,828,841 | 25,020,756 | 13,044,616 |
| 2091 | 8,866,495 | 25,122,871 | 13,122,060 |
| 2092 | 8,905,964 | 25,220,904 | 13,204,859 |
| 2093 | 8,947,142 | 25,315,517 | 13,292,805 |
| 2094 | 8,989,877 | 25,408,011 | 13,385,018 |
| 2095 | 9,033,982 | 25,500,576 | 13,479,668 |
| 2096 | 9,079,226 | 25,594,720 | 13,575,540 |
| 2097 | 9,125,352 | 25,690,883 | 13,672,414 |
| 2098 | 9,172,122 | 25,789,499 | 13,769,973 |
| 2099 | 9,219,328 | 25,890,946 | 13,867,849 |
| 2100 | 9,266,764 | 25,995,681 | 13,965,534 |
| Year | % of Total PopulationTable 47 Footnote 1 | % of Total PopulationTable 47 Footnote 1 | Age 65 + as % of Age 20-64 | ||||
|---|---|---|---|---|---|---|---|
| 0-17 | 18-69 | 70+ | 0-19 | 20-64 | 65+ | ||
| 2022 | 18.9 | 68.5 | 12.6 | 21.1 | 60.5 | 18.4 | 30.4 |
| 2023 | 18.9 | 68.2 | 12.9 | 21.1 | 60.1 | 18.8 | 31.3 |
| 2024 | 18.9 | 67.9 | 13.3 | 21.0 | 59.7 | 19.3 | 32.2 |
| 2025 | 18.8 | 67.5 | 13.7 | 21.0 | 59.3 | 19.7 | 33.2 |
| 2026 | 18.7 | 67.2 | 14.1 | 21.0 | 58.9 | 20.2 | 34.2 |
| 2027 | 18.7 | 66.9 | 14.5 | 20.9 | 58.5 | 20.6 | 35.2 |
| 2028 | 18.7 | 66.5 | 14.9 | 20.8 | 58.1 | 21.0 | 36.2 |
| 2029 | 18.6 | 66.1 | 15.2 | 20.8 | 57.8 | 21.4 | 37.1 |
| 2030 | 18.6 | 65.7 | 15.7 | 20.8 | 57.5 | 21.8 | 37.9 |
| 2035 | 18.5 | 64.1 | 17.5 | 20.6 | 56.7 | 22.8 | 40.2 |
| 2040 | 18.5 | 63.4 | 18.2 | 20.4 | 56.3 | 23.2 | 41.3 |
| 2045 | 18.0 | 63.6 | 18.4 | 20.2 | 56.3 | 23.5 | 41.7 |
| 2050 | 17.5 | 64.0 | 18.5 | 19.7 | 56.2 | 24.1 | 42.9 |
| 2055 | 17.2 | 63.8 | 18.9 | 19.3 | 55.7 | 25.0 | 44.9 |
| 2060 | 17.2 | 63.1 | 19.8 | 19.2 | 54.7 | 26.1 | 47.7 |
| 2065 | 17.2 | 62.0 | 20.9 | 19.2 | 53.7 | 27.2 | 50.7 |
| 2070 | 17.2 | 60.9 | 21.9 | 19.2 | 53.2 | 27.6 | 51.8 |
| 2080 | 17.0 | 60.6 | 22.3 | 19.0 | 53.0 | 27.9 | 52.6 |
| 2090 | 16.8 | 61.0 | 22.2 | 18.8 | 53.4 | 27.8 | 52.1 |
| 2100 | 16.9 | 60.6 | 22.5 | 18.8 | 52.8 | 28.4 | 53.7 |
|
Table 47 Footnotes
|
|||||||
Table 48 shows the projected components of population growth, which is defined as the projected number of births plus net migrants less the projected number of deaths, for Canada less Québec from 2022 to 2100, and Chart 9 presents these figures graphically. For Canada less Québec, the number of births is projected to exceed deaths until 2039. Thereafter, all population growth is expected to come from migration.
In 2022, the population of Canada less Québec is projected to grow by about 1.5%. The annual growth is projected to slow to about 1.0% by 2030, 0.6% by 2045 and around 0.5% by 2075. The population of Canada less Québec is expected to reach 49.2 million by 2100.
| Year | Population 1st July | Births | Net Migrants | Deaths | Change in Population | Annual Percentage Change | ||
|---|---|---|---|---|---|---|---|---|
| 20-64 (%) |
65+ (%) |
Total (%) |
||||||
| 2022 | 30,074 | 301 | 359 | 228 | 432 | 1.1 | 3.8 | 1.5 |
| 2023 | 30,519 | 313 | 361 | 229 | 445 | 0.8 | 3.8 | 1.5 |
| 2024 | 30,937 | 320 | 330 | 233 | 417 | 0.7 | 3.7 | 1.4 |
| 2025 | 31,333 | 327 | 308 | 238 | 397 | 0.6 | 3.6 | 1.3 |
| 2026 | 31,708 | 334 | 285 | 244 | 375 | 0.5 | 3.5 | 1.2 |
| 2027 | 32,073 | 339 | 274 | 249 | 365 | 0.5 | 3.3 | 1.1 |
| 2028 | 32,426 | 344 | 263 | 255 | 353 | 0.4 | 3.3 | 1.1 |
| 2029 | 32,764 | 348 | 252 | 261 | 339 | 0.4 | 3.0 | 1.0 |
| 2030 | 33,087 | 349 | 241 | 267 | 323 | 0.4 | 2.7 | 1.0 |
| 2035 | 34,557 | 343 | 239 | 301 | 281 | 0.6 | 1.6 | 0.8 |
| 2040 | 35,854 | 338 | 248 | 339 | 246 | 0.6 | 1.0 | 0.7 |
| 2045 | 37,008 | 340 | 255 | 373 | 222 | 0.6 | 0.9 | 0.6 |
| 2050 | 38,078 | 346 | 262 | 398 | 210 | 0.5 | 1.2 | 0.6 |
| 2055 | 39,128 | 358 | 269 | 414 | 212 | 0.3 | 1.4 | 0.5 |
| 2060 | 40,229 | 373 | 276 | 422 | 226 | 0.1 | 1.5 | 0.6 |
| 2065 | 41,398 | 383 | 283 | 429 | 237 | 0.2 | 1.4 | 0.6 |
| 2070 | 42,581 | 387 | 291 | 444 | 235 | 0.5 | 0.7 | 0.6 |
| 2080 | 44,799 | 397 | 305 | 491 | 211 | 0.5 | 0.5 | 0.5 |
| 2090 | 46,894 | 419 | 319 | 523 | 215 | 0.4 | 0.6 | 0.5 |
| 2100 | 49,228 | 441 | 334 | 524 | 250 | 0.4 | 0.7 | 0.5 |
Chart 9 Projected Components of Population Growth for Canada less Québec (thousands)
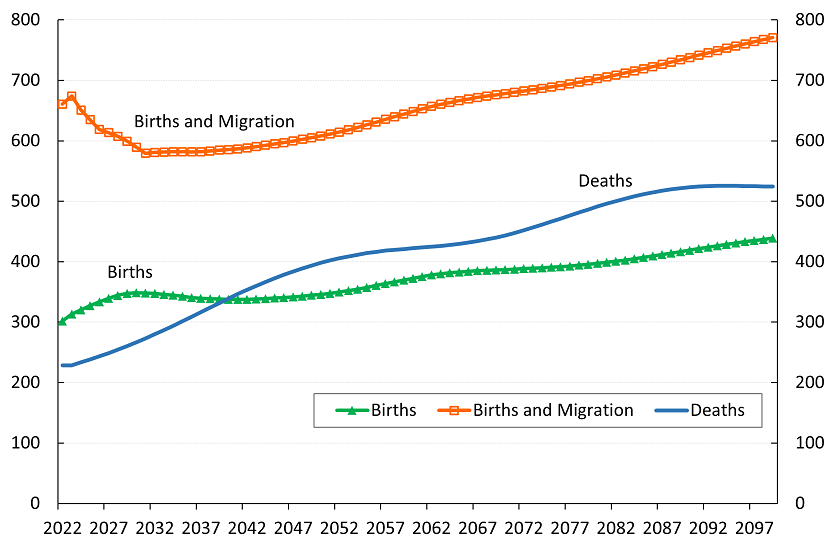
Text description: Chart 9 Projected Components of Population Growth for Canada less Québec (thousands)
Line chart showing the projected components of population growth for Canada less Québec. Y axis represents the number of individuals in thousands. X axis represents the year.
Births are projected to start at approximately 301,000 in 2022 and to increase to 441,000 in 2100.
Deaths are projected to start at approximately 228,000 in 2022 and to increase to 339,000 in 2040 at which point they will be greater than births (338,000 in 2040), and to continue increasing to 524,000 in 2100.
Births and Migration are projected to start at approximately 661,000 in 2022, to increase in 2023 before decreasing somewhat until 2031 and then increase thereafter to reach 774,000 in 2100.
| Year | Births | Deaths | Births and Migration |
|---|---|---|---|
| 2022 | 301 | 228 | 661 |
| 2023 | 313 | 229 | 674 |
| 2024 | 320 | 233 | 651 |
| 2025 | 327 | 238 | 635 |
| 2026 | 334 | 244 | 619 |
| 2027 | 339 | 249 | 614 |
| 2028 | 344 | 255 | 607 |
| 2029 | 348 | 261 | 599 |
| 2030 | 349 | 267 | 589 |
| 2031 | 348 | 273 | 579 |
| 2032 | 347 | 280 | 581 |
| 2033 | 346 | 287 | 581 |
| 2034 | 345 | 294 | 582 |
| 2035 | 343 | 301 | 582 |
| 2036 | 341 | 309 | 582 |
| 2037 | 339 | 316 | 582 |
| 2038 | 339 | 324 | 583 |
| 2039 | 338 | 332 | 584 |
| 2040 | 338 | 339 | 586 |
| 2041 | 337 | 346 | 587 |
| 2042 | 337 | 353 | 588 |
| 2043 | 338 | 360 | 590 |
| 2044 | 339 | 367 | 593 |
| 2045 | 340 | 373 | 595 |
| 2046 | 341 | 378 | 597 |
| 2047 | 342 | 384 | 600 |
| 2048 | 343 | 389 | 602 |
| 2049 | 344 | 394 | 605 |
| 2050 | 346 | 398 | 608 |
| 2051 | 348 | 402 | 611 |
| 2052 | 350 | 406 | 614 |
| 2053 | 352 | 409 | 618 |
| 2054 | 355 | 412 | 622 |
| 2055 | 358 | 414 | 626 |
| 2056 | 361 | 416 | 631 |
| 2057 | 364 | 418 | 635 |
| 2058 | 367 | 420 | 640 |
| 2059 | 370 | 421 | 644 |
| 2060 | 373 | 422 | 649 |
| 2061 | 376 | 423 | 653 |
| 2062 | 378 | 425 | 657 |
| 2063 | 380 | 426 | 660 |
| 2064 | 382 | 428 | 663 |
| 2065 | 383 | 429 | 666 |
| 2066 | 384 | 431 | 669 |
| 2067 | 385 | 434 | 672 |
| 2068 | 386 | 437 | 674 |
| 2069 | 387 | 440 | 676 |
| 2070 | 387 | 444 | 678 |
| 2071 | 388 | 448 | 680 |
| 2072 | 388 | 452 | 682 |
| 2073 | 389 | 456 | 685 |
| 2074 | 390 | 461 | 687 |
| 2075 | 391 | 466 | 689 |
| 2076 | 392 | 471 | 692 |
| 2077 | 393 | 476 | 694 |
| 2078 | 394 | 481 | 697 |
| 2079 | 396 | 486 | 700 |
| 2080 | 397 | 491 | 703 |
| 2081 | 399 | 496 | 706 |
| 2082 | 401 | 500 | 709 |
| 2083 | 403 | 504 | 712 |
| 2084 | 405 | 508 | 716 |
| 2085 | 407 | 512 | 719 |
| 2086 | 409 | 515 | 723 |
| 2087 | 412 | 517 | 726 |
| 2088 | 414 | 520 | 730 |
| 2089 | 417 | 522 | 734 |
| 2090 | 419 | 523 | 738 |
| 2091 | 421 | 524 | 742 |
| 2092 | 424 | 525 | 746 |
| 2093 | 426 | 526 | 749 |
| 2094 | 429 | 526 | 753 |
| 2095 | 431 | 526 | 757 |
| 2096 | 433 | 525 | 760 |
| 2097 | 435 | 525 | 764 |
| 2098 | 437 | 525 | 767 |
| 2099 | 439 | 524 | 771 |
| 2100 | 441 | 524 | 774 |
B.4 Economic Assumptions
The list of assumptions required to project the various economic indices, as well as CPP contributions and expenditures is quite extensive. The following sections cover the more important assumptions.
The economic outlook rests on the assumed evolution of the labour market, that is, labour force participation, employment, unemployment, inflation, and the increase in average employment earnings. Rates of return on CPP assets reflect the financial markets and are part of the investment assumptions described in section B.6 of this appendix. All of these factors must be considered together and form part of an overall economic perspective.
B.4.1 Labour Market
Chart 10 shows the main components of the labour market that are used to determine the number of earners and contributors by age, sex, and calendar year.
Chart 10 Components of the Labour Market
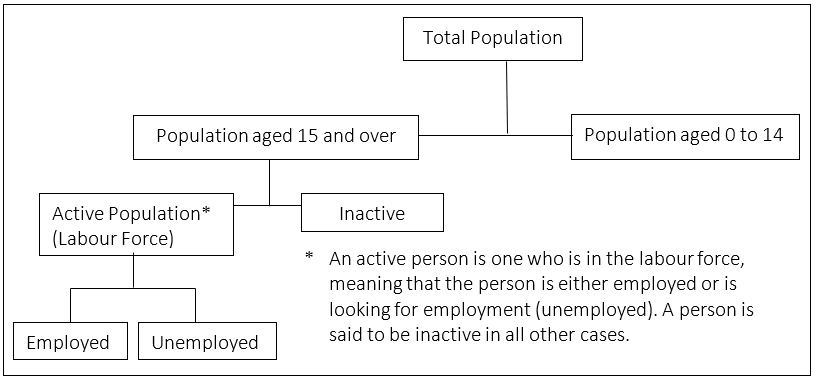
Text description: Chart 10 Components of the Labour Market
Flow chart showing the main components of the labour market that are used to determine the number of earners and contributors by age, sex, and calendar year.
The top box is the total population. This box splits into two boxes, the first one is the population aged 15 and over and the second box is the population 0 to 14.
The box of the population aged 15 and over is then split into two boxes, the first box is the active population (or labour force), which represents those who are either employed or looking for employment. The second box is the inactive population.
The active population box is split into two boxes. The first box is for the employed and the second box is for the unemployed.
The number of earners is based on the number of employed and is defined as the number of persons who had earnings during a given calendar year. The earners become contributors if they have earnings during the year above the Year’s Basic Exemption (YBE) and they are between the ages of 18 and 70.
The proportion of earners and contributors assumptions (described in this section and section B.5.1) rely on the projected active population of this report. The projected effect of working beneficiaries is reflected in all these assumptions.
B.4.1.1 Active Population (Canada)
Table 49 to Table 51 provide projections of the active and employed populations and associated labour force participation, employment, and unemployment rates for Canada.
| Year | PopulationTable 49 Footnote 1 | Active Population | Employed | ||||||
|---|---|---|---|---|---|---|---|---|---|
| Males | Females | Total | Males | Females | Total | Males | Females | Total | |
| 2022 | 15,661 | 16,048 | 31,709 | 10,908 | 9,741 | 20,649 | 10,211 | 9,199 | 19,410 |
| 2023 | 15,879 | 16,274 | 32,153 | 11,025 | 9,860 | 20,885 | 10,356 | 9,339 | 19,695 |
| 2024 | 16,079 | 16,482 | 32,561 | 11,129 | 9,967 | 21,096 | 10,443 | 9,431 | 19,873 |
| 2025 | 16,265 | 16,679 | 32,944 | 11,225 | 10,069 | 21,294 | 10,521 | 9,517 | 20,038 |
| 2026 | 16,435 | 16,862 | 33,297 | 11,313 | 10,166 | 21,479 | 10,592 | 9,598 | 20,190 |
| 2027 | 16,601 | 17,039 | 33,640 | 11,400 | 10,264 | 21,663 | 10,661 | 9,681 | 20,342 |
| 2028 | 16,761 | 17,210 | 33,971 | 11,481 | 10,358 | 21,839 | 10,738 | 9,770 | 20,507 |
| 2029 | 16,913 | 17,374 | 34,287 | 11,560 | 10,449 | 22,009 | 10,812 | 9,855 | 20,667 |
| 2030 | 17,059 | 17,529 | 34,588 | 11,636 | 10,538 | 22,174 | 10,883 | 9,938 | 20,821 |
| 2035 | 17,695 | 18,219 | 35,914 | 12,031 | 11,002 | 23,033 | 11,252 | 10,376 | 21,628 |
| 2040 | 18,287 | 18,860 | 37,147 | 12,356 | 11,291 | 23,647 | 11,556 | 10,649 | 22,205 |
| 2045 | 18,873 | 19,484 | 38,358 | 12,681 | 11,575 | 24,256 | 11,859 | 10,918 | 22,776 |
| 2050 | 19,401 | 20,046 | 39,447 | 12,952 | 11,815 | 24,767 | 12,111 | 11,145 | 23,256 |
| 2055 | 19,875 | 20,539 | 40,414 | 13,139 | 11,993 | 25,132 | 12,286 | 11,313 | 23,599 |
| 2060 | 20,348 | 21,019 | 41,367 | 13,286 | 12,142 | 25,428 | 12,424 | 11,453 | 23,877 |
| 2065 | 20,836 | 21,516 | 42,352 | 13,451 | 12,307 | 25,758 | 12,579 | 11,608 | 24,187 |
| 2070 | 21,333 | 22,031 | 43,364 | 13,681 | 12,516 | 26,196 | 12,794 | 11,804 | 24,599 |
| 2080 | 22,316 | 23,077 | 45,393 | 14,263 | 13,027 | 27,290 | 13,338 | 12,286 | 25,625 |
| 2090 | 23,224 | 24,047 | 47,271 | 14,849 | 13,552 | 28,401 | 13,886 | 12,783 | 26,669 |
| 2100 | 24,227 | 25,052 | 49,279 | 15,402 | 14,039 | 29,440 | 14,404 | 13,240 | 27,644 |
|
Table 49 Footnotes
|
|||||||||
| Year | Labour Force Participation Rate | Employment Rate | Unemployment Rate | ||||||
|---|---|---|---|---|---|---|---|---|---|
| Males | Females | Total | Males | Females | Total | Males | Females | Total | |
| 2022 | 69.7 | 60.7 | 65.1 | 65.2 | 57.3 | 61.2 | 6.4 | 5.6 | 6.0 |
| 2023 | 69.4 | 60.6 | 65.0 | 65.2 | 57.4 | 61.3 | 6.1 | 5.3 | 5.7 |
| 2024 | 69.2 | 60.5 | 64.8 | 64.9 | 57.2 | 61.0 | 6.2 | 5.4 | 5.8 |
| 2025 | 69.0 | 60.4 | 64.6 | 64.7 | 57.1 | 60.8 | 6.3 | 5.5 | 5.9 |
| 2026 | 68.8 | 60.3 | 64.5 | 64.4 | 56.9 | 60.6 | 6.4 | 5.6 | 6.0 |
| 2027 | 68.7 | 60.2 | 64.4 | 64.2 | 56.8 | 60.5 | 6.5 | 5.7 | 6.1 |
| 2028 | 68.5 | 60.2 | 64.3 | 64.1 | 56.8 | 60.4 | 6.5 | 5.7 | 6.1 |
| 2029 | 68.4 | 60.1 | 64.2 | 63.9 | 56.7 | 60.3 | 6.5 | 5.7 | 6.1 |
| 2030 | 68.2 | 60.1 | 64.1 | 63.8 | 56.7 | 60.2 | 6.5 | 5.7 | 6.1 |
| 2035 | 68.0 | 60.4 | 64.1 | 63.6 | 57.0 | 60.2 | 6.5 | 5.7 | 6.1 |
| 2040 | 67.6 | 59.9 | 63.7 | 63.2 | 56.5 | 59.8 | 6.5 | 5.7 | 6.1 |
| 2045 | 67.2 | 59.4 | 63.2 | 62.8 | 56.0 | 59.4 | 6.5 | 5.7 | 6.1 |
| 2050 | 66.8 | 58.9 | 62.8 | 62.4 | 55.6 | 59.0 | 6.5 | 5.7 | 6.1 |
| 2055 | 66.1 | 58.4 | 62.2 | 61.8 | 55.1 | 58.4 | 6.5 | 5.7 | 6.1 |
| 2060 | 65.3 | 57.8 | 61.5 | 61.1 | 54.5 | 57.7 | 6.5 | 5.7 | 6.1 |
| 2065 | 64.6 | 57.2 | 60.8 | 60.4 | 54.0 | 57.1 | 6.5 | 5.7 | 6.1 |
| 2070 | 64.1 | 56.8 | 60.4 | 60.0 | 53.6 | 56.7 | 6.5 | 5.7 | 6.1 |
| 2080 | 63.9 | 56.4 | 60.1 | 59.8 | 53.2 | 56.5 | 6.5 | 5.7 | 6.1 |
| 2090 | 63.9 | 56.4 | 60.1 | 59.8 | 53.2 | 56.4 | 6.5 | 5.7 | 6.1 |
| 2100 | 63.6 | 56.0 | 59.7 | 59.5 | 52.9 | 56.1 | 6.5 | 5.7 | 6.1 |
| Age Group | Males | Females | ||||||
|---|---|---|---|---|---|---|---|---|
| 2022 | 2025 | 2035 | 2050 | 2022 | 2025 | 2035 | 2050 | |
| 15-19 | 48.7 | 49.4 | 52.0 | 52.0 | 51.2 | 51.8 | 54.0 | 54.0 |
| 20-24 | 77.1 | 77.7 | 80.0 | 80.0 | 75.2 | 75.9 | 78.0 | 78.0 |
| 25-29 | 88.8 | 89.6 | 92.0 | 92.0 | 84.4 | 85.5 | 89.0 | 89.0 |
| 30-34 | 92.4 | 92.8 | 94.0 | 94.0 | 84.1 | 84.8 | 87.0 | 87.0 |
| 35-39 | 93.4 | 93.6 | 94.0 | 94.0 | 83.3 | 84.4 | 88.0 | 88.0 |
| 40-44 | 92.8 | 93.1 | 94.0 | 94.0 | 85.0 | 85.9 | 89.0 | 89.0 |
| 45-49 | 92.3 | 92.5 | 93.0 | 93.0 | 85.0 | 86.0 | 89.0 | 89.0 |
| 50-54 | 90.0 | 90.3 | 91.0 | 91.0 | 83.3 | 84.2 | 87.0 | 87.0 |
| 55-59 | 82.4 | 82.7 | 84.0 | 84.0 | 72.3 | 73.1 | 76.0 | 76.0 |
| 60-64 | 64.8 | 65.1 | 66.0 | 66.0 | 51.3 | 51.7 | 53.0 | 53.0 |
| 65-69 | 34.0 | 34.4 | 36.0 | 36.0 | 21.7 | 22.3 | 24.0 | 24.0 |
| 70 and Over | 11.4 | 11.7 | 13.0 | 13.0 | 4.5 | 4.7 | 5.5 | 5.5 |
| 55-69 | 61.7 | 60.9 | 62.6 | 63.7 | 49.4 | 48.8 | 51.5 | 52.3 |
| 55 and Over | 43.0 | 41.2 | 37.9 | 39.7 | 31.4 | 30.0 | 27.7 | 28.7 |
| 18-69 | 80.8 | 81.1 | 83.2 | 82.2 | 72.6 | 73.2 | 76.8 | 75.9 |
| 15 and Over | 69.7 | 69.0 | 68.0 | 66.8 | 60.7 | 60.4 | 60.4 | 58.9 |
Several trends are taken into account in developing the above assumptions. Some of these trends are discussed below.
Male-Female Labour Force Participation Gap
The overall labour force participation rates in Canada (the active population expressed as a proportion of the population aged 15 and over) from 1976 to 2021 clearly show a narrowing of the gap between male and female rates. Although the increase in participation rates of females aged 18 to 69 has slowed down since the mid-2000s, the increase was significant over the previous decades. It has also been observed that participation rates for those aged 55 and older have increased significantly over the last decade for both men and women.
In 1976, overall male labour force participation (ages 15 and over) was about 78% compared to only 46% for females, which represents a gap of 32%. This gap has narrowed to 9.0% in 2021 (participation rates of 69.6% for males, 60.6% for females), slightly higher than its pre-pandemic level of 8.8% in 2018 and 2019. It is assumed that females will continue to narrow the gap in participation rates but at a slower pace, with the gap gradually reducing to about 7.6% by 2035 (68.0% for males vs. 60.4% for females). A part of this reduction comes from the expected impact on the female labour force due to the Early Learning and Child Care Plan initiative announced by the federal Government in 2021. This is in line with the observed historical impact on the province of Quebec’s female labour force following the implementation of their childcare system in 1997.
Population Aging
Given that participation rates start to decline mostly after age 50, the aging of the population will exert downward pressure on the overall labour force participation rate in Canada. If current participation rates by age and sex were to apply throughout the projection period, the effect of population aging alone would cause the overall participation rate from Table 50 to fall from 65.1% in 2021 to 60.3% in 2050, instead of 62.8% as projected under the best-estimate assumptions.
An assumption underlying the future overall participation rate is an increase in participation rates for age groups 55 and over as a result of an expected continued trend toward longer working lives. Continued trends in making work more accessible to older workers (such as wage subsidies for hiring older workers and flexible work arrangements), the removal of the work cessation test to receive the CPP retirement pension prior to age 65, the projected continued increases in life expectancy, and possible insufficient retirement savings are assumed to encourage older workers to delay their retirement and exit the labour force at a later age.
The participation rates for those aged 55 to 59 are assumed to increase from 82.4% to 84.0% for males and from 72.3% to 76.0% for females over the period 2021 to 2050. Over the same period, the participation rates for those aged 60 to 64 are assumed to increase from 64.8% to 66.0% and from 51.3% to 53.0% for males and females, respectively, and the participation rates for those aged 65 to 69 are assumed to increase from 34.0% to 36.0% and from 21.7% to 24.0% for males and females, respectively.
Chart 11 shows the historical and projected participation rates for the three age groups 55 to 59, 60 to 64, and 65 to 69.
Chart 11 Labour Force Participation Rates (Canada)
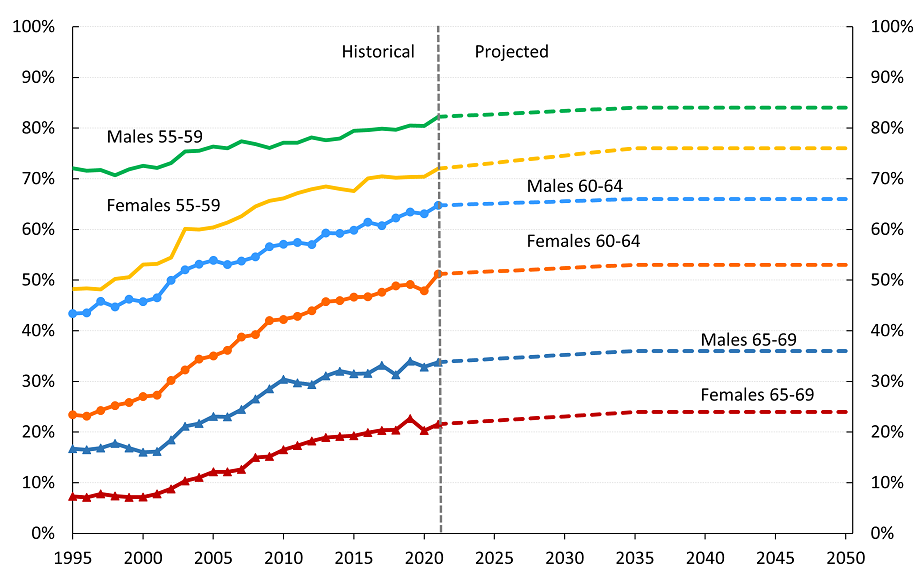
Text description: Chart 11 Labour Force Participation Rates (Canada)
Line chart showing the historical and projected labour force participation rates for Canada for specific age groups. Y axis represents the labour force participation rate. X axis represents the year.
The labour force participation rate of males aged 55 to 59 is 72.1% in 1995, increases to 82.2% in 2021, and is projected to increase to 84% in 2050.
The participation rate of females aged 55 to 59 is 48.3% in 1995, increases to 72.0% in 2021, and is projected to increase to 76% in 2050.
The participation rate of males aged 60 to 64 is 43.4% in 1995, increases to 64.8% in 2021, and is projected to increase to 66% in 2050.
The participation rate of females aged 60 to 64 is 23.4% in 1995, increases to 51.2% in 2021, and is projected to increase to 53% in 2050.
The participation rate of males aged 65 to 69 is 16.7% in 1995, increases to 33.8% in 2021, and is projected to increase to 36% in 2050.
The participation rate of females aged 65 to 69 is 7.3% in 1995, increases to 21.6% in 2021, and is projected to increase to 24% in 2050.
| Year | Males (55-59) | Males (60-64) | Males (65-69) | Females (55-59) | Females (60-64) | Females (65-69) |
|---|---|---|---|---|---|---|
| 1995 | 0.7209 | 0.4339 | 0.1671 | 0.4825 | 0.2342 | 0.0730 |
| 1996 | 0.7158 | 0.4351 | 0.1652 | 0.4838 | 0.2316 | 0.0710 |
| 1997 | 0.7175 | 0.4581 | 0.1687 | 0.4814 | 0.2428 | 0.0781 |
| 1998 | 0.7071 | 0.4473 | 0.1774 | 0.5021 | 0.2525 | 0.0737 |
| 1999 | 0.7189 | 0.4624 | 0.1688 | 0.506 | 0.2584 | 0.0714 |
| 2000 | 0.7255 | 0.4576 | 0.1599 | 0.5305 | 0.2702 | 0.0715 |
| 2001 | 0.7216 | 0.4648 | 0.1614 | 0.5321 | 0.2731 | 0.0779 |
| 2002 | 0.7313 | 0.4999 | 0.1842 | 0.5447 | 0.3019 | 0.0880 |
| 2003 | 0.7538 | 0.5205 | 0.2114 | 0.601 | 0.3226 | 0.1038 |
| 2004 | 0.7555 | 0.5314 | 0.2169 | 0.6001 | 0.3443 | 0.1103 |
| 2005 | 0.7633 | 0.5389 | 0.2306 | 0.6039 | 0.3505 | 0.1213 |
| 2006 | 0.7599 | 0.5306 | 0.2302 | 0.6137 | 0.3613 | 0.1216 |
| 2007 | 0.774 | 0.5373 | 0.2446 | 0.6261 | 0.3878 | 0.1263 |
| 2008 | 0.7681 | 0.5458 | 0.2655 | 0.6454 | 0.3922 | 0.1496 |
| 2009 | 0.7605 | 0.566 | 0.2856 | 0.6565 | 0.4204 | 0.1517 |
| 2010 | 0.7715 | 0.5707 | 0.3041 | 0.6611 | 0.4225 | 0.1648 |
| 2011 | 0.7712 | 0.5742 | 0.2973 | 0.6718 | 0.4283 | 0.1734 |
| 2012 | 0.7812 | 0.5701 | 0.2935 | 0.6791 | 0.4395 | 0.1825 |
| 2013 | 0.7757 | 0.5929 | 0.3112 | 0.6847 | 0.4571 | 0.1890 |
| 2014 | 0.7796 | 0.592 | 0.3202 | 0.6802 | 0.4598 | 0.1913 |
| 2015 | 0.7945 | 0.5983 | 0.3152 | 0.6755 | 0.4661 | 0.1928 |
| 2016 | 0.7962 | 0.614 | 0.316 | 0.7005 | 0.4672 | 0.1986 |
| 2017 | 0.7989 | 0.6073 | 0.3317 | 0.7048 | 0.4760 | 0.2034 |
| 2018 | 0.797 | 0.6227 | 0.3132 | 0.7023 | 0.4888 | 0.2041 |
| 2019 | 0.8047 | 0.6346 | 0.3400 | 0.7032 | 0.4910 | 0.2269 |
| 2020 | 0.8044 | 0.6309 | 0.3285 | 0.7043 | 0.4789 | 0.2028 |
| 2021 | 0.8222 | 0.6475 | 0.3380 | 0.7198 | 0.5120 | 0.2157 |
| Year | Males (55-59) | Males (60-64) | Males (65-69) | Females (55-59) | Females (60-64) | Females (65-69) |
|---|---|---|---|---|---|---|
| 2022 | 0.8235 | 0.6484 | 0.3396 | 0.7227 | 0.5133 | 0.2174 |
| 2023 | 0.8248 | 0.6493 | 0.3412 | 0.7256 | 0.5146 | 0.2191 |
| 2024 | 0.8261 | 0.6502 | 0.3428 | 0.7285 | 0.5159 | 0.2208 |
| 2025 | 0.8274 | 0.6511 | 0.3444 | 0.7314 | 0.5172 | 0.2225 |
| 2026 | 0.8287 | 0.6520 | 0.3460 | 0.7343 | 0.5185 | 0.2242 |
| 2027 | 0.8300 | 0.6529 | 0.3476 | 0.7372 | 0.5198 | 0.2259 |
| 2028 | 0.8313 | 0.6538 | 0.3492 | 0.7401 | 0.5211 | 0.2276 |
| 2029 | 0.8326 | 0.6547 | 0.3508 | 0.7430 | 0.5224 | 0.2293 |
| 2030 | 0.8339 | 0.6556 | 0.3524 | 0.7459 | 0.5237 | 0.2310 |
| 2031 | 0.8352 | 0.6565 | 0.3540 | 0.7488 | 0.5250 | 0.2327 |
| 2032 | 0.8365 | 0.6574 | 0.3556 | 0.7517 | 0.5263 | 0.2344 |
| 2033 | 0.8378 | 0.6583 | 0.3572 | 0.7546 | 0.5276 | 0.2361 |
| 2034 | 0.8391 | 0.6592 | 0.3588 | 0.7575 | 0.5289 | 0.2378 |
| 2035 | 0.8400 | 0.6600 | 0.3600 | 0.7600 | 0.5300 | 0.2400 |
| 2036 | 0.8400 | 0.6600 | 0.3600 | 0.7600 | 0.5300 | 0.2400 |
| 2037 | 0.8400 | 0.6600 | 0.3600 | 0.7600 | 0.5300 | 0.2400 |
| 2038 | 0.8400 | 0.6600 | 0.3600 | 0.7600 | 0.5300 | 0.2400 |
| 2039 | 0.8400 | 0.6600 | 0.3600 | 0.7600 | 0.5300 | 0.2400 |
| 2040 | 0.8400 | 0.6600 | 0.3600 | 0.7600 | 0.5300 | 0.2400 |
| 2041 | 0.8400 | 0.6600 | 0.3600 | 0.7600 | 0.5300 | 0.2400 |
| 2042 | 0.8400 | 0.6600 | 0.3600 | 0.7600 | 0.5300 | 0.2400 |
| 2043 | 0.8400 | 0.6600 | 0.3600 | 0.7600 | 0.5300 | 0.2400 |
| 2044 | 0.8400 | 0.6600 | 0.3600 | 0.7600 | 0.5300 | 0.2400 |
| 2045 | 0.8400 | 0.6600 | 0.3600 | 0.7600 | 0.5300 | 0.2400 |
| 2046 | 0.8400 | 0.6600 | 0.3600 | 0.7600 | 0.5300 | 0.2400 |
| 2047 | 0.8400 | 0.6600 | 0.3600 | 0.7600 | 0.5300 | 0.2400 |
| 2048 | 0.8400 | 0.6600 | 0.3600 | 0.7600 | 0.5300 | 0.2400 |
| 2049 | 0.8400 | 0.6600 | 0.3600 | 0.7600 | 0.5300 | 0.2400 |
| 2050 | 0.8400 | 0.6600 | 0.3600 | 0.7600 | 0.5300 | 0.2400 |
Labour Shortages
Despite the assumed future increase in participation rates of women and older workers, as well as an assumed continued reliance on skilled immigrant workers, it is still expected that there will be continued labour shortages in the future as the working-age population expands at a slower pace and as baby boomers continue to retire and exit the labour force. The participation rates for all age groups are expected to increase due to the attractive employment opportunities resulting from labour shortages.
Based on the foregoing, the participation rates of both men and women are expected to increase over the projection period from their 2021 levels for all age groups. Nonetheless, these increases in participation rates are not sufficient to offset the decrease in the overall participation rate (ages 15 and over) due to the demographic shift from population aging.
For the purpose of projecting the participation rates, the projection period has been divided into two periods: 2022 to 2035 and from 2035 onward. From 2022 to 2035, the projected participation rates are based on the expected impact of the above-mentioned factors through time for each age group and sex. From 2035 onward, the participation rates are held constant. This long-term assumption combined with a slow growth in the working-age population, results in a rate of growth of approximately 0.4% for the Canadian active population (that is, the labour force) after 2035.
B.4.1.2 Employment (Canada)
In Canada, the annual job creation rate (i.e. the change in the number of persons employed) has been on average about 1.5% since 1976. However, this rate has varied over the years. It is assumed that the job creation rate will be 2.9% in 2022 and 1.5% in 2023, corresponding to an assumed decrease in unemployment rate from 7.5% in 2021 (actual) to 6.0% in 2022 and 5.7% in 2023. These rates are based on the recent experience and various economic forecasts, and reflect the expected labour market recovery from the COVID-19 pandemic. It is further assumed that over the 2024-2027 period, the job creation rate will be slightly lower than the labour force growth rate, so that the unemployment rate will slowly increase from 5.7% in 2023 to 6.1% by 2027.
Over the long term, the job creation rate is projected to be the same as the labour force growth of 0.4%. This reflects the ultimate assumption for the unemployment rate of 6.1% for years 2027 and thereafter.
Table 52 shows the projected number of employed persons and the employment rate for those aged 18 to 69, in Canada.
| Year | Population (thousands) |
Employed (thousands) |
Employment Rate (%) |
|||
|---|---|---|---|---|---|---|
| Males | Females | Males | Females | Males | Females | |
| 2022 | 13,241 | 13,161 | 9,768 | 8,874 | 73.8 | 67.4 |
| 2023 | 13,347 | 13,269 | 9,890 | 8,998 | 74.1 | 67.8 |
| 2024 | 13,433 | 13,358 | 9,957 | 9,077 | 74.1 | 68.0 |
| 2025 | 13,508 | 13,439 | 10,017 | 9,152 | 74.2 | 68.1 |
| 2026 | 13,578 | 13,516 | 10,071 | 9,224 | 74.2 | 68.2 |
| 2027 | 13,640 | 13,583 | 10,123 | 9,298 | 74.2 | 68.5 |
| 2028 | 13,692 | 13,642 | 10,182 | 9,378 | 74.4 | 68.7 |
| 2029 | 13,737 | 13,691 | 10,239 | 9,454 | 74.5 | 69.1 |
| 2030 | 13,776 | 13,733 | 10,293 | 9,528 | 74.7 | 69.4 |
| 2035 | 13,950 | 13,919 | 10,579 | 9,923 | 75.8 | 71.3 |
| 2040 | 14,264 | 14,241 | 10,843 | 10,174 | 76.0 | 71.4 |
| 2045 | 14,711 | 14,672 | 11,115 | 10,416 | 75.6 | 71.0 |
| 2050 | 15,144 | 15,096 | 11,353 | 10,633 | 75.0 | 70.4 |
| 2055 | 15,433 | 15,404 | 11,506 | 10,793 | 74.6 | 70.1 |
| 2060 | 15,616 | 15,627 | 11,605 | 10,918 | 74.3 | 69.9 |
| 2065 | 15,708 | 15,778 | 11,708 | 11,051 | 74.5 | 70.0 |
| 2070 | 15,828 | 15,945 | 11,872 | 11,225 | 75.0 | 70.4 |
| 2080 | 16,491 | 16,572 | 12,363 | 11,670 | 75.0 | 70.4 |
| 2090 | 17,211 | 17,276 | 12,879 | 12,144 | 74.8 | 70.3 |
| 2100 | 17,841 | 17,913 | 13,342 | 12,574 | 74.8 | 70.2 |
B.4.1.3 Labour Market (Canada less Québec)
Given that the CPP covers labour force in all provinces except Québec, labour market assumptions were developed for Québec, and the results for Canada less Québec were derived. Table 53 and Table 54 show the projected active population, number of employed, and labour force participation rates for Canada less Québec.
| Year | PopulationTable 53 Footnote 1 | Active Population | Employed | ||||||
|---|---|---|---|---|---|---|---|---|---|
| Males | Females | Total | Males | Females | Total | Males | Females | Total | |
| 2022 | 12,101 | 12,471 | 24,572 | 8,491 | 7,601 | 16,092 | 7,933 | 7,157 | 15,090 |
| 2023 | 12,287 | 12,668 | 24,955 | 8,600 | 7,714 | 16,314 | 8,064 | 7,288 | 15,353 |
| 2024 | 12,460 | 12,852 | 25,312 | 8,699 | 7,819 | 16,519 | 8,154 | 7,383 | 15,537 |
| 2025 | 12,621 | 13,026 | 25,647 | 8,791 | 7,919 | 16,710 | 8,236 | 7,472 | 15,708 |
| 2026 | 12,769 | 13,186 | 25,955 | 8,876 | 8,012 | 16,888 | 8,310 | 7,556 | 15,866 |
| 2027 | 12,911 | 13,342 | 26,253 | 8,957 | 8,105 | 17,062 | 8,382 | 7,639 | 16,021 |
| 2028 | 13,048 | 13,491 | 26,539 | 9,033 | 8,192 | 17,225 | 8,453 | 7,722 | 16,175 |
| 2029 | 13,178 | 13,633 | 26,811 | 9,105 | 8,277 | 17,382 | 8,521 | 7,801 | 16,322 |
| 2030 | 13,303 | 13,768 | 27,071 | 9,175 | 8,358 | 17,533 | 8,586 | 7,877 | 16,463 |
| 2035 | 13,857 | 14,378 | 28,235 | 9,527 | 8,781 | 18,308 | 8,916 | 8,275 | 17,191 |
| 2040 | 14,391 | 14,958 | 29,349 | 9,829 | 9,052 | 18,881 | 9,198 | 8,531 | 17,729 |
| 2045 | 14,936 | 15,540 | 30,476 | 10,142 | 9,325 | 19,466 | 9,489 | 8,790 | 18,279 |
| 2050 | 15,440 | 16,079 | 31,519 | 10,412 | 9,564 | 19,976 | 9,741 | 9,016 | 18,757 |
| 2055 | 15,894 | 16,557 | 32,452 | 10,606 | 9,745 | 20,351 | 9,923 | 9,187 | 19,110 |
| 2060 | 16,339 | 17,015 | 33,354 | 10,759 | 9,893 | 20,652 | 10,066 | 9,326 | 19,392 |
| 2065 | 16,796 | 17,482 | 34,278 | 10,921 | 10,051 | 20,972 | 10,218 | 9,475 | 19,693 |
| 2070 | 17,263 | 17,966 | 35,229 | 11,138 | 10,252 | 21,391 | 10,422 | 9,664 | 20,086 |
| 2080 | 18,201 | 18,961 | 37,162 | 11,709 | 10,761 | 22,470 | 10,955 | 10,144 | 21,099 |
| 2090 | 19,073 | 19,893 | 38,966 | 12,285 | 11,282 | 23,567 | 11,494 | 10,635 | 22,129 |
| 2100 | 20,024 | 20,849 | 40,873 | 12,819 | 11,754 | 24,573 | 11,994 | 11,080 | 23,074 |
|
Table 53 Footnotes
|
|||||||||
| Age Group | Males | Females | ||||||
|---|---|---|---|---|---|---|---|---|
| 2022 | 2025 | 2035 | 2050 | 2022 | 2025 | 2035 | 2050 | |
| 15-19 | 46.7 | 47.7 | 51.5 | 51.5 | 49.3 | 50.2 | 53.5 | 53.5 |
| 20-24 | 76.8 | 77.3 | 79.2 | 79.3 | 74.2 | 74.9 | 77.2 | 77.3 |
| 25-29 | 88.8 | 89.5 | 92.0 | 92.0 | 83.9 | 85.0 | 88.7 | 88.8 |
| 30-34 | 92.4 | 92.8 | 94.0 | 94.0 | 83.8 | 84.5 | 86.8 | 86.8 |
| 35-39 | 93.5 | 93.6 | 94.0 | 94.0 | 82.2 | 83.5 | 87.5 | 87.5 |
| 40-44 | 92.6 | 92.9 | 94.0 | 94.0 | 84.0 | 85.2 | 88.8 | 88.8 |
| 45-49 | 92.3 | 92.4 | 93.0 | 93.0 | 84.3 | 85.3 | 88.8 | 88.8 |
| 50-54 | 90.1 | 90.4 | 91.0 | 91.0 | 82.3 | 83.3 | 86.7 | 86.8 |
| 55-59 | 82.3 | 82.7 | 84.0 | 84.0 | 72.0 | 73.1 | 76.6 | 76.5 |
| 60-64 | 65.9 | 66.1 | 66.9 | 66.7 | 53.0 | 53.4 | 54.6 | 54.4 |
| 65-69 | 35.9 | 36.4 | 37.7 | 37.6 | 23.2 | 23.8 | 25.6 | 25.5 |
| 70 and Over | 12.0 | 12.4 | 13.6 | 13.6 | 5.1 | 5.3 | 6.0 | 5.9 |
| 55-69 | 62.8 | 62.0 | 63.4 | 64.5 | 50.5 | 50.1 | 52.7 | 53.5 |
| 55 and Over | 44.1 | 42.3 | 38.7 | 40.9 | 32.5 | 31.2 | 28.7 | 29.8 |
| 18-69 | 81.1 | 81.4 | 83.5 | 82.4 | 72.4 | 73.2 | 77.1 | 76.0 |
| 15 and Over | 70.2 | 69.7 | 68.8 | 67.4 | 60.9 | 60.8 | 61.1 | 59.5 |
B.4.1.4 Number of Earners (Canada less Québec)
The number of earners for any given year, namely anyone who had employment earnings during the year, is always more than the employed population and sometimes even close to the labour force because it includes all individuals who had earnings at any time during the year, whereas the employed population only indicates the average number of employed in any given year.
The projected number of earners is obtained by a regression based on a highly correlated historical relationship between the number of employed persons and the number of earners over the period 1976 to 2019. Table 55 shows the projected average number of employed persons and the projected number and proportion of earners (relative to the population) aged 18 to 69, for Canada less Québec. The projected number and proportion of earners shown in Table 55 pertain to all earners, including those who are CPP retirement beneficiaries. The effect of CPP retirement beneficiaries with earnings, that is, working beneficiaries, is discussed more in detail in section B.7.6 of this appendix.
| Year | Population (thousands) |
Employed (thousands) |
Earners (thousands) |
Proportion of Earners (earners as % of population) (%) |
||||
|---|---|---|---|---|---|---|---|---|
| Males | Females | Males | Females | Males | Females | Males | Females | |
| 2022 | 10,301 | 10,304 | 7,591 | 6,900 | 8,475 | 7,853 | 82.3 | 76.2 |
| 2023 | 10,404 | 10,411 | 7,705 | 7,019 | 8,627 | 8,004 | 82.9 | 76.9 |
| 2024 | 10,492 | 10,502 | 7,779 | 7,104 | 8,733 | 8,117 | 83.2 | 77.3 |
| 2025 | 10,570 | 10,586 | 7,846 | 7,184 | 8,830 | 8,223 | 83.5 | 77.7 |
| 2026 | 10,641 | 10,665 | 7,907 | 7,260 | 8,894 | 8,307 | 83.6 | 77.9 |
| 2027 | 10,706 | 10,735 | 7,965 | 7,335 | 8,955 | 8,390 | 83.6 | 78.2 |
| 2028 | 10,762 | 10,798 | 8,021 | 7,411 | 9,016 | 8,473 | 83.8 | 78.5 |
| 2029 | 10,811 | 10,851 | 8,075 | 7,483 | 9,073 | 8,552 | 83.9 | 78.8 |
| 2030 | 10,852 | 10,896 | 8,126 | 7,551 | 9,125 | 8,626 | 84.1 | 79.2 |
| 2035 | 11,038 | 11,096 | 8,385 | 7,912 | 9,392 | 9,015 | 85.1 | 81.2 |
| 2040 | 11,327 | 11,395 | 8,631 | 8,146 | 9,655 | 9,272 | 85.2 | 81.4 |
| 2045 | 11,740 | 11,789 | 8,891 | 8,379 | 9,962 | 9,548 | 84.9 | 81.0 |
| 2050 | 12,169 | 12,206 | 9,131 | 8,595 | 10,253 | 9,812 | 84.3 | 80.4 |
| 2055 | 12,460 | 12,514 | 9,292 | 8,758 | 10,451 | 10,010 | 83.9 | 80.0 |
| 2060 | 12,642 | 12,731 | 9,401 | 8,884 | 10,578 | 10,158 | 83.7 | 79.8 |
| 2065 | 12,756 | 12,891 | 9,506 | 9,013 | 10,686 | 10,298 | 83.8 | 79.9 |
| 2070 | 12,878 | 13,052 | 9,662 | 9,180 | 10,847 | 10,478 | 84.2 | 80.3 |
| 2080 | 13,510 | 13,655 | 10,143 | 9,623 | 11,385 | 10,980 | 84.3 | 80.4 |
| 2090 | 14,227 | 14,363 | 10,655 | 10,095 | 11,966 | 11,525 | 84.1 | 80.2 |
| 2100 | 14,841 | 14,987 | 11,104 | 10,513 | 12,467 | 12,001 | 84.0 | 80.1 |
B.4.2 Annual Increase in Prices (Inflation Rate)
The increase in prices (inflation rate) assumption is needed to determine the Pension Index for any given calendar year. It is also used in the determination of the annual nominal increase in average employment earnings, the YMPE, YAMPE, and the nominal rates of return on investments.
Price increases, as measured by changes in the CPI, tend to fluctuate from year to year. Since the mid-1950s, the trend was generally upward through the early 1980s and then generally downward until the introduction of the inflation-control targets in the early 1990s, at which point inflation began to stabilize. The average annual increases in the CPI over the 50, 20 and 10-year periods ending in 2021 were 3.9%, 1.9% and 1.7%, respectively.
On December 13, 2021, the Bank of Canada and the Government renewed their commitment to keep inflation between 1% and 3% with a target at the mid-point of 2% until the end of 2026Footnote 10. They further noted that the Bank will use the flexibility of the 1% to 3% control range to actively seek the maximum sustainable level of employment to an extent that is consistent with keeping medium-term inflation expectations at 2%.
Despite the mid-point target of 2%, the CPI tends to fluctuate from year to year. The COVID-19 pandemic had an impact on the CPI. In 2020, the CPI rose by only 0.7% as a result of a decline in consumer spending stemming from various pandemic-related measures and restrictions. However, as the pandemic evolved and restrictions were lifted, consumer demand increased and supply issues arose. As a result, the increase in CPI was 3.4% in 2021, the fastest pace since 1991. The uncertainty surrounding high inflation due to the demand and supply shocks caused by the pandemic has been exacerbated by the escalation of the conflict in Ukraine. This report considers the escalation of the conflict in Ukraine a subsequent event.
Due to the economic instability caused by the COVID-19 pandemic, the global impacts of the war in Ukraine, and related supply chain issues, inflation is expected to be higher than the 2% target up until 2025. Increase in prices are assumed to be 6.9% in 2022, 3.0% in 2023, 2.5% in 2024, 2.25% in 2025 and 2.0% for 2026 and thereafter. These assumed price increases are based on short-term forecasts from various economists as well as on the expectation that the Bank of Canada and federal Government will continue to renew the inflation target at 2.0% and that the Bank of Canada will be successful in keeping inflation at its mid-point target in the long term.
B.4.3 Real Wage Increases
Two wage measure are used in this report: the average annual earnings (AAE) and the average weekly earnings (AWE). The assumed increase in AAE is used to project the total employment earnings of CPP contributors, while the assumed increase in the AWE is used to project the increase in the YMPE from one year to the next. The average difference between both measures has been relatively small over the period 1966 to 2019. However, they tend to grow at different paces in times of economic expansions and slowdowns.
B.4.3.1 Long-Term Real Wage Increases
Over the long term, increases in the real AAE and real AWE are assumed to be the same and are referred to as real wage increases in this report. The real wage increase can be measured using the difference between the increases in the nominal average wage and the CPI. In this case, the nominal average wage is defined as the ratio of the total nominal earnings to total civilian employment in the Canadian economy as a whole.
The relationship between real wages and the labour markets and overall economy is complex. In general, real wages are subject to downward pressure as the demand for workers decreases. On the other hand, one could expect upward pressure on wages if the size of the labour force fails to keep pace with a growing economy.
The real wage increase is related to the growth in total labour productivity plus the growth of various factors, as shown in Table 56. Data for year 2020 were not taken into account due to variability in data related to the pandemic.
| blank | 1961-2019 Average |
1990-2019 Average |
2000-2019 Average |
Ultimate Assumption |
|---|---|---|---|---|
| Labour Productivity Growth | 1.61% | 1.19% | 0.93% | 1.05% |
| + Compensation Ratio Growth | (0.08)% | (0.15)% | 0.01% | 0.00% |
| + Earnings Ratio Growth | (0.17)% | (0.16)% | (0.11)% | (0.05)% |
| + Average Hours Worked Growth | (0.33)% | (0.17)% | (0.29)% | (0.10)% |
| + Price Differential Growth | 0.05% | (0.06)% | 0.04% | 0.00% |
| Real Wage Increase | 1.07% | 0.65% | 0.57% | 0.90% |
|
Table 56 Footnotes
|
||||
Labour productivity in the above table is defined as the ratio of the real Gross Domestic Product (GDP) to total hours worked in the Canadian economy. As shown in Table 56, growth in labour productivity has decreased since the 1960s. However, long-term productivity is expected to increase as a result of labour shortages and continued technological advancements. At the same time, increasing labour force participation rates of older workers and a reliance on immigration for future labour force growth are expected to moderate labour shortages and the associated impact on productivity.
In addition, labour productivity could be affected by the timing and pace of Canada’s transition to a green economy. There is a substantial uncertainty surrounding the effect of this transition on the composition of Canada’s economy as it potentially moves away from carbon-intensive sectors over the next decades.
Based on the foregoing, a labour productivity growth of 1.05% is assumed for the long term.
The compensation ratio is the ratio of the total compensation received by workers to the nominal GDP, thereby reflecting the extent to which changes in productivity are shared between capital and labour. This ratio decreased on average by 0.08% per year over the 58-year period ending in 2019. It is assumed that there will be no change in the compensation ratio over the long term.
The earnings ratio is the ratio of total workers’ earnings to total compensation. Changes in the earnings ratio reflect changes in the compensation structure offered to employees. The historical decline in the earnings ratio of 0.17% per year from 1961 to 2019 has been primarily due to the faster growth in supplementary labour income, such as employer contributions to pension plans, health benefit plans, the CPP, and the Employment Insurance program, compared to earnings. Given that a significant portion of the historical decrease in the earnings ratio can be explained by the increase in CPP contributions resulting from the increase in the contribution rate from 3.6% in 1986 to 9.9% in 2003, the earnings ratio is not expected to decline as fast as it has in the past. However, as a result of the aging of the population, it is expected that the cost of pension plans and health programs will continue to increase in the future and exert downward pressure on the earnings ratio. Based on the foregoing, it is assumed that the long-term earnings ratio will decline by 0.05% per year.
The average hours worked is defined as the ratio of total hours worked to total employment in the Canadian economy. There was a decrease in the average hours worked between 1961 and 2019. In the future, the assumed steady increases in productivity and the higher participation rates of older workers, who generally work fewer hours, could continue to apply negative pressure on the average hours worked. It is assumed that in the long term, the average hours worked will decline by 0.10% per year.
Finally, the price differential or “labour’s terms of trade” is the ratio of the GDP deflator (defined as the ratio of nominal to real GDP) to the CPI. Including this ratio is necessary because labour productivity is expressed in real terms by using real GDP, while current dollar earnings are converted to real earnings using the CPI. The average annual growth in the price differential was 0.05% between 1961 and 2019. it is assumed that the price differential will remain stable without change over the long term.
The result of the foregoing discussion is that the real wage is assumed to increase by 0.9% per year over the long term.
B.4.3.2 Short-Term Real Wage Increases
Although the real AAE and real AWE are assumed to grow at the same pace in the long term, they tend to grow at different paces in times of economic expansions and slowdowns.
In times of economic slowdown, the AWE increases at a faster pace than the AAE and the reverse occurs in times of economic expansion. This is because during economic slowdowns, individuals with lower earnings lose their jobs, which tends to increase the AWE (proportionally higher earners remain in the labour force and people work less weeks during the year). The reverse holds true in times of economic expansion, i.e., low earners get rehired and people work more weeks during the year.
Based on information up to the end of June 2022, the real AAE is projected to decrease by 2.4% in 2022 and by 0.1% in 2023. Real AAE are then projected to increase, with an ultimate real increase of 0.9% reached in 2026. The negative real AAE growth in the early years of the projection is a result of assumed wage dynamics in periods of high inflation stemming from the COVID-19 pandemic and exarcerbated by the escalation of the conflict in Ukraine, which is considered a subsequent event. The ultimate real AAE increase assumption is developed taking into account historical trends, labour productivity, labour shortages, and other contributing factors. The ultimate real AAE increase assumption combined with the ultimate price increase assumption results in an assumed nominal annual increase of 2.9% in 2026 and thereafter.
Real AWE are projected to decrease by 3.3% in 2022 and by 0.1% in 2023. In the following years, and consistent with the historical long-term relationship between the real change in the AWE and AAE, AWE increase, with an ultimate real increase of 0.9% reached in 2026, equal to the same ultimate real increase in AAE that year.
B.4.3.3 Summary
Table 57 shows the assumptions regarding the annual increases in prices, real AAE, and real AWE.
| Year | Price Increases | Real Increases Average Annual Earnings (AAE) |
Real Increases Average Weekly Earnings (AWE), (YMPE) |
|---|---|---|---|
| 2022 | 6.90 | (2.40) | (3.30) |
| 2023 | 3.00 | (0.10) | (0.10) |
| 2024 | 2.50 | 0.40 | 0.40 |
| 2025 | 2.25 | 0.65 | 0.65 |
| 2026+ | 2.00 | 0.90 | 0.90 |
B.4.4 Average Annual Earnings, Total Earnings, and Pensionable Earnings
Average annual earnings are projected by taking into account past and expected structural demographic and labour market changes as well as the narrowing of the gap between average female and male employment earnings. As part of these projections, the average annual earnings of working beneficiaries are also taken into account. The ratio of female to male average employment earnings stood at about 48% in 1966 and was 79% in 2019. This ratio is projected to increase to 87% by 2050. Table 58 shows the projected average annual earnings by age group and sex for selected years.
| Age Group | Males | Females | ||||
|---|---|---|---|---|---|---|
| 2022 | 2025 | 2050 | 2022 | 2025 | 2050 | |
| 20-24 | 28,844 | 31,372 | 62,089 | 23,168 | 25,359 | 51,816 |
| 25-29 | 47,880 | 51,694 | 102,162 | 39,661 | 43,200 | 90,330 |
| 30-34 | 59,805 | 64,383 | 126,451 | 45,928 | 50,186 | 106,976 |
| 35-39 | 65,016 | 69,986 | 137,292 | 50,383 | 55,078 | 117,484 |
| 40-44 | 67,857 | 73,083 | 143,502 | 54,550 | 59,584 | 126,144 |
| 45-49 | 69,087 | 74,447 | 145,975 | 55,927 | 61,068 | 128,915 |
| 50-54 | 67,653 | 73,043 | 143,178 | 55,028 | 60,018 | 126,401 |
| 55-59 | 62,875 | 67,512 | 132,685 | 50,474 | 55,487 | 116,963 |
| 60-64 | 54,073 | 58,429 | 114,042 | 41,524 | 45,987 | 98,623 |
| 65-69 | 38,633 | 42,872 | 84,567 | 28,459 | 31,126 | 68,963 |
| All Ages | 55,850 | 60,553 | 119,711 | 44,606 | 48,953 | 104,580 |
Total earnings are the product of average earnings and the number of earners. Table 59 shows the projected average earnings and number of earners for each sex, the resulting total earnings, and the annual percentage increase in total earnings for Canada less Québec. The significant increase in total earnings of 8.3% in 2022 results from projected higher employment and high nominal wage growth following the first two years of the COVID-19 pandemic. The annual increase in total earnings is set to reach an ultimate value of about 3.4%. This nominal increase comprises an ultimate inflation rate of 2.0%, real wage growth of 0.9%, and employed population growth for the age group 18 to 69 of 0.5%.
| Year | Average Annual Earnings | Earners | Total Earnings ($ million) |
Annual Increase in Total Earnings (%) |
||
|---|---|---|---|---|---|---|
| Males ($) |
Females ($) |
Males (thousands) |
Females (thousands) |
|||
| 2022 | 55,850 | 44,606 | 8,475 | 7,853 | 823,656 | 8.3 |
| 2023 | 57,374 | 46,011 | 8,627 | 8,004 | 863,211 | 4.8 |
| 2024 | 58,945 | 47,456 | 8,733 | 8,117 | 899,943 | 4.3 |
| 2025 | 60,553 | 48,953 | 8,830 | 8,223 | 937,262 | 4.1 |
| 2026 | 62,212 | 50,494 | 8,894 | 8,307 | 972,783 | 3.8 |
| 2027 | 63,917 | 52,084 | 8,955 | 8,390 | 1,009,361 | 3.8 |
| 2028 | 65,669 | 53,722 | 9,016 | 8,473 | 1,047,268 | 3.8 |
| 2029 | 67,466 | 55,413 | 9,073 | 8,552 | 1,085,983 | 3.7 |
| 2030 | 69,313 | 57,154 | 9,125 | 8,626 | 1,125,534 | 3.6 |
| 2035 | 79,367 | 66,667 | 9,392 | 9,015 | 1,346,437 | 3.6 |
| 2040 | 90,949 | 77,553 | 9,655 | 9,272 | 1,597,232 | 3.5 |
| 2045 | 104,305 | 90,100 | 9,962 | 9,548 | 1,899,381 | 3.5 |
| 2050 | 119,711 | 104,580 | 10,253 | 9,812 | 2,253,547 | 3.4 |
| 2055 | 137,533 | 121,256 | 10,451 | 10,010 | 2,651,238 | 3.2 |
| 2060 | 158,118 | 140,483 | 10,578 | 10,158 | 3,099,531 | 3.1 |
| 2065 | 181,895 | 162,645 | 10,686 | 10,298 | 3,618,653 | 3.1 |
| 2070 | 209,339 | 188,185 | 10,847 | 10,478 | 4,242,605 | 3.3 |
| 2080 | 277,903 | 251,176 | 11,385 | 10,980 | 5,921,931 | 3.4 |
| 2090 | 369,452 | 334,704 | 11,966 | 11,525 | 8,278,334 | 3.4 |
| 2100 | 491,216 | 445,970 | 12,467 | 12,001 | 11,475,969 | 3.3 |
The average pensionable earnings by age, sex, and calendar year correspond to the average portion of individual employment earnings below the YMPE for a cohort of earners earning more than the YBE. The average pensionable earnings are determined using average annual earnings and distributions of earners and earnings. For the additional CPP, the same methodology as mentioned above applies, but the average portion of individual employment earnings used goes up to the YAMPE.
In 2022, the YMPE and YBE are respectively $64,900 and $3,500. The YAMPE is set at 107% of the YMPE in 2024 ($74,000 as projected in this report), and at 114% of the YMPE in 2025 ($81,100 as projected in this report) and thereafter, as per the CPP statute. The YMPE and the YAMPE are increased annually based on the average industrial aggregate wage in Canada as published by Statistics Canada. The projected average pensionable earnings by age and sex for selected years up to the YMPE and YAMPE are shown in Table 60 and Table 61, respectively.
| Age Group | Males | Females | ||||
|---|---|---|---|---|---|---|
| 2022 | 2025 | 2050 | 2022 | 2025 | 2050 | |
| 20-24 | 29,672 | 32,146 | 61,826 | 24,879 | 27,052 | 53,076 |
| 25-29 | 42,933 | 46,564 | 91,715 | 38,227 | 41,557 | 83,955 |
| 30-34 | 48,749 | 52,971 | 105,071 | 41,568 | 45,322 | 92,381 |
| 35-39 | 50,739 | 55,196 | 109,847 | 43,698 | 47,691 | 97,328 |
| 40-44 | 51,731 | 56,322 | 112,346 | 45,704 | 49,903 | 101,766 |
| 45-49 | 52,044 | 56,672 | 113,058 | 46,430 | 50,705 | 103,435 |
| 50-54 | 51,566 | 56,175 | 111,864 | 46,138 | 50,354 | 102,521 |
| 55-59 | 49,421 | 53,694 | 106,313 | 43,811 | 47,955 | 97,087 |
| 60-64 | 46,072 | 49,989 | 97,482 | 39,815 | 43,619 | 87,908 |
| 65-69 | 41,908 | 45,652 | 88,625 | 34,830 | 37,657 | 76,391 |
| All Ages | 46,121 | 50,309 | 99,541 | 40,334 | 44,114 | 89,768 |
| YMPE | 64,900 | 71,200 | 145,600 | 64,900 | 71,200 | 145,600 |
| All Ages / YMPE | 0.71 | 0.71 | 0.68 | 0.62 | 0.62 | 0.62 |
| Age Group | Males | Females | ||||
|---|---|---|---|---|---|---|
| 2022 | 2025 | 2050 | 2022 | 2025 | 2050 | |
| 20-24 | nil - | 32,811 | 63,004 | nil - | 27,326 | 53,617 |
| 25-29 | nil - | 48,987 | 96,221 | nil - | 43,125 | 87,277 |
| 30-34 | nil - | 56,841 | 112,417 | nil - | 47,718 | 97,577 |
| 35-39 | nil - | 59,704 | 118,505 | nil - | 50,581 | 103,520 |
| 40-44 | nil - | 61,169 | 121,733 | nil - | 53,158 | 108,648 |
| 45-49 | nil - | 61,636 | 122,679 | nil - | 54,042 | 110,474 |
| 50-54 | nil - | 60,979 | 121,133 | nil - | 53,554 | 109,274 |
| 55-59 | nil - | 57,987 | 114,547 | nil - | 50,776 | 103,039 |
| 60-64 | nil - | 53,792 | 104,659 | nil - | 45,919 | 92,781 |
| 65-69 | nil - | 49,196 | 95,407 | nil - | 39,525 | 80,336 |
| All Ages | nil - | 54,027 | 106,730 | nil - | 46,508 | 94,919 |
| YAMPE | nil - | 81,100 | 165,900 | nil - | 81,100 | 165,900 |
| All Ages / YMPE | nil - | 0.67 | 0.64 | nil - | 0.57 | 0.57 |
The ratios of average pensionable earnings for males and females as a percentage of the YMPE and the YAMPE are slowly decreasing over time. This is due to the freezing of the YBE which has the effect that, over time, fewer and fewer workers are exempt from participating in the CPP. This, in turn, has the effect of increasing the number of earners with low earnings participating in the Plan. The ratio reduces over time for males mainly due to this YBE effect. The ratio also reduces for females, but to a smaller extent and thus is relatively stable as the YBE effect is mostly offset by the increase in their average pensionable earnings.
B.5 Contributions
Contributions are determined by multiplying together the number of contributors, average contributory earnings, and the contribution rate. Contributions are determined separately for the base and additional Plans to account for the different contributory earnings (as of 2024) and different contribution rates of the two components of the CPP. The number of contributors is the same since a contributor to the additional Plan is necessarily a contributor to the base Plan.
B.5.1 Proportion of Contributors
In order to be considered a contributor to the CPP in any given calendar year, one must have employment earnings exceeding the YBE. Accordingly, the proportion of contributors (in respect of the populationFootnote 11) is determined by multiplying the proportion of the population who are earners by the proportion of earners earning more than the YBE. This last proportion is determined for each age, sex, and calendar year by expressing the YBE as a percentage of average employment earnings and using distributions of earners and their earnings. The proportion of contributors is adjusted to reflect working beneficiaries. Table 62 presents the proportion of contributors by selected age groups and years for males and females.
| Age Group | Males | Females | ||||
|---|---|---|---|---|---|---|
| 2022 | 2025 | 2050 | 2022 | 2025 | 2050 | |
| 20-24 | 79.2 | 82.0 | 85.1 | 77.3 | 79.9 | 84.3 |
| 25-29 | 87.0 | 87.7 | 92.5 | 83.4 | 84.6 | 91.2 |
| 30-34 | 89.0 | 90.3 | 92.4 | 82.0 | 83.5 | 88.2 |
| 35-39 | 88.0 | 90.1 | 91.8 | 79.5 | 82.0 | 87.6 |
| 40-44 | 88.2 | 88.1 | 89.9 | 80.1 | 81.9 | 87.3 |
| 45-49 | 85.9 | 87.7 | 89.4 | 79.9 | 82.1 | 87.3 |
| 50-54 | 84.2 | 85.3 | 86.9 | 79.0 | 81.0 | 86.0 |
| 55-59 | 77.2 | 79.6 | 81.7 | 69.7 | 71.9 | 76.7 |
| 60-64 | 61.5 | 63.5 | 66.8 | 51.0 | 52.4 | 56.5 |
| 65-69 | 28.9 | 30.4 | 33.4 | 19.5 | 20.6 | 23.6 |
| All Ages | 77.4 | 78.8 | 81.1 | 70.5 | 72.1 | 76.9 |
B.5.2 Average Contributory Earnings
Average contributory earnings, which include contributory earnings of working beneficiaries, are determined for each age, sex, and year by subtracting the YBE from the average pensionable earnings shown in Table 60 and Table 61. The resulting average contributory earnings by age group and sex for selected years up to the YMPE and YAMPE are shown in Table 63 and Table 64, respectively.
| Age Group | Males | Females | ||||
|---|---|---|---|---|---|---|
| 2022 | 2025 | 2050 | 2022 | 2025 | 2050 | |
| 20-24 | 26,172 | 28,646 | 58,326 | 21,379 | 23,552 | 49,576 |
| 25-29 | 39,433 | 43,064 | 88,215 | 34,727 | 38,057 | 80,455 |
| 30-34 | 45,249 | 49,471 | 101,571 | 38,068 | 41,822 | 88,881 |
| 35-39 | 47,239 | 51,696 | 106,347 | 40,198 | 44,191 | 93,828 |
| 40-44 | 48,231 | 52,822 | 108,846 | 42,204 | 46,403 | 98,266 |
| 45-49 | 48,544 | 53,172 | 109,558 | 42,930 | 47,205 | 99,935 |
| 50-54 | 48,066 | 52,675 | 108,364 | 42,638 | 46,854 | 99,021 |
| 55-59 | 45,921 | 50,194 | 102,813 | 40,311 | 44,455 | 93,587 |
| 60-64 | 42,572 | 46,489 | 93,982 | 36,315 | 40,119 | 84,408 |
| 65-69 | 38,408 | 42,152 | 85,125 | 31,330 | 34,157 | 72,891 |
| All Ages | 42,621 | 46,809 | 96,041 | 36,834 | 40,614 | 86,268 |
| YMPE | 64,900 | 71,200 | 145,600 | 64,900 | 71,200 | 145,600 |
| Age Group | Males | Females | ||||
|---|---|---|---|---|---|---|
| 2022 | 2025 | 2050 | 2022 | 2025 | 2050 | |
| 20-24 | nil - | 29,311 | 59,504 | nil - | 23,826 | 50,117 |
| 25-29 | nil - | 45,487 | 92,721 | nil - | 39,625 | 83,777 |
| 30-34 | nil - | 53,341 | 108,917 | nil - | 44,218 | 94,077 |
| 35-39 | nil - | 56,204 | 115,005 | nil - | 47,081 | 100,020 |
| 40-44 | nil - | 57,669 | 118,233 | nil - | 49,658 | 105,148 |
| 45-49 | nil - | 58,136 | 119,179 | nil - | 50,542 | 106,974 |
| 50-54 | nil - | 57,479 | 117,633 | nil - | 50,054 | 105,774 |
| 55-59 | nil - | 54,487 | 111,047 | nil - | 47,276 | 99,539 |
| 60-64 | nil - | 50,292 | 101,159 | nil - | 42,419 | 89,281 |
| 65-69 | nil - | 45,696 | 91,907 | nil - | 36,025 | 76,836 |
| All Ages | nil - | 50,527 | 103,230 | nil - | 43,008 | 91,419 |
| YAMPE | nil - | 81,100 | 165,900 | nil - | 81,100 | 165,900 |
B.5.3 Total Contributory Earnings
Contributory earnings for each given age, sex, and year are calculated as the product of the proportion of contributors, average contributory earnings, and the corresponding population. Total contributory earnings for each year are obtained by summing contributory earnings for each age and sex in that year.
Total contributory earnings are then adjusted upward to take into account the non-refundable portion of employer contributions arising generally in respect of (1) employees with multiple employers during a given year, and (2) employees earning less than the YBE during a given year, including those who only work part of a year. The amount of non-refundable employer contributions increases total CPP contributions, which translates into higher underlying contributory earnings. As such, contributory earnings are adjusted only for the purpose of determining the correct amount of contributions, and not for the determination of benefits.
The records of earnings from Service Canada, statistics on contributors from the “The CPP & OAS Stats Book 2021”, published by ESDC, and information from the Canada Revenue Agency on base CPP contribution refunds were used to project the adjustment to contributory earnings up to the YMPE and YAMPE. The adjustment for earnings up to the YMPE is projected to be 1.54% in 2022 and decrease to 1.49% over the projection period to account for the YBE being frozen at $3,500. The adjustment for earnings up to YAMPE is projected to be 1.50% in 2024 and decrease to 1.43% over the projection period also to account for the YBE being frozen at $3,500.
Annual contributions are equal to the product of adjusted contributory earnings and the contribution rates set by law. For the base Plan, the legislated contribution has been 9.9% since 2003. For the additional Plan, the legislated first additional contribution rate is 2.0% as of 2023 (phased in starting in 2019) and the legislated second additional contribution rate is 8.0% as of 2024. Table 65 and Table 66 present information on the total adjusted contributory earnings for pensionable earnings up to the YMPE and YAMPE, respectively. The significant increase in total adjusted contributory earnings of 9.4% in 2022 represents the projected higher employment and high nominal wage growth following the first two years of the COVID-19 pandemic.
| Year | Unadjusted Average Contributory Earnings | YMPE ($) |
Contributors | Total Adjusted Contributory Earnings ($ million) |
Annual Increase in Total Adjusted Contributory Earnings (%) |
||
|---|---|---|---|---|---|---|---|
| Males ($) |
Females ($) |
Males (thousands) |
Females (thousands) |
||||
| 2022 | 42,621 | 36,834 | 64,900 | 7,975 | 7,261 | 616,668 | 9.4 |
| 2023 | 43,956 | 38,040 | 66,900 | 8,124 | 7,410 | 648,785 | 5.2 |
| 2024 | 45,435 | 39,357 | 69,200 | 8,229 | 7,522 | 680,189 | 4.8 |
| 2025 | 46,809 | 40,614 | 71,200 | 8,328 | 7,632 | 710,485 | 4.5 |
| 2026 | 48,237 | 41,915 | 73,300 | 8,394 | 7,720 | 739,632 | 4.1 |
| 2027 | 49,671 | 43,237 | 75,400 | 8,458 | 7,806 | 769,230 | 4.0 |
| 2028 | 51,155 | 44,604 | 77,600 | 8,524 | 7,895 | 800,229 | 4.0 |
| 2029 | 52,691 | 46,023 | 79,900 | 8,586 | 7,980 | 832,186 | 4.0 |
| 2030 | 54,237 | 47,461 | 82,200 | 8,646 | 8,062 | 864,552 | 3.9 |
| 2035 | 62,655 | 55,306 | 94,800 | 8,963 | 8,501 | 1,047,401 | 3.9 |
| 2040 | 72,359 | 64,290 | 109,400 | 9,256 | 8,801 | 1,254,280 | 3.6 |
| 2045 | 83,366 | 74,508 | 126,200 | 9,579 | 9,107 | 1,499,428 | 3.6 |
| 2050 | 96,041 | 86,268 | 145,600 | 9,872 | 9,390 | 1,784,712 | 3.5 |
| 2055 | 110,817 | 99,919 | 168,000 | 10,076 | 9,610 | 2,108,096 | 3.3 |
| 2060 | 127,943 | 115,699 | 193,800 | 10,212 | 9,780 | 2,474,655 | 3.2 |
| 2065 | 147,760 | 133,916 | 223,600 | 10,342 | 9,947 | 2,903,032 | 3.2 |
| 2070 | 170,574 | 154,910 | 258,000 | 10,539 | 10,160 | 3,421,988 | 3.4 |
| 2080 | 227,074 | 206,683 | 343,300 | 11,106 | 10,699 | 4,803,930 | 3.5 |
| 2090 | 302,482 | 275,498 | 457,000 | 11,705 | 11,270 | 6,744,599 | 3.4 |
| 2100 | 403,048 | 367,285 | 608,200 | 12,213 | 11,760 | 9,379,076 | 3.3 |
| Year Table 66 footnote 1 | Unadjusted Average Contributory Earnings | YAMPE ($) |
Contributors | Total Adjusted Contributory Earnings ($ million) |
Annual Increase in Total Adjusted Contributory Earnings (%) |
||
|---|---|---|---|---|---|---|---|
| Males ($) |
Females ($) |
Males (thousands) |
Females (thousands) |
||||
| 2024 | 47,318 | 40,579 | 74,000 | 8,229 | 7,522 | 704,857 | N/A |
| 2025 | 50,527 | 43,008 | 81,100 | 8,328 | 7,632 | 760,039 | 7.8 |
| 2026 | 52,057 | 44,388 | 83,500 | 8,394 | 7,720 | 791,120 | 4.1 |
| 2027 | 53,597 | 45,792 | 85,900 | 8,458 | 7,806 | 822,735 | 4.0 |
| 2028 | 55,186 | 47,241 | 88,400 | 8,524 | 7,895 | 855,768 | 4.0 |
| 2029 | 56,824 | 48,739 | 91,000 | 8,586 | 7,980 | 889,721 | 4.0 |
| 2030 | 58,509 | 50,283 | 93,700 | 8,646 | 8,062 | 924,626 | 3.9 |
| 2035 | 67,503 | 58,584 | 108,000 | 8,963 | 8,501 | 1,119,173 | 3.9 |
| 2040 | 77,903 | 68,116 | 124,700 | 9,256 | 8,801 | 1,339,798 | 3.7 |
| 2045 | 89,672 | 78,945 | 143,800 | 9,579 | 9,107 | 1,600,861 | 3.6 |
| 2050 | 103,230 | 91,419 | 165,900 | 9,872 | 9,390 | 1,904,782 | 3.4 |
| 2055 | 119,058 | 105,906 | 191,500 | 10,076 | 9,610 | 2,249,521 | 3.3 |
| 2060 | 137,386 | 122,638 | 220,900 | 10,212 | 9,780 | 2,639,925 | 3.2 |
| 2065 | 158,604 | 141,959 | 254,900 | 10,342 | 9,947 | 3,096,314 | 3.2 |
| 2070 | 183,008 | 164,205 | 294,100 | 10,539 | 10,160 | 3,648,770 | 3.4 |
| 2080 | 243,502 | 219,059 | 391,300 | 11,106 | 10,699 | 5,120,600 | 3.5 |
| 2090 | 324,241 | 291,943 | 520,900 | 11,705 | 11,270 | 7,187,118 | 3.4 |
| 2100 | 431,955 | 389,190 | 693,300 | 12,213 | 11,760 | 9,993,162 | 3.3 |
|
Table 66 footnotes
|
|||||||
B.6 Investment Assumptions
The total assets of the CPP at the end of any given year throughout the projection period are determined by adding the total assets at the end of the previous year to the projected investment income and contribution revenues of the given year, and then subtracting the projected benefits and operating expenses of the given year.
B.6.1 Net Assets as at 31 December 2021
The actual value of the base CPP assets on a market-value accrual basis as at 31 December 2021 was $544 billion. This is the sum of the CPP Account ($108 million) and the assets invested by the CPPIB ($540 billion) for a total of $540 billion, before being adjusted by the amounts receivable minus amounts payable.
The actual value of the additional CPP assets on a market-value accrual basis as at 31 December 2021 was $11 billion. This is the sum of the Additional CPP Account ($19 million) and the assets invested by CPPIB ($11 billion) for a total of $11 billion before being adjusted by the amounts receivable minus amounts payable.
The CPP Account and Additional CPP Account were established in respect of the base Plan and additional Plan to record the contributions, interest, pensions, other benefits, and operating expenses. It also records the amounts transferred to and received from the CPPIB. The receivables include the contributions due but not yet deposited into the CPP Account, benefit overpayments, and net transfers between the CPP and the QPP for dual contributors. The amounts payable include operating expenses, pensions and other benefits, as well as amounts due to the Canada Revenue Agency (CRA). Benefit and operating expenditures are described in detail in sections B.7 and B.8, respectively of this appendix.
Table 67 reconciles the assets of the base CPP and additional CPP as at 31 December 2021.
| blank | Base CPP | Additional CPP |
|---|---|---|
| CPP Account | 108 | 19 |
| Assets Invested by CPPIB | 539,682 | 10,693 |
| Subtotal CPP Account and Invested Assets by CPPIB | 539,790 | 10,713 |
| Plus Amounts Receivable | ||
|
Contributions
|
4,241 | 335 |
|
Benefit Overpayments
|
105 | 8 |
|
Net Transfers Due from QPP
|
105 | 8 |
| Minus Amounts Payable | 517 | 19 |
| Net CPP Assets | 543,725 | 11,045 |
B.6.2 Investment Strategy and Two-Pool Structure
The CPPIB invests funds according to its own investment policies. For the purpose of this 31st CPP Actuarial Report, the CPP invested assets have been grouped into three broad categories:
- Equities, consisting of public and private equities;
- Fixed income securities, consisting of nominal fixed income (marketable bonds and non-marketable bonds), credit, and cash; and
- Real assets.
The foundation of the CPPIB’s investment strategy is a two-asset portfolio called the “reference portfolio”. This portfolio sets how much risk the CPPIB is willing to take in accordance with its mandate. The reference portfolio comprises a global equity benchmark and a Canadian government nominal bonds benchmark. The higher the equity share, the higher the associated risk.
Recognizing the distinct natures of the base and additional CPP, the CPPIB Board approved two different reference portfolios applicable for each component of the Plan. The reference portfolio applicable to the base CPP as at 31 December 2021 is maintained at 85% global equity and 15% Canadian government nominal bonds, whereas, the reference portfolio applicable to the additional CPP as at 31 December 2021 consists of 55% global equity and 45% Canadian government nominal bonds. In the previous report, the reference portfolio for the additional CPP stood at 50% global equity and 50% Canadian government nominal bonds.
In order to invest the base and additional CPP funds according to their respective reference portfolios, the CPPIB designed a two-pool investment structure. The base CPP’s actual assets as of 31 December 2021 constitute the Core pool and are invested according to the base CPP’s investment policy. The additional CPP assets are invested in two pools: the Core pool and the Supplementary pool. The Supplementary pool solely comprises fixed income securities and credit. The share of the additional CPP’s assets invested in each of the Core and Supplementary pools is determined such that the overall level of risk of the additional CPP is consistent with its reference portfolio. Chart 12 presents a schematic of the two-pool investment structure for the CPP invested assets.
Chart 12 Illustrative Two-Pool Investment Structure of the CPPIB
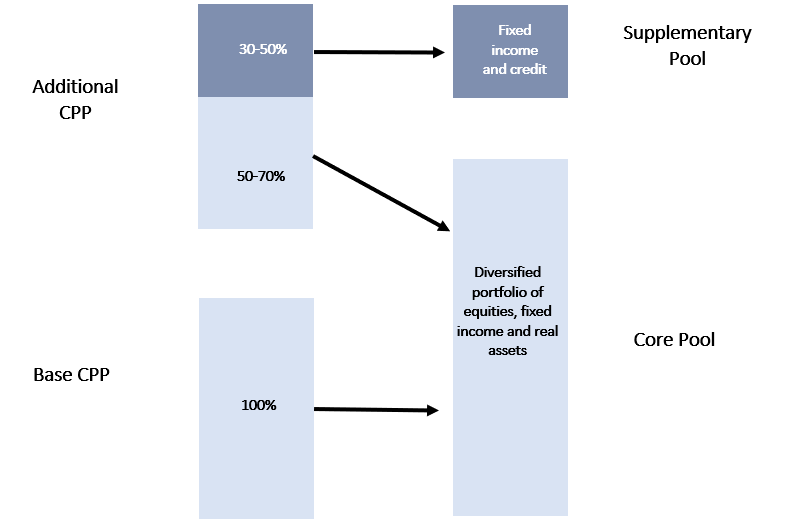
Text description: Chart 12 Illustrative Two-Pool Investment Structure of the CPPIB
Flow chart showing a schematic of the two-pool investment structure for the CPP invested assets.
On the top left, for the additional CPP, two stacked boxes represent a proportion of 50 to 70% for the bottom box and a proportion of 30 to 50% for the top box. The top box points to another box representing 100% fixed income and designated as the Supplementary Pool. The bottom box is pointing to another box representing a diversified portfolio of equities, fixed income and real assets, together designated as the Core Pool.
On the bottom left, for the base CPP, one box represents a proportion of 100%. That box points to the box designated as the Core Pool.
The CPPIB diversifies its holdings and thus sources of returns, while respecting the risk level of its reference portfolios. As a result, the base and additional CPP assets are invested in several types of assets. The portfolios capturing that diversification are called the strategic portfolios. The CPPIB uses the strategic portfolios to express its long-term goal for allocating assets by asset classes and geographic regions. In its Fiscal 2021 Annual Report, the CPPIB signaled its intention to continue increasing the CPP Fund’s exposure to emerging markets as part of their 2025 strategyFootnote 12. This intention is reflected in all assumptions presented in this section.
As at 31 December 2021, the asset mix of the base CPP consisted of 55% equities, 23% fixed income securities, and 22% real assets, while the asset mix of the additional CPP consisted of 36% equities, 50% fixed income, and 14% real assets. Table 68 further categorizes the actual assets under the CPPIB management into the asset classes identified at the beginning of this section, which correspond to the strategic portfolios’ asset classes.
| Plan | Equity | Fixed Income Securities | Real Assets | ||||
|---|---|---|---|---|---|---|---|
| Public Equities | Private Equities | Marketable Bonds | Non-Marketable Bonds | Credit | CashTable 68 footnote 1 | ||
| Base | 29 | 26 | 19 | 4 | 16 | (16) | 22 |
| Additional | 19 | 17 | 50 | 0 | 10 | (10) | 15 |
|
Table 68 footnotes
|
|||||||
B.6.3 Investment Income
In general, investment income from a given asset within a portfolio is the product of the market value of that asset and its projected nominal rate of return (which is obtained by adding the applicable projected real rate of return, as described in section B.6.4 below, to the projected inflation rate).
The investment income of the CPP is based on the assumed real rate of return applicable to each type of asset, projected inflation, and the projected asset mix and cash flows. In addition, the assumed real rate of return at the portfolio level includes an allowance for rebalancing and diversification (discussed in section B.6.5). Investment income is also adjusted downward to recognize investment expenses (discussed in section B.6.6).
B.6.4 Real Rates of Return
Real rates of return are required for the projection of revenue arising from investment income. They are assumed for each year of the projection period and for each of the main asset classes in which CPP assets are invested. All real rates of return described in this section are shown before reduction for assumed investment expenses.
The real rates of return were developed by looking at historical returns (expressed in Canadian dollars) and adjusting the returns upward or downward to reflect expectations that differ from the past. Both public market data and customized benchmarks prepared by the CPPIB were used to analyze the historical experience.
Future currency variations will impact the real rates of return over the projection period, creating gains and losses. However, as the projection period is over 75 years, these gains and losses are expected to offset each other over time. Thus, it is assumed that currency variations will not have an impact on the real rates of return.
The escalation of the conflict in Ukraine has had significant impacts on financial markets. In an effort to control rising inflation stemming from the COVID-19 pandemic and excarcerbated by the esclatation of the conflict in Ukraine, the Bank of Canada has increased its benchmark interest rate by 225 basis points so far in 2022 (as of July 13, 2022), which has impacted returns on fixed income investments. In addition, stock market indices in the first half of 2022 have decreased significantly across geographies and sectors.
This report considers the escalation of the conflict in Ukraine a subsequent event, and the assumed rates of return have been adjusted accordingly. More specifically, for 2022, the assumed nominal return is -9.0% for the base CPP and -7.7% for the additional CPP. In real terms, this translates into 2022 assumed returns of -15.9% and -14.6% for the base CPP and additional CPP respectively. These returns reflect actual CPPIB results up to 30 June 2022, and continued uncertainty for the remainder of the year. In addition, fixed income returns beyond 2022 are based on a revised interest rate path that reflects the significant rate hikes that occurred in the first half of 2022.
B.6.4.1 Fixed Income Securities
As at 31 December 2021, the CPPIB had 23% of the CPP portfolio invested in fixed income securities, split between nominal fixed income, credit, and cash. Nominal fixed income in the Core pool can be further divided into a non-marketable bond portfolio composed of bonds with various terms to maturity, representing loans made to the provinces, and a marketable bond portfolio consisting of domestic federal and provincial bonds and foreign sovereign bonds. Starting 1 January 2019, the CPPIB started investing part of the additional CPP’s contributions in a Supplementary pool composed of fixed income securities and credit.
Canadian Fixed Income
The new money rate is the nominal yield on 10-year-plus Government of Canada bonds and is set for each year in the projection period. The real yield on 10-year-plus federal bonds is equal to the new money rate less the assumed rate of inflation.The real yield on long-term Canadian federal bonds as at 31 December 2021 is about -1.68% and is assumed to gradually increase to 2.0% by 2033 and remain at that level.
The real yields for long-term provincial bonds, as well as for federal and provincial bonds of shorter maturities (mid and short), are based on the real yield on long-term federal bonds adjusted based on historical spreads over the last 20 years. The initial spreads over the real yield on federal long-term bonds are based on spreads prevailing as at 31 December 2021 and reflect the current economic environment. Since the long-term federal bond yield is assumed to increase between 2022 and 2033 and only stabilize at the end of 2033, bond returns are lower for the first ten years of the projection.
For the Core pool, the yields are determined in relation to yields for Canadian federal universe bonds. The yield for Canadian federal universe bonds is assumed to be represented by a diversified portfolio of Canadian federal bonds. Using the federal long-, mid- and short-term yields developed above, weighted by the Canadian Fixed Income Universe Index market values as at 31 December 2021, the average maturity is set at 8.0 years for Canadian federal universe bonds, and the resulting ultimate real return is 1.3%.
Non-Marketable Bond Portfolio and Rollover Rates (Loans to Provinces, Core Pool)
The non-marketable bond portfolio at the end of 2021 represented 4% of all CPP assets. The provinces are allowed to roll over at maturity for a further 20-year term any bonds that were purchased prior to the 1997 CPP amendments (that came into effect on 1 January 1998). In lieu of exercising their statutory rollover right, an agreement between the provinces and the CPPIB permits each province to repay a bond and contract a replacement bond or bonds for a term of at least five years, with a total principal amount not exceeding the principal amount of the maturing bond and total successive terms of not more than 30 years. During the 20-year period 2002 to 2021, 89% of provincial bonds available for rollover were rolled over at or before maturity. The rollover proportion increases to 100% when considering the five-year period from 2017 to 2021. Using this rollover experience, it is assumed that the rollover rate will be 99% for 2022 and thereafter. The last non-marketable bond is expected to mature in 2049.
On the basis of the average short-, medium-, and long-term experience of the spread between the annual yields on federal and provincial bonds, the current outlook of the economy, and data on rollovers since 2000, a spread over the federal long-term yield was determined for each province. The initial spreads on rollover bonds are set at the actual market spreads at the end of 2021 for provincial bonds issued by the given province. The ultimate spreads, applicable from 2033 onward, are set at the average spreads of provincial bonds issued by a given province during the period 2000 to 2021, excluding the global financial crisis of 2008 and 2009. The weighted long-term average spread for all provinces is approximately 70 basis points.Therefore, an ultimate annual real yield of approximately 2.7% for provincial rollover bonds is assumed for 2033 and thereafter.
The real rate of return of the non-marketable bond portfolio is calculated by taking into consideration any coupon payments made throughout the year, as well as the change in the market value of the portfolio due to changes in the assumed yield rates and in the term to maturity of each bond. Coupons paid and redemption values of bonds at maturity are assumed to be reinvested in the marketable bond portfolio.
Marketable Bond Portfolio (Core Pool)
As the non-marketable bond portfolio matures over the next three decades, it is assumed that the proceeds will be invested in marketable bonds and that the marketable bond portfolio will consist mainly of foreign sovereign bonds (developed market and emerging market). The composition of developed market and emerging market bonds in the portfolio is consistent with information provided by the CPPIB. Since the last report (30th CPP Actuarial Report), it is assumed that corporate bond holdings of the CPPIB are part of the credit asset class (discussed in the subsequent section).
The returns for developed market sovereign bonds are derived from a blend of projected sovereign yields for the Euro Zone, the United States and the United Kingdom. This is obtained by adding a negative spread of 20 basis points to the projected yields of Canadian federal universe bonds. The ultimate real return for the developed market sovereign bonds is assumed to be 1.1%.
The yield for emerging sovereign market bonds is assumed to correspond to a blend of projected local currency long-term yields for the emerging economies of Brazil, China, India, Indonesia, and Mexico. This is expected to be 160 basis points higher than the yield on Canadian federal universe bonds, resulting in an ultimate return for the emerging market sovereign bond portfolio of 2.9%.
The assumed ultimate real rate of return of the Core pool marketable bond portfolio is 1.3% before investment expenses. The real rates of return of the Core pool marketable bond portfolio are expected to be lower over the first few projection years due to the projected increase in yields.
Marketable Bond Portfolio (Supplementary Pool)
The Supplementary pool is expected to be composed mainly of Canadian fixed income securities and credit, such that the mix of Core pool and Supplementary pool assets provides the desired risk profile for the additional CPP. For the purpose of this report, the Canadian fixed income securities are assumed to be represented by a portfolio of Canadian federal and provincial bonds in varying proportions.
The initial asset mix of this portfolio is estimated from the CPPIB 31 December 2021 financial statements. It is assumed that the CPPIB will purchase a variety of federal and provincial bonds in proportions consistent with their investment strategy. It is thus assumed that the bond mix applicable for 2022 and thereafter will be the same as the mix as at 31 December 2021 and will be composed of 70% federal and 30% provincial bonds.
The assumed average maturities of federal and provincial bonds are estimated based on the CPPIB holdings as at 31 December 2021 and are assumed to remain constant throughout the projection period. The average maturity is set at 9.4 years for supplementary federal bonds and 14.8 years for supplementary provincial bonds.
The ultimate real rate of return for the supplementary marketable bonds is assumed to be 1.8%. Similar to the Core pool marketable bonds portfolio, the real rates of return of the Supplementary pool are expected to be lower over the first few projection years due to the projected increase in yields.
Credit (Core and Supplementary)
The credit asset class includes investments in corporate bonds, private debt, and private real estate debt. In the previous report, the Supplementary pool consisted only of Canadian fixed income securities. However, the CPPIB has since introduced credit in the Supplementary pool. At the end of 2021, the CPPIB had approximately 16% of the base CPP and 10% of the additional CPP net assets invested in this asset class.
For the purpose of this report, the expected real rate of return on credit is assumed to correspond to the return on a diversified portfolio of corporate bonds, adjusted to reflect the risk characteristics of the CPPIB’s actual holdings. Credit in the Supplementary pool only consists of Canadian securities, while the Core pool credit includes exposure to other developed markets as well as emerging markets. Furthermore, the Core pool credit includes an assumed increasing exposure to both developed markets and emerging markets.
For the Core pool, the returns on the diversified portfolio of corporate bonds are derived from projected U.S. corporate yields. The ultimate real rate of return for the Core pool credit asset class is assumed to be 2.2% from 2033 onward. The assumed ultimate real rate of return for the Supplementary pool credit asset class is 2.9%. This return is higher than the Core pool to reflect that it consists only of Canadian securities as well as its different risk characteristics.
The assumed real rates of return of the credit portfolio for both the Core pool and the Supplementary pool are expected to be lower over the first few projection years due to the projected increase in yields.
CPP Account, Additional CPP Account, and Cash
The CPP Account is established in the accounts of Canada to record the transactions of the base Plan and amounts transferred to and from the CPPIB in respect of the base Plan. The balance in the CPP Account serves as a flow-through account with investments solely in short-term securities.
Similar to the CPP Account, the Additional CPP Account is a flow-through account that records the transactions of the additional Plan and amounts transferred to and from the CPPIB in respect of the additional Plan.
The CPPIB uses financial leverage as part of its investment strategy. Financial leverage in the context of portfolio management consists of borrowing money to invest in other assets with the expectation that the borrowing cost will be less than the return on the assets purchased. As at 31 December 2021, CPPIB’s external debt and financing liability represented about 16% of its net assets. Similar to the previous actuarial report, there is an explicit recognition in this report for the amount of leverage in the asset allocation. The borrowing cost related to financial leverage is assumed to correspond to the expected real rate of return on cash. The initial assumed real rate of return on cash is low, reflecting the current environment, with a smooth transition assumed from the initial to the ultimate assumption of 0.3% for 2033 and thereafter.
B.6.4.2 Equity
The CPP assets invested in equities are currently diversified among public and private equities and across various geographies. In the derivation of the real rates of return for these equity investments, consideration was given to expected dividend yields, expected growth of the underlying economies and long-term risk premiums for various factors such as size, maturity and geography. No distinction is made between realized and unrealized capital gains. Custom equity benchmarks provided by the CPPIB were considered in the derivation of real rates of return for equities.
Public equities
Public equities comprise developed and emerging markets publicly traded equities. Various elements contribute to the return on an equity investment such as earnings, income paid to shareholders, fluctuation in valuation, and exchange rates for non-Canadian investments.
Over long periods, valuation changes and currency fluctuations are not expected to contribute significantly to the return on broad equity markets. Therefore, it is assumed that expectations regarding income and earnings growth are sufficient to project future equity returns, with additional adjustments for the riskiness of small caps and emerging market equities. The income derived from dividend and buyback yields on developed market equities is expected to be 3.1%. This is based on historical income from dividend and buyback yields for developed market equities, adjusted to reflect current and expected economic environments. Growth in earnings is proxied using GDP growth per capita; and it is expected to add 0.9% to the overall real return of developed market equities. Hence, the expected return on developed market equities is 4.0%. Because of their additional risk, small caps are assumed to yield an additional 0.2% and emerging market equities are assumed to yield an additional 1.0%.
The ultimate real rate of return on public equities is projected to be 4.2%. The short-term path is lower due to the subsequent event described in section 2.3.
Private equities
Compared to public equities, private equities are less liquid and their management necessitates a higher degree of expertise. Private equities may also provide institutional investors the opportunity to invest at an earlier stage in the development of a company, which translates into additional risk and greater potential returns. As a result, the return structure of private equities is different compared to public equities. Private equities are expected to generate an additional return in exchange for the additional illiquidity risk and complex management.
In general, private investments have grown in popularity over the last decade. This increase in demand has not necessarily been matched by an increase in supply. Valuations are high and a significant amount of capital is waiting to be allocated at attractive prices. As more and more investors around the globe compete for private placements, it is assumed that the additional return from investing in private equities compared to public equities will be lower than historical levels.
The ultimate real rate of return on private equities is projected to be 5.1%. The short-term path is lower due to the subsequent event described in section 2.3.
B.6.4.3 Real Assets
Real assets such as real estate, infrastructure, and natural resources are considered to share some characteristics of fixed income and equities, as well as to have some unique features related to their specific nature (such as illiquidity). The expected real rate of return on real assets is thus influenced by these features. It is also assumed that real CPP assets will ultimately include a greater exposure to emerging markets than as at 31 December 2021.
The ultimate real rate of return on real assets is projected to be 4.1%. The short-term path is lower due to the subsequent event described in section 2.3.
B.6.4.4 Summary of Real Rates of Return by Asset Type
Table 69 summarizes the assumed real rates of return by asset type throughout the projection period, before reduction for investment expenses. The rates of return by asset type are presented without any allowance for rebalancing and diversification (discussed in section B.6.5). The rebalancing and diversification allowance is presented at the portfolio level in Table 70 for the base CPP and Table 71 for the additional CPP.
It is important to recognize that rates of return for most assets are volatile. The real rates of return presented in Table 69 represent expected trends and assumed levels of returns to be obtained over a long horizon. As such, limited emphasis should be put on individual projection years.
This report considers the escalation of the conflict in Ukraine a subsequent event, and the assumed rates of return have been adjusted accordingly as presented in section B.6.4. Given that the assumed rate of return for 2022 was not developed by asset class, year 2022 is not shown in the tables below.
| Year | Equity | Fixed Income Securities | Real Assets | ||||||
|---|---|---|---|---|---|---|---|---|---|
| Public Equities | Private Equities | Marketable Bonds (Core) | Marketable Bonds (Supplementary) | Non-Marketable Bonds | Credit (Core) | Credit (Supplementary) | Cash | ||
| 2023 | 3.0 | 3.9 | 0.1 | (0.4) | 1.0 | 0.9 | (0.6) | (0.3) | 2.4 |
| 2024 | 3.6 | 4.6 | 0.1 | 0.2 | 1.0 | 1.1 | 0.7 | (0.3) | 2.9 |
| 2025 | 3.9 | 4.9 | 0.2 | 0.5 | 1.4 | 1.3 | 1.4 | (0.3) | 3.3 |
| 2026 | 4.2 | 5.2 | 0.2 | 0.7 | 1.8 | 1.5 | 1.9 | (0.3) | 3.5 |
| 2027 | 4.2 | 5.2 | 0.3 | 0.8 | 1.8 | 1.6 | 2.0 | (0.2) | 3.6 |
| 2028 | 4.2 | 5.2 | 0.4 | 0.9 | 1.8 | 1.7 | 2.1 | (0.1) | 3.6 |
| 2029 | 4.2 | 5.2 | 0.5 | 0.9 | 1.9 | 1.7 | 2.1 | (0.1) | 3.6 |
| 2030 | 4.2 | 5.2 | 0.6 | 1.0 | 2.0 | 1.8 | 2.2 | 0.0 | 3.7 |
| 2035 | 4.2 | 5.1 | 1.3 | 1.8 | 2.0 | 2.2 | 2.9 | 0.3 | 4.1 |
| 2040 | 4.2 | 5.1 | 1.3 | 1.8 | 1.1 | 2.2 | 2.9 | 0.3 | 4.1 |
| 2045+ | 4.2 | 5.1 | 1.3 | 1.8 | 2.2 | 2.2 | 2.9 | 0.3 | 4.1 |
B.6.5 Asset Allocation and Expected Portfolio Rates of Return
This report provides projections of over 75 years. As such, long-term asset mix assumptions are required for the base and additional CPP. As the base CPP continues to mature and the Plan’s participants age, the ratio of contributors to beneficiaries is projected to decrease, and the proportion of investment income required to pay benefits is projected to increase. Starting in 2026, it is expected that contributions will be insufficient to cover all expenditures, and that a portion of investment income will be required to cover expenditures. The portion of investment income required to pay expenditures will be small at the beginning but is projected to increase over time, reaching about 16% in 2050 and 34% by 2070. Therefore, the importance of reliable investment income will grow over time for the base CPP.
The additional CPP will rely even more on investment income due to the difference in its financing approach compared to the base CPP. Deviations in the additional CPP portfolio’s rate of return are expected to greatly impact the sustainability of that plan as a result of the higher reliance of the additional Plan on investment income. Given the long horizon of this report, it is important to consider how much investment risk is appropriate for the base and additional CPP over the long term, bearing in mind how each part is affected by investment returns.
For both the base and additional Plans, the expected portfolio real rates of return include an allowance for rebalancing and diversification of the assets. This allowance takes into account the beneficial effect of periodically rebalancing a diversified portfolio to maintain the desired relative assets allocation by asset classes. In other words, the expected return of a portfolio is greater than the weighted average of the expected return of its components. The size of the allowance depends on the asset mix and the risk characteristics of the individual assets.
Base CPP
It is assumed that the level of risk of the base CPP investment portfolio will decrease over time. Consistent with the CPPIB’s current reference portfolio for the base CPP, a level of risk equivalent to that of a reference portfolio of about 85% equity and 15% fixed income is assumed initially. The volatility of the initial base CPP portfolio, as measured by the one-year standard deviation of return, is estimated at 12.4% annuallyFootnote 13. Thereafter, it is projected that the volatility of the rate of return of the Core pool will gradually decrease to 10.7% in 2033, equivalent to a hypothetical reference portfolio of about 70% equity and 30% fixed income. The decrease in portfolio risk is assumed to progress in three-year steps reflecting the triennial reviews of the CPP. Hence, the asset mix is projected to progress from its initial allocation (base CPP assets as at 31 December 2021) to a portfolio constructed to match the level of risk of a hypothetical reference portfolio of 70% equity and 30% fixed income. Table 70 presents the projected asset allocation, the expected volatility of the portfolio, and the expected portfolio real rate of return before investment expenses for the base Plan.
Due to the assumed three-year steps progression of the portfolio risk, the total portfolio real rate of return does not move in a linear fashion. The expected real rate of return of the portfolio tends to decrease each time the level of risk of the portfolio decreases towards its ultimate level. However, expected returns on fixed income are expected to gradually increase up to their ultimate values once yields stabilize. The net effect is a general increasing trend in the total portfolio real rate of return with periodic adjustments corresponding to triennial portfolio risk recalibration.
| Year | Equity | Fixed Income Securities | Real Assets | Expected Long-term Volatility | Total Real Rate of Return Table 70 Footnote 1,Table 70 Footnote 2 | ||||
|---|---|---|---|---|---|---|---|---|---|
| Public Equities | Private Equities | Marketable Bonds | Non-Marketable Bonds | Credit | Cash | ||||
| 2022 | 29 | 26 | 19 | 4 | 16 | (16) | 22 | 12.4 | (15.74) |
| 2023 | 29 | 26 | 20 | 3 | 16 | (16) | 22 | 12.2 | 3.09 |
| 2024 | 29 | 26 | 20 | 3 | 16 | (16) | 22 | 12.1 | 3.61 |
| 2025 | 28 | 25 | 20 | 2 | 16 | (13) | 22 | 11.7 | 3.83 |
| 2026 | 28 | 25 | 20 | 2 | 16 | (13) | 22 | 11.6 | 4.08 |
| 2027 | 28 | 25 | 20 | 2 | 16 | (13) | 22 | 11.6 | 4.11 |
| 2028 | 27 | 25 | 19 | 2 | 16 | (10) | 21 | 11.3 | 4.05 |
| 2029 | 27 | 25 | 19 | 1 | 16 | (10) | 21 | 11.3 | 4.08 |
| 2030 | 27 | 25 | 20 | 1 | 16 | (10) | 21 | 11.3 | 4.10 |
| 2035 | 25 | 25 | 18 | 1 | 16 | (5) | 20 | 10.7 | 4.21 |
| 2040 | 25 | 25 | 19 | 0 | 16 | (5) | 20 | 10.7 | 4.20 |
| 2045+ | 25 | 25 | 19 | 0 | 16 | (5) | 20 | 10.7 | 4.20 |
|
Table 70 footnotes
|
|||||||||
Additional CPP
The additional CPP assets are invested in both the Core and Supplementary pools. Table 71 presents the projected asset allocation, the expected volatility, and the expected real rate of return before investment expenses for the additional CPP.
It is expected that the Supplementary pool will transition by 2026 from being purely invested in Canadian marketable bonds to being about 48% invested in marketable bonds, with the remainder being allocated to Credit.
The share of the additional CPP assets invested in each pool is selected in order to match the desired level of risk of the additional CPP’s reference portfolio. To increase the total portfolio risk of the additional CPP, a higher allocation to the Core pool would be selected. Similarly, a lower allocation to the Core pool would lower the total portfolio risk for the additional Plan.
It is assumed that the level of risk of the additional CPP will be kept constant over the projection period at a level corresponding to the current CPPIB reference portfolio of about 55% equity and 45% fixed income with an estimated volatility of 7.7%. During the first few projection years, this level of risk is obtained by investing 65% of the additional CPP assets in the Core pool and 35% in the Supplementary pool. Because the level of risk of the Core pool’s investment returns is expected to decrease gradually, a higher share of the additional CPP assets is expected to be allocated to the Core pool to maintain the additional CPP portfolio volatility at 7.7%. It is assumed that 68% of the additional CPP assets will be allocated to the Core pool for the year 2033 and thereafter.
| Year | Core Pool Allocation | Supplementary Pool Allocation | Expected Long-term Volatility Table 71 footnote 2,Table 71 footnote 3 | Total Real Rate of Return | |
|---|---|---|---|---|---|
| Marketable Bonds | CreditTable 71 footnote 1 | ||||
| 2022 | 65 | 35 | 0 | 7.7 | (14.50) |
| 2023 | 65 | 30 | 4 | 7.8 | 2.00 |
| 2024 | 65 | 26 | 9 | 8.0 | 2.61 |
| 2025 | 66 | 21 | 13 | 8.0 | 2.94 |
| 2030 | 66 | 16 | 17 | 7.9 | 3.41 |
| 2035 | 68 | 15 | 17 | 7.7 | 3.75 |
| 2040 | 68 | 15 | 17 | 7.7 | 3.75 |
| 2045+ | 68 | 15 | 17 | 7.7 | 3.75 |
|
Table 71 footnotes
|
|||||
B.6.6 Investment Expenses
CPPIB’s total investment expenses consist of operating expenses, transaction costs, and investment management fees. Over the last three calendar years, the total investment expenses have averaged 0.90% of total assets, ranging from 0.84% to 1.10%. The majority of those investment expenses were incurred through active management decisions. Considering how total investment expenses evolved over the last decade, it is assumed that, going forward, total investment expenses of the CPPIB will be 0.95% of the Core Pool.
Active management is implemented to generate excess returns (after reduction for active management expenses). Thus, the additional returns from a successful active management program should equal at least the cost incurred to pursue active management. For the purpose of this report and in accordance with the Canadian Institute of Actuaries’ guidance regarding the determination of best-estimate discount rates, it is assumed that the additional returns generated by active management will equal the additional expenses incurred from active management. These expenses are assumed to be the difference between total investment expenses and the assumed expenses that would be incurred for the passive management of the portfolios.
It is assumed that investment expenses of 0.18% would be incurred to passively manage the Core pool. Since the base CPP assets are invested only in the Core pool, the assumed investment expenses from passive management of 0.18% represents $994 million and $1,592 million in years 2022 and 2033, respectively, for the base CPP. The investment expenses for active management for the base CPP are therefore 0.77%.
The passive management investment expenses from the Supplementary pool are assumed to be 0.03%. It is further assumed, that there are no active management expenses associated with the Supplementary pool. The investment expenses of the additional CPP will depend on how much of the fund is invested in the Core pool versus the Supplementary pool, and the investment expenses associated with each of these pools. For years 2035 and thereafter, it is assumed that 68% of additional Plan assets are invested in the Core pool and 32% are invested in the Supplementary pool. Such allocation results in total investment expenses for the additional Plan being 0.65% and the overall investment expenses from passive management related to the additional CPP being 0.13%. The investment expenses for active management for the additional CPP are therefore 0.52%.
The assumed investment expenses from passive management of additional CPP are $21 million and $360 million in year 2022 and 2033, respectively.
The following section shows the overall rate of return on CPP assets net of investment expenses for the base and additional CPP.
B.6.7 Overall Rate of Return on Base and Additional CPP Assets
The best-estimate rates of return on total assets for each of the base and additional Plans are derived from the weighted average assumed rates of return on all types of assets, using the assumed asset mix proportions as weights. The best-estimate rates of return are further adjusted to incorporate an allocation for rebalancing and diversification. In addition, the best-estimate rates of return are increased to reflect additional returns due to active management and reduced to reflect all investment expenses. The projected nominal returns are the sum of the assumed levels of inflation and real returns. The ultimate net rates of return are shown in Table 72.
| Base CPP | Additional CPP | |||
|---|---|---|---|---|
| Nominal | Real | Nominal | Real | |
| Weighted Average Rate of Return (before investment expenses) |
6.20 | 4.20 | 5.75 | 3.75 |
| Additional Rate of Return due to Active Management | 0.77 | 0.77 | 0.52 | 0.52 |
| Total Weighted Average Rates of Return before Investment Expenses | 6.97 | 4.97 | 6.27 | 4.27 |
| Expected Investment Expenses | ||||
| Expenses due to Passive Management | (0.18) | (0.18) | (0.13) | (0.13) |
| Additional Expenses due to Active Management | (0.77) | (0.77) | (0.52) | (0.52) |
| Total Expected Investment Expenses | (0.95) | (0.95) | (0.65) | (0.65) |
| Ultimate Rate of Return after Investment Expenses | 6.02 | 4.02 | 5.62 | 3.62 |
The resulting nominal and real rates of return for selected projection years are shown in Table 73. The projected average annual real rate of return over the next 75 years is 3.69% for the base CPP and 3.27% for the additional CPP.
| Year | Base CPP | Additional CPP | ||
|---|---|---|---|---|
| Nominal | Real | Nominal | Real | |
| 2022 | (9.02) | (15.92) | (7.72) | (14.62) |
| 2023 | 5.91 | 2.91 | 4.87 | 1.87 |
| 2024 | 5.93 | 3.43 | 4.98 | 2.48 |
| 2025 | 5.90 | 3.65 | 5.06 | 2.81 |
| 2026 | 5.90 | 3.90 | 5.14 | 3.14 |
| 2040+ | 6.02 | 4.02 | 5.62 | 3.62 |
| Average over: | ||||
| 2023-2027 | 5.91 | 3.56 | 5.05 | 2.70 |
| 2023-2032 Table 73 Footnote 1 | 5.90 | 3.73 | 5.15 | 2.98 |
| 2022-2096 Table 73 Footnote 1 | 5.79 | 3.69 | 5.37 | 3.27 |
|
Table 73 footnotes
|
||||
The 75-year (2022-2096) average annual real rate of return on investments are lower for both components of the CPP compared to the 30th CPP Actuarial Report averages for the same period. This decrease is mainly due to lower expected returns on fixed income over that period compared to the previous valuation and the impact of the subsequent event.
For the base CPP, the 75-year (2022-2096) average annual rate of return on investments is 31 basis points lower than the 4% average (over the same period) of the previous triennial valuation.
For the additional CPP, the 75-year (2022-2096) average annual rate of return on investments decreases by 23 basis points compared to the average of 3.5% (over the same period) of the 30th CPP Actuarial Report.
B.7 Benefit Expenditures
B.7.1 Benefits Payable as at 31 December 2021 and Projected Benefits
The number of base CPP beneficiaries in pay and average monthly benefits payable as at 31 December 2021 are shown in Table 74.
| Benefit Type | Number of Beneficiaries in pay | Average Monthly Benefit | ||
|---|---|---|---|---|
| Males in thousands |
Females in thousands |
Males ($) |
Females ($) |
|
| Retirement | 2,709 | 2,961 | 711 | 518 |
| Post-retirement Benefit | 926 | 779 | 47 | 39 |
| Survivor | ||||
| - Aged less than 65 | 49 | 158 | 399 | 464 |
| - Aged 65 and over | 189 | 767 | 134 | 364 |
| Disability Table 74 Footnote 1 | 145 | 183 | 1,012 | 937 |
| Benefit Type | Number of Beneficiaries in pay | Average Monthly Benefit | ||
| Males and Females in thousands |
Males and Females ($) |
|||
| Orphan | 59 | 258 | ||
| Disabled Contributor’s Child | 76 | 258 | ||
|
Table 74 footnotes
|
||||
The approach used in this report to project future benefits paid is based on deterministic projections using grouped data. The amount of benefit expenditures is determined by taking into account the administrative agreement established in section 58(1) and 58(2) of the Canada Pension Plan Regulations between the CPP and the QPP for beneficiaries who had contributed to both plans.
The retirement, survivor, disability, and children’s benefit expenditures for each year following the year of benefit take-up for a given age, sex, and cohort is computed as the product of:
- benefit expenditures in the year of take-up (described later in this appendix);
- the probability of survival from the age at benefit take-up to the attained age;
- the rules regarding combined retirement and survivor benefits and combined disability and survivor benefits, as applicable; and
- the Pension Index, which recognizes the annual inflation adjustment to benefits each 1 January following benefit emergence.
The amounts of the benefits payable during any given calendar year are then obtained by simply summing the annual expenditures applicable for the year as described above, in respect of all age and sex cohorts having emerged in the given and all previous calendar years. The projected number of beneficiaries and amounts of benefit expenditures for the base and additional Plans are shown in various tables in the Results sections 5 and 6 of this report.
All projections of base CPP benefits start from the year 1966 instead of the beginning of the current projection period (2022). This is done for the following reasons:
- The valuation methodology can be validated for the historical period up to the valuation year (1966 to 2021) by comparing the projected values (contributions, benefits, beneficiaries, etc.) with actual experience. Based on this comparison, calibration factors of actual to projected historical experience are obtained which are then used for the future projections of the different types of benefit. For example, the calibration factors for retirement benefit experience for those starting their pension between ages 60 and 65 are 0.99 for males and 0.95 for females.
- The projection of benefits already in pay as at the valuation date (31 December 2021) is fully integrated with the projection of benefits emerging after that date thus ensuring full consistency between past experience and the future.
Even though the additional Plan started as of 1 January 2019, the additional Plan benefits have not started to be paid out as of 31 December 2021. As such, there are no additional benefits in pay as at the valuation date. The same calibration factors developed for the base Plan benefits are assumed to apply to the additional Plan projected benefits except in the case of the additional retirement benefits, where microsimulation was used to estimate the calibration factors. As experience develops for the additional Plan, more precise calibration factors for each type of benefit will be determined separately for that CPP component.
B.7.2 Benefit Eligibility Rates
As described in Appendix A (Summary of Plan Provisions) of this report, eligibility for benefits varies according to the type of benefit. The eligibility rules for the survivor benefit are the same as for the death benefit. The eligibility rules for base CPP benefits determine eligibility for additional CPP benefits.
Benefit eligibility rates (as a percentage of the Canada less Québec population) for retirement, disability, and death/survivor benefits are projected using regression formulae that were developed to closely reproduce historical eligibility rates observed from CPP records of earnings data provided by ESDC over the period 1966 to 2019. The projected eligibility rates take into account the applicable eligibility rules for each type of benefit, the proportion of contributors, and the length of the contributory period for existing and future earners.
The disability and survivor benefit eligibility rates developed as above must be adjusted to project the earnings-related portion of these two types of benefits. Table 75 shows the resulting eligibility rates for the various benefit types by sex and age for selected years.
The retirement eligibility rates for some ages and years are greater than 100% due to individuals who contributed to the CPP and then left the country with no further information available as to their status. Since these individuals are not counted in the population, the retirement eligibility rates can be higher than 100%.
| Year | Retirement Benefit Eligibility Rate at Age 65 |
Survivor/Death Benefit Eligibility Rate at Age 65 |
||
|---|---|---|---|---|
| Males | Females | Males | Females | |
| 2022 | 103.5 | 100.2 | 101.1 | 77.5 |
| 2023 | 103.2 | 100.2 | 101.0 | 78.4 |
| 2024 | 102.9 | 100.2 | 100.8 | 79.1 |
| 2025 | 102.6 | 100.1 | 100.6 | 79.8 |
| 2026 | 102.3 | 100.1 | 100.3 | 80.4 |
| 2027 | 101.9 | 100.0 | 100.0 | 80.9 |
| 2028 | 101.7 | 99.9 | 99.7 | 81.4 |
| 2029 | 101.3 | 99.7 | 99.4 | 81.8 |
| 2030 | 101.0 | 99.5 | 99.2 | 82.1 |
| 2035 | 100.0 | 99.0 | 98.1 | 83.5 |
| 2040 | 100.8 | 100.0 | 97.4 | 84.3 |
| 2045 | 100.7 | 100.1 | 97.0 | 85.0 |
| 2050 | 100.6 | 100.3 | 96.8 | 85.6 |
| 2055 | 102.0 | 101.6 | 96.9 | 86.2 |
| 2060 | 102.4 | 101.9 | 97.3 | 86.7 |
| 2065 | 102.2 | 101.8 | 97.6 | 87.2 |
| 2070 | 103.8 | 103.3 | 98.1 | 87.7 |
| 2080 | 103.4 | 103.1 | 98.7 | 88.3 |
| 2090 | 103.5 | 103.3 | 99.2 | 88.7 |
| 2100 | 103.9 | 103.7 | 99.6 | 89.0 |
| Year | Survivor/Death Benefit Eligibility Rate at Ages 20-64 |
Disability Benefit Eligibility Rate at Ages 20-64Table 75 B Footnote 1 |
Post-Retirement Disability Benefit Eligibility Rate at Ages 60-64Table 75 B Footnote 2 |
|||
|---|---|---|---|---|---|---|
| Males | Females | Males | Females | Males | Females | |
| 2022 | 79.9 | 70.8 | 70.7 | 64.0 | 49.8 | 42.6 |
| 2023 | 80.0 | 71.2 | 71.9 | 65.1 | 52.3 | 45.0 |
| 2024 | 81.5 | 72.3 | 73.5 | 66.7 | 54.2 | 46.6 |
| 2025 | 81.9 | 72.9 | 75.4 | 68.6 | 55.3 | 47.4 |
| 2026 | 81.7 | 73.0 | 75.8 | 69.2 | 55.4 | 47.4 |
| 2027 | 81.2 | 73.0 | 75.7 | 69.3 | 56.3 | 47.9 |
| 2028 | 81.5 | 73.4 | 76.5 | 70.1 | 56.6 | 48.1 |
| 2029 | 83.0 | 74.2 | 77.7 | 71.4 | 56.5 | 48.1 |
| 2030 | 83.4 | 74.8 | 78.1 | 72.0 | 56.6 | 48.5 |
| 2035 | 85.0 | 76.5 | 79.3 | 74.1 | 57.5 | 49.5 |
| 2040 | 86.4 | 77.8 | 80.0 | 75.3 | 58.3 | 50.6 |
| 2045 | 87.3 | 78.5 | 79.6 | 75.3 | 58.6 | 51.0 |
| 2050 | 87.9 | 78.8 | 79.3 | 75.1 | 58.5 | 51.1 |
| 2055 | 88.3 | 79.1 | 80.2 | 76.2 | 59.6 | 51.6 |
| 2060 | 88.6 | 79.4 | 80.3 | 76.4 | 59.4 | 51.6 |
| 2065 | 88.9 | 79.8 | 80.9 | 77.0 | 59.5 | 51.7 |
| 2070 | 89.1 | 80.1 | 81.2 | 77.3 | 60.0 | 52.2 |
| 2080 | 89.9 | 80.6 | 81.6 | 77.8 | 60.3 | 52.3 |
| 2090 | 90.5 | 80.9 | 81.6 | 77.8 | 60.5 | 52.6 |
| 2100 | 90.8 | 81.2 | 81.9 | 78.1 | 60.6 | 52.6 |
|
Table 75 B footnotes
|
||||||
B.7.3 Adjustments to Proportion of Contributors and Pensionable Earnings for Benefit Computation Purposes
The effect of credit-splitting of pensionable earnings between spouses or common-law partners in the event of divorce or separation is accounted for by adjusting the projected proportion of contributors and average pensionable earnings of the respective spouses or common-law partners. The average pensionable earnings used to determine the initial amounts of the retirement pensions are also adjusted to exclude the earnings of working beneficiaries. Table 76 presents the resulting adjusted proportion of contributors. The average pensionable earnings up to the YMPE and the YAMPE for benefit computation purposes appear in Table 77 and Table 78, respectively.
| Age Group | Males | Females | ||||
|---|---|---|---|---|---|---|
| 2022 | 2025 | 2050 | 2022 | 2025 | 2050 | |
| 20-24 | 80.2 | 82.9 | 85.9 | 79.6 | 82.2 | 85.9 |
| 25-29 | 88.7 | 89.4 | 93.6 | 86.6 | 87.5 | 92.8 |
| 30-34 | 91.0 | 92.1 | 93.9 | 86.3 | 87.5 | 91.0 |
| 35-39 | 90.1 | 91.9 | 93.4 | 84.0 | 86.1 | 90.4 |
| 40-44 | 90.0 | 90.0 | 91.6 | 84.0 | 85.4 | 89.7 |
| 45-49 | 87.7 | 89.3 | 90.9 | 82.9 | 84.8 | 89.2 |
| 50-54 | 85.8 | 86.9 | 88.4 | 81.4 | 83.2 | 87.6 |
| 55-59 | 78.6 | 81.0 | 83.0 | 71.9 | 74.1 | 78.5 |
| 60-64 | 62.6 | 64.6 | 67.9 | 52.6 | 54.1 | 58.2 |
| 65-69 | 28.9 | 30.4 | 33.4 | 19.5 | 20.6 | 23.6 |
| All Ages | 78.9 | 80.2 | 82.4 | 73.2 | 74.6 | 78.7 |
|
Table 76 footnotes
|
||||||
| Age Group | Males | Females | ||||
|---|---|---|---|---|---|---|
| 2022 | 2025 | 2050 | 2022 | 2025 | 2050 | |
| 20-24 | 29,068 | 31,555 | 60,907 | 24,512 | 26,716 | 52,679 |
| 25-29 | 41,471 | 45,044 | 89,793 | 37,556 | 40,882 | 83,377 |
| 30-34 | 46,306 | 50,484 | 101,218 | 40,903 | 44,725 | 91,652 |
| 35-39 | 48,215 | 52,709 | 105,966 | 42,797 | 46,944 | 96,387 |
| 40-44 | 49,618 | 54,116 | 108,886 | 44,776 | 48,989 | 100,480 |
| 45-49 | 50,149 | 54,789 | 110,120 | 45,550 | 49,898 | 102,269 |
| 50-54 | 49,978 | 54,559 | 109,262 | 45,368 | 49,618 | 101,374 |
| 55-59 | 47,957 | 52,199 | 103,786 | 42,997 | 47,120 | 95,682 |
| 60-64 | 47,768 | 51,724 | 101,320 | 42,481 | 46,357 | 93,338 |
| 65-69 | 47,674 | 52,403 | 101,551 | 41,780 | 45,879 | 91,405 |
| All Ages | 44,867 | 49,073 | 97,911 | 40,035 | 43,907 | 89,733 |
| YMPE | 64,900 | 71,200 | 145,600 | 64,900 | 71,200 | 145,600 |
|
Table 77 footnotes
|
||||||
| Age Group | Males | Females | ||||
|---|---|---|---|---|---|---|
| 2022Table 78 footnote 2 | 2025 | 2050 | 2022Table 78 footnote 2 | 2025 | 2050 | |
| 20-24 | –dash | 32,200 | 62,054 | –dash | 27,006 | 53,247 |
| 25-29 | –dash | 47,343 | 94,141 | –dash | 42,484 | 86,755 |
| 30-34 | –dash | 54,077 | 108,157 | –dash | 47,220 | 96,976 |
| 35-39 | –dash | 56,915 | 114,166 | –dash | 49,928 | 102,713 |
| 40-44 | –dash | 58,683 | 117,836 | –dash | 52,308 | 107,456 |
| 45-49 | –dash | 59,505 | 119,353 | –dash | 53,285 | 109,382 |
| 50-54 | –dash | 59,158 | 118,204 | –dash | 52,852 | 108,171 |
| 55-59 | –dash | 56,330 | 111,755 | –dash | 49,947 | 101,630 |
| 60-64 | –dash | 55,868 | 109,177 | –dash | 49,140 | 99,219 |
| 65-69 | –dash | 57,028 | 110,361 | –dash | 49,079 | 98,144 |
| All Ages | –dash | 52,673 | 104,957 | –dash | 46,417 | 95,097 |
| YAMPE | blank | 81,100 | 165,900 | blank | 81,100 | 165,900 |
|
Table 78 footnotes
|
||||||
B.7.4 Average Earnings-Related Benefits
Base CPP
To determine base CPP benefits, the valuation model first calculates an average earnings-related benefit for all individuals born in a given calendar year, for each sex, and all relevant ages. This average earnings-related benefit is dependent on four main components:
- Average pensionable earnings, adjusted for benefit computation purposes, relative to the YMPE;
- Average proportion of contributors adjusted for benefit computation purposes;
- 25% of the MPEA for the attained year; and
- the number of years in the elapsed contributory period at the attained age.
The base CPP average earnings-related benefit is then further adjusted to take into account certain provisions of the CPP statute as applicable:
- Disability exclusion: the period during which an individual received a CPP disability pension is excluded from the contributory period;
- Child-rearing provision (exclusion): the period during which an individual was caring for a child younger than age 7 is excluded from the contributory period if earnings during the child-rearing period were sufficiently low;
- Post-65 drop-out: earnings of contributors over age 65, who are not yet retirement beneficiaries, may replace earnings before age 65 if those earnings are lower;
- General drop-out provision (exclusion): 17% of the lowest earnings months up to a maximum of about 8 years may be dropped from the contributory period.
Table 79 shows the resulting projected average earnings-related benefits for the base CPP as a percentage of the maximum base CPP earnings-related benefits at ages 60 and 65 by sex and year of birth for various cohorts of contributors. The average base CPP earnings-related benefit for males at age 65 as a percentage of the maximum is about 10 to 15 percentage points lower than at age 60 due to the fact that males who take their benefit at age 65 have a longer contributory period (producing lower career average earnings) and a historical lower earnings profile than those who take an early benefit at age 60. For females, the difference between age 60 and 65 is more pronounced for older cohorts of contributors but decreases for younger cohorts.
The earnings-related benefits for males as a percentage of the maximum is expected to generally decrease over time because of the lower participation and pensionable earnings (as a proportion of the YMPE) of younger contributors in the early years of their contributory period. For females, this decline is offset by the expected higher earnings of future female cohorts. As a result, the gap between the male and female average base CPP earnings-related benefits is expected to decrease over time.
| Year of Birth | Average Earnings-Related Benefit (%) | ||||
|---|---|---|---|---|---|
| Males | Females | ||||
| Age 60 | Age 65 | Age 60 | Age 65 | ||
| 1950 | 79 | 65 | 59 | 52 | |
| 1951 | 79 | 66 | 59 | 52 | |
| 1952 | 80 | 65 | 62 | 53 | |
| 1953 | 79 | 65 | 62 | 53 | |
| 1954 | 79 | 65 | 62 | 53 | |
| 1955 | 79 | 65 | 63 | 53 | |
| 1960 | 74 | 63 | 59 | 54 | |
| 1965 | 69 | 62 | 56 | 53 | |
| 1970 | 69 | 61 | 56 | 53 | |
| 1980 | 70 | 61 | 57 | 54 | |
| 1990 | 69 | 61 | 59 | 56 | |
| 2000 | 68 | 60 | 59 | 56 | |
| 2010 | 70 | 61 | 61 | 58 | |
| 2020 | 71 | 62 | 62 | 59 | |
| 2030 | 70 | 61 | 61 | 58 | |
Additional CPP
For the additional CPP, the valuation model also calculates an average earnings-related benefit based on contributors’ highest earnings over forty years for all persons of a birth cohort for each calendar year, sex, and all relevant ages. This average earnings-related additional benefit is dependent on five main components:
- Average additional pensionable earnings, adjusted for benefit computation purposes, relative to the YMPE;
- Average proportion of contributors adjusted for benefit computation purposes;
- First additional benefit calculated as 8.33% of the MPEA to increase the overall Plan’s replacement rate to 33% of the MPEA;
- Second additional benefit calculated as 33.33% of 14% of the MPEA to increase coverage to 114% of the MPEA; and
- the fixed contributory period of 40 years.
The additional CPP average earnings-related benefit is further adjusted to take into account certain provisions of the CPP statute as applicable:
- Disability drop-in: individuals who became disabled in 2019 or later will have imputed income assigned to those disability periods; and
- Child-rearing provision (drop-in): an imputed income may be assigned to periods of caring for children younger than age 7 on or after 1 January 2019.
The average additional earnings-related benefit is used in the calculation of the total emerging additional earnings-related benefit expenditures for a given calendar year, for each sex, and all relevant ages.
Table 80 shows the resulting projected average additional earnings-related benefits as a percentage of the maximum additional earnings-related benefits at ages 60 and 65 by sex and year of birth for various cohorts of contributors. The maximum additional benefit is the maximum benefit for both parts of the additional CPP, that is, below the YMPE, and from the YMPE up to YAMPE combined together.
The average additional earnings-related benefit for males at age 65 as a percentage of the maximum is about 2 to 5 percentage points higher than at age 60 due to the longer contributory periods, which is beneficial in the context of the additional CPP’s fixed forty years contributory period. For females, the difference between ages 60 and 65 is less pronounced.
The additional earnings-related benefits as a percentage of the maximum are expected to increase over time for both males and females, since contributory periods are projected to increase relative to the fixed forty years. For later birth cohorts, it is projected that the gap between male and female average earnings-related benefits will stay about the same over time.
| Year of Birth | Average Earnings-Related Benefit (%) | ||||
|---|---|---|---|---|---|
| Males | Females | ||||
| Age 60 | Age 65 | Age 60 | Age 65 | ||
| 1965 | 5 | 9 | 4 | 7 | |
| 1970 | 10 | 15 | 8 | 12 | |
| 1980 | 24 | 27 | 20 | 23 | |
| 1985 | 30 | 34 | 26 | 28 | |
| 1990 | 36 | 40 | 31 | 34 | |
| 2000 | 43 | 46 | 38 | 40 | |
| 2010 | 44 | 47 | 39 | 41 | |
| 2020 | 45 | 47 | 40 | 42 | |
| 2030 | 44 | 46 | 39 | 42 | |
B.7.5 Retirement Pension Expenditures
Retirement expenditures result from retirement pensions paid under the base and additional CPP. The retirement pensions paid under both components of the CPP are earnings-related. The total retirement pension payable is the sum of the base and additional pension amounts.
Retirement Pension
New retirement expenditures are determined for each age from 60 to 70, sex, and calendar year of emergence starting from 1967. Total new retirement benefits are calculated as the product of:
- the population;
- the retirement pension eligibility rate;
- the retirement pension take-up rate;
- the actuarial adjustment factor for early or late pension take-up; and
- the average earnings-related benefit previously described.
Retirement Benefit Take-up Rates
The projected retirement benefit take-up rates (or more simply retirement take-up rates) by age, sex, and calendar year are determined by taking into account the assumed future work patterns of earners aged 60 and over and the corresponding CPP experience from 1967 to 2021. The retirement benefit take-up rates correspond to the ratio of the number of emerging retirement beneficiaries to the product of the population and the retirement benefit eligibility rate (i.e. the ratio of the number of new retirement beneficiaries to the eligible population) for each age, sex, and calendar year. The same retirement take-up rates for the base CPP apply to the additional CPP.
The unreduced pension age under the Canada Pension Plan is 65. Since 1987, a person can choose to receive a reduced retirement pension as early as age 60 (as well as an increased pension after age 65). This provision has had the overall effect of lowering the average age at pension take-up. In 1986, the average age at pension take-up was 65.2 compared to an average age of 62.7 over the decade ending in 2019.
Chart 13 presents the evolution of the retirement take-up rates at age 60 for males and females. A significant increase was observed in the retirement take-up rates at age 60 for the cohort reaching age 60 in 2012. This observed increase may have resulted from two provisions of the Economic Recovery Act (stimulus) of 2009:
- The work cessation test to receive the pension early (prior to age 65) was removed in 2012, so that starting that year, individuals no longer needed to lower their earnings to take an early CPP retirement pension.
- Greater reductions in early retirement pensions were scheduled to be phased in over a five-year period, starting in 2012.
After 2012, the age 60 retirement take-up rates continually decreased to below their pre-2012 levels as the higher actuarial adjustments were phased in, the effect of the removal of the work cessation test diminished, and individuals stayed longer in the workforce.
For cohorts reaching age 60 in 2019 (before the pandemic), the retirement take-up rates were 27.8% for males and 30.3% for females. For cohorts reaching age 60 in 2021, the retirement take-up rates were 23.3% for males and 25.0% for females. The take-up rate for males is the lowest one since 1989, while the take-up rate for females is a record low since the flexible retirement age provision was first introduced in 1987. At this time, it is not clear to what extent the COVID-19 pandemic contributed to the significant reduction in retirement take-up rates at age 60 during the years 2020 and 2021. The decreasing trend will be monitored for the next CPP valuation.
The assumption reflects the pre-pandemic trend in retirement take-up rates at age 60, while giving partial credibility to the years 2020 and 2021. For cohorts reaching age 60 in 2022 and thereafter, the retirement take-up rates are assumed to be 26.0% for males and 28.0% for females.
Chart 13 Historical and Projected Retirement Pension Take-up Rates at age 60
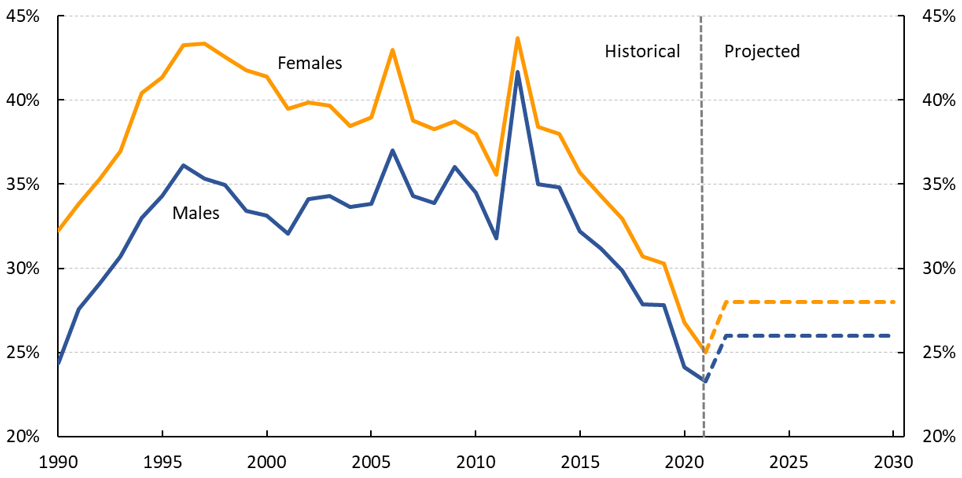
Text description: Chart 13 Historical and Projected Retirement Pension Take-up Rates at age 60
Line chart showing the historical and projected retirement pension take-up rates at age 60. Y axis represents the retirement pension take-up rate as a percentage of the eligible population. X axis represents the year.
The retirement pension take-up rate at age 60 for females is 32.3% in 1990. The rate increases up to the late 1990s and then fluctuates after until reaching its highest point of 43.7% in 2012. After 2012, the take-up rate at age 60 for females decreases to 25.0% in 2021, and then is projected to increase to a value of 28.0% in 2022 and remain at that value thereafter.
The retirement pension take-up rate at age 60 for males is 24.4% in 1990. The rate increases up to the late 1990s and then fluctuates after until reaching its highest point of 41.7% in 2012. After 2012, the take-up rate at age 60 for males decreases to 23.3% in 2021, and then is projected to increase to a value of 26% in 2022 and remain at that value thereafter.
| Year | Males 60 | Females 60 |
|---|---|---|
| 1990 | 0.243766 | 0.322525 |
| 1991 | 0.275862 | 0.338505 |
| 1992 | 0.291053 | 0.353016 |
| 1993 | 0.307136 | 0.36952 |
| 1994 | 0.329724 | 0.404172 |
| 1995 | 0.343137 | 0.413221 |
| 1996 | 0.36131 | 0.432472 |
| 1997 | 0.353395 | 0.433623 |
| 1998 | 0.349399 | 0.425408 |
| 1999 | 0.333976 | 0.417646 |
| 2000 | 0.331271 | 0.413824 |
| 2001 | 0.320354 | 0.394778 |
| 2002 | 0.34118 | 0.398662 |
| 2003 | 0.342829 | 0.396501 |
| 2004 | 0.336264 | 0.384346 |
| 2005 | 0.338237 | 0.389611 |
| 2006 | 0.369932 | 0.429737 |
| 2007 | 0.34302 | 0.387851 |
| 2008 | 0.338727 | 0.38264 |
| 2009 | 0.360338 | 0.387229 |
| 2010 | 0.34491 | 0.379814 |
| 2011 | 0.317761 | 0.355662 |
| 2012 | 0.416749 | 0.436935 |
| 2013 | 0.350146 | 0.383998 |
| 2014 | 0.348219 | 0.379861 |
| 2015 | 0.321975 | 0.35694 |
| 2016 | 0.311824 | 0.343006 |
| 2017 | 0.298717 | 0.329253 |
| 2018 | 0.278402 | 0.306882 |
| 2019 | 0.278135 | 0.302803 |
| 2020 | 0.241407 | 0.267816 |
| 2021 | 0.232708 | 0.249912 |
| Year | Males 60 | Females 60 |
|---|---|---|
| 2022 | 0.26 | 0.28 |
| 2023 | 0.26 | 0.28 |
| 2024 | 0.26 | 0.28 |
| 2025 | 0.26 | 0.28 |
| 2026 | 0.26 | 0.28 |
| 2027 | 0.26 | 0.28 |
| 2028 | 0.26 | 0.28 |
| 2029 | 0.26 | 0.28 |
| 2030 | 0.26 | 0.28 |
The retirement take-up rates for ages 61 to 64 for the year 2022 and thereafter are determined using the observed averages over recent years 2018-2019. The retirement take-up rates for ages 66 to 69 are projected over the next 10 years using the increasing trends observed over the 10-year period ending in 2019. To reflect the waiving of the requirement for an application for the retirement pension upon reaching age 70, as provided under the Budget Implementation Act, 2019, No. 1, the retirement take-up rates for age 70 are set to equal to 4.0% for males and 3.5% for females, which are the last known historical values for the year 2021.
The retirement take-up rates at age 65 are derived such that the sum of the retirement rates for each cohort is 100%. The sum of 100% is gradually achieved over the first five years of the projection. The resulting rates at age 65 are determined to be 42.5% for males and 43.8% for females in 2031 and thereafter. Table 81 shows the projected retirement take-up rates by age for both males and females.
The assumed ultimate retirement take-up rates result in projected average ages at retirement pension take-up in 2031 of 63.6 for males and 63.4 for females. This compares to average retirement take-up ages of 62.4 and 62.3 years, respectively for males and females in 2012.
| Age | Cohort aged 65 in 2031+ | |
|---|---|---|
| Males | Females | |
| 60 | 26.0 | 28.0 |
| 61 | 4.7 | 4.8 |
| 62 | 4.0 | 4.2 |
| 63 | 3.6 | 3.6 |
| 64 | 7.1 | 6.7 |
| 65 | 42.5 | 43.8 |
| 66 | 2.9 | 2.1 |
| 67 | 2.0 | 1.4 |
| 68 | 1.5 | 1.0 |
| 69 | 1.7 | 0.9 |
| 70 | 4.0 | 3.5 |
| Total | 100.0 | 100.0 |
Projected New Retirement Pensions
Table 82 shows the projected number of new retirement beneficiaries and their projected average base and additional monthly retirement pensions by sex. New additional average retirement pensions are quite low in the early years due to the lower benefit accrual rates during the phase-in period and the few years of additional contributions. These averages are projected to grow rapidly as the number of years of contributions to the additional CPP increases.
| Year | Base CPP | |||||
|---|---|---|---|---|---|---|
| Number of New Retirement Beneficiaries | Average Monthly Retirement Pension | |||||
| Males | Females | Total | Males ($) |
Females ($) |
Total ($) |
|
| 2022 | 179,051 | 181,119 | 360,170 | 744 | 593 | 668 |
| 2023 | 190,941 | 193,832 | 384,774 | 773 | 621 | 697 |
| 2024 | 195,355 | 200,057 | 395,412 | 802 | 649 | 725 |
| 2025 | 204,347 | 208,675 | 413,022 | 834 | 681 | 756 |
| 2026 | 204,084 | 210,746 | 414,831 | 865 | 711 | 787 |
| 2027 | 195,547 | 202,045 | 397,592 | 897 | 735 | 815 |
| 2028 | 196,698 | 202,818 | 399,516 | 919 | 756 | 836 |
| 2029 | 195,566 | 202,715 | 398,281 | 941 | 778 | 858 |
| 2030 | 192,967 | 200,130 | 393,097 | 963 | 799 | 879 |
| 2035 | 182,557 | 192,934 | 375,491 | 1,099 | 922 | 1,008 |
| 2040 | 185,449 | 198,778 | 384,227 | 1,266 | 1,072 | 1,165 |
| 2045 | 206,080 | 218,087 | 424,168 | 1,448 | 1,244 | 1,343 |
| 2050 | 234,334 | 241,894 | 476,228 | 1,670 | 1,455 | 1,560 |
| 2055 | 258,529 | 262,238 | 520,767 | 1,932 | 1,710 | 1,820 |
| 2060 | 269,786 | 272,020 | 541,806 | 2,232 | 1,996 | 2,114 |
| 2065 | 259,152 | 267,220 | 526,372 | 2,598 | 2,337 | 2,466 |
| 2070 | 247,691 | 260,959 | 508,650 | 3,008 | 2,721 | 2,861 |
| 2080 | 257,293 | 269,855 | 527,147 | 3,996 | 3,639 | 3,813 |
| 2090 | 283,788 | 295,047 | 578,835 | 5,278 | 4,826 | 5,048 |
| 2100 | 294,913 | 308,468 | 603,381 | 7,060 | 6,475 | 6,761 |
| Year | Additional CPP | |||||
|---|---|---|---|---|---|---|
| Number of New Retirement Beneficiaries | Average Monthly Retirement Pension | |||||
| Males | Females | Total | Males ($) |
Females ($) |
Total ($) |
|
| 2022 | 131,098 | 120,128 | 251,227 | 6 | 5 | 5 |
| 2023 | 143,845 | 132,832 | 276,678 | 9 | 8 | 9 |
| 2024 | 151,968 | 142,164 | 294,133 | 14 | 12 | 13 |
| 2025 | 161,712 | 151,567 | 313,279 | 22 | 18 | 20 |
| 2026 | 164,093 | 156,088 | 320,181 | 30 | 25 | 28 |
| 2027 | 159,945 | 153,334 | 313,279 | 39 | 32 | 36 |
| 2028 | 163,024 | 156,761 | 319,785 | 50 | 40 | 45 |
| 2029 | 164,373 | 159,932 | 324,304 | 60 | 48 | 54 |
| 2030 | 168,472 | 166,565 | 335,037 | 69 | 55 | 62 |
| 2035 | 181,737 | 192,250 | 373,987 | 134 | 109 | 121 |
| 2040 | 185,449 | 198,778 | 384,227 | 218 | 180 | 198 |
| 2045 | 206,080 | 218,087 | 424,168 | 325 | 271 | 298 |
| 2050 | 234,334 | 241,894 | 476,228 | 459 | 385 | 421 |
| 2055 | 258,529 | 262,238 | 520,767 | 626 | 527 | 576 |
| 2060 | 269,786 | 272,020 | 541,806 | 809 | 685 | 747 |
| 2065 | 259,152 | 267,220 | 526,372 | 969 | 825 | 896 |
| 2070 | 247,691 | 260,959 | 508,650 | 1,122 | 965 | 1,041 |
| 2080 | 257,293 | 269,855 | 527,147 | 1,488 | 1,296 | 1,390 |
| 2090 | 283,788 | 295,047 | 578,835 | 1,962 | 1,722 | 1,840 |
| 2100 | 294,913 | 308,468 | 603,381 | 2,630 | 2,315 | 2,469 |
Retirement Beneficiaries Mortality
Projections of retirement pensions in pay require applying survival probabilities to retirement beneficiaries. The mortality rates of CPP retirement beneficiaries used in the projections vary by age, sex, calendar year, and level of emerging pension. The mortality rates were developed based on CPP retirement beneficiaries’ mortality experience for the year 2019 and the mortality improvement assumptions for the general population in this report. The projected mortality rates of retirement beneficiaries are then adjusted by level of the emerging base CPP pensions. The resulting projected mortality rates and life expectancies of retirement beneficiaries are shown in Table 83, Table 84, and Table 85.
| Age | Males | Females | ||||||
|---|---|---|---|---|---|---|---|---|
| 2022 | 2025 | 2050 | 2075 | 2022 | 2025 | 2050 | 2075 | |
| 60 | 5.3 | 5.0 | 3.8 | 3.1 | 3.0 | 2.8 | 2.2 | 1.8 |
| 65 | 11.5 | 10.8 | 8.5 | 6.9 | 6.6 | 6.3 | 5.0 | 4.1 |
| 70 | 16.8 | 15.7 | 12.3 | 10.0 | 10.8 | 10.2 | 8.2 | 6.7 |
| 75 | 26.6 | 24.8 | 19.5 | 16.0 | 17.8 | 16.8 | 13.6 | 11.1 |
| 80 | 45.6 | 42.6 | 33.6 | 27.5 | 31.6 | 30.0 | 24.3 | 19.9 |
| 85 | 80.9 | 75.0 | 58.4 | 47.8 | 57.5 | 54.1 | 43.1 | 35.3 |
| 90 | 145.8 | 136.7 | 112.0 | 95.8 | 108.5 | 102.1 | 84.2 | 72.1 |
| Age | Males | Females | ||||||
|---|---|---|---|---|---|---|---|---|
| 2022 | 2025 | 2050 | 2075 | 2022 | 2025 | 2050 | 2075 | |
| 60 | 25.6 | 25.9 | 27.4 | 28.9 | 28.6 | 28.8 | 30.2 | 31.5 |
| 65 | 21.1 | 21.4 | 22.9 | 24.2 | 23.9 | 24.0 | 25.4 | 26.7 |
| 70 | 17.0 | 17.3 | 18.6 | 19.9 | 19.4 | 19.6 | 20.9 | 22.1 |
| 75 | 13.2 | 13.4 | 14.6 | 15.7 | 15.3 | 15.4 | 16.6 | 17.7 |
| 80 | 9.7 | 9.9 | 11.0 | 11.9 | 11.5 | 11.7 | 12.6 | 13.6 |
| 85 | 6.8 | 7.0 | 7.8 | 8.5 | 8.2 | 8.4 | 9.2 | 9.9 |
| 90 | 4.5 | 4.7 | 5.2 | 5.7 | 5.6 | 5.7 | 6.2 | 6.7 |
|
Table 84 footnotes
|
||||||||
| Age | CPP Level of Pension as % of Maximum | |||||||
|---|---|---|---|---|---|---|---|---|
| Males | Females | |||||||
| < 37.5% | 37.5-75% | 75-95% | 95-100% | < 37.5% | 37.5-75% | 75-95% | 95-100% | |
| 60 | 24.3 | 24.9 | 25.5 | 26.7 | 27.8 | 28.7 | 29.2 | 29.7 |
| 65 | 20.3 | 20.5 | 21.0 | 22.0 | 23.3 | 23.9 | 24.4 | 24.8 |
| 70 | 16.6 | 16.6 | 16.9 | 17.6 | 19.1 | 19.5 | 19.8 | 20.1 |
| 75 | 12.9 | 12.9 | 13.0 | 13.5 | 15.1 | 15.3 | 15.6 | 15.7 |
| 80 | 9.6 | 9.6 | 9.6 | 9.9 | 11.4 | 11.5 | 11.7 | 11.7 |
| 85 | 6.7 | 6.7 | 6.7 | 6.9 | 8.2 | 8.2 | 8.3 | 8.3 |
| 90 | 4.5 | 4.5 | 4.5 | 4.5 | 5.5 | 5.5 | 5.6 | 5.6 |
|
Table 85 footnotes
|
||||||||
B.7.6 Post-Retirement Benefit Expenditures
Post-retirement benefits are paid to retirement beneficiaries who continue to work and contribute to the Plan. Post-retirement benefits are payable under both the base and additional CPP.
Working retirement beneficiaries younger than 65 are required along with their employers to contribute, whereas contributions are voluntary once reaching age 65 (up to age 69). Employers of those working beneficiaries opting to contribute are required to also contribute. The post-retirement contributions paid in a year are applied toward providing post-retirement benefits in the following years. Post-retirement benefits are described in more detail in Appendix A – Summary of Plan Provisions.
Table 86 presents the assumed share of CPP retirement beneficiaries who work and contribute to the CPP in the year of and years following pension take-up, by age and sex.
In the year of retirement, contributions are first applied toward maximizing the base and additional retirement pensions, with remaining contributions then applied toward a post-retirement benefit. The contributions to the additional Plan increase over the phase-in period both due to the increase in the contribution rate and the introduction of the YAMPE over two years. This affects the proportion of working beneficiaries who contribute in the year of pension take-up. This proportion is assumed to remain constant once the phase-in of the additional CPP is complete in 2025.
The assumption for the proportion of CPP retirement beneficiaries who are contributors after the year of retirement pension take-up is kept constant for the entire projection period.
The figures in Table 86 reflect that not all working beneficiaries contribute to the CPP, due to the following:
- having earnings less than the YBE, and
- opting out of contributing between the ages 65 and 69.
| Age | Year of Retirement Pension Take-Up (2025+) | After Year of Retirement Pension Take-Up | ||
|---|---|---|---|---|
| Males | Females | Males | Females | |
| 60 | 40 | 30 | 0 | 0 |
| 61 | 50 | 40 | 77 | 64 |
| 62 | 45 | 35 | 54 | 42 |
| 63 | 50 | 35 | 49 | 40 |
| 64 | 50 | 40 | 43 | 35 |
| 65 | 24 | 19 | 41 | 21 |
| 66 | 47 | 43 | 27 | 22 |
| 67 | 47 | 43 | 20 | 16 |
| 68 | 43 | 38 | 16 | 11 |
| 69 | 38 | 33 | 11 | 9 |
In order to project the contributions of working beneficiaries, assumptions are required with respect to their average contributory earnings (i.e., average earnings between the YBE and YAMPE on which contributions are made). For both males and females, the average contributory earnings of working beneficiaries for years after the year of retirement pension take-up are assumed to be between 20% and 35% lower than the contributory earnings of contributors who are not beneficiaries, depending on the age and sex. The resulting average annual contributory earnings of working beneficiaries up to the YMPE and YAMPE are presented respectively in Table 87 and Table 88.
| Year | Below Age 65 | Age 65 and Above | ||
|---|---|---|---|---|
| Males | Females | Males | Females | |
| 2022 | 36,718 | 28,463 | 34,926 | 26,948 |
| 2023 | 38,004 | 29,588 | 36,138 | 27,847 |
| 2024 | 39,545 | 31,014 | 37,486 | 28,819 |
| 2025 | 40,706 | 32,211 | 38,623 | 29,720 |
| 2026 | 41,898 | 33,461 | 39,849 | 30,710 |
| 2027 | 43,071 | 34,721 | 41,036 | 31,749 |
| 2028 | 44,188 | 35,841 | 42,141 | 32,720 |
| 2029 | 45,362 | 36,983 | 43,249 | 33,743 |
| 2030 | 46,540 | 38,054 | 44,317 | 34,790 |
| 2035 | 51,893 | 42,560 | 49,689 | 39,864 |
| 2040 | 59,479 | 49,055 | 57,017 | 46,125 |
| 2045 | 69,351 | 57,831 | 66,474 | 54,358 |
| 2050 | 81,821 | 69,141 | 78,087 | 64,608 |
| 2055 | 95,960 | 81,826 | 91,134 | 76,120 |
| 2060 | 111,756 | 95,934 | 105,846 | 88,972 |
| 2065 | 128,416 | 110,603 | 121,703 | 102,778 |
| 2070 | 146,194 | 125,868 | 138,656 | 117,423 |
| 2080 | 193,798 | 167,269 | 184,596 | 157,062 |
| 2090 | 259,634 | 224,522 | 247,153 | 210,821 |
| 2100 | 347,318 | 300,829 | 329,630 | 281,786 |
| Year Footnote 1 | Below Age 65 | Age 65 and Above | ||
|---|---|---|---|---|
| Males | Females | Males | Females | |
| 2024 | 40,811 | 31,449 | 38,894 | 29,321 |
| 2025 | 43,256 | 33,098 | 41,484 | 30,784 |
| 2026 | 44,543 | 34,416 | 42,814 | 31,829 |
| 2027 | 45,801 | 35,735 | 44,093 | 32,918 |
| 2028 | 46,973 | 36,887 | 45,267 | 33,921 |
| 2029 | 48,196 | 38,048 | 46,440 | 34,978 |
| 2030 | 49,432 | 39,131 | 47,588 | 36,054 |
| 2035 | 54,796 | 43,449 | 53,166 | 41,051 |
| 2040 | 62,702 | 50,000 | 60,929 | 47,438 |
| 2045 | 73,171 | 59,066 | 71,042 | 55,976 |
| 2050 | 86,586 | 70,985 | 83,567 | 66,779 |
| 2055 | 101,778 | 84,360 | 97,629 | 78,924 |
| 2060 | 118,675 | 99,168 | 113,428 | 92,443 |
| 2065 | 136,293 | 114,317 | 130,333 | 106,781 |
| 2070 | 154,750 | 129,677 | 148,233 | 121,754 |
| 2080 | 204,948 | 172,249 | 197,188 | 162,820 |
| 2090 | 274,699 | 231,467 | 264,042 | 218,733 |
| 2100 | 367,707 | 310,536 | 352,211 | 292,582 |
|
Table 88 footnotes
|
||||
Around 457,000 working beneficiaries started to contribute in 2012, generating about an extra $1.1 billion in contributions that year. The number of working beneficiaries who contribute grew to about 619,000 in 2019 with corresponding contributions representing about $1.8 billion.
The corresponding post-retirement benefits started to be payable the year after contributions were made. In 2013, post-retirement benefits totaled about $63 million based on contributions made in 2012. In 2020, post-retirement benefits paid in respect of the base Plan amounted to $775 million based on contributions made in 2019 and earlier.
Table 89 shows the projected number of working beneficiaries with their contributions and resulting post-retirement benefits by year. Contributions and benefits are split between the base and additional CPP. Total contributions from working beneficiaries are projected to be about $2.1 billion in 2022 and $7.2 billion in 2050. Total post-retirement benefits payable are projected to be about $1.1 billion in 2022 and $8.7 billion in 2050.
The projected number of working beneficiaries who contribute, their earnings, and contributions are reflected in all other tables in this report that present contributors, earnings, and contributions projections, unless otherwise indicated. Similarly, the post-retirement benefits are presented in combination with retirement benefits as total retirement expenditures in all other tables in this report where expenditures are shown by type of benefit, unless otherwise indicated.
| Year | Number of Contributing Working Beneficiaries (thousands) |
Base CPP | Additional CPP | ||
|---|---|---|---|---|---|
| Contributions ($ million) |
Post-Retirement Benefits ($ million) |
Contributions ($ million) |
Post-Retirement Benefits ($ million) |
||
| 2022 | 596 | 1,836 | 1,026 | 278 | 39 |
| 2023 | 620 | 1,974 | 1,217 | 399 | 72 |
| 2024 | 645 | 2,135 | 1,385 | 481 | 122 |
| 2025 | 662 | 2,259 | 1,563 | 561 | 174 |
| 2026 | 673 | 2,375 | 1,751 | 590 | 226 |
| 2027 | 675 | 2,457 | 1,923 | 611 | 287 |
| 2028 | 672 | 2,514 | 2,100 | 625 | 357 |
| 2029 | 668 | 2,569 | 2,280 | 638 | 431 |
| 2030 | 662 | 2,616 | 2,463 | 649 | 507 |
| 2035 | 629 | 2,803 | 3,373 | 683 | 904 |
| 2040 | 647 | 3,311 | 4,259 | 802 | 1,326 |
| 2045 | 717 | 4,293 | 5,178 | 1,042 | 1,800 |
| 2050 | 814 | 5,758 | 6,308 | 1,411 | 2,371 |
| 2055 | 903 | 7,495 | 7,842 | 1,850 | 3,078 |
| 2060 | 963 | 9,311 | 9,910 | 2,308 | 3,961 |
| 2065 | 951 | 10,592 | 12,483 | 2,622 | 5,027 |
| 2070 | 925 | 11,748 | 15,328 | 2,884 | 6,191 |
| 2080 | 980 | 16,587 | 22,022 | 4,063 | 8,900 |
| 2090 | 1,089 | 24,714 | 31,032 | 6,063 | 12,526 |
| 2100 | 1,157 | 35,077 | 45,143 | 8,621 | 18,240 |
B.7.7 Disability Benefit Expenditures
Disability expenditures result from disability benefits paid under the base and additional CPP.
Under the base CPP, disability benefits consist of the disability pension and the post-retirement disability benefit. The base CPP disability pension consists of both a flat-rate and earnings-related benefit. The post-retirement disability benefit is equal to the flat-rate benefit.
Under the additional CPP, disability benefits consist only of the additional disability pension, which is an earnings-related benefit. Eligibility for the additional disability pension follows from eligibility for the base disability pension. There is no post-retirement disability benefit payable under the additional CPP.
Disability Pension
New disability pension expenditures are determined by age and sex for each year starting in 1970 as the product of:
- the population;
- the disability eligibility rate;
- the disability incidence rate; and
- the average annual amount of the benefit.
The value of the emerging disability earnings-related benefit by age and sex is equal to the sum of 75% of the average retirement earnings-related benefits for the base and additional Plans.
Disability Incidence Rates
Chart 14 shows the historical disability incidence rates for the CPP disability pension, and Table 90 provides the assumed ultimate disability incidence rates for the disability pension (base and additional CPP) and post-retirement disability benefit (base CPP).
Chart 14 Historical Disability Incidence Rates (per 1000 eligible)
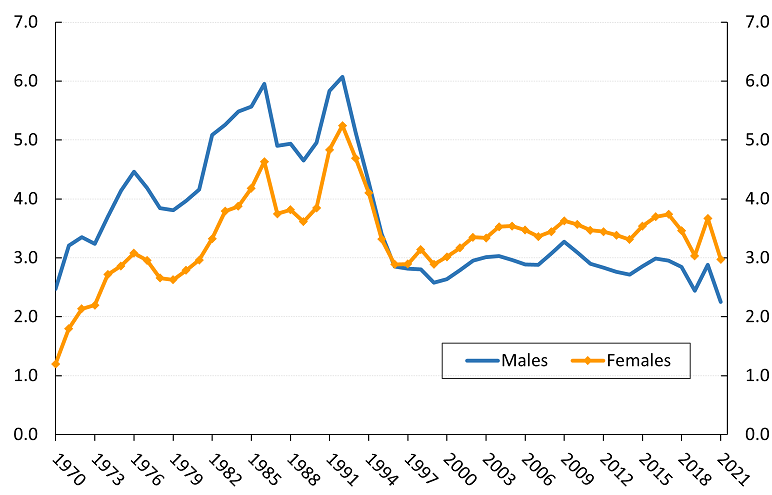
Text description: Chart 14 Historical Disability Incidence Rates
Line chart showing the historical disability incidence rates (the number of new CPP disability beneficiaries per 1,000 eligible contributors). Y axis represents the rate per 1,000 eligible. X axis represents the year.
The disability incidence rate for males is 2.5 new beneficiaries per 1,000 eligible contributors in 1970. The rate for males has periods of growth and decline but increases overall to reach a highest point of 6.1 in 1992, then decreases to 2.6 in the late 1990s, and is relatively stable until 2019 where it falls to 2.4 in 2019, jumps to 2.9 in 2020 and falls again to 2.3 in 2021.
The disability incidence rate for females is 1.2 new beneficiaries per 1,000 eligible contributors in 1970. The rate for females has periods of growth and decline but increases overall to reach a highest point of 5.2 in 1992, then decreases to 2.9 in the late 1990s, and is relatively stable but increasing gradually to 3.7 in 2017 after which it falls for two years until 2019 at 3.0, jumps to 3.7 in 2020 and falls again to 3.0 in 2021.
| Year | Males | Females |
|---|---|---|
| 1970 | 2.47294 | 1.19985 |
| 1971 | 3.21089 | 1.80040 |
| 1972 | 3.34817 | 2.13500 |
| 1973 | 3.23620 | 2.19756 |
| 1974 | 3.69568 | 2.71651 |
| 1975 | 4.13938 | 2.86182 |
| 1976 | 4.46440 | 3.07809 |
| 1977 | 4.18956 | 2.95584 |
| 1978 | 3.84185 | 2.65640 |
| 1979 | 3.80766 | 2.62844 |
| 1980 | 3.96774 | 2.78758 |
| 1981 | 4.16031 | 2.96275 |
| 1982 | 5.08757 | 3.32568 |
| 1983 | 5.25782 | 3.79337 |
| 1984 | 5.48328 | 3.87466 |
| 1985 | 5.56932 | 4.18091 |
| 1986 | 5.95339 | 4.63365 |
| 1987 | 4.90149 | 3.74703 |
| 1988 | 4.93810 | 3.81586 |
| 1989 | 4.65193 | 3.61362 |
| 1990 | 4.95554 | 3.84819 |
| 1991 | 5.83551 | 4.83508 |
| 1992 | 6.06891 | 5.24338 |
| 1993 | 5.12232 | 4.68764 |
| 1994 | 4.28117 | 4.10534 |
| 1995 | 3.40507 | 3.31757 |
| 1996 | 2.85365 | 2.88972 |
| 1997 | 2.81681 | 2.89619 |
| 1998 | 2.80492 | 3.14168 |
| 1999 | 2.58026 | 2.88965 |
| 2000 | 2.63988 | 3.01676 |
| 2001 | 2.79099 | 3.16763 |
| 2002 | 2.95357 | 3.34835 |
| 2003 | 3.01203 | 3.33761 |
| 2004 | 3.02854 | 3.52712 |
| 2005 | 2.96730 | 3.54005 |
| 2006 | 2.88756 | 3.47142 |
| 2007 | 2.88289 | 3.36265 |
| 2008 | 3.07255 | 3.44457 |
| 2009 | 3.27442 | 3.62730 |
| 2010 | 3.08740 | 3.56541 |
| 2011 | 2.89828 | 3.46932 |
| 2012 | 2.83310 | 3.44310 |
| 2013 | 2.76495 | 3.38459 |
| 2014 | 2.71584 | 3.31083 |
| 2015 | 2.85718 | 3.54062 |
| 2016 | 2.98942 | 3.69774 |
| 2017 | 2.95329 | 3.73915 |
| 2018 | 2.84808 | 3.46335 |
| 2019 | 2.44206 | 3.03424 |
| 2020 | 2.88081 | 3.67112 |
| 2021 | 2.25262 | 2.97512 |
It can be seen from Chart 14 that the incidence of new CPP disability cases (i.e. the number of new cases as a proportion of the eligible population) generally increased from 1970 to the early 1990s. The annual rate of change in incidence rates was particularly acute between 1989 and the recession of the early 1990s. After reaching a peak in 1992, disability incidence rates then declined rapidly during the 1990s. With the exception of more recent years (2019-2021), the disability incidence rates have remained relatively stable since the late 1990s.
The decline after 1992 reflects the economic recovery that occurred following the 1990-91 recession. As well, beginning in 1994, the CPP administration initiated a range of measures designed to effectively manage the growing pressure on the disability program.
More recent experience over the last three years has been very volatile, and the disability incidence rates for 2021 stand at levels that are historically low (2.25 per thousand for males and 2.98 per thousand for females). The volatility observed over the years 2019 to 2021 is attributable to administrative and COVID-19 related factors. It is not expected that such volatility will continue and, therefore, the last three years of data were not considered in the development of the ultimate disability incidence rate assumptions.
Based on the above and experience over the period 2007 to 2018, the aggregate (all ages combined using the 2021 eligible population for weights) incidence rates for the disability pension are expected to increase from 2021 to 2026. Thereafter, they are projected to remain constant at the values reached in 2026 of 2.90 and 3.60 per thousand eligible males and females, respectively. These projected aggregate rates are then distributed by age in accordance with the 2021 eligible population for each sex.
Post-retirement Disability Incidence Rates
The base CPP post-retirement disability benefit came into effect in 2019 and applies only to early retirement beneficiaries (before age 65) who become disabled.
For this 31st CPP Actuarial Report, initial benefit data regarding post-retirement disability benefits were available, as provided by ESDC. The assumed post-retirement disability incidence rates by age and sex were derived based on the data for years 2019 and 2020 along with historical records of earnings data of early retirement beneficiaries.
It is projected that, in 2026, the overall disability incidence rates in respect of the post-retirement disability benefit for early retirement beneficiaries will be 10.08 per 1,000 eligible males and 9.06 per 1,000 eligible females. As more experience data regarding post-retirement disability benefits become available, the assumptions for the incidence rates will be revised accordingly for future CPP actuarial reports.
The post-retirement disability incidence rates, which equal the ratio of the number of new post-retirement disability beneficiaries by age and sex to the respective eligible populations, are shown in Table 90.
| Age | Disability Pension | Post-retirement Disability Benefit | ||
|---|---|---|---|---|
| Males | Females | Males | Females | |
| 25 | 0.23 | 0.26 | –dash | –dash |
| 30 | 0.50 | 0.66 | –dash | –dash |
| 35 | 0.97 | 1.54 | –dash | –dash |
| 40 | 1.52 | 2.36 | –dash | –dash |
| 45 | 2.18 | 3.24 | –dash | –dash |
| 50 | 3.27 | 4.52 | –dash | –dash |
| 55 | 6.31 | 7.67 | –dash | –dash |
| 60 | 9.23 | 9.56 | –dash | –dash |
| 61 | 9.24 | 9.40 | 12.93 | 11.27 |
| 62 | 9.24 | 9.23 | 8.32 | 7.38 |
| 63 | 9.24 | 9.07 | 8.32 | 7.26 |
| 64 | 9.25 | 8.91 | 12.94 | 12.48 |
| All Ages | 2.90 | 3.60 | 10.08 | 9.06 |
|
Table 90 footnotes
|
||||
Projected New Disability Benefits
Table 91 shows the projected number of new disability beneficiaries for the disability pension and post-retirement disability benefit, and Table 92 shows the projected average new base and additional disability pensions and the post-retirement disability benefits by sex and year.
| Base CPP | |||||||||
|---|---|---|---|---|---|---|---|---|---|
| Number of Beneficiaries | |||||||||
| Year | Disability Pension | Post-retirement Disability Benefit | ALL Disability Benefits | ||||||
| Males | Females | Total | Males | Females | Total | Males | Females | Total | |
| 2022 | 15,135 | 17,791 | 32,926 | 1,041 | 913 | 1,953 | 16,176 | 18,704 | 34,879 |
| 2023 | 16,270 | 18,923 | 35,193 | 1,169 | 1,018 | 2,187 | 17,439 | 19,941 | 37,380 |
| 2024 | 17,406 | 20,057 | 37,463 | 1,290 | 1,108 | 2,397 | 18,696 | 21,164 | 39,860 |
| 2025 | 18,580 | 21,313 | 39,892 | 1,411 | 1,193 | 2,604 | 19,991 | 22,505 | 42,496 |
| 2026 | 19,512 | 22,263 | 41,775 | 1,507 | 1,260 | 2,767 | 21,019 | 23,523 | 44,542 |
| 2027 | 19,507 | 22,363 | 41,870 | 1,505 | 1,256 | 2,761 | 21,012 | 23,619 | 44,631 |
| 2028 | 19,638 | 22,648 | 42,286 | 1,460 | 1,223 | 2,683 | 21,097 | 23,871 | 44,969 |
| 2029 | 19,850 | 23,049 | 42,899 | 1,408 | 1,189 | 2,597 | 21,257 | 24,238 | 45,496 |
| 2030 | 20,003 | 23,378 | 43,381 | 1,371 | 1,170 | 2,541 | 21,374 | 24,548 | 45,923 |
| 2035 | 21,222 | 25,278 | 46,501 | 1,371 | 1,197 | 2,567 | 22,593 | 26,475 | 49,068 |
| 2040 | 23,061 | 27,338 | 50,399 | 1,420 | 1,265 | 2,685 | 24,482 | 28,602 | 53,084 |
| 2045 | 24,840 | 28,989 | 53,829 | 1,640 | 1,430 | 3,070 | 26,479 | 30,420 | 56,899 |
| 2050 | 25,981 | 30,054 | 56,035 | 1,835 | 1,568 | 3,403 | 27,816 | 31,622 | 59,438 |
| 2055 | 26,494 | 30,641 | 57,134 | 2,058 | 1,720 | 3,778 | 28,552 | 32,361 | 60,912 |
| 2060 | 25,932 | 30,478 | 56,410 | 2,126 | 1,775 | 3,901 | 28,058 | 32,254 | 60,312 |
| 2065 | 25,667 | 30,682 | 56,349 | 1,959 | 1,705 | 3,664 | 27,626 | 32,387 | 60,013 |
| 2070 | 26,309 | 31,457 | 57,766 | 1,963 | 1,724 | 3,687 | 28,272 | 33,181 | 61,453 |
| 2080 | 27,933 | 33,316 | 61,249 | 2,056 | 1,790 | 3,846 | 29,989 | 35,106 | 65,095 |
| 2090 | 29,777 | 35,342 | 65,119 | 2,299 | 1,979 | 4,279 | 32,076 | 37,321 | 69,398 |
| 2100 | 30,678 | 36,490 | 67,168 | 2,355 | 2,048 | 4,403 | 33,033 | 38,538 | 71,571 |
| Additional CPP | |||||||||
|---|---|---|---|---|---|---|---|---|---|
| Number of Beneficiaries | |||||||||
| Year | Disability Pension | Post-retirement Disability Benefit | ALL Disability Benefits | ||||||
| Males | Females | Total | Males | Females | Total | Males | Females | Total | |
| 2022 | 12,343 | 13,129 | 25,472 | – dash | – dash | – dash | 12,343 | 13,129 | 25,472 |
| 2023 | 13,835 | 14,689 | 28,524 | – dash | – dash | – dash | 13,835 | 14,689 | 28,524 |
| 2024 | 15,454 | 16,370 | 31,824 | – dash | – dash | – dash | 15,454 | 16,370 | 31,824 |
| 2025 | 16,829 | 17,884 | 34,713 | – dash | – dash | – dash | 16,829 | 17,884 | 34,713 |
| 2026 | 17,922 | 19,067 | 36,989 | – dash | – dash | – dash | 17,922 | 19,067 | 36,989 |
| 2027 | 18,092 | 19,463 | 37,555 | – dash | – dash | – dash | 18,092 | 19,463 | 37,555 |
| 2028 | 18,367 | 19,977 | 38,345 | – dash | – dash | – dash | 18,367 | 19,977 | 38,345 |
| 2029 | 18,695 | 20,575 | 39,269 | – dash | – dash | – dash | 18,695 | 20,575 | 39,269 |
| 2030 | 19,074 | 21,371 | 40,444 | – dash | – dash | – dash | 19,074 | 21,371 | 40,444 |
| 2035 | 21,222 | 25,278 | 46,501 | – dash | – dash | – dash | 21,222 | 25,278 | 46,501 |
| 2040 | 23,061 | 27,338 | 50,399 | – dash | – dash | – dash | 23,061 | 27,338 | 50,399 |
| 2045 | 24,840 | 28,989 | 53,829 | – dash | – dash | – dash | 24,840 | 28,989 | 53,829 |
| 2050 | 25,981 | 30,054 | 56,035 | – dash | – dash | – dash | 25,981 | 30,054 | 56,035 |
| 2055 | 26,494 | 30,641 | 57,134 | blank | blank | blank | 26,494 | 30,641 | 57,134 |
| 2060 | 25,932 | 30,478 | 56,410 | – dash | – dash | – dash | 25,932 | 30,478 | 56,410 |
| 2065 | 25,667 | 30,682 | 56,349 | – dash | – dash | – dash | 25,667 | 30,682 | 56,349 |
| 2070 | 26,309 | 31,457 | 57,766 | – dash | – dash | – dash | 26,309 | 31,457 | 57,766 |
| 2080 | 27,933 | 33,316 | 61,249 | – dash | – dash | – dash | 27,933 | 33,316 | 61,249 |
| 2090 | 29,777 | 35,342 | 65,119 | – dash | – dash | – dash | 29,777 | 35,342 | 65,119 |
| 2100 | 30,678 | 36,490 | 67,168 | –dash | –dash | –dash | 30,678 | 36,490 | 67,168 |
| Year | Base CPP | Additional CPP | Base CPP | ||||
|---|---|---|---|---|---|---|---|
| Average Monthly Disability Pension | Average Monthly Disability Pension | Post-retirement Disability Benefit | |||||
| Males | Females | Total | Males | Females | Total | ||
| 2022 | 1,068 | 994 | 1,028 | 7 | 6 | 7 | 525 |
| 2023 | 1,121 | 1,047 | 1,081 | 12 | 10 | 11 | 561 |
| 2024 | 1,156 | 1,082 | 1,117 | 18 | 16 | 17 | 578 |
| 2025 | 1,191 | 1,117 | 1,152 | 27 | 23 | 25 | 592 |
| 2026 | 1,224 | 1,149 | 1,184 | 36 | 30 | 33 | 605 |
| 2027 | 1,254 | 1,180 | 1,215 | 47 | 39 | 43 | 618 |
| 2028 | 1,287 | 1,212 | 1,247 | 59 | 49 | 54 | 630 |
| 2029 | 1,321 | 1,244 | 1,280 | 70 | 58 | 64 | 642 |
| 2030 | 1,356 | 1,277 | 1,314 | 79 | 65 | 72 | 655 |
| 2035 | 1,537 | 1,454 | 1,492 | 138 | 113 | 124 | 724 |
| 2040 | 1,742 | 1,656 | 1,695 | 209 | 172 | 189 | 799 |
| 2045 | 1,966 | 1,880 | 1,920 | 292 | 239 | 264 | 882 |
| 2050 | 2,219 | 2,134 | 2,174 | 387 | 316 | 349 | 974 |
| 2055 | 2,501 | 2,419 | 2,457 | 485 | 394 | 436 | 1,075 |
| 2060 | 2,827 | 2,744 | 2,783 | 577 | 469 | 518 | 1,187 |
| 2065 | 3,214 | 3,119 | 3,163 | 658 | 539 | 593 | 1,311 |
| 2070 | 3,640 | 3,539 | 3,586 | 756 | 623 | 683 | 1,447 |
| 2080 | 4,687 | 4,564 | 4,620 | 1,007 | 836 | 914 | 1,764 |
| 2090 | 6,021 | 5,873 | 5,941 | 1,344 | 1,123 | 1,224 | 2,150 |
| 2100 | 7,771 | 7,581 | 7,668 | 1,781 | 1,492 | 1,624 | 2,621 |
Disability Benefit Termination Rates
All emerging disability benefits (disability pensions and post-retirement disability benefits) are projected by age and sex for each future year until termination of disability (due to recovery, death, or attainment of age 65). The projected disability termination rates presented in Table 93 apply by age, sex, and duration of disability (i.e. the period of being in receipt of a disability benefit) on an attained calendar year basis. The average graduated experience over the 15-year period 2005 to 2019 is used to produce base year rates for 2019. The base year termination rates are then projected for 2022 and thereafter for males and females, by age of disability onset, and duration of disability using assumed recovery and mortality improvement rates.
Recovery improvement rates are assumed to trend to an ultimate level of 0% by 2026 (i.e. recovery rates are assumed to be constant after 2026), and mortality improvement rates of disability beneficiaries are assumed to trend to an ultimate level of 0.8% by the same year.
| 2022 | ||||||||||||
|---|---|---|---|---|---|---|---|---|---|---|---|---|
| Age | Males | Females | ||||||||||
| 1st Year | 2nd Year | 3rd Year | 4th Year | 5th Year | 6+ Year | 1st Year | 2nd Year | 3rd Year | 4th Year | 5th Year | 6+ Year | |
| 30 | 40 | 59 | 57 | 51 | 45 | 31 | 33 | 49 | 55 | 45 | 40 | 31 |
| 40 | 41 | 58 | 51 | 39 | 32 | 22 | 29 | 47 | 43 | 31 | 22 | 21 |
| 50 | 57 | 67 | 50 | 39 | 32 | 24 | 38 | 56 | 43 | 30 | 21 | 17 |
| 60 | 68 | 71 | 56 | 50 | 41 | 0 | 48 | 57 | 39 | 28 | 25 | 0 |
| 2035 | ||||||||||||
| Age | Males | Females | ||||||||||
| 1st Year | 2nd Year | 3rd Year | 4th Year | 5th Year | 6+ Year | 1st Year | 2nd Year | 3rd Year | 4th Year | 5th Year | 6+ Year | |
| 30 | 37 | 56 | 55 | 49 | 44 | 31 | 31 | 46 | 53 | 44 | 39 | 30 |
| 40 | 38 | 55 | 49 | 38 | 31 | 21 | 27 | 44 | 42 | 30 | 21 | 20 |
| 50 | 52 | 63 | 47 | 36 | 30 | 22 | 35 | 53 | 40 | 28 | 20 | 16 |
| 60 | 62 | 65 | 52 | 45 | 38 | 0 | 44 | 52 | 36 | 26 | 23 | 0 |
|
Table 93 footnotes
|
||||||||||||
B.7.8 Survivor Pension Expenditures
Survivor expenditures result from survivor’s benefits paid under the base and additional CPP. Under both components of the CPP, the survivor’s pension changes form at age 65.
Under the base CPP, the survivor’s pension payable to individuals younger than 65 consists of a flat-rate and earnings-related benefit. At ages 65 and older, the pension payable is earnings-related. The additional survivor’s pension payable takes the same form as the base survivor’s pension, except that the additional survivor’s pension is strictly earnings-related with no flat-rate benefit payable.
New Survivor’s Pension
New survivor pension expenditures are determined by age and sex for each year starting in 1968 as the product of:
- the number of deaths in the population;
- the probability of being married or in a common-law union at the time of death;
- the survivor eligibility rate;
- the spouses age distribution;
- the average annual amount of the benefit (flat-rate and average earnings-related benefits); and
- if applicable, the appropriate factor taking into account the base CPP earnings-related benefit limits that apply to combined survivor-disability and combined survivor-retirement pensions.
For each age and sex, the actual proportions of contributors married or in a common-law relationship at the time of death are determined from benefit statistics. The smoothed averages from recent experience over the years 2009 to 2021 , with further adjustments for younger and older ages, are used to determine the assumed proportions for future years. On the basis of the trends shown over the period 2009 to 2021, the proportions are extrapolated to 2023 and kept constant thereafter. These proportions account for benefits payable to same-sex couples. Values are shown in Table 94.
| Age | Males | Females |
|---|---|---|
| 20 | 0 | 0 |
| 30 | 18 | 27 |
| 40 | 37 | 59 |
| 50 | 54 | 67 |
| 60 | 54 | 57 |
| 70 | 62 | 51 |
| 80 | 65 | 34 |
| 90 | 49 | 11 |
The value of the emerging earnings-related survivor benefit is equal to 37.5% or 60% of the average retirement earnings-related benefit, depending on whether the surviving spouse or common-law partner is under age 65 or aged 65 or older, respectively. It is further adjusted to account for the fact that eligibility rules are more stringent for survivor benefits than for retirement benefits.
The projected number of new survivor beneficiaries by age (below 65, and 65 and older) is shown in Table 95. The projected average monthly survivor pensions of emerging (new) benefits for the base and additional CPP by age and sex are shown in Table 96.
| Base CPP | |||||||||
|---|---|---|---|---|---|---|---|---|---|
| Number of New Survivor Beneficiaries | |||||||||
| Year | Under 65 | 65 and Over | All Ages | ||||||
| Males | Females | Total | Males | Females | Total | Males | Females | Total | |
| 2022 | 5,483 | 17,218 | 22,701 | 18,392 | 49,655 | 68,047 | 23,875 | 66,873 | 90,748 |
| 2023 | 5,407 | 16,929 | 22,337 | 18,961 | 50,341 | 69,302 | 24,368 | 67,271 | 91,639 |
| 2024 | 5,410 | 16,993 | 22,403 | 19,677 | 51,903 | 71,581 | 25,087 | 68,896 | 93,983 |
| 2025 | 5,389 | 16,931 | 22,319 | 20,392 | 53,521 | 73,912 | 25,780 | 70,451 | 96,232 |
| 2026 | 5,346 | 16,823 | 22,169 | 21,107 | 55,201 | 76,307 | 26,452 | 72,024 | 98,476 |
| 2027 | 5,306 | 16,707 | 22,014 | 21,820 | 56,937 | 78,757 | 27,126 | 73,644 | 100,771 |
| 2028 | 5,286 | 16,613 | 21,899 | 22,526 | 58,729 | 81,255 | 27,812 | 75,342 | 103,154 |
| 2029 | 5,291 | 16,626 | 21,917 | 23,218 | 60,560 | 83,778 | 28,509 | 77,186 | 105,695 |
| 2030 | 5,282 | 16,527 | 21,810 | 23,892 | 62,422 | 86,314 | 29,175 | 78,949 | 108,124 |
| 2035 | 5,293 | 16,131 | 21,424 | 26,873 | 71,866 | 98,739 | 32,166 | 87,997 | 120,163 |
| 2040 | 5,416 | 16,103 | 21,520 | 28,975 | 79,881 | 108,855 | 34,391 | 95,984 | 130,375 |
| 2045 | 5,536 | 16,386 | 21,922 | 30,109 | 84,853 | 114,962 | 35,646 | 101,239 | 136,884 |
| 2050 | 5,574 | 16,805 | 22,378 | 30,587 | 87,104 | 117,690 | 36,160 | 103,909 | 140,069 |
| 2055 | 5,509 | 17,087 | 22,596 | 31,002 | 87,817 | 118,819 | 36,510 | 104,904 | 141,415 |
| 2060 | 5,359 | 17,074 | 22,434 | 31,743 | 88,930 | 120,673 | 37,102 | 106,005 | 143,107 |
| 2065 | 5,188 | 16,681 | 21,868 | 32,797 | 92,431 | 125,228 | 37,984 | 109,112 | 147,097 |
| 2070 | 5,069 | 16,139 | 21,208 | 33,879 | 98,205 | 132,084 | 38,949 | 114,343 | 153,292 |
| 2080 | 4,918 | 15,409 | 20,328 | 35,003 | 109,429 | 144,432 | 39,921 | 124,839 | 164,760 |
| 2090 | 4,818 | 15,101 | 19,920 | 34,528 | 111,491 | 146,019 | 39,347 | 126,592 | 165,939 |
| 2100 | 4,626 | 14,726 | 19,351 | 34,121 | 109,742 | 143,863 | 38,747 | 124,468 | 163,215 |
| Additional CPP | |||||||||
|---|---|---|---|---|---|---|---|---|---|
| Number of New Survivor Beneficiaries | |||||||||
| Year | Under 65 | 65 and Over | All Ages | ||||||
| Males | Females | Total | Males | Females | Total | Males | Females | Total | |
| 2022 | 3,935 | 11,768 | 15,703 | 4,396 | 4,975 | 9,372 | 8,332 | 16,743 | 25,074 |
| 2023 | 4,071 | 12,119 | 16,190 | 5,044 | 6,065 | 11,110 | 9,115 | 18,184 | 27,300 |
| 2024 | 4,267 | 12,717 | 16,984 | 5,788 | 7,402 | 13,190 | 10,055 | 20,119 | 30,174 |
| 2025 | 4,370 | 13,015 | 17,385 | 6,567 | 8,885 | 15,452 | 10,937 | 21,900 | 32,837 |
| 2026 | 4,427 | 13,203 | 17,630 | 7,383 | 10,527 | 17,910 | 11,809 | 23,730 | 35,540 |
| 2027 | 4,467 | 13,341 | 17,808 | 8,230 | 12,331 | 20,561 | 12,697 | 25,672 | 38,369 |
| 2028 | 4,513 | 13,461 | 17,974 | 9,104 | 14,290 | 23,394 | 13,617 | 27,751 | 41,368 |
| 2029 | 4,577 | 13,664 | 18,241 | 10,025 | 16,423 | 26,448 | 14,602 | 30,087 | 44,689 |
| 2030 | 4,703 | 13,979 | 18,682 | 11,155 | 18,909 | 30,064 | 15,859 | 32,888 | 48,747 |
| 2035 | 5,242 | 15,283 | 20,525 | 17,073 | 33,833 | 50,905 | 22,315 | 49,116 | 71,430 |
| 2040 | 5,401 | 15,748 | 21,150 | 22,097 | 50,835 | 72,932 | 27,498 | 66,584 | 94,081 |
| 2045 | 5,533 | 16,255 | 21,789 | 25,819 | 66,336 | 92,155 | 31,353 | 82,591 | 113,944 |
| 2050 | 5,573 | 16,766 | 22,339 | 28,346 | 76,690 | 105,036 | 33,919 | 93,456 | 127,375 |
| 2055 | 5,509 | 17,080 | 22,589 | 29,982 | 82,927 | 112,908 | 35,490 | 100,007 | 135,497 |
| 2060 | 5,359 | 17,074 | 22,433 | 31,378 | 87,308 | 118,686 | 36,737 | 104,382 | 141,119 |
| 2065 | 5,188 | 16,681 | 21,868 | 32,705 | 92,098 | 124,803 | 37,893 | 108,779 | 146,672 |
| 2070 | 5,069 | 16,139 | 21,208 | 33,867 | 98,172 | 132,039 | 38,936 | 114,311 | 153,247 |
| 2080 | 4,918 | 15,409 | 20,328 | 35,003 | 109,429 | 144,432 | 39,921 | 124,839 | 164,760 |
| 2090 | 4,818 | 15,101 | 19,920 | 34,528 | 111,491 | 146,019 | 39,347 | 126,592 | 165,939 |
| 2100 | 4,626 | 14,726 | 19,351 | 34,121 | 109,742 | 143,863 | 38,747 | 124,468 | 163,215 |
| Base CPP | ||||||
|---|---|---|---|---|---|---|
| Average New Monthly Survivor’s Pension | ||||||
| Year | Under 65 | 65 and Over | ||||
| Males | Females | Total | Males | Females | Total | |
| 2022 | 404 | 483 | 464 | 169 | 364 | 311 |
| 2023 | 424 | 508 | 488 | 163 | 365 | 309 |
| 2024 | 440 | 524 | 504 | 172 | 375 | 319 |
| 2025 | 454 | 539 | 518 | 184 | 387 | 331 |
| 2026 | 468 | 552 | 531 | 195 | 398 | 342 |
| 2027 | 480 | 564 | 544 | 205 | 407 | 351 |
| 2028 | 493 | 576 | 556 | 215 | 416 | 360 |
| 2029 | 505 | 589 | 569 | 225 | 425 | 370 |
| 2030 | 518 | 603 | 582 | 235 | 435 | 380 |
| 2035 | 590 | 677 | 655 | 289 | 491 | 436 |
| 2040 | 672 | 765 | 741 | 349 | 556 | 501 |
| 2045 | 765 | 866 | 841 | 415 | 629 | 573 |
| 2050 | 870 | 980 | 953 | 488 | 711 | 653 |
| 2055 | 988 | 1,108 | 1,079 | 569 | 804 | 743 |
| 2060 | 1,123 | 1,254 | 1,222 | 662 | 911 | 846 |
| 2065 | 1,276 | 1,418 | 1,384 | 773 | 1,041 | 971 |
| 2070 | 1,452 | 1,611 | 1,573 | 901 | 1,194 | 1,119 |
| 2080 | 1,879 | 2,082 | 2,033 | 1,226 | 1,580 | 1,495 |
| 2090 | 2,426 | 2,696 | 2,630 | 1,656 | 2,098 | 1,993 |
| 2100 | 3,139 | 3,487 | 3,403 | 2,221 | 2,786 | 2,652 |
| Additional CPP | ||||||
|---|---|---|---|---|---|---|
| Average New Monthly Survivor’s Pension | ||||||
| Year | Under 65 | 65 and Over | ||||
| Males | Females | Total | Males | Females | Total | |
| 2022 | 2 | 3 | 3 | 1 | 1 | 1 |
| 2023 | 4 | 4 | 4 | 2 | 1 | 2 |
| 2024 | 6 | 7 | 7 | 3 | 2 | 2 |
| 2025 | 9 | 10 | 10 | 4 | 2 | 3 |
| 2026 | 12 | 13 | 13 | 5 | 3 | 4 |
| 2027 | 15 | 17 | 17 | 6 | 4 | 5 |
| 2028 | 19 | 21 | 21 | 7 | 5 | 6 |
| 2029 | 23 | 25 | 25 | 8 | 6 | 7 |
| 2030 | 26 | 29 | 28 | 9 | 7 | 8 |
| 2035 | 46 | 52 | 51 | 17 | 14 | 15 |
| 2040 | 71 | 83 | 80 | 29 | 26 | 27 |
| 2045 | 100 | 123 | 117 | 49 | 44 | 46 |
| 2050 | 134 | 170 | 161 | 78 | 76 | 77 |
| 2055 | 170 | 224 | 210 | 120 | 126 | 125 |
| 2060 | 206 | 281 | 263 | 175 | 197 | 191 |
| 2065 | 242 | 337 | 315 | 241 | 290 | 277 |
| 2070 | 281 | 396 | 369 | 318 | 399 | 378 |
| 2080 | 378 | 534 | 496 | 499 | 660 | 621 |
| 2090 | 507 | 713 | 663 | 713 | 968 | 908 |
| 2100 | 675 | 947 | 882 | 969 | 1,307 | 1,227 |
Survivor Beneficiaries Mortality
All survivor pensions emerging by year, age, and sex of the surviving spouse or common-law partner are projected to each subsequent year using the assumed survivor mortality rates, which reflect the higher mortality of widows and widowers compared to that of the general population. The assumed survivor mortality rates are developed based on survivor beneficiaries’ mortality experience over the period 1966 to 2020 and the mortality improvement assumptions for the general population, as described earlier. Table 97 and Table 98 show the projected mortality rates of survivor beneficiaries and the resulting projected life expectancies of survivor beneficiaries by age and sex, respectively.
| Age | Males | Females | ||||||
|---|---|---|---|---|---|---|---|---|
| 2022 | 2025 | 2050 | 2075 | 2022 | 2025 | 2050 | 2075 | |
| 60 | 9.1 | 8.6 | 6.7 | 5.4 | 6.2 | 5.9 | 4.6 | 3.8 |
| 65 | 14.2 | 13.4 | 10.5 | 8.6 | 9.5 | 9.1 | 7.2 | 5.9 |
| 70 | 22.3 | 20.8 | 16.3 | 13.3 | 14.8 | 14.0 | 11.2 | 9.2 |
| 75 | 35.5 | 33.2 | 26.1 | 21.3 | 22.8 | 21.6 | 17.4 | 14.3 |
| 80 | 57.4 | 53.7 | 42.3 | 34.6 | 37.0 | 35.2 | 28.5 | 23.3 |
| 85 | 92.9 | 86.2 | 67.1 | 54.9 | 62.6 | 58.9 | 46.9 | 38.4 |
| 90 | 156.4 | 146.6 | 120.1 | 102.8 | 112.3 | 105.7 | 87.2 | 74.6 |
| Age | Males | Females | ||||||
|---|---|---|---|---|---|---|---|---|
| 2022 | 2025 | 2050 | 2075 | 2022 | 2025 | 2050 | 2075 | |
| 60 | 23.8 | 24.1 | 25.8 | 27.4 | 27.1 | 27.3 | 28.8 | 30.3 |
| 65 | 19.6 | 19.8 | 21.4 | 22.9 | 22.6 | 22.8 | 24.3 | 25.7 |
| 70 | 15.6 | 15.9 | 17.3 | 18.7 | 18.5 | 18.6 | 20.0 | 21.3 |
| 75 | 12.1 | 12.3 | 13.6 | 14.8 | 14.6 | 14.8 | 16.0 | 17.1 |
| 80 | 9.0 | 9.2 | 10.3 | 11.3 | 11.1 | 11.2 | 12.2 | 13.2 |
| 85 | 6.4 | 6.6 | 7.5 | 8.2 | 8.0 | 8.1 | 9.0 | 9.7 |
| 90 | 4.4 | 4.5 | 5.0 | 5.5 | 5.4 | 5.6 | 6.1 | 6.6 |
|
Table 98 footnotes
|
||||||||
B.7.9 Death Benefit Expenditures
Death benefits are flat-rate amounts that are payable only under the base CPP. There are no death benefits under the additional Plan.
The amount of lump sum death benefits payable each year is determined by age and sex as the product of:
- the number of deaths at ages 18 and over in the population;
- the survivor eligibility rate; and
- the amount of the death benefit determined by the year of death.
Table 99 shows the projected number of death benefits.
| Year | Males | Females | Total |
|---|---|---|---|
| 2022 | 103,630 | 72,630 | 176,260 |
| 2023 | 104,342 | 73,988 | 178,330 |
| 2024 | 106,942 | 76,777 | 183,719 |
| 2025 | 109,329 | 79,547 | 188,875 |
| 2026 | 111,747 | 82,395 | 194,142 |
| 2027 | 114,268 | 85,389 | 199,657 |
| 2028 | 116,941 | 88,502 | 205,442 |
| 2029 | 119,890 | 91,763 | 211,653 |
| 2030 | 122,706 | 95,095 | 217,801 |
| 2035 | 137,706 | 113,058 | 250,764 |
| 2040 | 152,482 | 132,091 | 284,573 |
| 2045 | 163,691 | 148,744 | 312,435 |
| 2050 | 171,020 | 160,789 | 331,810 |
| 2055 | 175,552 | 168,056 | 343,607 |
| 2060 | 178,486 | 171,667 | 350,153 |
| 2065 | 182,782 | 175,118 | 357,900 |
| 2070 | 190,979 | 181,849 | 372,828 |
| 2080 | 213,925 | 203,688 | 417,613 |
| 2090 | 227,095 | 219,656 | 446,751 |
| 2100 | 226,831 | 222,900 | 449,731 |
B.7.10 Children’s Benefit Expenditures
Children’s benefits are flat-rate amounts that are payable only under the base CPP. There are no children’s benefits under the additional Plan. The amount of the benefit payable to orphans and to children of disabled contributors is the same.
The number of disabled contributor’s child and orphan benefits emerging each year starting in 1970 and 1968, respectively, are determined by the projected number of children of new disability and/or survivor beneficiaries, based on the assumed fertility rates. The resulting number of emerging child beneficiaries by age, sex, and calendar year are thereafter projected from one year to the next, incorporating the following reasons for termination of benefits:
- attainment of age 25 by the child;
- ceasing full-time attendance at school while over age 18; and
- regarding disabled contributor’s child benefits only, termination (by reason of recovery, death, or attainment of age 65) of the parent’s disability benefits.
As of 1 January 2019, eligible children of early retirees who are deemed disabled and meet disability eligibility requirements receive the children’s benefit.
Table 100 shows the projected number of new children’s benefits by type and year.
| Year | Disabled Contributor’s ChildTable 100 footnote 1 | Orphans | Total |
|---|---|---|---|
| 2022 | 11,709 | 8,674 | 20,383 |
| 2023 | 12,670 | 8,648 | 21,318 |
| 2024 | 13,727 | 8,844 | 22,571 |
| 2025 | 14,910 | 8,911 | 23,821 |
| 2026 | 15,861 | 8,940 | 24,801 |
| 2027 | 16,115 | 8,970 | 25,085 |
| 2028 | 16,543 | 9,054 | 25,598 |
| 2029 | 17,045 | 9,261 | 26,306 |
| 2030 | 17,423 | 9,349 | 26,772 |
| 2035 | 19,265 | 9,718 | 28,983 |
| 2040 | 21,139 | 10,212 | 31,351 |
| 2045 | 22,449 | 10,495 | 32,944 |
| 2050 | 22,970 | 10,431 | 33,401 |
| 2055 | 23,051 | 10,100 | 33,151 |
| 2060 | 22,997 | 9,744 | 32,741 |
| 2065 | 23,443 | 9,494 | 32,937 |
| 2070 | 24,178 | 9,379 | 33,557 |
| 2080 | 25,749 | 9,205 | 34,954 |
| 2090 | 26,811 | 8,892 | 35,704 |
| 2100 | 27,943 | 8,561 | 36,505 |
|
Table 100 footnotes
|
|||
B.8 Operating Expenses
The operating expenses of the CPP have historically arisen from different sources, including ESDC, the CRA, Public Services and Procurement Canada, the Office of the Superintendent of Financial Institutions Canada, the Department of Finance Canada, and the CPPIB, where the majority of the operating expenses are attributable to ESDC and the CRA. For the purpose of this 31st CPP Actuarial Report, operating expenses of the CPPIB are included in the investment expenses assumptions for the base and additional CPP, as discussed in section B.6.6 of this report. For the following discussion, operating expenses pertain only to those expenses incurred by government organizations (e.g. ESDC).
In the calendar year 2021, operating expenses for the base and additional Plans from all sources (other than the CPPIB) amounted to about $759 million and $187 million, respectively, for a total of $946 million. The base and additional Plan operating expenses equal, respectively, 0.1% and 0.024% of total employment earnings, for a total of 0.124% of total employment earnings in 2021.
Based on actual expenses for years 2020 and 2021 along with estimates provided by ESDC for years 2022 to 2024, the annual total operating expenses in respect of both the base and additional CPP are on average close to 0.115% of total annual employment earnings over the period 2020-2024. It is assumed that total operating expenses (excluding the CPPIB) will transition linearly from 0.124% of total employment earnings in 2021 to 0.115% of total earnings by 2024 and remain at that level thereafter.
Based on information provided by ESDC, it is assumed for this report that operating expenses will be allocated as 73% to the base Plan and 27% to the additional Plan, and that this allocation of expenses will be reached by 2024 and remain constant thereafter. As such, it is projected that base Plan operating expenses as a percentage of total employment earnings will transition from 0.1% in 2021 to 0.084% by 2024 and remain constant thereafter. For the additional Plan, it is projected that total operating expenses as a percentage of total employment earnings will transition from 0.024% in 2021 to 0.031% by 2024 and remain constant thereafter.
Table 101 and Table 102 show the projected total operating expenses of the base CPP and additional CPP, respectively as a percentage of total employment earnings.
| Year | Operating Expenses ($ million) |
Total EarningsTable 101 footnote 2 ($ million) |
Operating Expenses as % of Total Earnings (%) |
|---|---|---|---|
| 2022 | 775 | 823,656 | 0.094 |
| 2023 | 768 | 863,211 | 0.089 |
| 2024 | 756 | 899,943 | 0.084 |
| 2025 | 787 | 937,262 | 0.084 |
| 2026 | 817 | 972,783 | 0.084 |
| 2027 | 847 | 1,009,361 | 0.084 |
| 2028 | 879 | 1,047,268 | 0.084 |
| 2029 | 912 | 1,085,983 | 0.084 |
| 2030 | 945 | 1,125,534 | 0.084 |
| 2035 | 1,130 | 1,346,437 | 0.084 |
| 2040 | 1,341 | 1,597,232 | 0.084 |
| 2045 | 1,595 | 1,899,381 | 0.084 |
| 2050 | 1,892 | 2,253,547 | 0.084 |
| 2055 | 2,226 | 2,651,238 | 0.084 |
| 2060 | 2,602 | 3,099,531 | 0.084 |
| 2065 | 3,038 | 3,618,653 | 0.084 |
| 2070 | 3,562 | 4,242,605 | 0.084 |
| 2080 | 4,971 | 5,921,931 | 0.084 |
| 2090 | 6,950 | 8,278,334 | 0.084 |
| 2100 | 9,634 | 11,475,969 | 0.084 |
|
Table 101 footnotes
|
|||
| Year | Operating Expenses ($ million) |
Total EarningsTable 102 footnote 2 ($ million) |
Operating Expenses as % of Total Earnings (%) |
|---|---|---|---|
| 2022 | 224 | 823,656 | 0.027 |
| 2023 | 252 | 863,211 | 0.029 |
| 2024 | 279 | 899,943 | 0.031 |
| 2025 | 291 | 937,262 | 0.031 |
| 2026 | 302 | 972,783 | 0.031 |
| 2027 | 313 | 1,009,361 | 0.031 |
| 2028 | 325 | 1,047,268 | 0.031 |
| 2029 | 337 | 1,085,983 | 0.031 |
| 2030 | 349 | 1,125,534 | 0.031 |
| 2035 | 418 | 1,346,437 | 0.031 |
| 2040 | 496 | 1,597,232 | 0.031 |
| 2045 | 590 | 1,899,381 | 0.031 |
| 2050 | 700 | 2,253,547 | 0.031 |
| 2055 | 823 | 2,651,238 | 0.031 |
| 2060 | 962 | 3,099,531 | 0.031 |
| 2065 | 1,124 | 3,618,653 | 0.031 |
| 2070 | 1,317 | 4,242,605 | 0.031 |
| 2080 | 1,839 | 5,921,931 | 0.031 |
| 2090 | 2,570 | 8,278,334 | 0.031 |
| 2100 | 3,563 | 11,475,969 | 0.031 |
|
Table 102 footnotes
|
|||
Appendix C – Financing the Canada Pension Plan
C.1 Historical and Legislative Background
The retirement system in Canada has been designed as a three-tier system. First, the Old Age Security (OAS) program provides a minimum floor benefit based on age and residence in Canada. Second, the CPP and QPP cover most individuals with employment earnings. Finally, individuals may be covered by registered pension plans (RPPs) as well as pooled registered pension plans (PRPPs), and can invest in individual registered retirement savings plans (RRSPs) and tax-free saving accounts (TFSAs) to supplement their retirement income.
Each tier is financed using a different approach: the OAS program is financed through general tax revenues on a pay-as-you-go basis, the CPP and QPP each consist of base and additional plans, which are, respectively, partially and fully funded based on contributions on employment earnings, and RPPs, PRPPs, RRSPs, and TFSAs are intended to be fully funded. The variety in both the sources and methods of financing enables the Canadian retirement income system to be more resilient to changes in demographic, economic, and investment conditions compared to systems that are less varied in their provision of retirement income.
The CPP was initially established as a pay-as-you-go plan with a small reserve fund worth about two years of benefits. At the time of the Plan’s inception, demographic, economic, and investment conditions were characterized by a younger population (higher fertility rates and lower life expectancies), rapid growth in wages and labour force participation, and low rates of return on investments. These conditions made prefunding the scheme unattractive and pay-as-you-go financing more appropriate. Growth in total earnings of the workforce and thus contributions were sufficient to cover growing expenditures without requiring large increases in the contribution rate. The Plan’s assets were invested primarily in long-term non-marketable securities of provincial governments at lower than market rates, thus providing the provinces with a relatively inexpensive source of capital to develop needed infrastructure.
However, changing conditions over time, including lower birth rates, increased life expectancies, and lower real wage growth led to increasing Plan costs. These factors, in combination with higher market returns, made fuller funding more attractive and appropriate. By the mid-1980s, the net cash flow (contributions less expenditures) had turned negative and part of the Plan’s investment income was required to meet the shortfall. The shortfall continued to grow, which eventually caused the assets of the reserve fund to start to fall by the mid-1990s.
In the December 1993 (15th) Actuarial Report on the CPP, the Chief Actuary projected that the pay-as-you-go contribution rate (expenditures as a percentage of contributory earnings) would increase to 14.2% by 2030. It was further projected that if changes were not made to the Plan, the reserve fund would be exhausted by 2015. The Chief Actuary identified five factors responsible for the increasing costs of the Plan, namely: lower birth rates, higher life expectancies than projected, the effect of the early 1990s recession on the proportions of earners and average employment earnings, benefit enrichments, and increased numbers of Canadians claiming disability benefits for longer periods.
In response to these developments, amendments were made in 1998 to gradually increase the level of CPP funding by increasing contribution rates over the short term, reducing the growth of benefits over the long term, and investing net cash flows in the private markets through the CPPIB to achieve higher rates of return. It was also decided that any future increases to benefits or additions of new benefits under the Plan should be fully funded. The reform package agreed to by the federal and provincial governments in 1997 thus included significant changes to the Plan’s financing provisions:
- The introduction of steady-state funding to replace pay-as-you-go financing in order to build a reserve of assets and stabilize the ratio of assets to expenditures over time. Investment income on this pool of assets is projected to help pay benefits as the large cohort of baby boomers retires. This refers to paragraph 113.1(4)(c) of the Canada Pension Plan.
- The introduction of full funding that requires that changes to the CPP that increase benefits or add new benefits be fully funded, i.e. that their costs be paid as the benefits are earned and that any costs associated with benefits that have already been earned but not paid for must be amortized and paid for over a defined period of time consistent with common actuarial practice. This refers to paragraph 113.1(4)(e) of the Canada Pension Plan.
Both of the financing objectives (steady-state and full funding) were introduced to improve fairness across generations and improve the financial long-term sustainability of the base Plan. The move to steady-state funding eases some of the contribution burden on future generations, while under full funding each generation that will receive benefit enrichments is more likely to pay for such enrichments in full so that the associated costs are not passed on to future generations.
The steady-state and any full funding contribution rates in respect of the base CPP are determined by the Chief Actuary in accordance with paragraphs 115(1.1)(c) and (e) of the Canada Pension Plan and the prescribed regulations (discussed below).
In 2016, the federal and provincial governments agreed to expand the CPP by creating the additional CPP.
The full funding of the additional CPP is a result of the 1997 reforms to the Plan, specifically the requirement to fully fund any increased or new benefits. In accordance with paragraph 113.1(4)(d) of the Canada Pension Plan, the additional retirement, survivor, and disability benefits provided by the additional Plan are to be financed by additional contribution rates that (i) are no lower than the lowest constant rates that can be maintained over the foreseeable future, and (ii) result in projected revenues (contributions and investment income) that are sufficient to fully pay the projected expenditures of the additional CPP over the long term.
The rates referred to in paragraph 113.1(4)(d) of the CPP statute are the first and second additional minimum contribution rates (FAMCR, SAMCR), which apply, respectively, to the first and second tier of the additional CPP. The AMCRs are determined by the Chief Actuary in accordance with paragraphs 115(1.1)(d) and (e) of the Canada Pension Plan and the prescribed regulations (discussed below). The AMCRs are calculated before and after accounting for any future increase in benefits or new benefits in accordance with the full funding requirements of paragraph 113.1(4)(e) of the CPP statute.
The regulations setting out the calculation of contribution rates for the base and additional are the Calculation of Contribution Rates Regulations, 2021.
C.2 Calculation of Base and Additional Minimum Contribution Rates
Base CPP
The financing objective of the base Plan is stated in the CPP statute in terms of the steady-state contribution rate and full funding rate for any increased or new benefits. The minimum contribution rate for the base CPP is the sum of the steady-state contribution rate and full funding rate as described below.
C.2.1 Steady-State Contribution Rate
The steady-state contribution rate calculation is specifically defined in the Calculation of Contribution Rates Regulations, 2021 as the lowest level contribution rate, applicable after the end of the review period, to the nearest 0.01% that results in the projected assets/expenditures (A/E) ratio of the base Plan being the same in the 10th and 60th years following the end of the review period. For this report, the end of the review period is 2024. Therefore, the steady-state contribution rate is applicable for 2025 and thereafter and the relevant years for the determination of the steady-state contribution rate are 2034 and 2084. The corresponding A/E for those years is determined to be 8.5, and the steady-state contribution rate, which is rounded to the nearest 0.01%, is determined to be 9.53% for the year 2025 and thereafter for this report.
The steady-state contribution rate is calculated separately from the full funding rate for any increased or new benefits.
C.2.2 Full Funding Rate of Increased or New Benefits
Subparagraph 115(1.1)(c)(ii) and paragraph 115(1.1)(f) of the CPP statute require the Chief Actuary to specify, in the report, a contribution rate in respect of any increased or new benefits for the base CPP in accordance with the requirements of paragraph 113.1(4)(e). The amendments to the Canada Pension Plan introduced under the Budget Implementation Act, 2018, No. 1, which received Royal Assent on 21 June 2018, include amendments in respect of the base CPP that required the application of 113.1(4)(e). These amendments are described in the 29th CPP Actuarial Report.
The amendments under the Budget Implementation Act, 2018, No. 1 invoke the full funding requirement for the base Plan. The temporary and permanent full funding contribution rate calculations for the base CPP are defined in the Calculation of Contribution Rates Regulations, 2021.
The effect of the amendments under the Budget Implementation Act, 2018, No. 1 on the long-term financial states of the base and additional CPP were first evaluated in the 29th CPP Actuarial Report, then were re-evaluated for the 30th CPP Actuarial Report and now for this 31st CPP Actuarial Report.
On the basis of this report, the full funding rates for the base CPP were determined as follows.
Temporary Full Funding Rate
Since amended base CPP survivor, disability, and death benefits that came into pay after 1 January 2019 are based on contributors’ CPP participation both before and after the effective date of the proposed amendments, there is a portion of the projected increase in liabilities that relates to Plan participation prior to the effective date. The increase in liabilities for Plan participation prior to 2019 is determined as at the year following the triennial review period, or as at the effective date of the amendments if later. The triennial review period in respect of this report is 2022 to 2024. As such, this increase in liabilities is calculated as the present value as at 1 January 2025 of the projected increase in base CPP expenditures relating to Plan participation prior to 2019 and is estimated at $1.7 billion.
The net accumulated assets in respect of the past unfunded liabilities are determined at the end of year 2024 based on the:
- projected increase in expenditures relating to Plan participation prior to 2019 over the years 2019 to 2024, and
- contributions calculated using the temporary full funding rate of the previous (30th) report over the same period.
These net accumulated assets are equal to $270 million as at 31 December 2024.
The temporary full funding contribution rate in respect of the increase in liabilities is determined to be 0.0252%. The temporary full funding rate is equal to the ratio of:
- the difference of the increase in liabilities and the net accumulated assets to
- the present value as at 1 January 2025 of contributory earnings over the period 2025 through 2033.
The amortization of the past unfunded liabilities was initially over the 15-year period 2019-2033 in the 29th CPP Actuarial Report. As the valuation date of this 31st CPP Actuarial Report is six years later than the valuation date of the 29th Report, the remaining amortization period is the 9-year period 2025-2033. The amortization period under both reports is consistent with common actuarial practice, as provided in the legislation.
Permanent Full Funding Rate
As for past participation, the increase in liabilities for Plan participation on or after 1 January 2019 is determined as at the year following the triennial review period, or as at the effective date of the amendments if later.
As such, the increased liabilities due to the base CPP amendments in respect of participation on or after 1 January 2019 is determined as at 1 January 2025 and are estimated to be $3.2 billion, and the corresponding net accumulated assets are estimated to be $476 million as at 31 December 2024. The difference between these liabilities and assets is fully funded with a permanent contribution rate of 0.0094%.
Total Full Funding Rates
The sum of the temporary and permanent full funding rates for the years 2025-2033 is 0.0346% (0.0252% plus 0.0094%) and 0.0094% for 2034 and thereafter. The rounded full funding rate is 0.03% for years 2025 to 2033 and 0.01% for the year 2034 and thereafter. The calculations and results are summarized in Table 103.
The Chief Actuary will review the full funding rates on a periodic basis to account for actual experience and any change in assumptions.
| Present Value of Contributory Earnings (2025-2033) as at 1 Jan. 2025 | (A)Table 103 footnote 1 | 5,786 | ($ billion) |
|---|---|---|---|
| Increase in Liability after 2024 due to Participation prior to Effective Date (1 Jan. 2019) as at 1 Jan. 2025 | (B)Table 103 footnote 2 | 1,727 | ($ million) |
| Net Accumulated Assets over Period 2019-2024 for Service prior to 2019 as at 31 Dec. 2024 | (C)Table 103 footnote 3 | 270 | ($ million) |
| Temporary Full Funding Rate (2025-2033) | (D) = (B-C)/(A) | 0.0252% | blank |
| Present Value of Contributory Earnings (2025+) as at 1 Jan. 2025 | (E)Table 103 footnote 1 | 29,111 | ($ billion) |
| Increase in Liability after 2024 due to Participation on or after Effective Date (1 Jan. 2019) as at 1 Jan. 2025 | (F)Table 103 footnote 2 | 3,206 | ($ million) |
| Net Accumulated Assets over Period 2019-2024 for Future Service from 2019 Onward as at 31 Dec. 2024 | (G)Table 103 footnote 3 | 476 | ($ million) |
| Permanent Full Funding Rate (2025+) | (H) = (F-G)/(E) | 0.0094% | blank |
| Permanent and Temporary Rate (2025-2033) | (I) = (D) + (H) | 0.0346% | blank |
| Permanent and Temporary Rate, after Rounding as per Regulations | (I), (H) after rounding applied as per Regulations | 0.03%, 2025-2033 0.01%, 2034+ | blank |
|
Table 103 footnotes
|
|||
C.2.3 Minimum Contribution Rate
The minimum contribution rate (MCR) is the sum of the rounded steady-state contribution rate and the rounded full funding rate. For this report, the MCR is determined to be 9.56% for years 2025 to 2033 and 9.54% for 2034 and thereafter. This compares to the MCR under the 30th CPP Actuarial Report of 9.75% for years 2022 to 2033 and 9.72% for 2034 and thereafter. The MCR will be recalculated for the next triennial actuarial report to be prepared as at 31 December 2024. It may also be recalculated at any other date to reflect the cost impact of any proposed amendments to the CPP statute.
As the MCR determined for this 31st CPP Actuarial Report is less than the legislated contribution rate of 9.9%, the insufficient rates provisions in subsections 113.1(11.05) to (11.15) of the CPP statute do not apply. Therefore, in the absence of specific action by the federal and provincial governments, the legislated contribution rate will remain at 9.9% for the year 2022 and thereafter.
Additional CPP
C.2.4 Additional Minimum Contribution Rates
The financing objective of the additional Plan is stated in the CPP statute in terms of the AMCRs (FAMCR and SAMCR) that must be determined before and after taking into account the full funding of any increased or new additional benefits.
The AMCRs are defined specifically in the Calculation of Contribution Rates Regulations, 2021 as the lowest level contribution rates, applicable after the end of the review period, to the nearest 0.0001 percentage points, such that the following conditions are met:
- the present value of projected additional open group obligations is less than or equal to the projected additional assets and present value of projected additional contributions (open group assets);
- the projected assets/expenditures (A/E) ratio of the additional Plan is the same in the 50th and 60th years following the end of the review period, but no earlier than in the years 2088 and 2098, respectively; and
- the SAMCR equals the FAMCR multiplied by the ratio of the earnings replacement rate of the second tier of the additional Plan to the replacement rate of the first tier (33.33% / 8.33%, which equals 4).
In regard to the first condition above, an open group is defined as one that includes all current and future participants of a plan, where the plan is considered to be ongoing into the future, that is, over an extended time horizon. This means that future contributions of current and new participants and their associated benefits are included in order to determine whether current assets and future contributions will be sufficient to pay for all future expenditures.
To determine the open group assets of the additional Plan, future additional contributions (using additional minimum contribution rates) of current and future contributors are projected using the best-estimate assumptions of this report. In order to determine their present value, the projected additional contributions are discounted using the assumed nominal rate of return on the additional CPP assets. This present value is added to the invested assets of the additional Plan to obtain the total open group assets.
To determine the actuarial obligations of the additional Plan on an open group basis, future additional expenditures with respect to current and future additional CPP participants are projected using the best-estimate assumptions of this report. The open group actuarial obligations are then the present value of these projected additional expenditures discounted using the assumed nominal rate of return on additional CPP assets.
Table 104 shows that the AMCRs satisfy the first condition above. The table shows that, as at 31 December 2021, the additional CPP open group assets are projected to be 105.2% of the open group actuarial obligations. There are $11 billion invested additional CPP assets as at 31 December 2021, and the total open group assets are equal to the present value of future additional contributions of current participants and future participants of the Plan plus the current invested assets. The open group actuarial obligations are equal to the sum of the present value of future additional benefits for current and future participants of the additional CPP and the benefits in pay, which amounts to $857 billion as at 31 December 2021.
| blank | As at 31 December 2021 |
|---|---|
| Assets | |
|
Current Assets
|
11.0 |
|
Future Contributions
|
889.7 |
|
Total Assets (a)
|
900.7 |
| Actuarial Obligations (b)Table 104 footnote 1 | 856.5 |
| Asset Excess (Shortfall) (a) – (b) | 44.2 |
| Assets as percentage of Obligations (a)/(b) | 105.2% |
|
Table 104 footnotes
|
|
For this report, the A/E ratio should be the same in 2088 and 2098, and the corresponding A/E ratio for those years is equal to about 24.
The current triennial review period of the CPP is 2022 to 2024, which is part of the initial phase-in period of the additional CPP. During the review period, the legislated first additional contribution rate applies: 1.5% for the year 2022, 2.0% for 2023 and 2024. The legislated second additional contribution rate is 8% for 2024 which is the first year of the second tier of the additional CPP.
The FAMCR and SAMCR are applicable for 2025 and thereafter. The FAMCR and SAMCR are rounded to the nearest 0.01%, and are determined for this report to be 1.97% and 7.88% for 2025 and thereafter.
As the AMCRs determined for this report do not deviate materially from the legislated additional contribution rates, the default provisions of the Additional Canada Pension Plan Sustainability Regulations do not apply. Therefore, in the absence of specific action by the federal and provincial governments, the legislated first additional contribution rate will remain at 1.5% for 2022 and 2.0% for 2023 and thereafter, and the legislated second additional contribution rate will remain at 8.0% for 2024 and thereafter.
C.3 Evolution of Assets to Expenditures Ratios
An important measure of the base and additional Plans’ financial states is the ratio of assets at the end of one year to the expenditures of the next year (the A/E ratio).
Base CPP
As can be seen in Chart 15, under the legislated contribution rate of 9.9%, the A/E ratio for the base Plan is projected to remain relatively stable at a level slightly above 8.0 over the period 2022 to the early 2030s. Thereafter, it continues to rise overall to a value of 13.2 in 2100.
As the legislated rate of 9.9% is greater than the MCR of 9.56% for years 2025-2033 and 9.54% thereafter, the A/E ratios under the legislated rate are higher than the ratios under the MCR. The A/E ratios under the MCR for years 2025 and thereafter are shown in Chart 15 for comparison. The ratios under the MCR in years 2034 and 2084 are nearly equal, at a value of about 8.4, as indicated in the chart. This is because the years 2034 and 2084 are the target years for the steady-state contribution rate of 9.55%, under which the A/E ratios are equal for those years at a value 8.4.
The projected initial slowdown in the growth of the A/E ratio until the early 2030s under the legislated rate of 9.9% is caused by the retirement of the baby boom generation, which increases the cash outflows of the Plan. The existence of a large pool of assets enables the base Plan to absorb the increased outflow and maintain the contribution rate at 9.9%.
Chart 15 Assets/Expenditures Ratio – Base CPP (legislated and minimum contribution rates)
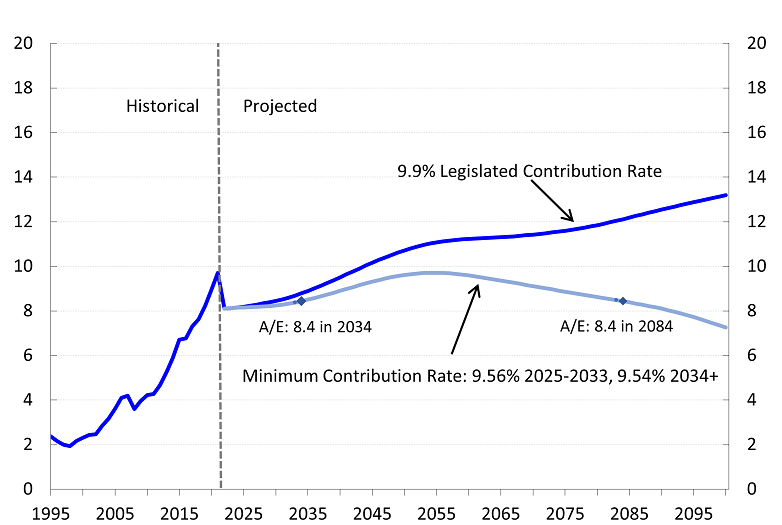
Text description: Chart 15 Assets/Expenditures Ratio – Base CPP (legislated and minimum contribution rates)
Line chart showing the historical and projected base CPP’s Assets to Expenditures ratio under the legislated and minimum contribution rates. Y axis represents the assets to expenditures ratio. X axis represents the year.
The assets to expenditures ratio under the 9.9% legislated contribution rate is 2.4 in 1995, increases to 9.7 in 2021 and is projected to increase to 13.2 in 2100.
The assets to expenditures ratio under the minimum contribution rate of 9.56% for years 2025 to 2033, and 9.54% for year 2034 and thereafter is projected to be 8.1 in 2025, to increase to a maximum of 9.7 in 2054 and then decrease to 7.25 in 2100.
The assets to expenditures ratio under the minimum contribution rate equals 8.4 in years 2034 and 2084.
| Year | 9.9% Legislated Contribution Rate A/E |
Minimum Contribution Rate A/E |
|---|---|---|
| 1995 | 2.37 | blank |
| 1996 | 2.16 | blank |
| 1997 | 1.99 | blank |
| 1998 | 1.94 | blank |
| 1999 | 2.17 | blank |
| 2000 | 2.32 | blank |
| 2001 | 2.43 | blank |
| 2002 | 2.47 | blank |
| 2003 | 2.84 | blank |
| 2004 | 3.15 | blank |
| 2005 | 3.62 | blank |
| 2006 | 4.10 | blank |
| 2007 | 4.20 | blank |
| 2008 | 3.60 | blank |
| 2009 | 3.96 | blank |
| 2010 | 4.23 | blank |
| 2011 | 4.27 | blank |
| 2012 | 4.66 | blank |
| 2013 | 5.26 | blank |
| 2014 | 5.91 | blank |
| 2015 | 6.70 | blank |
| 2016 | 6.76 | blank |
| 2017 | 7.30 | blank |
| 2018 | 7.61 | blank |
| 2019 | 8.22 | blank |
| 2020 | 8.95 | blank |
| 2021 | 9.71 | blank |
| Year | 9.9% Legislated Contribution Rate A/E |
Minimum Contribution Rate A/E |
|---|---|---|
| 2022 | 8.101072 | 8.101072 |
| 2023 | 8.124385 | 8.124385 |
| 2024 | 8.155844 | 8.155844 |
| 2025 | 8.182426 | 8.148422 |
| 2026 | 8.22989 | 8.16211 |
| 2027 | 8.283646 | 8.182122 |
| 2028 | 8.3318 | 8.196557 |
| 2029 | 8.385412 | 8.216218 |
| 2030 | 8.446744 | 8.243193 |
| 2031 | 8.514007 | 8.275591 |
| 2032 | 8.592113 | 8.318075 |
| 2033 | 8.687908 | 8.377133 |
| 2034 | 8.788966 | 8.438776 |
| 2035 | 8.895934 | 8.505413 |
| 2036 | 9.007952 | 8.576143 |
| 2037 | 9.126409 | 8.652233 |
| 2038 | 9.24996 | 8.732361 |
| 2039 | 9.376712 | 8.814698 |
| 2040 | 9.50535 | 8.897986 |
| 2041 | 9.636156 | 8.982453 |
| 2042 | 9.76781 | 9.066864 |
| 2043 | 9.899597 | 9.15057 |
| 2044 | 10.02927 | 9.231455 |
| 2045 | 10.1561 | 9.308855 |
| 2046 | 10.27937 | 9.382085 |
| 2047 | 10.39742 | 9.449606 |
| 2048 | 10.50945 | 9.510697 |
| 2049 | 10.61429 | 9.564279 |
| 2050 | 10.71135 | 9.609773 |
| 2051 | 10.80088 | 9.647382 |
| 2052 | 10.88338 | 9.677542 |
| 2053 | 10.9572 | 9.698753 |
| 2054 | 11.0202 | 9.70907 |
| 2055 | 11.0728 | 9.708812 |
| 2056 | 11.1178 | 9.700406 |
| 2057 | 11.1556 | 9.684185 |
| 2058 | 11.18656 | 9.660401 |
| 2059 | 11.2108 | 9.62915 |
| 2060 | 11.22927 | 9.591185 |
| 2061 | 11.24506 | 9.549104 |
| 2062 | 11.2604 | 9.504787 |
| 2063 | 11.27554 | 9.458436 |
| 2064 | 11.29052 | 9.410017 |
| 2065 | 11.30575 | 9.359843 |
| 2066 | 11.32358 | 9.309833 |
| 2067 | 11.34539 | 9.261121 |
| 2068 | 11.36993 | 9.212671 |
| 2069 | 11.39576 | 9.163306 |
| 2070 | 11.42361 | 9.113569 |
| 2071 | 11.45357 | 9.063476 |
| 2072 | 11.4852 | 9.012705 |
| 2073 | 11.51892 | 8.961572 |
| 2074 | 11.5552 | 8.910369 |
| 2075 | 11.59443 | 8.859385 |
| 2076 | 11.63714 | 8.808958 |
| 2077 | 11.683 | 8.758813 |
| 2078 | 11.73288 | 8.709529 |
| 2079 | 11.78679 | 8.661069 |
| 2080 | 11.84562 | 8.614004 |
| 2081 | 11.90847 | 8.567695 |
| 2082 | 11.97432 | 8.521345 |
| 2083 | 12.0432 | 8.474884 |
| 2084 | 12.11409 | 8.427555 |
| 2085 | 12.18734 | 8.379561 |
| 2086 | 12.26162 | 8.329938 |
| 2087 | 12.33393 | 8.27653 |
| 2088 | 12.40539 | 8.220001 |
| 2089 | 12.47581 | 8.160108 |
| 2090 | 12.54517 | 8.09678 |
| 2091 | 12.61304 | 8.029629 |
| 2092 | 12.67929 | 7.958467 |
| 2093 | 12.7441 | 7.883257 |
| 2094 | 12.80784 | 7.804155 |
| 2095 | 12.87089 | 7.721254 |
| 2096 | 12.93362 | 7.634679 |
| 2097 | 12.99625 | 7.544491 |
| 2098 | 13.05903 | 7.450735 |
| 2099 | 13.1222 | 7.353495 |
| 2100 | 13.18604 | 7.252837 |
Additional CPP
As shown in Chart 16, under the legislated additional contribution rates of 2.0% and 8.0%, the A/E ratio of the additional CPP is projected to increase significantly during the early years of the additional Plan and remain high as assets rapidly accumulate and benefit expenditures are low. As the additional Plan matures and benefit expenditures increase, the A/E ratio decreases and stabilizes at a level of about 26 by 2075. The A/E ratio under the AMCRs, also shown in Chart 16, is projected to be slightly lower than under the legislated rates, since the AMCRs are close to the legislated rates. The target years of 2088 and 2098, which are used in the determination of the AMCRs, are marked in the chart, and the corresponding A/E ratio is 24.
Chart 16 Assets/Expenditures Ratio – Additional CPP (legislated and additional minimum contribution rates)
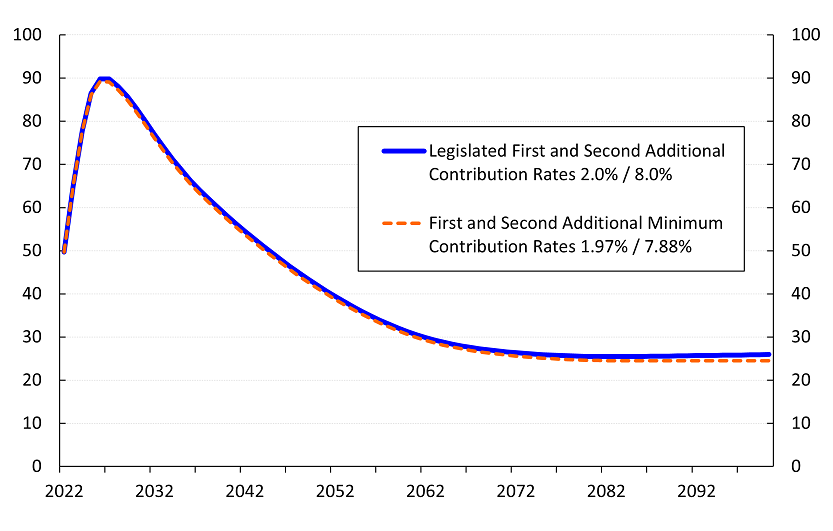
Text description: Chart 16 Assets/Expenditures Ratio – Additional CPP (legislated and additional minimum contribution rates)
Line chart showing the projected additional CPP’s Assets to Expenditures ratio under the legislated and minimum additional contribution rates. Y axis represents the assets to expenditures ratio. X axis represents the year.
The assets to expenditures ratio under the legislated first and second additional contribution rates of 2.0% and 8.0% is projected to start at a value of 49.7 in 2022, increase to a maximum of 89.8 in 2026 and then decreases to 26.0 in 2100.
The assets to expenditures ratio under the first and second additional minimum contribution rates of 1.97% and 7.88% is projected to start at a value of 49.7 in 2033, increase to a maximum of 89.3 in 2026 and then decreases to 24.5 in 2100.
| Year | Legislated First and Second Additional Contribution Rates 2.0% / 8.0% A/E |
First and Second Additional Minimum Contribution Rates 1.97% / 7.88% A/E |
|---|---|---|
| 2022 | 49.70 | 49.70214 |
| 2023 | 65.03 | 65.02829 |
| 2024 | 77.76 | 77.75932 |
| 2025 | 86.45 | 86.10717 |
| 2026 | 89.82 | 89.25341 |
| 2027 | 89.80 | 89.08656 |
| 2028 | 88.04 | 87.24726 |
| 2029 | 85.73 | 84.88221 |
| 2030 | 83.05 | 82.17054 |
| 2031 | 80.08 | 79.1919 |
| 2032 | 76.97 | 76.07748 |
| 2033 | 74.02 | 73.13141 |
| 2034 | 71.22 | 70.3357 |
| 2035 | 68.65 | 67.77636 |
| 2036 | 66.28 | 65.41457 |
| 2037 | 64.10 | 63.24443 |
| 2038 | 62.05 | 61.20178 |
| 2039 | 60.08 | 59.23876 |
| 2040 | 58.18 | 57.34802 |
| 2041 | 56.34 | 55.52214 |
| 2042 | 54.56 | 53.75732 |
| 2043 | 52.83 | 52.03738 |
| 2044 | 51.14 | 50.36042 |
| 2045 | 49.50 | 48.72556 |
| 2046 | 47.90 | 47.13987 |
| 2047 | 46.35 | 45.60688 |
| 2048 | 44.86 | 44.12345 |
| 2049 | 43.42 | 42.69298 |
| 2050 | 42.03 | 41.31289 |
| 2051 | 40.70 | 39.99233 |
| 2052 | 39.43 | 38.73215 |
| 2053 | 38.21 | 37.52467 |
| 2054 | 37.04 | 36.35987 |
| 2055 | 35.92 | 35.24587 |
| 2056 | 34.86 | 34.19547 |
| 2057 | 33.87 | 33.20785 |
| 2058 | 32.94 | 32.2821 |
| 2059 | 32.07 | 31.41487 |
| 2060 | 31.27 | 30.61218 |
| 2061 | 30.54 | 29.88338 |
| 2062 | 29.89 | 29.22902 |
| 2063 | 29.31 | 28.64589 |
| 2064 | 28.79 | 28.12638 |
| 2065 | 28.33 | 27.66296 |
| 2066 | 27.93 | 27.25594 |
| 2067 | 27.59 | 26.90019 |
| 2068 | 27.28 | 26.58453 |
| 2069 | 27.01 | 26.29975 |
| 2070 | 26.77 | 26.04492 |
| 2071 | 26.55 | 25.81635 |
| 2072 | 26.36 | 25.60944 |
| 2073 | 26.19 | 25.42264 |
| 2074 | 26.03 | 25.25515 |
| 2075 | 25.90 | 25.10687 |
| 2076 | 25.79 | 24.97682 |
| 2077 | 25.69 | 24.8631 |
| 2078 | 25.62 | 24.76629 |
| 2079 | 25.56 | 24.68563 |
| 2080 | 25.51 | 24.6223 |
| 2081 | 25.49 | 24.57377 |
| 2082 | 25.48 | 24.53756 |
| 2083 | 25.47 | 24.51289 |
| 2084 | 25.48 | 24.49689 |
| 2085 | 25.50 | 24.49033 |
| 2086 | 25.53 | 24.48807 |
| 2087 | 25.55 | 24.48501 |
| 2088 | 25.58 | 24.4837 |
| 2089 | 25.61 | 24.48336 |
| 2090 | 25.64 | 24.48379 |
| 2091 | 25.66 | 24.48389 |
| 2092 | 25.69 | 24.48315 |
| 2093 | 25.72 | 24.48206 |
| 2094 | 25.75 | 24.48094 |
| 2095 | 25.79 | 24.48053 |
| 2096 | 25.82 | 24.48118 |
| 2097 | 25.85 | 24.48305 |
| 2098 | 25.89 | 24.48623 |
| 2099 | 25.93 | 24.49077 |
| 2100 | 25.97 | 24.49685 |
C.4 Open Group Balance Sheets under the Legislated Contribution Rates
The base and additional CPP balance sheets presented in this section are prepared using an open group approach and the legislated contribution rates of each component. The open group balance sheet methodology is described earlier, in section C.2.4 of this appendix.
The choice of the methodology used to produce a social security system’s balance sheet needs to be consistent with the financing objectives of the system.
The base CPP is partially funded. Partially funded plans like the base CPP represent a social contract where, in any given year, current contributors allow the use of their contributions to pay current beneficiaries’ benefits. This social contract creates claims for current and past contributors to contributions of future contributors. As such, the proper assessment of the financial sustainability of partially funded plans by means of their balance sheets should reflect these claims. The open group approach to the balance sheet does account explicitly for these claims by considering the benefits and contributions of both current and future participants.
As discussed in section C.2, the legislated financing objectives of the base CPP are stated in terms of the MCR, which is determined using future projections of revenues and expenditures that consider both current and future CPP participants. In other words, the legislated financing objectives of the base CPP rely on open group projections.
The additional CPP is a fully funded plan. However, as discussed in section C.2.4, the legislated financing objectives of the additional CPP are stated in terms of the AMCRs which are determined using open group projections.
The actuarial balance sheets of the base and additional Plans under their respective legislated rates are complementary to the MCR and AMCRs in assessing the long-term financial sustainability of the two components of the CPP. That is to say that although the key legislatively prescribed financial measures for evaluating the components of the CPP are the MCR and AMCRs, specifically, their adequacy and stability over time, other indicators such as the open group balance sheets under the legislated rates could be used in combination with the minimum rates to assess the sustainability of the base and additional Plans.
It is worth emphasizing that none of the other individual financial indicators provide an absolute measure of the base or additional Plan’s sustainability. In particular, the base and additional Plans can tolerate fluctuations in the ratio of assets to obligations, both below and above 100%, without affecting the base or additional Plan’s financial sustainability.
Base CPP
The actuarial position of the base Plan as at 31 December 2021 and 31 December 2030 under the open group approach and the legislated contribution rate of 9.9% is presented in Table 105. The open group actuarial assets and obligations of the base CPP are determined similarly as for the additional CPP, as described earlier in section C.2.4, but using the base CPP projected contributions and expenditures and the expected rate of return on base CPP assets as a discount rate. To obtain the asset excess (shortfall) of the base CPP, the base Plan’s actuarial obligations are deducted from the open group assets at the valuation date.Footnote 14
| blank | As at 31 December 2021 | As at 31 December 2030 |
|---|---|---|
| Assets | ||
|
Current Assets
|
543.7 | 791.2 |
|
Future Contributions
|
3,039.7 | 3,554.1 |
|
Total Assets (a)
|
3,583.4 | 4,345.3 |
| Actuarial Obligations (b)Table 105 footnote 1 | 3,523.0 | 4,268.0 |
| Asset Excess (Shortfall) (a) – (b) | 60.4 | 77.4 |
| Assets as percentage of Obligations (a)/(b) | 101.7% | 101.8% |
|
Footnotes
|
||
Additional CPP
The prescribed regulations set out the determination of the ratio of the actuarial assets to obligations of the additional Plan on an open group basis in order to determine the AMCRsFootnote 15. In this section, the open group additional CPP balance sheet is prepared under the legislated additional contribution rates.
The actuarial position of the additional Plan as at 31 December 2021 under the open group approach and additional minimum contribution rates is presented in Table 104. The figures shown in Table 104 differ from those shown in Table 106, since different contribution rates are used. The legislated additional contribution rates are used for Table 106, whereas the AMCRs are used for Table 104.
To obtain the asset excess (shortfall) of the additional Plan, the additional Plan’s actuarial obligations are deducted from the open group assets at the valuation date. As shown in Table 106, the ratio of the additional Plan’s assets to its obligations using the legislated additional contribution rates is determined for this report to be 106.7% as at 31 December 2021 and 105.8% as at 31 December 2030.
| blank | As at 31 December 2021 | As at 31 December 2030 |
|---|---|---|
| Assets | ||
|
Current Assets
|
11.0 | 199.6 |
|
Future Contributions
|
902.7 | 1,056.8 |
|
Total Assets (a)
|
913.7 | 1,256.4 |
| Actuarial Obligations (b)Table 106 footnote 1 | 856.5 | 1,188.0 |
| Asset Excess (Shortfall) (a) – (b) | 57.2 | 68.4 |
| Assets as percentage of Obligations (a)/(b) | 106.7% | 105.8% |
|
Table 106 footnotes
|
||
Appendix D – Detailed Reconciliations with Previous Report
D.1 Base CPP
The results presented in this report differ from those previously projected for a variety of reasons. Differences between the actual experience for 2019 through 2021 and that projected in the 30th CPP Actuarial Report for the same period were addressed in the Reconciliation with Previous Triennial Reports – Base CPP section 7.1 of this report. Since historical results provide the starting point for the projections shown in this report, these differences have an effect on the projections. This section provides more details on the impact of the experience update and changes in the assumptions and methodology.
A reconciliation of the change in the MCR of 9.75% for years 2022 to 2033 and 9.72% thereafter as presented in the 30th CPP Actuarial Report to the MCR of 9.56% for years 2025 to 2033 and 9.54% thereafter determined for this report is provided in Table 107.
The experience over the period 2019 to 2021 was better than anticipated overall, which lowered the MCR. In particular:
- The main contributing factor for the decrease in the MCR was the better than expected investment experience, which lowers the MCR by 0.35 percentage points.
- Higher than anticipated growth in total employment earnings decreases the MCR by 0.04 percentage points.
- Overall lower than expected benefit expenditures, which resulted from lower retirement benefits (due to lower retirement benefit take-up at age 60 compared to expected), disability benefits (lower disability incidence rate compared to expected), survivor benefits, children benefits and operating expenses outweighing higher death benefits than expected decreases the MCR by 0.15 percentage points.
Changes made to the key best-estimate assumptions since the previous triennial report were outlined in Table 1 of section 4 of this report. The effects of these changes on the MCR are also shown in Table 107 and are summarized below.
- The assumed total fertility rates are lower than those assumed in the previous triennial report, and as such, increase the MCR by 0.08 percentage points.
- The initial lower mortality rates and mortality improvement rates assumed for this report decrease the MCR by 0.06 percentage points.
- The assumed level of net migration is higher over the projection period than in the previous triennial report, and this decreases the MCR by 0.13 percentage points. This is a result of higher growth in total contributory earnings outweighing the ultimate increase in benefit expenditures.
- The higher assumed labour force participation and employment rates decrease the MCR by 0.07 percentage points.
- The higher assumed level of price increases (inflation) over the short term compared to the previous report decreases the MCR by 0.04 percentage points.
- The change in the real wage increase assumption increases the MCR by 0.18 percentage points due to the lower increase in contributory earnings compared to the previous triennial report.
- Several changes were made in respect of real rate of return assumptions compared to the previous triennial report. These changes include a different initial and ultimate asset mix, different ultimate rates of return for certain asset classes, as well as adjustments made in order to reflect the impact of the subsequent event described in section 2.3. These changes increase the MCR by 0.37 percentage points.
- Changes in retirement benefit-related assumptions increase the MCR by 0.07 percentage points. Changes to the disability benefit assumptions decrease the MCR by 0.05 percentage points.
Some other assumptions, which are described in Appendix B, were also changed. Overall, the changes in these other assumptions had the effect of slightly decreasing the MCR.
The impacts on the MCR resulting from changes in assumptions include revisions to reflect the subsequent event disclosed in section 2.3. Overall, changes to the assumptions to reflect the subsequent event resulted in an increase in the MCR of 0.31 percentage points. A large portion of this increase is due to reductions in the 2022 assumed nominal rate of return. The reduction in MCR of 0.35 percentage points due to 2019-2021 investment experience is therefore partially offset by lower assumed returns in 2022.
A progression of the MCR over time based on the steady-state contribution rate target years of future triennial valuation reports and using the best-estimate assumptions of this report is shown in Table 15 of the Results – Base CPP section 5.5 of this report. As shown in that table, the MCR is projected to remain relatively stable over time.
| blank | Steady-State Rate | Full Funding | MCR | ||
|---|---|---|---|---|---|
| 2025-2033 | 2034+ | 2025-2033 | 2034+ | ||
| 30th CPP Actuarial Report - After Rounding | 9.71 | 0.04 | 0.01 | 9.75 | 9.72 |
| 30th CPP Actuarial Report - Before Rounding | 9.708 | 0.035 | 0.007 | 9.743 | 9.715 |
| I. Improvements in Methodology | 0.048 | (0.001) | (0.001) | 0.046 | 0.046 |
| II. Experience Update (2019-2021) | |||||
|
Demographic
|
(0.005) | 0.001 | 0.000 | (0.004) | (0.004) |
|
Economic
|
(0.037) | (0.001) | 0.000 | (0.037) | (0.037) |
|
Benefits
|
(0.149) | (0.006) | (0.001) | (0.155) | (0.150) |
|
Investments
|
(0.354) | 0.000 | 0.000 | (0.353) | (0.354) |
|
Subtotal:
|
(0.544) | (0.005) | (0.001) | (0.550) | (0.545) |
| III. Changes in Assumptions | |||||
|
Fertility
|
0.076 | 0.000 | 0.000 | 0.076 | 0.076 |
|
Mortality
|
(0.063) | 0.002 | 0.001 | (0.060) | (0.062) |
|
Net Migration
|
(0.134) | (0.001) | 0.000 | (0.135) | (0.134) |
|
Labour Market
|
(0.070) | (0.001) | 0.000 | (0.071) | (0.070) |
|
Price Increases
|
(0.040) | 0.000 | 0.000 | (0.041) | (0.040) |
|
Real Wage Increase
|
0.175 | 0.002 | 0.001 | 0.177 | 0.175 |
|
Real Rates of Return
|
0.373 | 0.001 | 0.000 | 0.373 | 0.373 |
|
Retirement
|
0.066 | 0.000 | 0.000 | 0.066 | 0.066 |
|
Disability
|
(0.050) | 0.003 | 0.002 | (0.047) | (0.048) |
|
Other Assumptions
|
(0.009) | 0.001 | 0.000 | (0.008) | (0.009) |
|
Subtotal:
|
0.323 | 0.008 | 0.004 | 0.331 | 0.327 |
| IV. Others (Change in Funding Targets from 2031-2081 to 2034-2084) | (0.009) | (0.002) | 0.000 | (0.011) | (0.008) |
| Total of I to IV | (0.182) | (0.001) | 0.002 | (0.183) | (0.180) |
| Rates before Rounding | 9.526 | 0.035 | 0.009 | 9.560 | 9.535 |
| Rounded Rate, in Accordance with the Calculation of Contribution Rates Regulations, 2021 | 9.53 | 0.03 | 0.01 | 9.56 | 9.54 |
| 31st CPP Actuarial Report | 9.53 | 0.03 | 0.01 | 9.56 | 9.54 |
|
Table 107 footnotes
|
|||||
D.2 Additional CPP
Differences between the actual experience for 2019 through 2021 and that projected in the 30th CPP Actuarial Report for the same period were addressed in the Reconciliation with Previous Triennial Reports –Additional CPP section 7.2 of this report. Since historical results provide the starting point for the projections shown in this report, these differences have an effect on the projections. This section provides more details on the impact of the experience update and changes in the assumptions and methodology.
A reconciliation of the change in the FAMCR of 1.98% and SAMCR of 7.92%, as presented in the 30th CPP Actuarial Report, to the FAMCR of 1.97% and SAMCR of 7.88% for this report is provided in Table 108.
The experience update had the effect of reducing the FAMCR and SAMCR by 0.006 percentage points and 0.025 percentage points respectively due to better than anticipated economic and investment experience compared to the 30th CPP Actuarial Report.
Changes made to the key best-estimate assumptions since the previous triennial report were outlined in Table 1 of section 4 of this report. The main effects of these changes on the AMCRs are also shown in Table 108 and are summarized below.
- The initial lower mortality rates and mortality improvement rates assumed for this report decrease the FAMCR and SAMCR by 0.01 percentage points and 0.039 percentage points respectively.
- The higher assumed labour force participation and employment rates increase the FAMCR and SAMCR by 0.009 percentage points and 0.038 percentage points respectively. The AMCRs increase instead of decreasing as for the base Plan MCR due to the different financing approaches of the two components of the CPP. The higher employed population results in eventual higher benefit expenditures, which, for the additional benefits, must be fully funded under the additional Plan.
- The change in the real wage increase assumption causes the FAMCR and SAMCR to decrease by 0.032 percentage points and 0.128 percentage points respectively due to the lower increase in contributory earnings compared to the previous triennial report. The AMCRs decrease instead of increasing as for the base Plan MCR for the same reason cited in the bullet point above in respect of the assumed labour force participation and employment rates.
- Regarding the real rates of return assumptions, changes compared to the 30th CPP Actuarial Report include a new Credit asset class in the Supplementary Pool and a different initial asset mix to reflect the CPPIB’s investment strategy in respect of the additional CPP. The assumed relative allocation to these asset classes over the projection period result in a higher ultimate portfolio real rate of return. As such, the FAMCR and SAMCR decrease by 0.016 percentage points and 0.062 percentage points respectively.
As mentioned for the base CPP, some other assumptions were also changed. Overall, the changes in these other assumptions had the effect of increasing the FAMCR and SAMCR by 0.019 percentage points and 0.075 percentage points respectively. These increases are mostly attributable to higher assumed operating expenses.
The impacts on the AMCRs resulting from changes in assumptions include revisions to reflect the subsequent event disclosed in section 2.3. Overall, changes to the assumptions to reflect the subsequent event resulted in decreases of less than 0.005 percentage points and 0.02 percentage points in the FAMCR and SAMCR, respectively.
| blank | First Additional Minimum Contribution Rate | Second Additional Minimum Contribution Rate |
|---|---|---|
| 30th CPP Actuarial Report - After Rounding | 1.98 | 7.92 |
| 30th CPP Actuarial Report - Before Rounding | 1.977 | 7.907 |
| I. Improvements in Methodology | 0.027 | 0.108 |
| II. Starting Environment (2019-2021) | ||
|
Demographic
|
0.000 | (0.001) |
|
Economic
|
(0.004) | (0.016) |
|
Benefits
|
0.000 | 0.000 |
|
Investments
|
(0.002) | (0.008) |
|
Subtotal:
|
(0.006) | (0.025) |
| III. Changes in Assumptions | ||
|
Fertility
|
(0.006) | (0.023) |
|
Mortality
|
(0.010) | (0.039) |
|
Net Migration
|
0.006 | 0.024 |
|
Labour Market
|
0.009 | 0.038 |
|
Price Increases
|
(0.002) | (0.009) |
|
Real Wage Increase
|
(0.032) | (0.128) |
|
Real Rates of Return
|
(0.016) | (0.062) |
|
Retirement
|
0.003 | 0.013 |
|
Disability
|
0.000 | 0.001 |
|
Other Assumptions
|
0.019 | 0.075 |
|
Subtotal:
|
(0.028) | (0.110) |
| Total of I to III | (0.007) | (0.028) |
| Rates before Rounding | 1.970 | 7.879 |
| Rounded Rates, in Accordance with the Calculation of Contribution Rates Regulations, 2021 | 1.97 | 7.88 |
| 31st CPP Actuarial Report | 1.97 | 7.88 |
|
Table 108 footnotes
|
||
Appendix E – Uncertainty of Results
E.1 Introduction
This actuarial report on the Canada Pension Plan is based on the projection of its revenues and expenditures for both of its components, the base and additional CPP, over a long period of time. The information required by statute, which is presented in the Results sections 5 and 6 of this report, has been derived using best-estimate assumptions regarding future demographic, economic, and investment trends. Given the length of the projection period and the number of assumptions required, it is unlikely that actual future experience will develop precisely in accordance with the best-estimate projections. The objective of this section of the report is to illustrate the sensitivity of the long-term projected financial states of the base and additional Plans to changes in the future demographic, economic, and investment outlooks, and to illustrate potential downside risks due to emerging trends.
The future revenues and expenditures, or income and outgo of the CPP, both for the base and additional Plans, depend on many demographic, economic, and investment factors, including fertility, mortality, migration, the labour force, average earnings, inflation, retirement patterns, disability incidence rates, and investment returns. On the other hand, future demographic, economic, and investment environments are affected by both domestic and global forces, such as climate change, how globalization or protectionism influence world economic growth, geopolitical situations, etc. The income will depend on how all these factors change the size and composition of the working-age population,the level and distribution of earnings and financial markets. Similarly, the outgo will depend on how these factors change the size and composition of the beneficiary population and the general level of benefits. Although both the base and additional CPP are affected by the aforementioned factors, the degree to which the two components of the CPP are affected differs.
For the additional CPP, there is a stronger link between contributions paid by individuals and the benefits they will receive. As a result, while some assumptions regarding factors such as fertility, migration, and labour force participation affect the cash flows and amount of assets of the additional Plan, they, in general, do not have a major impact on the AMCRs. In comparison, these assumptions could have a significant impact on the MCR of the base CPP. Other assumptions have a more significant impact on the AMCRs for the additional CPP, the real rate of return is such an example. This again is attributable to the different financing approaches of the base and additional CPP.
Section E.2 examines the sensitivity of the base and additional CPP minimum contribution rates to intervaluation investment experience, while section E.3 presents sensitivity tests on individual long-term assumptions derived based on judgment or stochastic modeling techniques. Next, sections E.4 builds on the individual sensitivity tests performed in section E.3 by combining various assumptions of the individual tests to create scenarios of higher and lower long-term economic growth. The combination of the individual sensitivity test assumptions is not meant to necessarily create probable scenarios, but rather to show the possible impacts from different economic environments.
Finally, section E.5 is a new section that focuses on understanding and assessing downside risks due to three potential or emerging trends. Since the additional CPP is still at its early stages, it focuses on the base CPP only. Furthermore, given the purpose of the section, only adverse scenarios are presented; results should therefore be interpreted with caution.
E.2 Sensitivity to Intervaluation Investment Experience
Context
The CPPIB was created in 1997 with the objective, as stated in the Canada Pension Plan Investment Board Act, “to invest its assets with a view to achieving a maximum rate of return, without undue risk of loss, having regard to the factors that may affect the funding of the Canada Pension Plan and the ability of the Canada Pension Plan to meet its financial obligations on any given business day”. The assets of the CPP are invested by the CPPIB through a diversified portfolio.
Historically, equities have shown greater volatility than fixed income instruments (such as bonds), volatility being a measure of the magnitude of fluctuation in returns. Higher volatility of a security’s returns implies a greater risk, since the range of possible outcomes of returns widens. Hence, equities are viewed as being riskier than bonds.
As a result, the higher volatility of equities compared to bonds has been rewarded with higher returns. This describes the key risk-reward relationship, whereby investors seek a higher level of return over the long term, in exchange for assuming a higher level of risk. Nevertheless, over the short term, the potential for lower returns exists along with that for higher returns due to the higher level of volatility.
To express the desired risk target of its investment portfolio, the CPPIB uses a simple two-asset class (fixed income and equity) portfolio called the “reference portfolio”. The greater the proportion of equities in the reference portfolio, the greater the risk target. The reference portfolio applicable to the base CPP as at 31 December 2021 is 85% global equity and 15% Canadian government nominal bonds, whereas, the reference portfolio applicable to the additional CPP as at 31 December 2021 consists of 55% global equity and 45% Canadian government nominal bonds. The different risk targets for each component of the plan reflect each component’s distinct nature and financing approach. More information on how the CPPIB invests assets of the base and additional CPP according to their respective reference portfolios can be found in Appendix B.
In settings its risk targets and making investment decisions, the CPPIB adopts a long-term approach. However, given the level of risk reflected in the CPPIB’s portfolios, short-term returns can be quite volatile and affect the starting value of assets used to calculate the MCRs and AMCRs every three years. The starting value of assets, and therefore the intervaluation investment experience, can have a significant impact on the Plan’s minimum contribution rates.
The purpose of this section is to highlight the sensitivity of the Plan’s minimum contribution rates to intervaluation investment experience.
Base CPP
Table 109 shows what the MCR of this report would have been based on different levels of assets as at 31 December 2021, while maintaining the same best-estimate assumptions. It is meant to provide a simple illustration of the sensitivity of the MCR to the starting value of assets.
Based on the actual assets as at 31 December 2021 of $544 billion, the MCR for years 2034 and thereafter is 9.54%. However, if assets as at 31 December 2021 had been 10% lower, the MCR would have increased by 0.16 percentage points to 9.70%, and if they had been 10% higher, the MCR would have decreased by 0.17 percentage points to 9.37%. Assets would have had to be at least 22% lower for the MCR to be above the legislated rate of 9.9%.
| Assets at 31 December 2021 ($ billion) |
Average Nominal Return, 2019-2021 (%) |
MCR at 31 December 2021Table 109 footnote 1 (%) |
Difference with Actual (%) |
|
|---|---|---|---|---|
| 20% lower | 435 | 4.7 | 9.87 | 0.33 |
| 10% lower | 489 | 8.8 | 9.70 | 0.16 |
| Actual | 544 | 12.7 | 9.54 | 0.00 |
| 10% higher | 598 | 16.4 | 9.37 | (0.17) |
| 20% higher | 652 | 19.8 | 9.20 | (0.34) |
|
Table 109 footnotes
|
||||
Even though the base CPP relies more heavily on contributions than on investment income, the MCR can change significantly from one valuation to the next due to investment experience alone.
In order to put the variability in MCR due to intervaluation investment experience into context, a stochastic analysis of investment returns was performed. It is used to determine the distribution of MCR as a function of intervaluation investment experience. For this purpose, 10,000 paths of returns were generated and probability distributions of the resulting MCR were determined. The fluctuation in the rate of return on investments is based on a normal distributionFootnote 16 of returns and is projected using the assumed asset allocation and correlations between asset classes, as well as the standard deviations and expected returns for each asset class.
Based on the best-estimate assumptions of this report and as shown in Table 15, the MCR at the next valuation as at 31 December 2024 is expected to be 9.55% for years 2034 and after. Table 110 presents the estimated probability of the MCR as at 31 December 2024 falling into certain ranges based on the stochastic analysis of investment returns during the three-year intervaluation period 2022-2024. All other assumptions are in line with the best-estimate assumptions of this report.
| MCR at 31 December 2024 (percentages)Table 110 footnote 1 |
Difference relative to best-estimate MCR of 9.55% | Probability (percentages) |
|---|---|---|
| Less than 9.20 | Decrease of more than 35 percentage points | 20 |
| 9.20 - 9.39 | Decrease between 16 and 35 percentage points | 16 |
| 9.40 - 9.70 | Within 15 percentage points | 30 |
| 9.71 - 9.90 | Increase between 16 and 35 percentage points | 18 |
| Above 9.90 | Increase of more than 35 percentage points | 16 |
|
Table 110 footnotes
|
||
Based on the results, there is a 70% probability that the MCR at the next valuation as at 31 December 2024 will have a difference of more than 15 percentage points relative to the best-estimate MCR of 9.55% (i.e. MCR outside of the 9.40% to 9.70% range) due to investment experience alone. Furthermore, there is a 16% probability that the MCR at the next valuation as at 31 December 2024 will exceed the legislated rate of 9.9% due to investment experience alone.
The probability of the MCR at a given valuation date exceeding the legislated rate of 9.9% due to investment experience alone also depends on the level of the MCR of the previous valuation. All else being equal, the higher the best-estimate MCR of the previous valuation, the higher the probability of exceeding the legislated rate at the next valuation and vice-versa.
As shown in Table 111 , if the MCR in this valuation were 9.70% instead of 9.54%, then the probability that it would exceed the legislated rate of 9.9% as at 31 December 2024 due to investment experience alone would be 30%. If the MCR in this valuation were 9.37% instead of 9.54%, then the probability that it would exceed the legislated rate of 9.9% as at 31 December 2024 due to investment experience alone would be 8%.
| MCR at 31 December 2021 (previous valuation)Table 111 footnote 1 |
Probability |
|---|---|
| 9.37 (Low Scenario) | 8 |
| 9.54 (Best-Estimate) | 16 |
| 9.70 (High Scenario) | 30 |
|
Table 111 footnotes
|
|
Additional CPP
Since the additional CPP is still in its early years, the intervaluation investment experience doesn’t currently have a material impact on the AMCRs.
However, given its financing approach and the fact that the additional CPP assets are expected to grow rapidly over the next decades, investment experience is expected to eventually become one of the main drivers behind additional Plan surpluses or deficits. The impact of investment experience on the AMCRs will therefore become more pronounced over time.
This subsection illustrates sensitivities similar to those presented in the previous subsection on the base CPP, but instead focuses on dates in the future when the additional Plan will be more mature. For this purpose, dates of 31 December 2045 and 31 December 2048 were selected, which are close to thirty years after the introduction of the additional Plan.
Table 112 shows the estimated impact on the FAMCR of different levels of assets as at 31 December 2045, while maintaining all other assumptions in line with the best-estimate assumptions of this report. As the SAMCR is four times the value of the FAMCR, the table shows only the FAMCR.
Based on the best-estimate assumptions of this report, the additional CPP assets as at 31 December 2045 are expected to be $956 billion, and the FAMCR as at 31 December 2045 is expected to be 1.94%. However, if assets as at 31 December 2045 were 10% lower, the FAMCR would increase by 0.11 percentage points to 2.05%. If starting assets as at 31 December 2045 were 10% higher, the FAMCR would decrease by 0.11 percentage points to 1.83%.
Compared to Table 109 in the previous subsection, it can be seen that, on a relative basis, the additional Plan is much more sensitive to the level of assets than the base CPP. For example, assets that are 20% lower result in a relative increase of 3.5% in the base CPP MCR (9.54% to 9.87%) compared to a relative increase of 11% for the additional CPP FAMCR (1.94% to 2.16%). This is line with the additional Plan’s financing approach that relies more heavily on investment income than the base CPP.
| Assets at 31 December 2045 ($ billion) |
Average Nominal Return, 2043-2045 (%) |
FAMCR at 31 December 2045Table 112 footnote 1 (%) |
Difference with Best-Estimate (%) |
|
|---|---|---|---|---|
| 20% lower | 765 | (2.2) | 2.16 | 0.22 |
| 10% lower | 861 | 1.9 | 2.05 | 0.11 |
| Best-Estimate | 956 | 5.6 | 1.94 | 0.00 |
| 10% higher | 1,052 | 9.2 | 1.83 | (0.11) |
| 20% higher | 1,147 | 12.5 | 1.72 | (0.22) |
|
Table 112 footnotes
|
||||
For the additional CPP, investment experience could cause the AMCRs to deviate from their legislated rates of 2.0% and 8.0% into various ranges. As per the Additional Canada Pension Plan Sustainability Regulations, the FAMCR may fall between 1.7% and 2.2% without requiring immediate action from 2024 to 2038. From 2039 onward, this “No Action Required” range is reduced to between 1.8% and 2.1%. The corresponding ranges for the SAMCR are those of the FAMCR with the boundary values multiplied by four.
As the additional Plan assets are relatively low over the inter-valuation period 2022-2024, it is very unlikely that short-term investment experience would cause the AMCRs to fall outside the “no action” ranges prescribed by the proposed Additional Canada Pension Plan Sustainability Regulations. However, as mentioned previously, the impact of intervaluation investment experience will become more important as the plan matures.
To put this into context, a stochastic analysis similar to the one described in the previous subsection on the base CPP was performed. As mentioned above, based on the best-estimate assumptions of this report, the FAMCR as at 31 December 2045 is expected to be 1.94%. The FAMCR in the following valuation report as at 31 December 2048 is expected to be 1.93%, but it could deviate from this level due to the 2046-2048 investment experience alone. Based on the stochastic analysis, the probability of the FAMCR as at 31 December 2048 falling outside the 1.8% to 2.1% range due to investment experience during the 2046-2048 period is 32%.
Similar to the base CPP, the probability of the FAMCR falling outside of certain ranges at a given valuation date also depends on the level of the FAMCR of the previous valuation. Table 113 below shows the distribution of the FAMCR at the valuation as at 31 December 2048 due to intervaluation investment experience alone, based on different levels of FAMCRs at the previous valuation. As the SAMCR is four times the value of the FAMCR, the table shows only the FAMCR.
For example, if the FAMCR as at 31 December 2045 were 1.83% instead of 1.94%, then the probability of the FAMCR as at 31 December 2048 falling outside the 1.8% to 2.1% range due to investment experience during the 2046-2048 period is 50%, with most of this probability falling into the below 1.8% ranges. If the FAMCR as at 31 December 2045 were 2.05% instead of 1.94%, then the probability of the FAMCR as at 31 December 2048 falling outside the 1.8% to 2.1% range due to investment experience during the 2046-2048 period is 40%, with most of this probability falling into the above 2.1% ranges.
| FAMCR at 31 December 2048Table 113 footnote 1 | 2045 FAMCR of 1.94% (Best-Estimate) |
Lower 2045 FAMCR of 1.83% | Higher 2045 FAMCR of 2.05% |
|---|---|---|---|
| Below 1.70 | 7 | 26 | 1 |
| 1.70 - 1.79 | 13 | 22 | 3 |
| 1.80 - 2.10 | 68 | 50 | 60 |
| 2.11 - 2.20 | 9 | 2 | 24 |
| Above 2.20 | 3 | 0 | 13 |
|
Table 113 footnotes
|
|||
E.3 Individual Sensitivity Tests
The key best-estimate assumptions used for the projections in this report are described in Appendix B. Individual sensitivity tests have been performed that consist of projecting the financial states of the base and additional CPP using alternative assumptions to illustrate a reasonable range of how experience could vary from the best-estimate projections.
All individual sensitivity tests, except the one for the real rate of return, are deterministic and are based on judgment. The tests for the real rate of return for the base and additional CPP are developed using a stochastic approach. The ranges analyzed for each assumption are described below.
The sensitivity tests were performed by varying most of the key assumptions individually and by keeping the remaining assumptions at their best-estimate levels. Each sensitivity test was categorized as either a lower-cost scenario or a higher-cost scenario. In the lower-cost scenarios for the base and additional CPP, the alternative assumptions have the effect of reducing the MCR and AMCRs. Conversely, the assumptions for the higher-cost scenarios for each component of the CPP increase the minimum contribution rates.
It is possible that a lower-cost scenario for the base CPP may be a higher-cost scenario for the additional CPP, and vice versa. This is the case, for example, for the tests regarding the real wage increase, described below. The opposite effects for the base and additional CPP are attributable to the different financing approaches of the two components.
For both components of the CPP, higher contributions mean eventually higher benefits. However, the impact of changing the factors affecting the amount of contributions (e.g. fertility, immigration, labour markets, real wage, inflation, etc.) on the cost of the Plan differs between the base CPP and the additional CPP depending on:
- The design of benefits, and in particular, the link between contributions and benefits.
- Whether the impact of these factors on the resulting benefits outweigh the impact on contributions.
For the base CPP, due to the nature of steady-state funding, the impact of higher contributions on the cost of the base Plan outweighs the eventual impact of higher resulting benefits. For the additional CPP, given that it is fully funded, there is a stronger link between contributions paid by individuals and the benefits they will receive. As a result, the impact of increased benefits on the cost of the additional Plan outweighs the impact of higher additional contributions.
Finally, although investment income is an important source of revenues for both components of the CPP, the additional CPP relies more heavily on investment income than the base CPP due to its full funding financing. Thus, the cost of the additional Plan is more sensitive to the assumption on the rate of return on investments.
The alternative assumptions selected are intended to represent a wide range of potential long-term experience. However, the individual results cannot simply be combined, because a change in any one particular assumption may have an impact on other assumptions to various degrees. It should also be noted that for both the base and additional Plans, once the lower- and higher-cost assumptions reach their ultimate values, they are held constant for the rest of the 75-year projection period and both components of the CPP are assumed to remain in their current forms.
Table 114 summarizes the alternative assumptions used in the individual sensitivity tests. It is followed by a brief discussion of these tests.
| Canada | Lower Cost | Best-Estimate | Higher Cost | |||
|---|---|---|---|---|---|---|
| 1. Total Fertility RateTable 114 footnote 1 | 1.84 | 1.54 | 1.24 | |||
| 2. Mortality | ||||||
|
Canadian Life Expectancy
at Age 65 in 2050 with Future Improvements |
Males | 20.9 | Males | 23.1 | Males | 25.2 |
| Females | 23.3 | Females | 25.4 | Females | 27.4 | |
| 3. Net Migration RateTable 114 footnote 1 | 0.84% | 0.64% | 0.44% | |||
| 4. Rate of Increase in Prices | 3.0% | 2.0% | 1.0% | |||
| 5. Real Wage Increase | ||||||
|
Base CPP
|
1.5% | 0.9% | 0.3% | |||
|
Additional CPP
|
0.3% | 0.9% | 1.5% | |||
| 6. 75-Year Average Real Rate of Return | ||||||
|
Base CPP
|
5.29% | 3.69% | 2.09% | |||
|
Additional CPP
|
4.47% | 3.27% | 2.07% | |||
| 7. CPP Disability Incidence RatesTable 114 footnote 1 (per 1,000 eligible) |
Males | 1.90 | Males | 2.90 | Males | 3.90 |
| Females | 2.60 | Females | 3.60 | Females | 4.60 | |
|
Table 114 footnotes
|
||||||
The following provides some observations on the selection of assumptions for lower- and higher-cost scenarios and their impacts on the base and additional CPP.
- Fertility Rates: This test is presented only for the base CPP since there is no significant impact on the additional CPP. Experience of Group of 7 (G7) countries (Canada, France, Germany, Italy, Japan, the United Kingdom, and the United States) was used to generate the lower- and higher-cost scenarios over the projection period.
- Mortality Rates: Under the lower-cost scenario, mortality is assumed to improve at a slower rate than under the best-estimate scenario, with ultimate values of the mortality improvement rates gradually reduced to 0% for all ages in 2039. Under the higher-cost scenario, mortality is assumed to improve at a faster pace than under the best-estimate scenario with the ultimate mortality improvement rates being doubled compared to their best-estimate values.
- Net Migration Rate: This test is presented only for the base CPP since there is no significant impact on the additional CPP. The lower-cost and higher-cost assumptions were selected by analyzing historical data and trends.
- Price Increases: Higher price increases result in lower minimum contribution rates for both the base and additional CPP. For both Plans, a higher rate of increase in prices produces higher CPP expenditures, but these increases in costs are outweighed by higher nominal contributory earnings and thus, higher contributions along with higher investment income from higher nominal returns. Conversely, lower price increases results in higher minimum contribution rates for each component of the CPP, with a larger effect observed for the base Plan. The higher-cost and lower-cost scenarios are chosen to represent the lower and upper bounds of the 1% to 3% inflation-control target range of the Bank of Canada and Government.
- Real Wage Increases: Wage increases affect the financial balance of the base and additional CPP in two ways. In the short-term, an increase in the average wage translates into higher contribution income with little immediate impact on benefits. Over the longer term, higher average wages produce higher benefits. Higher real wages have the effect of decreasing the MCR of the base CPP. However, higher real wages result in the AMCRs increasing for the additional Plan. Conversely, lower real wages increase the MCR of the base CPP, but decrease the AMCRs of the additional Plan. The reason for the opposite effects is due to the different financing approaches of the two CPP components that creates a stronger link between contributions and expenditures for the additional Plan. As there is no change in the assumed level of price increases, there is a greater relative impact on the AMCRs compared to the MCR from a change in real wages. Analysis of the aggregate experience of G7 countries was used to generate the lower- and higher-cost scenarios over the 75-year projection period.
- Rate of Return on Investments: These tests were devoped using a stochastic approach. For both CPP components, the lower and higher-cost assumptions represent the ranges such that the averages of the projected rates of return over 75 years for the base and additional Plans will be within these ranges with 80% probability. These ranges differ for the base and additional Plans, since they are based on different asset allocations.
- Disability Incidence Rates: This test is presented only for the base CPP since there is no significant impact on the additional CPP. In addition, sensitivity tests for the assumed disability incidence rates were performed in respect of the disability pension only, since there is limited experience data available regarding the new base CPP post-retirement disability benefit. Based on the disability incidence rate experience since the mid-1990s, lower- and higher-cost scenarios over the 75-year projection period for the Plan were generated.
Results for the Base CPP
Under each sensitivity test, the contribution rate was projected to follow the current legislated rate of 9.9% through 2024, and a new minimum contribution rate (MCR) for the base Plan was determined for 2025 and thereafter. Table 115 summarizes the base Plan MCR and pay-as-you-go rates under each of the sensitivity tests.
| Assumption | Scenario | Minimum Contribution RateTable 115 Footnote 1 | Change in MCR relative to Best Estimate | Pay-As-You-Go Rates | |
|---|---|---|---|---|---|
| 2025 | 2060 | ||||
| blank | Best Estimate | 9.54 | 0.00 | 9.76 | 12.06 |
| 1. Total Fertility Rate | Lower Cost | 9.24 | -0.30 | 9.76 | 11.41 |
| Higher Cost | 9.83 | 0.29 | 9.76 | 12.78 | |
| 2. Mortality Rates | Lower Cost | 9.17 | -0.37 | 9.76 | 11.65 |
| Higher Cost | 9.86 | 0.32 | 9.76 | 12.44 | |
| 3. Net Migration Rate | Lower Cost | 9.20 | -0.34 | 9.75 | 11.12 |
| Higher Cost | 9.84 | 0.30 | 9.76 | 13.04 | |
| 4. Price Increases | Lower Cost | 9.32 | -0.22 | 9.71 | 11.74 |
| Higher Cost | 9.79 | 0.25 | 9.82 | 12.45 | |
| 5. Real Wage Increase | Lower Cost | 9.26 | -0.28 | 9.76 | 11.02 |
| Higher Cost | 9.81 | 0.27 | 9.76 | 13.25 | |
| 6. Real Rate of Return on Investments | Lower Cost | 7.89 | -1.65 | 9.76 | 12.06 |
| Higher Cost | 11.22 | 1.68 | 9.76 | 12.06 | |
| 7. Disability Incidence Rates | Lower Cost | 9.31 | -0.23 | 9.72 | 11.79 |
| Higher Cost | 9.76 | 0.22 | 9.80 | 12.34 | |
|
Table 115 Footnotes
|
|||||
Given how the alternative scenarios were developed, it is difficult to draw conclusions about their relative sensitivities by comparing them with each other. However, it can be seen that the rate of return assumption can have a significant impact on the base Plan MCR. If the average annual real rate of return over the next 75 years is assumed to be 5.29%, then the MCR decreases to 7.89%. However, if the average annual real rate of return over the next 75 years is assumed to be 2.09%, the MCR increases to 11.22%.
Furthermore, a decrease of 100 basis points in the assumed average annual nominal 75-year rate of return would result in the MCR increasing to 10.58%, which on a relative basis, is 11% higher than under the best-estimate assumption. An increase of 100 basis points would result in the MCR decreasing to 8.51%, which on a relative basis, is 11% lower than under the best-estimate assumption.
Unlike the MCR, the pay-as-you-go rates are not affected by the assumed rates of returns on investments. For all other assumptions, the MCR and pay-as-you-go rates do tend to move in the same direction.
Table 116 shows the projected impact on the ratio of the assets to the following year’s expenditures under each of the alternative sets of assumptions if the current legislated contribution rate of 9.9% for the base CPP continues to apply for the year 2022 and thereafter.
| Assumption | Scenario | Asset/Expenditure Ratio | ||
|---|---|---|---|---|
| 2025 | 2060 | 2095 | ||
| blank | Best Estimate | 8.2 | 11.2 | 12.9 |
| 1. Total Fertility Rate | Lower Cost | 8.2 | 11.7 | 17.1 |
| Higher Cost | 8.2 | 10.8 | 8.3 | |
| 2. Mortality Rates | Lower Cost | 8.2 | 12.3 | 19.5 |
| Higher Cost | 8.2 | 10.3 | 8.1 | |
| 3. Net Migration Rate | Lower Cost | 8.2 | 12.5 | 16.8 |
| Higher Cost | 8.2 | 10.1 | 8.8 | |
| 4. Price Increases | Lower Cost | 8.2 | 12.2 | 15.9 |
| Higher Cost | 8.2 | 10.2 | 9.4 | |
| 5. Real Wage Increase | Lower Cost | 8.2 | 12.3 | 15.4 |
| Higher Cost | 8.2 | 10.1 | 9.2 | |
| 6. Real Rate of Return on Investments | Lower Cost | 8.7 | 22.1 | 67.0 |
| Higher Cost | 7.7 | 5.2 | N/A Table 116 Footnote 1 | |
| 7. Disability Incidence Rates | Lower Cost | 8.2 | 12.4 | 16.4 |
| Higher Cost | 8.1 | 10.1 | 9.5 | |
|
Table 116 Footnotes
|
||||
Results for Additional CPP
As for the base Plan, under each scenario, the contribution rates for the additional Plan were projected to follow the current schedule of legislated rates through 2024, and new AMCRs were determined for 2025 and thereafter. Table 117 summarizes the additional Plan AMCRs under each of the scenarios.
| Assumption | Scenario | First Additional Minimum Contribution Rate (FAMCR)Table 117 Footnote 1 | Second Additional Minimum Contribution Rate (SAMCR)Table 117 Footnote 1 | Change in AMCRs relative to Best Estimate |
|---|---|---|---|---|
| blank | Best Estimate | 1.97 | 7.88 | nil - |
| 1. Total Fertility RateTable 117 Footnote 2 | Lower Cost | N/A | N/A | N/A |
| Higher Cost | N/A | N/A | N/A | |
| 2. Mortality Rates | Lower Cost | 1.79 | 7.16 | (0.18)/(0.72) |
| Higher Cost | 2.12 | 8.48 | 0.15/0.60 | |
| 3. Net Migration RateTable 117 Footnote 2 | Lower Cost | N/A | N/A | N/A |
| Higher Cost | N/A | N/A | N/A | |
| 4. Price Increases | Lower Cost | 1.94 | 7.76 | (0.03)/(0.12) |
| Higher Cost | 2.00 | 8.00 | 0.03/0.12 | |
| 5. Real Wage Increase | Lower Cost | 1.79 | 7.16 | (0.18)/(0.72) |
| Higher Cost | 2.18 | 8.72 | 0.25/1.00 | |
| 6. Real Rate of Return on Investments | Lower Cost | 1.38 | 5.52 | (0.59)/(2.36) |
| Higher Cost | 2.86 | 11.44 | 0.89/3.56 | |
| 7. Disability Incidence RatesTable 117 Footnote 2 | Lower Cost | N/A | N/A | N/A |
| Higher Cost | N/A | N/A | N/A | |
|
Table 117 Footnotes
|
||||
When comparing with results from the base CPP, on a relative basis, the AMCRs are significantly more sensitive to changes in mortality, real-wage and investment assumptions than the base CPP MCR. On the other hand, on a relative basis, the AMCRs are not as sensitive to changes in the CPI assumption, and unlike the base CPP MCR, they are not very sensitive to changes in fertility and migration assumptions. Further, the impact of changing the real-wage assumption on the AMCRs is in the opposite direction than for the base CPP MCR.
The differences in relative sensitivities between the AMCRs and the base CPP MCR, as well as the opposite impact of changing the real-wage assumption is due to the different financing approaches of each component of the Plan, as explained at the beginning of this section.
Given how the alternative scenarios were developed, it is difficult to draw conclusions about their relative sensitivities by comparing them with each other. However, it can be seen that the rate of return assumption can have a significant impact on the AMCRs. If an average annual real rate of return of 4.47% is assumed for the 75-year projection period, the FAMCR decreases to 1.38% and the SAMCR to 5.52%. On the other hand, if an average annual real rate of return of 2.07% is assumed over the period, the FAMCR increases to 2.86% and the SAMCR to 11.44%.
Furthermore, a decrease of 100 basis points in the assumed average annual nominal 75-year rate of return would result in the FAMCR and SAMCR increasing to 2.68% and 10.72% respectively, which on a relative basis, is 36% higher than under the best-estimate assumption. An increase of 100 basis points would result in the FAMCR and SAMCR decreasing to 1.46% and 5.84% respectively, which on a relative basis, is 26% lower than under the best-estimate assumption.
Table 118 shows the projected impact on the ratio of the assets to the following year’s expenditures under each of the alternative sets of assumptions if the legislated first additional contribution rate of 2.0% from 2023 onward and the legislated second additional contribution rate of 8.0% from 2024 onward apply for the additional CPP.
| Assumption | Scenario | Asset/Expenditure Ratio | ||
|---|---|---|---|---|
| 2025 | 2060 | 2095 | ||
| blank | Best Estimate | 86.5 | 31.3 | 25.8 |
| 1. Total Fertility RateTable 118 Footnote 1 | Lower Cost | N/A | N/A | N/A |
| Higher Cost | N/A | N/A | N/A | |
| 2. Mortality Rates | Lower Cost | 86.5 | 32.4 | 32.3 |
| Higher Cost | 86.5 | 30.4 | 21.3 | |
| 3. Net Migration RateTable 118 Footnote 1 | Lower Cost | N/A | N/A | N/A |
| Higher Cost | N/A | N/A | N/A | |
| 4. Price Increases | Lower Cost | 86.3 | 32.1 | 27.2 |
| Higher Cost | 86.6 | 30.4 | 24.2 | |
| 5. Real Wage Increase | Lower Cost | 86.6 | 33.2 | 33.2 |
| Higher Cost | 86.3 | 29.6 | 20.4 | |
| 6. Real Rate of Return on Investments | Lower Cost | 88.7 | 42.6 | 65.9 |
| Higher Cost | 84.3 | 23.0 | 7.0 | |
| 7. Disability Incidence RatesTable 118 Footnote 1 | Lower Cost | N/A | N/A | N/A |
| Higher Cost | N/A | N/A | N/A | |
|
Table 118 Footnotes
|
||||
E.4 Higher and Lower Economic Growth
While the best-estimate assumptions in this report reflect moderate sustained economic growth in the future, there is significant uncertainty and volatility surrounding the economic environment. Many factors could lead to long-term economic growth in Canada being different than assumed under the best-estimate scenario. These factors could stem from both domestic and global forces, and include geopolitical conflicts such as the current conflict in Ukraine, health crisis such as the COVID-19 pandemic, extreme weather events due to climate change, the timing and pace of transition to a green economy, the pace of technological advances and innovation, worldwide policies on protectionism vs. globalisation as well as demographic pressures from an aging population.
Given the high level of uncertainty, scenarios of higher and lower economic growth were considered in this report. These alternative economic growth scenarios comprise combinations of individual assumptions according to two cases. For the first case, alternative changes pertaining only to the labour market are considered. The second case builds on the first with alternative assumptions for the real wage increase also considered.
In respect of the labour market, employment levels are reflected in the actuarial projection model through the assumptions made regarding the level of labour force participation and job creation rates by year, age and sex. These rates vary not only with the rate of unemployment, but also reflect trends in increased workforce participation by women, longer periods of formal education among young adults, and trends in the retirement patterns of older workers.
Under the best-estimate scenario, the job creation rate assumption is determined on the basis of expected moderate economic growth and an unemployment rate that is expected to decrease from 7.5% in 2021 to 6.0% in 2022, 5.7% in 2023 and then increase to reach an ultimate level of 6.1% by 2027. Furthermore, the participation rates for all age groups are expected to increase due to the projected increase in labour force participation rates of women, continuing trends toward longer working lives, and the attractive employment opportunities resulting from labour shortages. Under the best-estimate scenario, the participation rate of those aged 18 to 69 for Canada is expected to increase from 76.7% in 2022 to 80.0% in 2035.
For cohorts reaching age 60 in 2022 and thereafter, the retirement benefit take-up rates at age 60 are assumed to be 26.0% and 28.0% for males and females, respectively, and the take-up rates at age 65 are assumed to be 42.5% for males and 43.8% for females in 2031 and thereafter. These rates result in projected average ages at retirement pension take-up in 2031 of 63.6 for males and 63.4 for females.
The best-estimate assumption for the real wage increase is that it reaches an ultimate level of 0.9% by the year 2026. The ultimate real wage increase assumption together with the price increase assumption of 2.0% leads to an ultimate nominal wage increase of 2.9% for 2026 and thereafter.
E.4.1 Higher Economic Growth
Under the higher economic growth scenario, for the labour market, the job creation rate is robust resulting in a lower unemployment level, higher labour force participation rates, and later retirement pension take-up due to the availability of employment and unwillingness to incur early retirement penalties. In addition to the assumed labour market changes, the real wage increase is assumed to be higher than the best estimate.
For this higher economic growth scenario, the job creation rate is assumed to increase at a faster pace than under the best-estimate scenario, resulting in an unemployment rate of 4.1% in 2030 and thereafter. In addition, the assumed ultimate participation rates in 2035 are set to increase to higher levels than the best estimates, and the assumed ultimate gap between male and female participation rates in 2035 for those aged 18 to 69 is set equal to 3.6% as opposed to 6.3% under the best-estimate scenario. This results in an overall participation rate of 85.1% for those aged 18 to 69 in 2035.
The lower unemployment rate and higher participation rate are assumed to encourage individuals to ask for their CPP retirement pension at a later age. Therefore, by 2038, retirement pension take-up rates at age 60 are assumed to gradually decrease to levels that are 20 percentage points lower than the best estimates, i.e. to 6.0% and 8.0% for males and females, respectively. This results in an increase in the projected average age at retirement pension take-up for both sexes combined, from 63.4 years to 64.4 years in 2040. The proportions of working beneficiaries were adjusted to reflect the shift in retirement pension take-up to later ages.
Finally, for the second case, in addition to the assumed changes in the labour market, the real wage increase is assumed to be 1.5% as opposed to 0.9% under the best-estimate scenario. Under this second case, the higher economic growth scenario results in total employment earnings in 2035 being 15% higher compared to the best estimate.
E.4.2 Lower Economic Growth
Under the lower economic growth scenario, for the labour market, the job creation rate increases at a slower pace, resulting in a higher unemployment level and lower labour force participation rates. Insufficient employment opportunities are likely to cause individuals to ask for their CPP retirement pension at an earlier age regardless of the early retirement reduction. In addition to the assumed labour market changes, the real wage increase is assumed to be lower than the best estimate.
For this lower economic growth scenario, the job creation rate is assumed to increase at a slower pace than the best estimate, resulting in an unemployment rate of 8.1% in 2030 and thereafter. In addition, male and female participation rates are assumed to remain constant at their 2021 levels. This results in an overall participation rate of 77.3% for those aged 18 to 69 in 2035.
The higher unemployment rate and lower participation rate are assumed to encourage individuals to ask for their CPP retirement pension at an earlier age. Therefore, retirement pension take-up rates at age 60 are assumed to gradually increase to levels in 2035 that are 20 percentage points higher than the best estimates, i.e. to 46.0% and 48.0% for males and females, respectively. This results in a decrease in the projected average age at retirement pension take-up for both sexes combined, from 63.4 years to 62.5 years in 2040. The proportions of working beneficiaries were adjusted to reflect the shift in retirement pension take-up to earlier ages.
Finally, for the second case,in addition to the assumed changes in the labour market, the real wage increase assumption is assumed to be 0.3% compared to 0.9% under the best-estimate scenario. Under this second case, the lower economic growth scenario results in total employment earnings in 2035 being 11% lower compared to the best estimate.
E.4.3 Results
Table 119 presents a summary of the assumptions used in the sensitivity analysis of economic growth and the resulting minimum contribution rates under the first case where only labour market changes are assumed and the second case where, in addition, real wage increase changes are also assumed.
Under the first case, where only changes to the labour market assumptions are considered, the base Plan MCR is 9.31% under the higher economic growth scenario and 9.80% under the lower economic growth scenario compared to the best-estimate scenario. For the additional Plan, the impact is opposite. AMCRs increase under assumed higher economic growth and decrease under lower economic growth compared to the best estimates. The FAMCR and SAMCR are 2.09% and 8.36%, respectively, under the higher economic growth scenario, and 1.89% and 7.56%, respectively, under the lower economic growth scenario.
Under the second case, where changes to the assumed real wage increase are also considered, the base Plan MCR is 9.11% under the higher economic growth scenario and 10.12% under the lower economic growth scenario. Similar to the first case, the impact on the additional Plan AMCRs is opposite to that for the base Plan MCR. Under the higher economic growth scenario, the FAMCR and SAMCR increase respectively to 2.34% and 9.36%, while under the lower economic growth scenario, the FAMCR and SAMCR decrease respectively to 1.73% and 6.92%.
The AMCRs move in the opposite direction compared to the base Plan MCR due to the differing effects of the real wage increase assumption on the base and additional Plans, which is attributable to their different financing approaches as explained in section E.3.
| Canada | Higher Economic Growth | Best-Estimate | Lower Economic Growth |
|---|---|---|---|
| Case #1: Changes to Labour Market Only | |||
| Participation Rate (age group 18-69) (2035) | 85.1% | 80.0% | 77.3% |
| Unemployment Rate (2030) | 4.1% | 6.1% | 8.1% |
| Average CPP Retirement Benefit Take-up Age (2040) | 64.4 years | 63.4 years | 62.5 years |
| Minimum Contribution Rate (MCR)Table 119 footnote 1 | 9.31% | 9.54% | 9.80% |
| Additional Minimum Contribution Rates (AMCRs)Table 119 footnote 2 | 2.09% / 8.36% | 1.97% / 7.88% | 1.89% / 7.56% |
| Case #2: Changes to Labour Market and Real Wage Increase | |||
| Participation Rate (age group 18-69) (2035) | 85.1% | 80.0% | 77.3% |
| Unemployment Rate (2030) | 4.1% | 6.1% | 8.1% |
| Average CPP Retirement Benefit Take-up Age (2040) | 64.4 years | 63.4 years | 62.5 years |
| Real Wage Increase | 1.5 % (2026+) | 0.9 % (2026+) | 0.3 % (2024+) |
| Minimum Contribution Rate (MCR)Table 119 footnote 1 | 9.11% | 9.54% | 10.12% |
| Additional Minimum Contribution Rates (AMCRs)Table 119 footnote 2 | 2.34% / 9.36% | 1.97% / 7.88% | 1.73% / 6.92% |
|
Table 119 Footnotes
|
|||
E.5 Assessing and Illustrating Downside Risks
This section focuses on assessing and illustrating downside risks due to potential or emerging trends. It illustrates the potential impacts on the base CPP MCR of a widening gap in earnings between lower and higher earners, of three hypothetical transition scenarios to a green economy, as well as of a stagflation scenario. Since the additional CPP is still at its early stages, this section focuses on the base CPP only. Furthermore, given the purpose of the section, only adverse scenarios are presented. The section is not meant to represent forecasts or predictions, and should be interpreted with caution.
E.5.1 Change in Earners and Earnings Distributions
Earners and earnings distribution have an impact on the amounts of contributions paid to the CPP, and eventually the amount of benefits paid from the Plan. The best-estimate scenario assumes a stable distribution of earners and earnings by level over time. In particular, the same nominal wage increase (real wage increase plus inflation) is applied to all earners independent of their level of earnings.
In the future, the pattern of increase in earnings by level may change as the profile of the labour force evolves. New technologies, automatization, labour shortages and evolving skills requirements are among the factors that can influence earnings and earners distributions. These factors could lead to widening the earnings gap between lower and higher earners. A scenario was developed for this report in order to illustrate the potential impact on the base CPP MCR of a widening earnings gap between lower and higher earners.
Under the considered scenario, instead of having uniform wage increases for all earners over the projection period, different wage increases are assumed until 2045 based on the level of earnings. After 2045, uniform wage increases in line with the best-estimate assumption are applied. Under this scenario, earners were split into three categories as follows:
- Lower level earners with earnings between 0% and 75% of the average earnings: the nominal growth in their earnings until 2045 is assumed to be 1.5% pear year.
- Middle level earners with earnings between 75% and 150% of the average earnings: the nominal growth in their earnings until 2045 is assumed to be 2.6% per year.
- Higher level earners with earnings above 150% of the average earnings: the nominal growth in their earnings until 2045 is assumed to be 3.5% per year.
Despite different increases by earnings level until 2045, the overall increase in nominal earnings is consistent with the nominal increase in wages assumed under the best-estimate scenario. Projected total earnings for the scenario are therefore the same as under the best-estimate assumptions over the entire projection period.
While the projected total earnings are the same as under the best-estimate assumptions, this alternative scenario would result in both lower total contributory earnings (total earnings between YBE and YMPE), as well as lower average contributory earnings due to the different earnings distributions. Under the alternative scenario, in 2050, the total contributory earnings are projected to be about 7.0% lower than under the best-estimate scenario. The corresponding decrease in average contributory earnings is 6.8%. Although the corresponding expenditures are also expected to decrease over time, the impact of the immediate decrease in contributions outweighs the impact of the deferred and gradual decrease in expenditures, resulting in a higher base CPP MCR under the considered alternative scenario. As a result, the MCR for the base CPP would increase by 0.34 percentage points, leading to an MCR of 9.88% for year 2034 and thereafter.
E.5.2 Stagflation
Stagflation is characterized by a simultaneous economic stagnation and increase in inflation. During the 1970s and 1980s, the Canadian economy went through a period of stagflation that was partly caused by oil price increases as a result of supply shocks. This led to rising consumer prices and wages. The stagflation period ended when the Bank of Canada increased interest rates in the early 1980s, which led the economy to a recession.
The COVID-19 pandemic caused supply chain disruptions, shortages of labour and products, higher energy prices and led to higher consumer prices in 2021. Moreover, the escalation of the conflict in Ukraine exerts an additional pressure on the global economy and adds to the price pressures. This concurrence of events could lead to unanchored inflation, and actions aimed at containing inflation could lead to increases in unemployment rates.
While under the best-estimate assumptions, it is assumed that a stagflation scenario will not occur, this subsection presents the impact of a hypothetical stagflation scenario on the MCR.
Under the assumed stagflation scenario, inflation is projected to be high and above the Bank of Canada’s target for ten years, which is consistent with the length of period of higher inflation that followed the first oil price shock in the 1970s. The inflation is projected to increase from 6.9% in 2022 to 10.0% in 2023 and stay at that level in 2024. It is then projected to decrease gradually to reach an ultimate value of 2.0% in 2032.
Under this scenario, firms are expected to raise their prices to offset the increase in expenses. Higher prices will eventually slow household spending and result in an economic slowdown. As such, it is assumed that unemployment rates will be higher than under the best-estimate assumptions for a period of 10 years from 2024. The unemployment rate is assumed to reach 8.0% in 2024 and increase to 10.0% by 2026. Afterward, it is assumed to decrease gradually to an ultimate value of 6.1% in 2034.
It is assumed that 50% of the inflation is integrated in nominal wage increases from 2023 to 2025. That percentage is assumed to increase gradually to an ultimate of 100% in 2030. The real-wage increases over the period 2023-2029 are therefore lower than under the best-estimate assumption. Furthermore, it is assumed that two thirds of inflation increases are integrated in base CPP returns up until 2031, leading to lower real rates of return than under the best-estimate assumptions.
Under the stagflation scenario, the base CPP MCR increases by 0.31 percentage points to 9.85% for year 2034 and thereafter. Under the base CPP, higher inflation normally leads to lower MCRs given that the impact of higher nominal wages (i.e. more contributions) and investment returns outweigh the impact of higher expenditures. However, in the stagflation scenario, only part of the inflation is reflected in nominal wage increases and returns, while it is fully reflected in expenditures. The increase in the MCR is therefore mainly the result of the fact that the projected expenditures reflect the full inflation while the projected revenues (both contributions and investment earnings) do not.
E.5.3 Climate Change
Context
Based on the World Economic Forum’s Global Risk Report 2022Footnote 17, five of the top ten most severe global risks over the next ten years are related to climate change. Climate change risks are generally classified into two categories: physical risks, which are linked to the increase in the frequency and severity of climate events and transition risks, which are linked to efforts undertaken for a transition towards a lower carbon economy.
Physical and transition risks are strongly interconnected. Transitioning to a green economy may create short- and medium-term economic and financial disruptions while reducing physical risks in the longer term. On the other hand, if insufficient actions are taken to transition to a lower carbon economy, physical risks may compound and increase significantly.
It is also important to note that regardless of the transition path, full elimination of physical risks is not realisticFootnote 18 at this point given that a certain level of physical risk is already embedded from past global warming. However, physical risks may be reduced or mitigated if new technologies are developed that reduce and/or capture carbon emissions.
Since such technologies are not readily available yet, there is general consensus that climate change will have an overall negative impact on society and the economy worldwide. Given the magnitude of the potential socio-economic impacts, climate change may also have an impact on social programs such as the CPP.
Climate change can affect the CPP through various channels. The demographic, economic and investment environments can all be affected by climate change in the future. However, there is a lot of uncertainty on the direction and magnitude of these potential impacts, and the risk is evolving constantly. In addition, research and data to quantify the full impact of climate change on the demographic, economic and investment environments are incomplete and, in certain cases, somewhat conflicting.
In view of the high level of uncertainty, the current best practice is to conduct scenario analysis rather than incorporate future climate policy and the potential impact of technology into best-estimate assumptions. Given the potential implications of climate change on the CPP, this section uses information from publicly available sources to illustrate a range of potential impacts on the base CPP MCR.
It important to note that this section focuses on assessing downside risk only, and that the analysis is based on scenarios that are intentionally adverse. New technologies and business opportunities related to a transition to a lower carbon economy may also create positive outcomes that are outside the scope of this section. The section is therefore not meant to represent forecasts or predictions.
Illustrative Scenarios
Over the last few years, many global organizations and regulators have been conducting climate scenario analysis in order to assess risk, and they have been publishing the results of their findings. The risk assessments focus on a range of variables under various climate path scenarios. The climate path scenarios are normally broadly based on the Representative Concentration Pathways or Shared Socio-Economic Pathways used in the Intergovernmental Panel on Climate Change’s Fifth and Sixth Assessment ReportsFootnote 19, Footnote 20.
One important variable that is often analysed in these publications is the gross domestic product (GDP). It has the advantage of being a well understood and broadly used measure. Conceptually, it is also an overarching macro-economic variable that can be used to adjust the future economic and investment environment.
After reviewing various published articles and research papers on climate change scenario analysis, three scenarios with different pathways of Canadian GDP growth rates relative to a baseline scenarioFootnote 21 are selected to assess the impact on the base CPP MCR.
Scenario 1 can be generally classified in the ‘orderly transition’ category of scenarios. It therefore assumes that successful climate policies are introduced early and gradually in order to limit global warming. Canadian GDP growth rates are lower relative to the baseline scenario starting in 2020, mainly caused by disruption in the economy from implementation of climate change policies. The cumulative difference in GDP projections relative to the baseline scenario grows to -10% by 2050, then stay constant until 2100.
Scenario 2 can be generally classified in the ‘disorderly/delayed transition’ category of scenarios. It assumes that climate change policies only start in 2030. There is therefore no impact on GDP relative to the baseline scenario until 2030. However, late action leads to a stronger impact than scenario 1 after 2030. The cumulative difference relative to the baseline scenario is 0% by 2030, -15% by 2050 and -20% by 2100.
Scenario 3 can be generally classified in the ‘failed transition’ category of scenarios. It assumes that no further climate change policies are implemented. Although the difference relative to the baseline scenario is lower than the other scenarios through 2050, the compound physical risks resulting from no further climate action creates severe impacts between 2050 and 2100. The cumulative difference relative to the baseline scenario is 0% by 2030, -8% by 2050 and -30% by 2100.
Chart 17 shows the difference in Canadian GDP growth rates relative to the baseline scenario for each scenario.
Chart 17 Illustrative Climate Scenarios – Cumulative Canadian GDP Impact Relative to Baseline Scenario
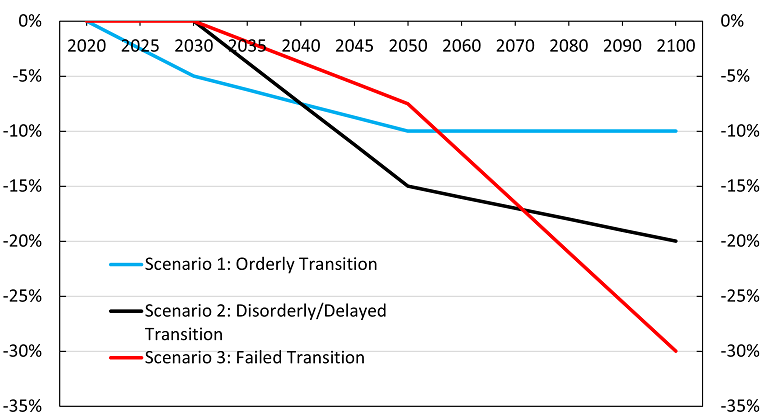
Text description: Chart 17 Illustrative Climate Scenarios – Cumulative Canadian GDP Impact Relative to Baseline Scenario
Line chart showing cumulative Canadian GDP impact relative to baseline scenario under three alternate climate scenarios. Y axis represents the percent impact on the cumulative Canadian GDP relative to baseline. X axis shows the year.
Scenario 1 - Orderly Transition: Starts at 0% at year 2020 decreases linearly until 2030 when it reaches -5% then it continues to decrease linearly at a slower pace to reach -10% at 2050 where it remains until 2100.
Scenario 2 – Disorderly/Delayed Transition: Starts at 0% at year 2020 and remains at 0% until 2030 when it decreases linearly until 2050 at -15% and then starts to decrease linearly at a slower pace until 2100 when it reaches -20%.
Scenario 3 – Failed Transition: Starts at 0% at year 2020 and remains at 0% until 2030 when it decreases linearly until 2050 at -8% and then starts to decrease linearly at a faster pace until 2100 when it reaches -30%.
| Scenarios | 2020 | 2025 | 2030 | 2035 | 2040 | 2045 | 2050 | 2060 | 2070 | 2080 | 2090 | 2100 |
|---|---|---|---|---|---|---|---|---|---|---|---|---|
| Scenario 1: Orderly Transition | 0% | -2.50% | -5% | -6.3% | -7.5% | -8.8% | -10% | -10% | -10% | -10% | -10% | -10% |
| Scenario 2: Disorderly/Delayed Transition | 0% | 0% | 0% | -3.8% | -7.5% | -11.3% | -15% | -16% | -17% | -18% | -19% | -20% |
| Scenario 3: Failed Transition | 0% | 0% | 0% | -1.9% | -3.8% | -5.6% | -8% | -12% | -17% | -21% | -26% | -30% |
Methodology
The scenarios above are translated into potential impacts on the base CPP MCR, using the following simplified approach:
- Changes in Canadian GDP growth are translated one-for-one into changes in total employment earnings growth through the real wage assumption.
- Changes in global GDP growth are also incorporated in the assumed investment returns through the growth in earnings component which is proxied by global GDP growth per capita. The growth in earnings is used to develop the assumption on rates of return on public equities, private equities and real assets. In 2030, these three asset classes are expected to represent about 73% of the CPP investment portfolio. For simplicity, changes in global GDP growth were proxied by the changes in Canadian GDP growth shown in the Chart 17. Table 120 shows the assumed average annual real rate of return for each scenario for the 75-year period 2022-2096.
| Scenario | 2022-2096 |
|---|---|
| Best-Estimate | 3.69 |
| Scenario 1: Orderly Transition | 3.60 |
| Scenario 2: Disorderly/Delayed Transition | 3.52 |
| Scenario 3: Failed Transition | 3.38 |
This simplified model allows for an initial assessment of climate change risk on the CPP. The OCA will conduct further research in the future and collaborate with other professionals on the topic with the objective of refining the model as well as incorporating more relevant variables and their dynamics.
Results
The impact on the base CPP MCR for each scenario is shown in Table 121. It is important to note that these hypothetical scenarios are intentionally adverse. They are meant to illustrate downside risks only and are not meant to be forecasts or predictions.
| Scenario | MCR | Change Relative to Best-Estimate |
|---|---|---|
| Best-Estimate | 9.54 | nil - |
| Scenario 1: Orderly Transition | 9.75 | 0.21 |
| Scenario 2: Disorderly/Delayed Transition | 9.94 | 0.40 |
| Scenario 3: Failed Transition | 10.06 | 0.52 |
Appendix F – Acknowledgements
Employment and Social Development Canada provided statistics on the Canada Pension Plan contributors, beneficiaries, and assets.
The CPP Investment Board provided data on the Canada Pension Plan assets.
Statistics Canada provided information on Canadian demographic and economic variables.
The Canadian Human Mortality Database (CHMD) created by the Department of Demography, Université de Montréal has been used for the historical mortality data for years up to 2011.
The Canada Life Tables (CLT) created by Statistics Canada have been used for the historical mortality data for years 2011 to 2020.
The Canada Revenue Agency provided information on Canada Pension Plan contributors and contributions.
The co-operation and able assistance received from the above-mentioned data providers deserve to be acknowledged.
The following people assisted in the preparation of this report:
- Shayne Barrow, ACIA, ASA
- François Boulé, FCIA, FSA
- Yu Cheng, ASA
- Maxime Delisle, FCIA, FSA, CERA
- Mathieu Désy, FCIA, FSA, CFA
- Bojan Dimitrijevic
- Patrick Dontigny, ASA
- Julie Fortier
- Laurence Frappier, FCIA, FSA
- Sari Harrel, FCIA, FSA
- Anita Payan
- Ali Jazzar
- Pascale Jomphe, ACIA, ASA
- Adam Kearney
- Nicholas Landry, ACIA, ASA
- Kelly Moore
- Louis-Marie Pommainville, FCIA, FSA
- Jackie Ruan, FCIA, FCAS
- Thierry Truong, FCIA, FSA
Footnotes
- Footnote 1
-
For the purpose of a CPP actuarial report, a subsequent event is one which first comes to the attention of the Chief Actuary after the valuation date but before the report date.
- Footnote 2
-
Amendments are pending provincial approval.
- Footnote 3
-
More information on the CPP independent peer review process and past reviews can be found at http://www.osfi-bsif.gc.ca/Eng/oca-bac/ipr-rip/Pages/default.aspx
- Footnote 4
-
The Budget Implementation Act, 2022, No. 1, which received Royal Assent on 23 June 2022, contains technical amendments to the CPP statute. These amendments, which are pending provincial approval, are already reflected in this 31st CPP Actuarial Report, as described in Section 2.2 of this report.
- Footnote 5
-
All provinces and territories have subsequently signed a Canada-Wide Early Learning and Child Care Plan (CWELCC) agreement with the federal Government.
- Footnote 6
-
Over the last decade, Canada has been faced with an important increase in accidental drug poisoning deaths and the COVID-19 pandemic has exacerbated the issue.
- Footnote 7
-
As of June 2022
- Footnote 8
-
For a given year, the value in 2022 wage-adjusted dollars is equal to the corresponding value in current dollars divided by the cumulative projected increase in nominal wage since 2022.
- Footnote 9
-
All provinces and territories have subsequently signed a Canada-Wide Early Learning and Child Care Plan (CWELCC) agreement with the federal Government.
- Footnote 10
-
https://www.bankofcanada.ca/2021/12/joint-statement-of-the-government-of-canada-and-the-bank-of-canada-on-the-renewal-of-the-monetary-policy-framework/
- Footnote 11
-
Population of Canada less that of Québec
- Footnote 12
-
President’s message; CPPIB Fiscal Year 2021 Annual Report
- Footnote 13
-
Although the CPPIB current base CPP reference portfolio is 85% equity and 15% fixed income with an estimated one-year standard deviation of 13.9%, its’ actual portfolio as at 31 December 2021 corresponds to a hypothetical reference portfolio of 82% equity and 18% fixed income with an estimated one-year standard deviation of 12.4%.
- Footnote 14
-
As at 31 December 2021, under the closed group approach, the actuarial obligations of the base Plan are equal to $1,686.1 billion, the assets are $543.7 billion, and the assets shortfall is equal to $1,142.4 billion.
- Footnote 15
-
As at 31 December 2021, under the closed group approach, the actuarial obligations of the additional Plan are equal to $12.2 billion, the assets are $11.0 billion, and the assets shortfall is equal to $1.2 billion.
- Footnote 16
-
A normal distribution was assumed for simplicity as it adequately reflects most investment outcomes.
- Footnote 17
-
The Global Risks Report 2022, 17th Edition - Insight report (weforum.org) (PDF, 5.6 Mb)
- Footnote 18
-
Summary for Policymakers (ipcc.ch) (PDF, 3.2 Mb) (Section 8B.5)
- Footnote 19
-
AR5 Synthesis Report - Climate Change 2014, Synthesis Report (ipcc.ch) (PDF, 13.9 Mb)
- Footnote 20
-
Synthesis report of the IPCC sixth assessment report (AR6) (PDF,10.7 Mb)
- Footnote 21
-
The baseline scenarios in publicly available reports can vary and are not defined; therefore, they can’t be assessed against the best-estimate assumptions of this report. For illustration purposes only, the differences relative to the baseline scenarios were applied to the best-estimate assumptions of this report.