33rd Actuarial Report supplementing the Revised 32nd Actuarial Report on the Canada Pension Plan
28 May 2026
The Honourable François-Philippe Champagne, P.C., M.P.
Minister of Finance and National Revenue
House of Commons
Ottawa, Canada
K1A 0A6
Dear Minister:
I am pleased to submit the 33rd Actuarial Report supplementing the Revised 32nd Actuarial Report on the Canada Pension Plan as at 31 December 2024. This report is prepared in accordance with subsections 115(2) and 115(3) of the Canada Pension Plan to show the effect of decreasing the statutory base CPP contribution rate following the introduction of Bill C-30 –Spring Economic Update 2026 Implementation Act.
Yours sincerely,
Assia Billig, FCIA, FSA, PhD
Chief Actuary
Table of contents
List of tables
- Table 1 Financial projections – base CPP after amendment, statutory contribution rate of 9.9% in 2025 and 2026, 9.5% for 2027+
- Table 2 Sources of revenues and funding of expenditures – base CPP after amendment, statutory contribution rate of 9.9% in 2025 and 2026, 9.5% for 2027+
- Table 3 Financial projections – base CPP after amendment, minimum contribution rate of 9.22% for 2028 to 2033, 9.20% for 2034+
- Table 4 Base CPP balance sheet (open group basis) after amendment
1 Highlights of the report
This report confirms that if the base CPP is amended as per Division 5 of Part 3 of Bill C-30 – Spring Economic Update 2026 Implementation Act, the reduced statutory contribution rate of 9.5% for the year 2027 and thereafter is sufficient to finance the base CPP over the long term. The following table provides the highlights of this report. The financial measures shown are those that have changed relative to the Revised 32nd CPP Actuarial Report.
| Base CPP after amendment | Change from 32nd CPP Actuarial Report | |
|---|---|---|
| Statutory contribution rate | 9.9% in 2025 and 2026, 9.5% for 2027 and thereafter | The statutory contribution rate is 40 basis points lower for 2027 and thereafter. |
| Contributions under statutory contribution rate |
|
|
| Assets under statutory contribution rate |
|
|
| Minimum contribution rate needed to sustain the base CPP |
|
|
2 Introduction
2.1 Purpose and basis of the report
This is the 33rd Actuarial Report on the Canada Pension Plan (33rd CPP Actuarial Report) since the inception of the Canada Pension Plan (CPP or the Plan) in 1966.
This report has been prepared in compliance with subsections 115(2) and (3) of the Canada Pension Plan, which provides that an actuarial report be prepared whenever a Bill is introduced in the House of Commons to amend the Canada Pension Plan in a manner that materially affects the estimates contained in the most recent report. The most recent report is the 32nd CPP Actuarial Report as at 31 December 2024, which was tabled in the House of Commons on 8 December 2025 with a revised report (Revised 32nd CPP Actuarial Report) containing minor revisions tabled in the House of Commons on 27 May 2026.
The purpose of this 33rd CPP Actuarial Report is to show the effect of decreasing the statutory base CPP contribution rate in accordance with Division 5 of Part 3 of Bill C-30 – An Act to implement certain provisions of the spring economic update tabled in Parliament on April 28, 2026 (short title: Spring Economic Update 2026 Implementation Act). Under Bill C-30, the base CPP combined employer-employee statutory contribution rate of 9.9% would decrease by 40 basis points to 9.5%, and the contribution rate of 4.95% paid by both employers and employees would decrease by 20 basis points to 4.75%, effective 1 January 2027. The new rates would apply to the same band of earnings as the current base CPP statutory rate, that is, on earnings above the Year's Basic Exemption of $3,500 up to the Year's Maximum Pensionable Earnings. Bill C-30 also contains corresponding technical amendments to the insufficient rates provisions of the Canada Pension Plan for consistency with the proposed reduction of the base CPP statutory contribution rate. Those technical amendments have no impact on the financial estimates in this report. All other provisions of the Canada Pension Plan remain unchanged.
The financial estimates in this report are based on the data, methodologies and best-estimate assumptions of the Revised 32nd CPP Actuarial Report modified only to reflect the reduction in the base CPP statutory contribution rate. A description of the data, methodologies and assumptions is presented in the Revised 32nd CPP Actuarial Report.
All mentions of the base CPP or base Plan are used interchangeably herein and refer to that component of the CPP, which is separate from the other CPP component - the additional CPP or Plan that commenced 1 January 2019.
This report presents projections of the base CPP revenues and expenditures over a long period of time (more than 75 years). Given the length of the projection period and the number of assumptions required, it is unlikely that actual future experience will develop precisely in accordance with the best-estimate projections.
This 33rd CPP Actuarial Report is intended solely for the above purpose. It was prepared to meet that specific objective and may not be suitable for any other purposes prior to obtaining approval from the Office of the Chief Actuary (OCA).
For any questions regarding the proper use of this report, please contact the OCA.
2.2 Scope of the report
The scope of this report is limited to the assessment of the impact of the reduction in the base CPP statutory contribution rate as described in section 2.1 above. Accordingly, the information presented focuses on the elements of the Revised 32nd CPP Actuarial Report that are materially affected by this amendment.
Section 3 presents the results, which include the projections of the revenues, expenditures, and assets for the base Plan over more than the next 75 years and the actuarial balance sheet as at 31 December 2024 and 2030. The actuarial opinion is then provided in section 4.
2.3 Subsequent events
For this 33rd CPP Actuarial Report, there were no subsequent events, i.e. events which became known to the Chief Actuary after the valuation date, but before the report date, and that were deemed to have an effect on the financial state of the CPP as at the valuation date or during the projection period.
The Canadian and global economies are going through a period of heightened uncertainty, due in part to escalating trade tensions, environmental risks, and geopolitical conflicts. The future impacts of these issues and risks on the financial state of the CPP are still uncertain and evolving, and as such, they have not been recognized as subsequent events for the purpose of this report.
3 Results
3.1 Overview
This section presents financial projections in respect of the base CPP with the statutory contribution rate reduced to 9.5% effective 1 January 2027 as per Bill C-30. All mentions of the contribution rate that follow refer to the statutory combined employee-employer contribution rate for the base Plan, unless otherwise indicated.
As only the statutory contribution rate for the base CPP would change with no other changes to methodologies or assumptions, the projected contributory earnings and expenditures for the base CPP would remain the same as under the Revised 32nd CPP Actuarial Report. The lower statutory contribution rate for the base CPP would thus lead to lower contributions, which in turn would lead to lower projected investment income and assets over time compared to the Revised 32nd CPP Actuarial Report.
The following sections present the projections of these key financial components under the reduced statutory contribution rate, as well as their implications for the base CPP minimum contribution rate (MCR, as described below in section 3.3) and other indicators of the long‑term financial sustainability of the base CPP. Only results that differ materially from those presented in the Revised 32nd CPP Actuarial Report are shown.
3.2 Financial projections of base CPP with reduced statutory contribution rate
Table 1 presents the projected financial state of the amended base CPP, using the reduced statutory contribution rate of 9.5% effective 1 January 2027. The following observations can be made from this table in comparison with Table 11 of the Revised 32nd CPP Actuarial Report:
- The contributions are 4% lower for the year 2027 and onward relative to the Revised 32nd CPP Actuarial Report.
- Starting in 2027, contributions are projected to be lower than expenditures, which is four years earlier than projected under the Revised 32nd CPP Actuarial Report.
- The base CPP assets are projected to increase from $651 billion at the end of 2024 to $2.7 trillion in 2050 and $19 trillion by 2100, which are respectively 8% and 30% lower than under the Revised 32nd CPP Actuarial Report.
- The assets to expenditures ratio under the reduced statutory contribution rate is projected to increase from 9.7 in 2025 to 13.0 in 2050 and to 14.5 by 2100. These values are lower compared to the corresponding assets to expenditures ratios of 14.1 in 2050 and 20.7 in 2100 under the Revised 32nd CPP Actuarial Report.
| Year | PayGo rate (%) |
Contribution rate (%) |
Contributory earnings ($ million) |
Contributions ($ million) |
Expenditures ($ million) |
Net cash flows ($ million) |
Net investment incomeTable 1 Footnote 2 ($ million) |
Assets at 31 Dec. ($ million) |
Net rate of return Table 1 Footnote 1, Table 1 Footnote 2 (%) |
Assets/ expenditures ratio |
|---|---|---|---|---|---|---|---|---|---|---|
| 2025 | 9.29 | 9.9 | 733,218 | 72,589 | 68,119 | 4,470 | 42,313 | 697,399 | 6.41 | 9.7 |
| 2026 | 9.47 | 9.9 | 756,595 | 74,903 | 71,679 | 3,224 | 45,139 | 745,762 | 6.39 | 9.9 |
| 2027 | 9.51 | 9.5 | 794,101 | 75,440 | 75,521 | (82) | 47,642 | 793,323 | 6.32 | 10.0 |
| 2028 | 9.58 | 9.5 | 829,989 | 78,849 | 79,532 | (684) | 50,412 | 843,051 | 6.29 | 10.1 |
| 2029 | 9.72 | 9.5 | 861,449 | 81,838 | 83,720 | (1,883) | 53,290 | 894,459 | 6.27 | 10.2 |
| 2030 | 9.85 | 9.5 | 893,245 | 84,858 | 88,006 | (3,147) | 56,196 | 947,507 | 6.23 | 10.3 |
| 2031 | 9.96 | 9.5 | 927,034 | 88,068 | 92,365 | (4,297) | 59,233 | 1,002,443 | 6.21 | 10.4 |
| 2032 | 10.05 | 9.5 | 962,880 | 91,474 | 96,747 | (5,273) | 62,430 | 1,059,600 | 6.19 | 10.5 |
| 2033 | 10.12 | 9.5 | 999,736 | 94,975 | 101,179 | (6,204) | 65,707 | 1,119,103 | 6.16 | 10.6 |
| 2034 | 10.18 | 9.5 | 1,037,774 | 98,589 | 105,669 | (7,081) | 69,189 | 1,181,212 | 6.15 | 10.7 |
| 2035 | 10.23 | 9.5 | 1,077,475 | 102,360 | 110,244 | (7,884) | 72,800 | 1,246,128 | 6.13 | 10.8 |
| 2036 | 10.30 | 9.5 | 1,115,651 | 105,987 | 114,878 | (8,892) | 76,614 | 1,313,850 | 6.12 | 11.0 |
| 2037 | 10.35 | 9.5 | 1,155,755 | 109,797 | 119,576 | (9,779) | 80,532 | 1,384,603 | 6.10 | 11.1 |
| 2038 | 10.39 | 9.5 | 1,197,087 | 113,723 | 124,350 | (10,627) | 84,608 | 1,458,584 | 6.08 | 11.3 |
| 2039 | 10.43 | 9.5 | 1,239,659 | 117,768 | 129,242 | (11,474) | 88,876 | 1,535,986 | 6.07 | 11.4 |
| 2040 | 10.47 | 9.5 | 1,282,894 | 121,875 | 134,283 | (12,408) | 93,434 | 1,617,012 | 6.06 | 11.6 |
| 2041 | 10.50 | 9.5 | 1,328,216 | 126,181 | 139,497 | (13,317) | 98,212 | 1,701,907 | 6.05 | 11.7 |
| 2042 | 10.54 | 9.5 | 1,374,507 | 130,578 | 144,869 | (14,290) | 102,828 | 1,790,445 | 6.02 | 11.9 |
| 2043 | 10.58 | 9.5 | 1,421,930 | 135,083 | 150,414 | (15,331) | 108,167 | 1,883,281 | 6.02 | 12.1 |
| 2044 | 10.62 | 9.5 | 1,470,877 | 139,733 | 156,181 | (16,447) | 113,755 | 1,980,588 | 6.02 | 12.2 |
| 2045 | 10.66 | 9.5 | 1,521,171 | 144,511 | 162,211 | (17,700) | 119,606 | 2,082,495 | 6.02 | 12.4 |
| 2046 | 10.72 | 9.5 | 1,572,061 | 149,346 | 168,526 | (19,181) | 125,729 | 2,189,043 | 6.02 | 12.5 |
| 2047 | 10.78 | 9.5 | 1,624,757 | 154,352 | 175,137 | (20,785) | 132,128 | 2,300,386 | 6.02 | 12.6 |
| 2048 | 10.84 | 9.5 | 1,678,961 | 159,501 | 182,074 | (22,572) | 138,812 | 2,416,626 | 6.02 | 12.8 |
| 2049 | 10.92 | 9.5 | 1,734,294 | 164,758 | 189,387 | (24,629) | 145,784 | 2,537,781 | 6.02 | 12.9 |
| 2050 | 11.01 | 9.5 | 1,790,525 | 170,100 | 197,144 | (27,045) | 153,044 | 2,663,780 | 6.02 | 13.0 |
| 2051 | 11.10 | 9.5 | 1,850,791 | 175,825 | 205,403 | (29,578) | 160,594 | 2,794,796 | 6.02 | 13.1 |
| 2052 | 11.19 | 9.5 | 1,912,875 | 181,723 | 214,122 | (32,399) | 168,439 | 2,930,835 | 6.02 | 13.1 |
| 2053 | 11.30 | 9.5 | 1,976,617 | 187,779 | 223,283 | (35,505) | 176,579 | 3,071,909 | 6.02 | 13.2 |
| 2054 | 11.41 | 9.5 | 2,041,750 | 193,966 | 232,943 | (38,977) | 185,013 | 3,217,946 | 6.02 | 13.2 |
| 2055 | 11.53 | 9.5 | 2,108,774 | 200,334 | 243,200 | (42,866) | 193,736 | 3,368,816 | 6.02 | 13.3 |
| 2060 | 12.20 | 9.5 | 2,475,330 | 235,156 | 302,028 | (66,872) | 241,526 | 4,193,923 | 6.02 | 13.3 |
| 2065 | 12.73 | 9.5 | 2,912,278 | 276,666 | 370,805 | (94,138) | 296,816 | 5,148,697 | 6.02 | 13.3 |
| 2070 | 13.09 | 9.5 | 3,435,340 | 326,357 | 449,772 | (123,414) | 361,401 | 6,265,244 | 6.02 | 13.4 |
| 2075 | 13.40 | 9.5 | 4,047,374 | 384,501 | 542,366 | (157,866) | 437,296 | 7,577,326 | 6.02 | 13.5 |
| 2080 | 13.66 | 9.5 | 4,759,241 | 452,128 | 650,004 | (197,876) | 526,362 | 9,117,411 | 6.02 | 13.5 |
| 2085 | 13.78 | 9.5 | 5,599,158 | 531,920 | 771,599 | (239,679) | 631,797 | 10,943,605 | 6.02 | 13.7 |
| 2090 | 13.80 | 9.5 | 6,594,010 | 626,431 | 910,299 | (283,868) | 758,664 | 13,144,506 | 6.02 | 14.0 |
| 2095 | 13.84 | 9.5 | 7,766,468 | 737,814 | 1,074,924 | (337,109) | 912,498 | 15,813,737 | 6.02 | 14.2 |
| 2100 | 13.93 | 9.5 | 9,137,861 | 868,097 | 1,273,123 | (405,026) | 1,098,323 | 19,036,512 | 6.02 | 14.5 |
|
Table 1 Footnotes
|
||||||||||
The reduction in the base CPP contribution rate alters both the level and composition of revenues available to finance the expenditures of the base Plan. Relative to the Revised 32nd CPP Actuarial Report, contribution revenues are lower for all years from 2027 onward, resulting in a greater reliance on investment income to fund expenditures over time. On the other hand, a lower share of total revenues is projected to be derived from net investment income from the late 2030s onward. The impact of the reduced contribution rate on the sources of revenues and funding of expenditures increases gradually over time due to the compounding effect of lower contributions on asset accumulation and subsequent investment income.
Table 2 presents the sources of revenues required to cover the expenditures of the amended base CPP, using the reduced contribution rate of 9.5% effective 1 January 2027. The following observations can be made from this table in comparison with Table 13 of the Revised 32nd CPP Actuarial Report:
- Total revenues are projected to be $115 billion in 2025, unchanged from the Revised 32nd CPP Actuarial Report. They are projected to be $323 billion in 2050 and $2.0 trillion by 2100, which are respectively 6% and 20% lower than projected under the Revised 32nd CPP Actuarial Report.
- Investment income is projected to represent about 37% of revenues in 2025, unchanged from the Revised 32nd Actuarial Report. This proportion is expected to continue increasing over time, reaching 47% in 2050 and 56% by 2100, which are lower than the corresponding projected values of 48% and 63% under the Revised 32nd CPP Actuarial Report.
- Starting in 2027, a small portion of investment income is projected to fund the net cash outflow. It is projected that by 2050 about 18% of investment income will be required to cover the shortfall and that this will increase to 37% by 2100. These proportions are higher compared to the corresponding projected values of 12% and 24% under the Revised 32nd CPP Actuarial Report.
| Year | Contributions ($ million) |
Net Investment IncomeTable 2 Footnote 1 ($ million) |
Total revenues ($ million) |
Net investment income as % of total revenues (%) |
Expenditures ($ million) |
Expenditures as % of total revenues (%) |
Net cash flows (contributions less expenditures) ($ million) |
% of net investment income needed to pay expenditures (%) |
|---|---|---|---|---|---|---|---|---|
| 2025 | 72,589 | 42,313 | 114,902 | 36.8 | 68,119 | 59.3 | 4,470 | 0.0 |
| 2026 | 74,903 | 45,139 | 120,041 | 37.6 | 71,679 | 59.7 | 3,224 | 0.0 |
| 2027 | 75,440 | 47,642 | 123,082 | 38.7 | 75,521 | 61.4 | (82) | 0.2 |
| 2028 | 78,849 | 50,412 | 129,261 | 39.0 | 79,532 | 61.5 | (684) | 1.4 |
| 2029 | 81,838 | 53,290 | 135,128 | 39.4 | 83,720 | 62.0 | (1,883) | 3.5 |
| 2030 | 84,858 | 56,196 | 141,054 | 39.8 | 88,006 | 62.4 | (3,147) | 5.6 |
| 2031 | 88,068 | 59,233 | 147,301 | 40.2 | 92,365 | 62.7 | (4,297) | 7.3 |
| 2032 | 91,474 | 62,430 | 153,904 | 40.6 | 96,747 | 62.9 | (5,273) | 8.4 |
| 2033 | 94,975 | 65,707 | 160,682 | 40.9 | 101,179 | 63.0 | (6,204) | 9.4 |
| 2034 | 98,589 | 69,189 | 167,778 | 41.2 | 105,669 | 63.0 | (7,081) | 10.2 |
| 2035 | 102,360 | 72,800 | 175,160 | 41.6 | 110,244 | 62.9 | (7,884) | 10.8 |
| 2036 | 105,987 | 76,614 | 182,601 | 42.0 | 114,878 | 62.9 | (8,892) | 11.6 |
| 2037 | 109,797 | 80,532 | 190,329 | 42.3 | 119,576 | 62.8 | (9,779) | 12.1 |
| 2038 | 113,723 | 84,608 | 198,331 | 42.7 | 124,350 | 62.7 | (10,627) | 12.6 |
| 2039 | 117,768 | 88,876 | 206,644 | 43.0 | 129,242 | 62.5 | (11,474) | 12.9 |
| 2040 | 121,875 | 93,434 | 215,309 | 43.4 | 134,283 | 62.4 | (12,408) | 13.3 |
| 2041 | 126,181 | 98,212 | 224,393 | 43.8 | 139,497 | 62.2 | (13,317) | 13.6 |
| 2042 | 130,578 | 102,828 | 233,406 | 44.1 | 144,869 | 62.1 | (14,290) | 13.9 |
| 2043 | 135,083 | 108,167 | 243,250 | 44.5 | 150,414 | 61.8 | (15,331) | 14.2 |
| 2044 | 139,733 | 113,755 | 253,488 | 44.9 | 156,181 | 61.6 | (16,447) | 14.5 |
| 2045 | 144,511 | 119,606 | 264,118 | 45.3 | 162,211 | 61.4 | (17,700) | 14.8 |
| 2046 | 149,346 | 125,729 | 275,074 | 45.7 | 168,526 | 61.3 | (19,181) | 15.3 |
| 2047 | 154,352 | 132,128 | 286,480 | 46.1 | 175,137 | 61.1 | (20,785) | 15.7 |
| 2048 | 159,501 | 138,812 | 298,313 | 46.5 | 182,074 | 61.0 | (22,572) | 16.3 |
| 2049 | 164,758 | 145,784 | 310,542 | 46.9 | 189,387 | 61.0 | (24,629) | 16.9 |
| 2050 | 170,100 | 153,044 | 323,144 | 47.4 | 197,144 | 61.0 | (27,045) | 17.7 |
| 2051 | 175,825 | 160,594 | 336,419 | 47.7 | 205,403 | 61.1 | (29,578) | 18.4 |
| 2052 | 181,723 | 168,439 | 350,162 | 48.1 | 214,122 | 61.1 | (32,399) | 19.2 |
| 2053 | 187,779 | 176,579 | 364,358 | 48.5 | 223,283 | 61.3 | (35,505) | 20.1 |
| 2054 | 193,966 | 185,013 | 378,980 | 48.8 | 232,943 | 61.5 | (38,977) | 21.1 |
| 2055 | 200,334 | 193,736 | 394,070 | 49.2 | 243,200 | 61.7 | (42,866) | 22.1 |
| 2060 | 235,156 | 241,526 | 476,682 | 50.7 | 302,028 | 63.4 | (66,872) | 27.7 |
| 2065 | 276,666 | 296,816 | 573,483 | 51.8 | 370,805 | 64.7 | (94,138) | 31.7 |
| 2070 | 326,357 | 361,401 | 687,758 | 52.5 | 449,772 | 65.4 | (123,414) | 34.1 |
| 2075 | 384,501 | 437,296 | 821,796 | 53.2 | 542,366 | 66.0 | (157,866) | 36.1 |
| 2080 | 452,128 | 526,362 | 978,490 | 53.8 | 650,004 | 66.4 | (197,876) | 37.6 |
| 2085 | 531,920 | 631,797 | 1,163,717 | 54.3 | 771,599 | 66.3 | (239,679) | 37.9 |
| 2090 | 626,431 | 758,664 | 1,385,095 | 54.8 | 910,299 | 65.7 | (283,868) | 37.4 |
| 2095 | 737,814 | 912,498 | 1,650,313 | 55.3 | 1,074,924 | 65.1 | (337,109) | 36.9 |
| 2100 | 868,097 | 1,098,323 | 1,966,420 | 55.9 | 1,273,123 | 64.7 | (405,026) | 36.9 |
|
Table 2 Footnotes
|
||||||||
3.3 Minimum contribution rate and related financial projections of base CPP after amendment
The MCR of the base CPP is the sum of the base Plan's steady-state contribution rate and the full funding rate for increased or new benefits. The MCR determined in respect of a triennial valuation is effective after the triennial review period, where the statutory contribution rate applies during the review period. The current review period is 2025 to 2027.
A decrease in the statutory base CPP contribution rate after the current CPP triennial review period (that is, on or after 1 January 2028) would have no impact on the MCR determined under the Revised 32nd CPP Actuarial Report. However, given that the reduction in the contribution rate to 9.5% is effective 1 January 2027, the projected assets as at 31 December 2027 are lower than under the Revised 32nd CPP Actuarial Report, which leads to a slight increase in the MCR. Under the amended base CPP, the MCR is determined to be 9.22% for the period 2028 to 2033 and 9.20% for 2034 and thereafter, which represents an absolute increase of one basis point compared to the MCR under the Revised 32nd CPP Actuarial Report (9.21% for 2028 to 2033, 9.19% for 2034 and thereafter).
The increase in the MCR is attributable to an increase in the steady-state contribution rate under the amended base CPP, which is 9.19% for years 2028 and thereafter compared to 9.18% under the Revised 32nd CPP Actuarial Report. The full funding rates for the base CPP remain unchanged at 0.03% for 2028 to 2033 and 0.01% for 2034 and thereafter, as determined under the Revised 32nd CPP Actuarial Report.
The MCR is lower than the reduced statutory rate. As such, this report confirms that if the base CPP is amended as per Bill C-30, the reduced statutory contribution rate of 9.5% for the year 2027 and thereafter is sufficient to finance the base CPP over the long term.
Table 3 shows the financial projections based on the amended base CPP MCR of 9.22% for years 2028 to 2033 and 9.20% for 2034 and thereafter.
| Year | PayGo rate (%) |
Contribution rate (%) |
Contributory earnings ($ million) |
Contributions ($ million) |
Expenditures ($ million) |
Net cash flows ($ million) |
Net investment incomeTable 3 Footnote 1 ($ million) |
Assets at 31 Dec. ($ million) |
Assets/ expenditures ratio |
|---|---|---|---|---|---|---|---|---|---|
| 2025 | 9.29 | 9.90 | 733,218 | 72,589 | 68,119 | 4,470 | 42,313 | 697,399 | 9.7 |
| 2026 | 9.47 | 9.90 | 756,595 | 74,903 | 71,679 | 3,224 | 45,139 | 745,762 | 9.9 |
| 2027 | 9.51 | 9.50 | 794,101 | 75,440 | 75,521 | (82) | 47,642 | 793,323 | 10.0 |
| 2028 | 9.58 | 9.22 | 829,989 | 76,525 | 79,532 | (3,007) | 50,331 | 840,646 | 10.0 |
| 2029 | 9.72 | 9.22 | 861,449 | 79,426 | 83,720 | (4,295) | 53,056 | 889,408 | 10.1 |
| 2030 | 9.85 | 9.22 | 893,245 | 82,357 | 88,006 | (5,649) | 55,796 | 939,555 | 10.2 |
| 2031 | 9.96 | 9.22 | 927,034 | 85,473 | 92,365 | (6,893) | 58,651 | 991,314 | 10.2 |
| 2032 | 10.05 | 9.22 | 962,880 | 88,778 | 96,747 | (7,970) | 61,651 | 1,044,995 | 10.3 |
| 2033 | 10.12 | 9.22 | 999,736 | 92,176 | 101,179 | (9,003) | 64,714 | 1,100,706 | 10.4 |
| 2034 | 10.18 | 9.20 | 1,037,774 | 95,475 | 105,669 | (10,194) | 67,955 | 1,158,467 | 10.5 |
| 2035 | 10.23 | 9.20 | 1,077,475 | 99,128 | 110,244 | (11,117) | 71,298 | 1,218,648 | 10.6 |
| 2036 | 10.30 | 9.20 | 1,115,651 | 102,640 | 114,878 | (12,239) | 74,822 | 1,281,231 | 10.7 |
| 2037 | 10.35 | 9.20 | 1,155,755 | 106,329 | 119,576 | (13,247) | 78,426 | 1,346,411 | 10.8 |
| 2038 | 10.39 | 9.20 | 1,197,087 | 110,132 | 124,350 | (14,218) | 82,165 | 1,414,357 | 10.9 |
| 2039 | 10.43 | 9.20 | 1,239,659 | 114,049 | 129,242 | (15,193) | 86,069 | 1,485,233 | 11.1 |
| 2040 | 10.47 | 9.20 | 1,282,894 | 118,026 | 134,283 | (16,257) | 90,231 | 1,559,207 | 11.2 |
| 2041 | 10.50 | 9.20 | 1,328,216 | 122,196 | 139,497 | (17,301) | 94,582 | 1,636,488 | 11.3 |
| 2042 | 10.54 | 9.20 | 1,374,507 | 126,455 | 144,869 | (18,414) | 98,753 | 1,716,827 | 11.4 |
| 2043 | 10.58 | 9.20 | 1,421,930 | 130,818 | 150,414 | (19,597) | 103,594 | 1,800,824 | 11.5 |
| 2044 | 10.62 | 9.20 | 1,470,877 | 135,321 | 156,181 | (20,860) | 108,645 | 1,888,608 | 11.6 |
| 2045 | 10.66 | 9.20 | 1,521,171 | 139,948 | 162,211 | (22,263) | 113,918 | 1,980,263 | 11.8 |
| 2046 | 10.72 | 9.20 | 1,572,061 | 144,630 | 168,526 | (23,897) | 119,418 | 2,075,784 | 11.9 |
| 2047 | 10.78 | 9.20 | 1,624,757 | 149,478 | 175,137 | (25,660) | 125,149 | 2,175,273 | 11.9 |
| 2048 | 10.84 | 9.20 | 1,678,961 | 154,464 | 182,074 | (27,609) | 131,114 | 2,278,778 | 12.0 |
| 2049 | 10.92 | 9.20 | 1,734,294 | 159,555 | 189,387 | (29,832) | 137,313 | 2,386,259 | 12.1 |
| 2050 | 11.01 | 9.20 | 1,790,525 | 164,728 | 197,144 | (32,416) | 143,745 | 2,497,588 | 12.2 |
| 2051 | 11.10 | 9.20 | 1,850,791 | 170,273 | 205,403 | (35,130) | 150,405 | 2,612,863 | 12.2 |
| 2052 | 11.19 | 9.20 | 1,912,875 | 175,985 | 214,122 | (38,138) | 157,296 | 2,732,021 | 12.2 |
| 2053 | 11.30 | 9.20 | 1,976,617 | 181,849 | 223,283 | (41,434) | 164,414 | 2,855,002 | 12.3 |
| 2054 | 11.41 | 9.20 | 2,041,750 | 187,841 | 232,943 | (45,102) | 171,753 | 2,981,652 | 12.3 |
| 2055 | 11.53 | 9.20 | 2,108,774 | 194,007 | 243,200 | (49,192) | 179,302 | 3,111,762 | 12.2 |
| 2060 | 12.20 | 9.20 | 2,475,330 | 227,730 | 302,028 | (74,298) | 219,868 | 3,809,138 | 12.1 |
| 2065 | 12.73 | 9.20 | 2,912,278 | 267,930 | 370,805 | (102,875) | 265,076 | 4,585,736 | 11.9 |
| 2070 | 13.09 | 9.20 | 3,435,340 | 316,051 | 449,772 | (133,720) | 315,668 | 5,455,135 | 11.7 |
| 2075 | 13.40 | 9.20 | 4,047,374 | 372,358 | 542,366 | (170,008) | 372,245 | 6,426,138 | 11.4 |
| 2080 | 13.66 | 9.20 | 4,759,241 | 437,850 | 650,004 | (212,154) | 434,764 | 7,497,693 | 11.1 |
| 2085 | 13.78 | 9.20 | 5,599,158 | 515,122 | 771,599 | (256,476) | 503,855 | 8,682,624 | 10.9 |
| 2087 | 13.80 | 9.20 | 5,976,884 | 549,873 | 824,632 | (274,759) | 533,689 | 9,194,603 | 10.8 |
| 2090 | 13.80 | 9.20 | 6,594,010 | 606,649 | 910,299 | (303,650) | 581,111 | 10,008,379 | 10.6 |
| 2095 | 13.84 | 9.20 | 7,766,468 | 714,515 | 1,074,924 | (360,408) | 667,394 | 11,486,247 | 10.3 |
| 2100 | 13.93 | 9.20 | 9,137,861 | 840,683 | 1,273,123 | (432,439) | 761,449 | 13,090,808 | 9.9 |
|
Table 3 Footnotes
|
|||||||||
3.4 Complementary measures of base CPP financing
3.4.1 Evolution of assets to expenditures ratio
An important measure of the Plan's financial state is the ratio of assets at the end of one year to the expenditures of the next year (the A/E ratio).
A comparison of the projected A/E ratios under the current and reduced statutory contribution rates of 9.9% and 9.5%, respectively, are shown in Chart 1, as well as the ratio under the MCR after the amendment.
Under the current statutory contribution rate of 9.9%, the A/E ratio for the base Plan is projected under the Revised 32nd CPP Actuarial Report to be 9.7 in 2025 and is then projected to increase to 14.1 by 2050 and to 20.7 by 2100. In comparison, under the reduced contribution rate of 9.5% starting in 2027, the A/E ratio is projected to be lower at 13.0 in 2050 and 14.5 by 2100.
As the MCR is lower than the statutory contribution rate of 9.5%, the A/E ratios under the MCR are likewise lower, as shown in Chart 1.
(statutory and minimum contribution rates)
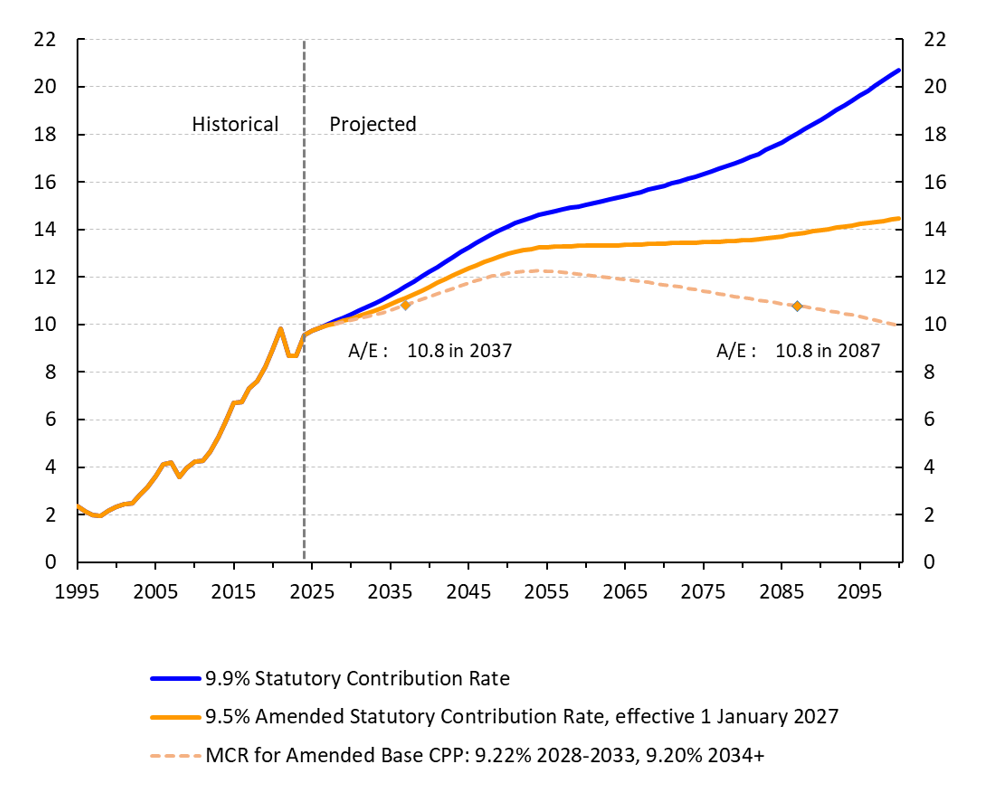
Chart 1 - Text version
| Year | 9.9% Statutory Contribution Rate | 9.5% Amended Statutory Contribution Rate, effective 1 January 2027 | MCR for Amended Base CPP: 9.22% 2028-2033, 9.20% 2034+ |
|---|---|---|---|
| 1995 | 2.37 | no data - | no data - |
| 1996 | 2.16 | no data - | no data - |
| 1997 | 1.99 | no data - | no data - |
| 1998 | 1.94 | no data - | no data - |
| 1999 | 2.17 | no data - | no data - |
| 2000 | 2.32 | no data - | no data - |
| 2001 | 2.43 | no data - | no data - |
| 2002 | 2.47 | no data - | no data - |
| 2003 | 2.84 | no data - | no data - |
| 2004 | 3.15 | no data - | no data - |
| 2005 | 3.62 | no data - | no data - |
| 2006 | 4.10 | no data - | no data - |
| 2007 | 4.20 | no data - | no data - |
| 2008 | 3.60 | no data - | no data - |
| 2009 | 3.96 | no data - | no data - |
| 2010 | 4.23 | no data - | no data - |
| 2011 | 4.27 | no data - | no data - |
| 2012 | 4.66 | no data - | no data - |
| 2013 | 5.26 | no data - | no data - |
| 2014 | 5.91 | no data - | no data - |
| 2015 | 6.70 | no data - | no data - |
| 2016 | 6.76 | no data - | no data - |
| 2017 | 7.30 | no data - | no data - |
| 2018 | 7.61 | no data - | no data - |
| 2019 | 8.22 | no data - | no data - |
| 2020 | 8.95 | no data - | no data - |
| 2021 | 9.81 | no data - | no data - |
| 2022 | 8.67 | no data - | no data - |
| 2023 | 8.68 | no data - | no data - |
| 2024 | 9.55 | no data - | no data - |
| 2025 | 9.73 | 9.73 | no data - |
| 2026 | 9.87 | 9.87 | no data - |
| 2027 | 10.02 | 9.97 | no data - |
| 2028 | 10.15 | 10.07 | 10.04 |
| 2029 | 10.29 | 10.16 | 10.11 |
| 2030 | 10.42 | 10.26 | 10.17 |
| 2031 | 10.57 | 10.36 | 10.25 |
| 2032 | 10.72 | 10.47 | 10.33 |
| 2033 | 10.88 | 10.59 | 10.42 |
| 2034 | 11.05 | 10.71 | 10.51 |
| 2035 | 11.23 | 10.85 | 10.61 |
| 2036 | 11.42 | 10.99 | 10.71 |
| 2037 | 11.61 | 11.13 | 10.83 |
| 2038 | 11.81 | 11.29 | 10.94 |
| 2039 | 12.01 | 11.44 | 11.06 |
| 2040 | 12.21 | 11.59 | 11.18 |
| 2041 | 12.42 | 11.75 | 11.30 |
| 2042 | 12.63 | 11.90 | 11.41 |
| 2043 | 12.84 | 12.06 | 11.53 |
| 2044 | 13.04 | 12.21 | 11.64 |
| 2045 | 13.24 | 12.36 | 11.75 |
| 2046 | 13.44 | 12.50 | 11.85 |
| 2047 | 13.63 | 12.63 | 11.95 |
| 2048 | 13.81 | 12.76 | 12.03 |
| 2049 | 13.98 | 12.87 | 12.10 |
| 2050 | 14.13 | 12.97 | 12.16 |
| 2051 | 14.27 | 13.05 | 12.20 |
| 2052 | 14.40 | 13.13 | 12.24 |
| 2053 | 14.52 | 13.19 | 12.26 |
| 2054 | 14.62 | 13.23 | 12.26 |
| 2055 | 14.70 | 13.26 | 12.25 |
| 2056 | 14.77 | 13.28 | 12.23 |
| 2057 | 14.85 | 13.29 | 12.20 |
| 2058 | 14.91 | 13.30 | 12.17 |
| 2059 | 14.98 | 13.31 | 12.13 |
| 2060 | 15.04 | 13.31 | 12.09 |
| 2061 | 15.11 | 13.32 | 12.05 |
| 2062 | 15.18 | 13.32 | 12.01 |
| 2063 | 15.25 | 13.33 | 11.97 |
| 2064 | 15.32 | 13.34 | 11.93 |
| 2065 | 15.40 | 13.35 | 11.89 |
| 2066 | 15.49 | 13.36 | 11.85 |
| 2067 | 15.58 | 13.38 | 11.81 |
| 2068 | 15.66 | 13.39 | 11.77 |
| 2069 | 15.75 | 13.40 | 11.72 |
| 2070 | 15.85 | 13.41 | 11.68 |
| 2071 | 15.94 | 13.43 | 11.63 |
| 2072 | 16.04 | 13.44 | 11.58 |
| 2073 | 16.13 | 13.45 | 11.53 |
| 2074 | 16.23 | 13.46 | 11.48 |
| 2075 | 16.33 | 13.47 | 11.42 |
| 2076 | 16.43 | 13.48 | 11.36 |
| 2077 | 16.54 | 13.49 | 11.31 |
| 2078 | 16.65 | 13.50 | 11.25 |
| 2079 | 16.77 | 13.52 | 11.19 |
| 2080 | 16.90 | 13.54 | 11.14 |
| 2081 | 17.04 | 13.57 | 11.08 |
| 2082 | 17.18 | 13.60 | 11.03 |
| 2083 | 17.34 | 13.64 | 10.98 |
| 2084 | 17.50 | 13.67 | 10.93 |
| 2085 | 17.67 | 13.72 | 10.88 |
| 2086 | 17.84 | 13.76 | 10.84 |
| 2087 | 18.03 | 13.81 | 10.79 |
| 2088 | 18.22 | 13.87 | 10.74 |
| 2089 | 18.41 | 13.92 | 10.69 |
| 2090 | 18.61 | 13.97 | 10.64 |
| 2091 | 18.81 | 14.02 | 10.58 |
| 2092 | 19.01 | 14.08 | 10.53 |
| 2093 | 19.22 | 14.13 | 10.46 |
| 2094 | 19.43 | 14.18 | 10.40 |
| 2095 | 19.63 | 14.22 | 10.33 |
| 2096 | 19.84 | 14.27 | 10.26 |
| 2097 | 20.06 | 14.32 | 10.18 |
| 2098 | 20.28 | 14.36 | 10.11 |
| 2099 | 20.50 | 14.41 | 10.02 |
| 2100 | 20.72 | 14.45 | 9.94 |
3.4.2 Open group balance sheet under the reduced statutory contribution rate
The actuarial balance sheet under the reduced statutory contribution rate is complementary to the MCR in assessing the long-term financial sustainability of the base CPP. That is to say that although the key prescribed financial measure for evaluating the base CPP is the MCR, specifically, its adequacy and stability over time, other indicators such as the open group balance sheet under the statutory rate could be used in combination with the MCR to assess the sustainability of the base Plan.
The actuarial position of the base Plan as at 31 December 2024 and 31 December 2030 under the open group approach and the reduced statutory contribution rate of 9.5% effective 1 January 2027 is presented in Table 4. Footnote 1
As shown in Table 4, assets as a percentage of obligations are above 100% for the amended base Plan but are slightly lower than the corresponding ratio in Table 102 of the Revised 32nd CPP Actuarial Report, which are 104.7% and 105.1%, respectively.
| Balance sheet item | As at 31 December 2024 | As at 31 December 2030 |
|---|---|---|
| Current assets | 650.6 | 947.5 |
| Future contributions | 2,719.1 | 3,375.1 |
| Total assets (a) | 3,369.7 | 4,322.6 |
| Actuarial obligations (b)Table 4 Footnote 1 | 3,322.5 | 4,261.7 |
| Asset excess (shortfall) (a) – (b) | 47.2 | 60.9 |
| Assets as percentage of obligations (a)/(b) | 101.4% | 101.4% |
|
Table 4 Footnotes
|
||
4 Actuarial opinion
In our opinion, considering that this 33rd Actuarial Report supplementing the Revised 32nd Actuarial Report on the Canada Pension Plan as at 31 December 2024 was prepared pursuant to the Canada Pension Plan:
- the data on which this report is based are sufficient and reliable for the purposes of this report;
- the assumptions used are, individually and in aggregate, reasonable and appropriate for the purposes of this report; and
- the methods employed are appropriate for the purposes of this report.
This report has been prepared, and our opinions given, in accordance with accepted actuarial practice in Canada, in particular, the General Standards and the Practice-Specific Standards for Social Security Programs of the Standards of Practice of the Canadian Institute of Actuaries.
As of the date of the signing of this report, we have not learned of any events that would have a material impact on the financial state of the base CPP as at 31 December 2024.
Assia Billig, FCIA, FSA
Chief Actuary
Laurence Frappier, FCIA, FSA
Senior Actuary
François Boulé, FCIA, FSA
Senior Actuary
Christine Dunnigan, FCIA, FSA
Senior Actuary
Ottawa, Canada
28 May 2026