2021 Actuarial Report on the Employment Insurance Premium Rate
Accessibility statement
The Web Content Accessibility Guidelines (WCAG) defines requirements for designers and developers to improve accessibility for people with disabilities. It defines three levels of conformance: Level A, Level AA, and Level AAA. This report is partially conformant with WCAG 2.0 level AA. If you require a compliant version, please contact webmaster@osfi-bsif.gc.ca.
Commissioners of the Canada Employment Insurance Commission
Dear Commissioners,
Pursuant to section 66.3 of the Employment Insurance Act, I am pleased to submit the 2021 report, which provides actuarial forecasts and estimates for the purposes of sections 4, 66 and 69 of the Employment Insurance Act.
The estimates presented in this report are based on the Employment Insurance provisions as of 22 July 2020. They also take into account additional information received from Employment and Social Development Canada on 6 August 2020 (announced by the Government on 20 August 2020). This information includes upcoming temporary measures aimed at facilitating access to Employment Insurance, as well as a confirmation of a premium rate freeze in 2021. However, the estimates were not revised for the additional 4‑week extension of the Canada Emergency Response Benefit (including the EI Emergency Response Benefit) newly announced on 20 August 2020.
Yours sincerely,
Annie St-Jacques, FCIA, FSA
Senior Actuary, Employment Insurance Premium Rate-Setting
Office of the Chief Actuary
Office of the Superintendent of Financial Institutions Canada
Table of contents
List of Tables
- Table 1 Summary of the EI Operating Account
- Table 2 Assumptions for Earnings Base
- Table 3 Assumptions for Expenditures
- Table 4 Earnings Base and Number of Earners
- Table 5 Expenditures
- Table 6 Part I Expenditures
- Table 7 Premium Reductions and Rebate
- Table 8 Calculation of the 7-Year Forecast Break-Even Rate
- Table 9 Projection of the EI Operating Account using the 7-year forecast break-even rate
- Table 10 Projection of the EI Operating Account using a Premium Rate of 1.58%
- Table 11 MP Expenditures
- Table 12 Calculation of the QPIP Reduction
- Table 13 Reduction in Employer Premiums Due to Qualified Wage-Loss Plans
- Table 14 Sensitivity of the 7-Year Forecast Break-Even Rate to the Unemployment Rate
- Table 15 Sensitivity of the 7-Year Forecast Break-Even Rate to the Recipiency Rate
- Table 16 Sensitivity of the EIOA Balance to the 7-Year Forecast Break-Even Rate
- Table 17 Reconciliation of Changes in the 7-Year Forecast Break-Even Rate
- Table 18 Maximum Insurable Earnings
- Table 19 Prescribed Information Provided by the Minister of ESD
- Table 20 Prescribed Information Provided by the Minister of Finance
- Table 21 Historical Comparison of the Number of Employees and Number of Earners
- Table 22 Projected Number of Earners
- Table 23 Historical Distribution of Earners by Level of Average Employment Income
- Table 24 Number of Earners Below and Above the MIE
- Table 25 Projected Total Employment Income
- Table 26 Historical Distribution of Employment Income as a % of Average Employment Income
- Table 27 Distribution of Employment Income for Earners Below and Above the MIE
- Table 28 Derived Insurable Earnings from Assessed Premiums
- Table 29 Projected Total Insurable Earnings
- Table 30 Split of Insurable Earnings Between Québec and Out-of-Québec, Based on Province of Employment (T4 data)
- Table 31 Historical Adjustment Payments Between the Government of Canada and the Government of Québec to Reflect Province of Residence
- Table 32 Adjustment to Insurable Earnings Split to Reflect Province of Residence
- Table 33 Split of Salaried Insurable Earnings Based on Province of Residence
- Table 34 Calculation of the Adjusted Premium Refunds
- Table 35 Total Insurable Earnings Subject to a Subsequent Premium Refund
- Table 36 Projected Self-Employed EI Participants
- Table 37 Projected Covered Earnings for Self-Employed EI Participants
- Table 38 Percentage of Benefit Weeks for Claimants with IE above the MIE
- Table 39 Average Weekly Benefits Growth Factors
- Table 40 Historical Number of Potential Claimants
- Table 41 Projected Number of Potential Claimants
- Table 42 Historical Recipiency Rate
- Table 43 Number of Weeks
- Table 44 Regular Benefits
- Table 45 Fishing Benefits
- Table 46 Work-Sharing Benefits
- Table 47 Special Benefits
- Table 48 EI Benefit Repayments
- Table 49 Employment Benefits and Support Measures
- Table 50 Administration Costs
- Table 51 Variable Administrative Costs
- Table 52 Bad Debt Expense
- Table 53 Penalties
- Table 54 Interest on Overdue Accounts Receivable
- Table 55 First Payer Cost Ratio for Calculating 2021 Rates of Reduction
- Table 56 Job-Attached EI Sickness Benefits per Category of Wage-Loss Plan
- Table 57 Allocation of Insurable Earnings for Employers With a Qualified Wage-Loss Plan
- Table 58 Experience Cost Ratio per Category
- Table 59 2021 Rates of Reduction
- Table 60 2021 Estimated Amount of Premium Reduction
1. Executive Summary
1.1 Purpose of the Report
This Actuarial Report prepared by the Actuary, Employment Insurance Premium Rate-Setting, is the eighth report to be presented to the Canada Employment Insurance Commission (Commission) in accordance with the Employment Insurance Act (“EI Act”).
Pursuant to section 66.3 of the EI Act, the purpose of this report is to provide the Commission with actuarial forecasts and estimates for the purposes of calculating the maximum insurable earnings (MIE) under section 4 of the EI Act, the employment insurance (EI) premium rate under section 66 of the EI Act, and the premium reductions under section 69 of the EI Act for employers who sponsor qualified wage-loss plans, and for employees and employers of a province that has established a provincial plan. The report also provides a detailed analysis in support of the forecasts, including data sources, methodology and assumptions.
The Commission shall, on or before 14 September, make available to the public this report along with the summary of this report.
COVID-19 Pandemic
Starting mid-March, the COVID-19 pandemic resulted in a health and economic crisis that created an unprecedented shock to the Canadian labour market. As part of the Government of Canada’s COVID-19 Economic Response Plan, the Government announced new emergency response benefits, the Canada Emergency Response Benefit (CERB) and the EI Emergency Response Benefit (EI ERB), and temporary changes to the Work-Sharing program. Furthermore, on 6 August 2020, Employment and Social Development Canada (ESDC) provided additional information to be taken into account when determining the forecast break-even rate for 2021. This information, announced by the Government on 20 August 2020, included a number of temporary measures aimed at facilitating access to EI as the EI ERB and the CERB are being wound down, as well as an EI premium freeze for 2021. This report takes all of the above into consideration. However, the estimates were not revised for the additional 4‑week extension of the CERB (including the EI ERB) newly announced on 20 August 2020.
1.2 Overview of Methodology
In accordance with subsection 66(1) of the EI Act, the Commission shall set the premium rate each year in order to generate just enough premium revenue during the next seven years to ensure that at the end of this seven-year period, the total of the amounts credited to the EI Operating Account after 31 December 2008 is equal to the total of the amounts charged to that Account after that date. This calculated premium rate is referred to as the 7-year forecast break‑even rate. Subsection 66(7) of the EI Act states that the premium rate may not be increased or decreased by more than 0.05% (five cents) from one year to the next.
For 2021, the Government has already confirmed that the premium rate would not be allowed to increase and would remain frozen at the 2020 premium rate level of 1.58%. This report will nevertheless show how the 7-year forecast break-even rate is determined in order for the projected balance in the EI Operating Account as at 31 December 2027 to be $0. This rate is expected to generate sufficient premium revenue during the 2021-2027 period to pay for the expected EI expenditures over that same period and to eliminate the projected deficit that has accumulated in the EI Operating Account as of 31 December 2020.
The 7-year forecast break-even rate is calculated each year based on a seven‑year projection of the insurable earnings, the EI expenditures, and the amount of premium reductions granted to employers who sponsor a qualified wage-loss plan as well as to employees and employers of a province that has established a provincial plan. The proposed Small Business Premium Rebate (related to the new EI Training Support Benefit, originally expected to be launched in late 2020, but now delayed to December 2021) is also considered. All projections are based on a methodology developed by the Actuary using prescribed information and assumptions provided by the Ministers of ESD and Finance, as well as non-prescribed assumptions determined by the Actuary.
In addition to the calculation of the 7-year forecast break-even rate, this report sets out the premium reductions that will apply in 2021 for employers who sponsor a qualified wage-loss plan, and for employees and employers of a province that has established a provincial plan.
Generally, EI premiums paid by the employer are equal to 1.4 times the premiums deducted by the employer on behalf of its employees, referred to as the employer multiplier. However, pursuant to subsection 69(1) of the EI Act, the employer premiums can be reduced through a lower employer multiplier when its employees are covered under one of four types of qualified wage-loss plans which reduce EI special benefits otherwise payable.
Québec is currently the only province that has established a provincial plan through the Québec Parental Insurance Plan (QPIP) which has been providing maternity, parental and adoption (MPA) benefits to Québec residents since 1 January 2006. In accordance with subsection 69(2) of the EI Act and related regulations, a mechanism to reduce EI premiums paid by Québec residents and their employers was introduced. The 2021 reduction for Québec residents and their employers is determined in accordance with legislation. The reduction is granted through a reduced premium rate, referred to as the 2021 QPIP reduction.
1.3 Main Findings
The following estimates are based on the EI provisions as of 22 July 2020, on the information provided on or before 22 July 2020 by the Minister of ESD and the Minister of Finance, and on the methodology and assumptions developed by the Actuary. They also incorporate additional information and upcoming temporary measures provided by ESDC on 6 August 2020 as a result of the exceptional circumstances created by the COVID-19 pandemic.
In 2021, insured employees and their employers will pay EI premiums on their earnings up to the 2021 MIE of $56,300, an increase of $2,100, or 3.9%, from the 2020 MIE of $54,200.
The 2021 EI 7-year forecast break-even rate, which is the rate needed to generate just enough premium revenue such that the projected EI Operating Account balances out as of 31 December 2027, is 1.93%. This represents a significant increase from the 2020 break-even rate of 1.58% and is the result of the situation created by the COVID-19 pandemic. Based on estimates received from ESDC, the largest part of this increase (0.29%) can be attributed to the EI ERBFootnote 1. Another portion of the increase (0.06%) can be attributed to the upcoming temporary measures recently announced by the Government to help people transition from the CERB and the EI ERB to EI.
The 2021 QPIP reduction is 0.40% and represents the estimated savings to the EI program due to the existence of the Québec Parental Insurance Plan, which provides MPA benefits to residents of Québec.
The 2021 estimated cost savings to the EI program that are generated by employer sponsored qualified wage-loss plans are $1,055 million. This translates in premium reductions for employers who sponsor a qualified wage-loss plan corresponding to about 0.23%, 0.37%, 0.37% and 0.40% of insurable earnings for categories 1 through 4 respectively.
Premium Freeze in 2021
The Government confirmed that it will freeze the EI premium rate for 2021 at the 2020 premium rate. Consequently, the premium rate applicable to residents of all provinces except Québec will be 1.58%. The premium rate applicable to residents of Québec will be 1.18% (1.58% - 0.40%).
With the exception of employers who sponsor a qualified wage-loss plan, employers will pay 1.4 times the employees’ premiums. For employers who sponsor a qualified wage-loss plan, based on a premium rate of 1.58%, employer multipliers for out-of-Québec employers will be reduced from 1.4 to 1.257, 1.166, 1.166 and 1.144 for categories 1 through 4 respectively (1.209, 1.086, 1.086 and 1.057 for Québec employers based on a premium rate of 1.18%).
Table 1 shows the status of the EI Operating Account for 2019, as well as its projected evolution for 2020 and 2021. This is based on a premium rate freeze for 2021 at the same level as 2020 (i.e. 1.58%). The expected deficit at the end of calendar year 2020 corresponds to $35.8 billion and is mainly attributable to the EI ERBFootnote 1 introduced by the Government at the beginning of the COVID‑19 pandemic. The expected deficit at the end of calendar year 2021 corresponds to $44.2 billion. A premium rate corresponding to the 7-year forecast break-even rate (1.93%) from 2021 to 2027 would balance out the EI Operating Account at the end of 2027Footnote 2.
| Calendar Year |
Premium Rate |
Premium Revenue |
Expenditures | Annual Surplus (Deficit) |
Cumulative Surplus (Deficit) 31 December |
|---|---|---|---|---|---|
| 2019 | 5,174 | ||||
| 2020 | 1.58% | 20,909 | 61,872 | (40,963) | (35,789) |
| 2021 | 1.58% | 22,573 | 30,990 | (8,417) | (44,206) |
It is important to note that the figures related to future expenditures and earnings base included in this report are projections, and eventual differences between future experience and these projections will be analyzed and taken into account in subsequent reports.
1.4 Sensitivity of the 7-Year Forecast Break-Even Rate
Two of the most relevant assumptions used to determine the 7-year forecast break-even rate are the unemployment rate, which is provided by the Minister of Finance, and the recipiency rate, which is projected by the Actuary.
With all other assumptions remaining constant:
- a variation in the average unemployment rate of 0.5% over the period 2021-2027 would result in an increase/decrease of about 0.07% in the 2021 EI 7-year forecast break‑even rate;
- a variation in the average recipiency rate of 5% over the period 2021-2027 would result in an increase/decrease of about 0.06% in the 2021 EI 7-year forecast break-even rate; and
- a variation in the premium rate of 0.01% of insurable earnings from the 7-year forecast break-even rate would result in a $1,253 million increase/decrease in the cumulative balance of the EI Operating Account at the end of the 7‑year forecast period.
1.5 Conclusion
This report was prepared by the Actuary in accordance with the relevant legislation.
The main results are as follows:
- The 2021 MIE is $56,300, based on the methodology detailed in the EI Act and the relevant economic data.
- The 7-year forecast break‑even rate for 2021 is 1.93% of insurable earnings.
- The 2021 QPIP reduction is 0.40% .
- The 2021 premium reduction for employers who sponsor qualified wage-loss plans is estimated at $1,055 million.
A reconciliation of the 7-year forecast break-even rate, from 1.58% in the 2020 Actuarial Report to 1.93% in the current report, is shown in Section 7. The increase is mainly attributable to the EI Emergency Response BenefitFootnote 1 introduced in response to COVID-19 and the upcoming temporary measures recently announced by the Government aimed at facilitating access to EI.
The Government confirmed that it will freeze the EI premium rate for 2021 at the 2020 premium rate. Consequently, the 2021 premium rate will be equal to:
- 1.58% of insurable earnings for residents of all provinces except Québec; and
- 1.18% of insurable earnings for residents of Québec, after taking into account the QPIP reduction of 0.40%.
2. Introduction
2.1 Purpose of the Report
This Actuarial Report prepared by the Actuary, Employment Insurance Premium Rate-Setting is the eighth one to be presented to the Canada Employment Insurance Commission (Commission) in compliance with section 66.3 of the EI Act.
The Actuary is a Fellow of the Canadian Institute of Actuaries who is an employee of the Office of the Superintendent of Financial Institutions and who is engaged by the Commission to perform duties under section 66.3 of the EI Act. Pursuant to this section, the Actuary shall prepare actuarial forecasts and estimates for the purposes of sections 4, 66 and 69 of the EI Act, and shall, on or before 22 August of each year, provide the Commission with a report that sets out:
- the forecast premium rate for the following year and a detailed analysis in support of the forecast;
- the calculations performed for the purposes of sections 4 and 69 of the EI Act;
- the information provided under section 66.1 of the EI Act; and
- the source of the data, the actuarial and economic assumptions and the actuarial methodology used.
The purpose of this report is to provide the Commission with all the information prescribed under section 66.3 of the EI Act. The Commission will make available to the public this report along with its summary. More information on the rate setting process along with the inherent deadlines can be found in Appendix A.
2.2 Changes Announced in 2020
- As part of the Government of Canada’s COVID-19 Economic Response Plan, the Government announced the following new emergency response benefits and temporary changes to the Work-Sharing program:
- The Canada Emergency Response Benefit (CERB) and the EI Emergency Response Benefit (EI ERB) support eligible workers by providing $500 a week for up to 24 weeks for the period between 15 March 2020 and 3 October 2020. The CERB expenses are being charged to the Consolidated Revenue Fund while the EI ERB expenses are being charged to the EI Operating Account. As a result of the implementation of the EI ERB:
- New EI regular and sickness benefit claims during this period are processed as claims for the EI ERB. Claims established prior to 15 March 2020, continue to be processed under the traditional EI rules.
- EI special benefits, excluding EI sickness benefits, continue unchanged.
- Several temporary special Work-Sharing measures were introduced to support employers and workers affected by COVID-19. Changes include extending the maximum duration of agreements, waiving the mandatory waiting period, expanding eligibility criteria and streamlining the application process from 30 days to 10 days. The temporary measures are in place from 15 March 2020 to 14 March 2021.
- The Canada Emergency Response Benefit (CERB) and the EI Emergency Response Benefit (EI ERB) support eligible workers by providing $500 a week for up to 24 weeks for the period between 15 March 2020 and 3 October 2020. The CERB expenses are being charged to the Consolidated Revenue Fund while the EI ERB expenses are being charged to the EI Operating Account. As a result of the implementation of the EI ERB:
- EI regulations were amended to extend the period of eligibility under the seasonal claimant pilot project announced in Budget 2018. This measure provides up to five additional weeks of EI regular benefits to eligible seasonal claimants in 13 targeted EI economic regions. The additional five weeks of benefits were originally available for claims established between 5 August 2018 and 30 May 2020. The period for the pilot project has been extended to include eligible claims established between 30 May 2020 and 30 October 2021.
- ESDC indicated that the implementation of the new EI Training Support Benefit (part of the Canada Training Benefit) originally announced in Budget 2019 and proposed to be launched in late 2020 would be delayed by at least 1 year. The benefit components delayed are:
- The EI Training Support Benefit, designed to help workers cover their living expenses when they require time off work to pursue training, and
- The EI Premium Rebate for Small Businesses, designed to help offset the upward pressure on EI premiums resulting from the introduction of the new EI Training Support Benefit.
- On 6 August 2020, ESDC confirmed the introduction of a number of transition measures for a period of one year to facilitate access to EI. This report takes into account the estimated costs received for the following measures:
- A minimum unemployment rate of 13.1% to be used for all EI regions beginning 9 August 2020 (announced by the Government on 10 August 2020). This will result in a uniform entrance requirement of 420 hours for eligibility to EI regular benefits (before application of hours credits) and a minimum entitlement to 26 weeks of EI regular benefits.
- A credit of 300 insurable hours and a minimum weekly benefit rate of $400 for EI regular benefits, including work-sharing benefits (announced by the Government on 20 August 2020).
- A credit of 480 insurable hours and a minimum weekly benefit rate of $400 ($240 for extended parental benefits) for EI special benefits (announced by the Government on 20 August 2020).
- On 6 August 2020, ESDC confirmed that the Government will freeze the EI premium rate for 2021 at the 2020 premium rate.
2.3 Scope of the Report
The methodology used in determining the 7-year forecast break-even rate, including the premium rate reduction for employees and employers of a province that has established a provincial plan such as Québec, and the reduction in employer premiums due to qualified wage-loss plans, is summarized in Section 3.
Section 4 provides an overview of the key assumptions used in projecting insurable earnings and EI expenditures, while Section 5 presents the main results, including the calculation of the 2021 EI 7-year forecast break-even rate and the projection of the EI Operating Account. Sensitivity tests on the main assumptions are outlined in Section 6.
A reconciliation between the 2020 and 2021 EI 7-year forecast break-even rates is presented in Section 7.
Concluding remarks and the actuarial opinion are presented in Section 8 and Section 9, respectively. The various appendices provide supplemental information on the EI program and on the data, assumptions and methodology employed. Detailed information on the calculation of the maximum insurable earnings (MIE) is presented in Appendix C.
3. Methodology
In accordance with subsection 66(1) of the EI Act, the Commission shall set the premium rate each year in order to generate just enough premium revenue during the next seven years to ensure that at the end of this seven-year period, the total of the amounts credited to the EI Operating Account after 31 December 2008 is equal to the total of the amounts charged to that Account after that date. This calculated premium rate is referred to as the 7-year forecast break‑even rate. The 2020 Actuarial Report calculated the 2020 7-year forecast break-even rate at 1.58%. Subsection 66(7) of the EI Act states that the premium rate may not be increased or decreased by more than 0.05% (five cents) from one year to the next.
For 2021, the Government has already confirmed that the premium rate would not be allowed to increase and would remain frozen at the 2020 premium rate level of 1.58%. This report will nevertheless show how the 7-year forecast break-even rate is determined in order for the projected balance in the EI Operating Account as at 31 December 2027 to be $0.
Based on relevant assumptions, the 2021 EI 7-year forecast break-even rate is the premium rate that is expected to generate sufficient premium revenue to ensure that at the end of 2027, the amounts credited and charged to the EI Operating Account after 31 December 2008 are equal. It is therefore based on the projected balance of the EI Operating Account as of 31 December 2020 and the projection over a period of seven years of the earnings base, the EI expenditures as well as the amount of premium reductions granted to employers who sponsor a qualified wage-loss plan and to employees and employers of a province that has established a provincial plan. The projected rebate amounts for small businesses related to the new EI Training Support Benefit expected to be launched in December 2021 are also considered.
The earnings base represents the total insurable earnings on which salaried employees and their employers pay EI premiums, and the earnings on which self‑employed individuals that opted into the EI program pay EI premiums. Prior to an adjustment to reflect employee premium refunds, the employer portion of the earnings base is equal to 1.4 times the employee portion of the earnings base.
For purposes of determining the 7-year forecast break-even rate, the earnings base and EI expenditures are projected over a seven‑year period. The base year for the earnings base is 2018, which is the most recent year for which fully assessed T4 slips (Statement of Remuneration Paid) data are available. However, for certain assumptions, the 2019 partially assessed information is used. Complete data for 2019 will not become available until January 2021. The base year for EI benefits is calendar year 2019.
The earnings base and EI expenditures are projected from the base year using:
- Data and assumptions provided by the Minister of Employment and Social Development (ESD), including prescribed information as set out in section 66.1 of the EI Act (presented in Table 19, Appendix D);
- Assumptions and forecasts provided by the Minister of Finance in accordance with section 66.2 of the EI Act (presented in Table 20, Appendix D);
- Additional data provided by Service Canada, Employment and Social Development Canada (ESDC), and the Canada Revenue Agency (CRA); and,
- Methodology and other assumptions developed by the Actuary.
In accordance with section 69 of the EI Act and related regulations, premium reductions are granted to employers who sponsor a qualified wage-loss plan as well as to employees residing in a province that has established a provincial plan and their employers. In addition, Budget 2019 proposed a Small Business Premium Rebate (related to the new EI Training Support Benefit, originally expected to be launched in late 2020, but now delayed to December 2021). The expected amounts of these premium reductions and rebate over the next seven years are included in the EI expenditures for purposes of determining the 7-year forecast break-even rate.
Generally, EI premiums paid by the employer are equal to 1.4 times the premiums deducted by the employer on behalf of its employees, referred to as the employer multiplier. However, pursuant to subsection 69(1) of the EI Act, the employer premiums can be reduced through a lower employer multiplier when its employees are covered under one of four types of qualified wage-loss plans which reduce EI special benefits otherwise payable. The 2021 premium reductions for those employers are determined in accordance with subsection 69(1) of the EI Act and related regulations, and are based on the methodology and assumptions developed by the Actuary.
Québec is currently the only province that has established a provincial plan through the Québec Parental Insurance Plan (QPIP) which has been providing maternity, parental and adoption (MPA) benefits to Québec residents since 1 January 2006. In accordance with subsection 69(2) of the EI Act and related regulations, a mechanism to reduce EI premiums paid by Québec residents and their employers was introduced. The 2021 reduction for Québec residents and their employers is determined in accordance with legislation and based on a methodology and on assumptions developed by the Actuary. The reduction is granted through a reduced premium rate. For 2021, this reduction is referred to as the 2021 QPIP reduction.
More information on the methodology used for calculating the 7-year forecast break-even rate and the premium reductions for 2021 is provided in Appendix B.
4. Assumptions
This section provides a brief overview of the main assumptions used in projecting the variables included in the calculation of the 7-year forecast break‑even rate. More detailed information and supporting data are provided in Appendix D. The section is broken down into two subsections: assumptions related to the projected earnings base and assumptions related to the projected expenditures.
4.1 Earnings Base
The earnings base is detailed in the denominator of the formula for the 7-year forecast break-even rate and the QPIP reduction developed in Appendix B. The earnings base is comprised of:
- the total insurable earnings on which employers pay EI premiums prior to any adjustment for wage-loss plans or provincial plans;
- the total insurable earnings on which employees pay EI premiums adjusted to reflect employee premium refunds, and;
- the earnings on which self‑employed individuals that opted into the EI program pay EI premiums.
The main assumptions used in determining the earnings base are presented in Table 2 below.
| 2019 | 2020 | 2021 | 2022 | 2023 | 2024 | 2025 | 2026 | 2027 | |
|---|---|---|---|---|---|---|---|---|---|
| Increase in Maximum Insurable Earnings | 2.71% | 2.07% | 3.87% | 1.60% | 2.10% | 2.57% | 2.34% | 2.28% | 2.23% |
| Increase in Number of Earners | 2.10% | (6.79%) | 3.82% | 2.05% | 1.70% | 1.53% | 1.18% | 1.07% | 1.08% |
| Increase in Average Employment Income Table 2 - Footnote * | 2.76% | 1.37% | 2.58% | 2.95% | 2.55% | 2.07% | 2.26% | 2.22% | 2.49% |
| Increase in Total Employment Income | 4.91% | (5.51%) | 6.51% | 5.05% | 4.29% | 3.63% | 3.46% | 3.32% | 3.59% |
| Increase in Total Insurable Earnings | 4.95% | (6.20%) | 7.82% | 4.61% | 4.04% | 3.91% | 3.51% | 3.35% | 3.45% |
| Net Transfer of Insurable Earnings to Québec Reflecting the Province of Residence |
0.28% | 0.28% | 0.28% | 0.28% | 0.28% | 0.28% | 0.28% | 0.28% | 0.28% |
| Adjustment Due to Employee Premium Refunds (% of Total Insurable Earnings) |
2.47% | 2.47% | 2.47% | 2.47% | 2.47% | 2.47% | 2.47% | 2.47% | 2.47% |
| Increase in Covered Self-Employed Earnings: | |||||||||
| Total | 12% | 40% | 9% | 9% | 8% | 7% | 7% | 7% | 7% |
| Out-of-Québec Residents | 13% | 39% | 9% | 9% | 8% | 8% | 7% | 7% | 7% |
| Québec Residents | 8% | 51% | 6% | 6% | 6% | 5% | 5% | 5% | 5% |
|
|||||||||
4.1.1 Maximum Insurable Earnings
The MIE represents the income level up to which EI premiums are paid and up to which EI benefits are calculated, and is a key element in determining the earnings base. Section 4 of the EI Act provides details on how to determine the yearly MIE. In accordance with this section, the MIE increases annually based on increases in the average weekly earnings, as reported by Statistics Canada.
The 2021 MIE is equal to $56,300, which represents a 3.9% increase to the 2020 MIE of $54,200. The projected MIE for years 2022 to 2027 are calculated based on estimates of the average weekly earnings provided by the Minister of Finance. Detailed explanations and calculations of the 2021 MIE are provided in Appendix C.
4.1.2 Number of Earners
The number of earners and their distribution across income ranges is used to determine the earnings base of salaried employees. The projected number of employees per year, which is based on an average of the number of employees per month, is provided by the Minister of Finance. The total number of earners for a year is higher than the number of employees provided given that the number of earners includes all individuals who had earnings at any time during the year rather than an average per month.
The preliminary number of earners for the year 2019 is set such that the resulting insurable earnings are in line with the expected assessed premiums for 2019, which are derived from the 2019 year-to-date assessed premiums and the 2019 increase in average employment income provided by the Minister of Finance. The projected number of earners from 2020 to 2027 is derived from a regression analysis based on the number of earnersFootnote 3 and the number of employeesFootnote 4.
The number of earners is expected to increase by 2.10% in 2019 and decrease by 6.79% in 2020. The average annual increase for the following seven years, from 2021 to 2027, is 1.77%. Given the historical year-to-year stability of the distribution of earners across income ranges, the projected distribution of earners as a percentage of average employment income is based on the 2018Footnote 5 distribution.
4.1.3 Average and Total Employment Income
The increase in average employment income, combined with the increase in the number of earners, is used to determine the increase in total employment income. The 2018Footnote 5 distribution of the total employment income across income ranges is used to determine the future distribution of total employment income.
The increase in average employment income is provided by the Minister of Finance and is expected to be 2.76% and 1.37% in 2019 and 2020 respectively. The average annual increase for the following seven years, from 2021 to 2027, is 2.45%. Based on these increases in average employment income and the expected increases in the total number of earners, the total employment income is expected to increase by 4.91% in 2019 and decrease by 5.51% in 2020. The average annual increase for the following seven years, from 2021 to 2027, is 4.27%.
4.1.4 Total Insurable Earnings
The total insurable earnings of salaried employees are equal to the total employment income, up to the annual MIE, earned by a person employed in insured employment. They are used to determine the earnings base for salaried employees. Prior to any adjustments for employee premium refunds, the earnings base for salaried employees is equal to 2.4 times the total insurable earnings (employer premiums are generally equal to 1.4 times the employee premiums, for a combined total of 2.4).
Historical information regarding total insurable earnings is derived from aggregate assessed premiums gathered from T4 slips of all salaried employees, and is provided by CRA. For employees with multiple employments in the year, this information is based on the combined total EI premiums. This means that, although insurable earnings of each employment are capped at the MIE, the combined total insurable earnings can exceed the MIE. The adjustment to insurable earnings and the earnings base reflecting multiple employments is captured in the employee premium refund section below.
The expected total employment income capped at the annual MIE for 2019 to 2027 is derived from the 2018Footnote 5 distribution of the total employment income and of the total number of earners as a percentage of average employment income, and the expected increases in these variables.
Based on this methodology, the total insurable earnings, before any adjustment for premium refunds, are expected to increase by 4.95% in 2019 and decrease by 6.20% in 2020. The average annual increase for the following seven years, from 2021 to 2027, is 4.38%. For 2019, the resulting insurable earnings reflect the year-to-date assessed premiums and related total expected assessed premiums for 2019.
4.1.5 Split of Total Insurable Earnings Due to Provincial Plan
For the purposes of determining the reduction that applies to residents of a province with a provincial plan, the earnings base for salaried employees must be split between residents of provinces with and without a provincial plan. The only province that currently has a provincial plan is Québec. Therefore, the earnings base for salaried employees must be split based on the province of residence (between out-of-Québec residents and Québec residents).
The information used to derive historical insurable earnings provided by CRA is on a T4 basis, and is therefore based on the province of employment. The historical distribution of insurable earnings on a T4 basis shows that the proportion of insurable earnings that relates to employment in Québec generally decreased until 2015; between 2015 and 2019, a slight increase was observed. Based on the historical pattern, it is expected that the proportion of insurable earnings that relates to employment in Québec will remain relatively stable at 22.2% in 2019 and 2020, and will slightly decrease over the 7-year projection period, but will remain close to 22%.
The information on historical assessed premiums provided by CRA includes adjustment payments made between the Government of Canada and the Government of Québec each year to reflect the province of residence rather than the province of employment of each employee. These adjustment payments are the object of an administrative agreement between both parties, and can be used as a basis to adjust the distribution of insurable earnings to reflect the province of residence. The methodology used in adjusting the distribution of insurable earnings based on aggregated adjustment payments was validated against administrative data. The administrative data were provided by CRA and are part of the annual exchange of information between the Government of Canada and the Government of Québec.
Based on information provided by CRA, the net annual transfer of insurable earnings on a T4 basis to reflect actual province of residence was on average 0.28% of total insurable earnings for the last five years of available data, 2014 to 2018, with the transfer of insurable earnings on a T4 basis going to Québec from the rest of Canada. It is assumed to remain at 0.28% of total insurable earnings until 2027.
4.1.6 Employee Premium Refunds
In general, salaried employees contribute EI premiums on their total insurable earnings in a given tax year up to the annual MIE. However, when filing their tax returns, some employees may exceed the maximum contribution and receive a refund of all or a portion of the EI premiums paid in the year (e.g. employees with multiple employers in the same year and employees with insurable earnings below $2,000). The insurable earnings that are subject to any subsequent premium refund must be excluded from the earnings base. Given that the data used for projection purposes (T4 slips) include insurable earnings for which premiums may later be refunded, an adjustment must be made to reduce the earnings base. It is important to note that the employer does not receive a refund. Thus, only the employee’s portion of the total earnings base is adjusted, which is reflected in the formulas presented in Appendix B.
The historical data provided by CRA show that the total insurable earnings subject to a subsequent employee refund as a percentage of total insurable earnings is relatively stable. Based on the average for the last five years of available data, 2014 to 2018, this percentage is assumed to be 2.47% from 2019 to 2027.
4.1.7 Self-Employed Earnings
Since 31 January 2010, self‑employed workers may voluntarily opt into the EI program to receive EI special benefits for those who are sick, pregnant or caring for a newborn or adopted child, and for those caring for a critically ill or injured family member (family caregiver benefit), or at end-of-life (compassionate care benefit). Although self-employed residents of Québec are able to access MPA benefits through their provincial plan, they may voluntarily opt into the EI program to access other special benefits. As such, the earnings base used in calculating the forecast break-even rate must take into account the covered earnings of self-employed individuals who opt into the EI program.
Self-employed individuals who participate in the EI program contribute premiums based on their self-employed earnings, up to the annual MIE, at the employee rate that corresponds to their province of residence, and there are no employer premium contributions. Therefore, as with the insurable earnings of salaried employees, self-employed covered earnings must be split between out-of-Québec residents and Québec residents.
The increase in self-employed earnings reflects the expected increase in the number of participants, and in the average earnings of self-employed individuals.
The projected number of participants is based on historical enrolment information, adjusted to reflect expected future changes in enrolment. The increase in average earnings is assumed to be the same increase in average earnings as the salaried employees.
Based on this methodology, the covered earnings of all self-employed individuals are expected to increase on average by 8% per year from 2021 to 2027. It is worth noting that 2020 shows an increase of 40% in total covered self-employment earnings. This can most likely be attributed to the COVID‑19 pandemic, as more self-employed people seeked some form of sickness coverage. This assumption will be adjusted as experience data fully becomes available.
4.2 Expenditures
EI Part I benefits are projected from actual 2019 benefits paid using several economic and demographic assumptions.
Table 3 presents a summary of the key expenditure assumptions used in this report, followed by a short description for each of them. A detailed description of the methodology used to project all benefits is available in Appendix D.
| 2019 | 2020 | 2021 | 2022 | 2023 | 2024 | 2025 | 2026 | 2027 | |
|---|---|---|---|---|---|---|---|---|---|
| Increase in Labour ForceTable 3 - Footnote * | 1.9% | (2.1%) | 1.4% | 0.7% | 1.0% | 1.2% | 1.2% | 1.2% | 1.2% |
| Unemployment Rate Table 3 - Footnote * | 5.7% | 9.8% | 7.8% | 6.7% | 6.2% | 5.9% | 5.9% | 5.9% | 5.8% |
| Increase in Average Weekly Earnings Table 3 - Footnote * | 2.7% | 2.8% | 1.7% | 2.7% | 2.4% | 2.2% | 2.2% | 2.2% | 2.3% |
| Increase in Average Weekly Benefits | 1.7% | 2.1% | 3.0% | 2.1% | 2.2% | 2.4% | 2.3% | 2.2% | 2.3% |
| Potential Claimants (as a % of Unemployed) |
54.1% | 65.5% | 57.5% | 56.5% | 56.5% | 55.5% | 55.5% | 55.5% | 55.5% |
| Recipiency Rate (as a % of Potential Claimants) |
72.9% | 45.0% | 70.0% | 72.5% | 75.0% | 75.0% | 75.0% | 75.0% | 75.0% |
| Number of weeks | 52.2 | 52.4 | 52.2 | 52.0 | 52.0 | 52.4 | 52.2 | 52.2 | 52.2 |
| Percentage of Benefit Weeks for Claimants with Insurable Earnings above the MIE |
47.9% | 47.2% | 47.2% | 47.2% | 47.2% | 47.2% | 47.2% | 47.2% | 47.2% |
|
|||||||||
4.2.1 Labour Force
The labour force affects most of Part I benefits directly by increasing/decreasing the number of potential claimants. The labour force population is expected to decrease from 20.2 million in 2019 to 19.8 million in 2020. This decrease can be attributed to the forced shutdown of the economy created by the COVID‑19 pandemic that saw many people temporarily leave the labour force. In 2021, the labour force is expected to start increasing again to reach 21.4 million in 2027. The average annual increase between 2019 and 2027 is 0.7%. This assumption is provided by the Minister of Finance.
4.2.2 Unemployment Rate
The unemployment rate affects regular EI benefits directly by also increasing/decreasing the number of potential claimants. The average unemployment rate was 5.7% in 2019, and is expected to increase to 9.8% in 2020 before decreasing over the following four years to reach 5.9% in 2024. It is then expected to remain at that level until it reaches its ultimate value of 5.8% in 2027. The large increase in 2020 is attributable to the health and economic crisis resulting from the COVID-19 pandemic. This assumption is provided by the Minister of Finance.
4.2.3 Average Weekly Earnings
The growth in average weekly earnings on a calendar year basis is used, in conjunction with the increase in the MIE, to project the average weekly benefits. The expected growth in average weekly earnings is 2.8% in 2020 and decreases to 1.7% in 2021. The average annual growth for years 2022 to 2027 is 2.3%. This assumption is provided by the Minister of Finance.
4.2.4 Average Weekly Benefits
The average weekly benefits growth affects EI expenditures directly through a corresponding increase/decrease in Part I expenditures. The average weekly benefits are equal to the benefit payments divided by the number of benefit weeks paid for Part I benefits.
The annual average weekly benefits growth rates are forecasted at 2.1% for 2020 and 3.0% for 2021. The average annual increase for years 2022 to 2027 is 2.3%. The growth rates are generally the same for all benefit types. However, after further analysis of claims data for the first six months of 2020, the assumed average weekly benefit growth for 2020 for sickness and Work-Sharing benefits was adjusted.
4.2.5 Potential Claimants
The EI Program is designed to provide temporary income support to eligible insured persons who have lost their jobs through no fault of their own, such as due to a shortage of work, or as a result of seasonal or mass lay-offs, and are available for work. The potential claimants represent the number of individuals or the percentage of unemployed individuals that meet the basic coverage criteria of the EI program. The number of potential claimants as a percentage of unemployed increased from 51.0% in 2018 to 54.1% in 2019. Based on the experience of the first six months of 2020, it is expected to increase to 65.5% in 2020 before starting to decrease to reach its ultimate value of 55.5% in 2024. The large increase in 2020 is attributable to the forced shutdown of the economy created by the COVID‑19 pandemic. Compared to other years, a larger proportion of employees lost their job through no fault of their own and remained available for work, putting upward pressure on the potential claimants’ rate.
4.2.6 Recipiency Rate
The recipiency rate represents the proportion of potential claimants in a given period who are receiving EI regular benefits. It is directly linked to the target population of the EI program (i.e. potential claimants) and does not consider individuals outside the target population of the EI program, such as the long-term unemployed and those who did not contribute to the program in the previous year. The recipiency rate is lower than 100% for multiple reasons, including that some potential claimants have not accumulated the required number of insurable hours, while other potential claimants do not apply for benefits, are serving the one-week waiting period, or have exhausted the number of weeks they were entitled to receive and remain unemployed.
The actual recipiency rate was 78.8% in 2018 and decreased to 72.9% in 2019 due to the termination of some temporary measures. Based on the experience of the first six months of 2020, it is assumed to decrease to 45.0% for the whole year 2020. The recipiency rate is set at 70.0% for 2021, 72.5% for 2022 and 75.0% from 2023 onwards. The low recipiency rate for 2020 and 2021 is attributable to the EI ERB put in place by the Government for claims starting 15 March 2020, as well as to the transition measures aimed at facilitating access to EI as the EI ERB and the CERB are being wound down. The majority of people who would have normally received regular EI benefits and been counted as regular EI recipients are receiving the special measure benefits instead, and are accounted for elsewhere as recipients of that measure.
4.2.7 Number of Weeks
EI expenditures are reported in the EI Operating Account on an accrual basis, that is, they are recorded in the period for which they should have been paid, regardless of the delay in processing the payment. Furthermore, EI benefits are paid on a weekly basis, but only weekdays that belong to a particular period are reported in that period.
The number of weeks affects Part I expenditures as benefits are payable for every weekday of the year, regardless of holidays. The number of workdays in a year ranges from 260 days to 262 days. Therefore, an adjustment is included to reflect the number of days benefits are paid in any year. The number of weeks for years 2019 to 2027 ranges between 52.0 and 52.4.
4.2.8 Percentage of Benefit Weeks for Claimants with Earnings Above MIE
From analyses of administrative data provided by ESDC, 47.9% of benefit weeks for claims that accrued in 2019 were based on insurable earnings above the MIE compared to 47.0% in 2018. Based on partial data for 2020, the proportion of benefit weeks for claimants with insurable earnings above the MIE is assumed to decrease slightly in 2020 to 47.2% and to remain constant thereafter.
4.2.9 Other Expenditures
Additional information used to project expenditures such as pilot projects and temporary measures, the cost of new program changes, administration costs and employment benefits and support measures (EI Part II benefits) are provided by ESDC.
The EI ERB put in place by the Government to support workers affected by the COVID-19 pandemic, as well as the temporary measures introduced to facilitate access to EI make up a large proportion of the expenditures. As per the cost estimates provided by ESDC, an EI ERB expenditure of $36.2 billion was added in 2020, while transition measures expenditures of $968 million and $5.1 billion were added in 2020 and 2021 respectively.
5. Results
5.1 Overview
This report provides actuarial forecasts and estimates for the purposes of sections 4, 66 and 69 of the EI Act. It has been prepared based on EI provisions as of 22 July 2020, on the information provided on or before 22 July 2020 by the Ministers of ESD and Finance, and on the methodology and non-prescribed assumptions developed by the Actuary. Additional information and upcoming temporary measures provided by ESDC on 6 August 2020 were also considered.
The key findings are as follows:
- The 2021 MIE is equal to $56,300, which represents a 3.9% increase to the 2020 MIE of $54,200.
- The 2021 EI 7-year forecast break-even rate is 1.93% of insurable earnings for residents of all provinces except Québec. This represents a significant increase from the 2020 break-even rate of 1.58% and is the result of the situation created by the COVID-19 pandemic. Based on estimates received from ESDC, the largest part of this increase (0.29%) can be attributed to the EI ERBFootnote 1. Another portion of the increase (0.06%) can be attributed to the upcoming temporary measures recently announced by the Government to help people transition from the CERB and the EI ERB to EI.
- The 2021 premium reduction for residents of Québec due to its provincial plan is 0.40%.
- The 2021 premium reduction for employers who sponsor qualified wage-loss plans is estimated at $1,055 million. This translates in premium reductions for employers who sponsor a qualified wage-loss plan corresponding to about 0.23%, 0.37%, 0.37% and 0.40% of insurable earnings for categories 1 through 4 respectively.
- The total earnings base is expected to grow each year from $1,569 billion in 2019 to $1,986 billion in 2027, with the exception of 2020, where a decrease is expected due to the COVID‑19 pandemic.
- Total expenditures are expected to increase from $21 billion in 2019 to $62 billion in 2020. This large increase is mainly due to the estimated cost of the EI ERBFootnote 1 provided by ESDC. They are then expected to decrease considerably in 2021, while remaining high at $31 billion, due to the temporary measures to help people transition from the CERB and the EI ERB to EI. They are expected to continue to decrease over the following two years, before resuming a more normal upward progression until they reach the expected level of $27 billion in 2027.
- The EI Operating Account is expected to have a cumulative deficit of $35.8 billion as of 31 December 2020, which is mainly attributable to the EI ERBFootnote 1 introduced by the Government at the beginning of the COVID‑19 pandemic.
The Government confirmed that it will freeze the EI premium rate for 2021 at the 2020 premium rate. Consequently, the 2021 premium rate will be equal to:
- 1.58% of insurable earnings for residents of all provinces except Québec; and
- 1.18% of insurable earnings for residents of Québec, after taking into account the QPIP reduction of 0.40%.
5.2 Earnings Base
EI premiums, prior to any adjustment for wage-loss plans, are determined by the product of the premium rate and the earnings base. The national earnings base is required to determine the 7‑year forecast break-even rate while the earnings base of provinces not offering a provincial plan is required to determine the reduction due to those plans. Since Québec is the only province offering a provincial plan, the earnings base is split between Québec and out-of-Québec residents.
Based on the methodology and assumptions presented in Section 4, Table 4 shows the earnings base for Québec and out-of-Québec residents as well as the total number of earners.
| Calendar Year | Earnings Base ($ million) | Number of Earners (thousands) |
||
|---|---|---|---|---|
| Out-of-Québec | Québec | Total | ||
| 2018 | 1,162,494 | 332,042 | 1,494,536 | 19,620 |
| 2019 | 1,216,023 | 353,142 | 1,569,165 | 20,032 |
| 2020 | 1,141,581 | 330,372 | 1,471,952 | 18,672 |
| 2021 | 1,231,817 | 355,257 | 1,587,073 | 19,386 |
| 2022 | 1,289,553 | 370,621 | 1,660,174 | 19,783 |
| 2023 | 1,342,691 | 384,556 | 1,727,247 | 20,118 |
| 2024 | 1,396,240 | 398,505 | 1,794,745 | 20,426 |
| 2025 | 1,446,322 | 411,363 | 1,857,685 | 20,666 |
| 2026 | 1,495,791 | 424,196 | 1,919,987 | 20,888 |
| 2027 | 1,548,627 | 437,647 | 1,986,275 | 21,113 |
These results are used in the calculation of the 2021 EI 7-year forecast break‑even rate and the 2021 QPIP reduction. A detailed explanation of the methodology and assumptions used to derive the results is available in Appendix D.
5.3 Expenditures
This section examines the expenditures side of the 7-year forecast break-even rate. EI expenditures include Part I (income benefits), Part II (Employment Benefits and Support Measures (EBSM)), administration costs, benefit repayments and bad debts. EI benefits may also include temporary spending initiatives, such as pilot projects and special measures announced by the Government of Canada. More specifically, in 2020, EI benefits include the EI ERB put in place to support workers affected by the COVID‑19 pandemic. A detailed explanation of the methodology and assumptions used to derive the results is available in Appendix D.
For the purposes of the 7-year forecast break-even rate calculation, penalties and interest on overdue accounts receivable are included on the expenditures side of the equation.
Table 5 shows the breakdown of the 2019 EI expenditures, as well as a projection up to 2027.
| Calendar Year |
Part ITable 5 - Footnote * | Part II | EI - ERB | Admin. Costs |
Benefit Repayments |
Bad Debt | Penalties | Interest | Total |
|---|---|---|---|---|---|---|---|---|---|
| 2019 | 17,208 | 2,464 | - | 1,890 | (289) | 74 | (55) | (22) | 21,269 |
| 2020 | 21,041 | 2,899 | 36,200 | 1,944 | (276) | 158 | (72) | (22) | 61,872 |
| 2021 | 27,127 | 2,529 | - | 1,860 | (464) | 57 | (93) | (27) | 30,990 |
| 2022 | 22,575 | 2,532 | - | 1,796 | (357) | 33 | (77) | (23) | 26,478 |
| 2023 | 21,472 | 2,107 | - | 1,789 | (328) | 59 | (74) | (23) | 25,002 |
| 2024 | 21,534 | 2,107 | - | 1,784 | (321) | 76 | (74) | (24) | 25,081 |
| 2025 | 22,145 | 2,107 | - | 1,783 | (330) | 83 | (76) | (27) | 25,685 |
| 2026 | 22,901 | 2,107 | - | 1,783 | (342) | 86 | (79) | (30) | 26,426 |
| 2027 | 23,568 | 2,107 | - | 1,783 | (351) | 88 | (81) | (33) | 27,080 |
|
|||||||||
Table 6 shows the breakdown of Part I EI expenditures.
| Calendar Year |
RegularTable 6 - Footnote * | Fishing | Work- Sharing |
Training BenefitTable 6 - Footnote ** |
Special BenefitsTable 6 - Footnote * | Total | ||||
|---|---|---|---|---|---|---|---|---|---|---|
| MPTable 6 - Footnote *** | Sickness | Compassionate | Family Caregiver Benefit | Sub- Total |
||||||
| 2019 | 10,715 | 340 | 13 | - | 4,139 | 1,864 | 49 | 88 | 6,140 | 17,208 |
| 2020 | 14,619 | 348 | 117 | - | 4,313 | 1,509 | 48 | 87 | 5,956 | 21,041 |
| 2021 | 19,485 | 357 | 47 | 22 | 4,954 | 2,095 | 59 | 108 | 7,216 | 27,127 |
| 2022 | 14,989 | 363 | 17 | 285 | 4,771 | 1,998 | 54 | 98 | 6,921 | 22,575 |
| 2023 | 13,762 | 371 | 18 | 294 | 4,852 | 2,023 | 54 | 97 | 7,026 | 21,472 |
| 2024 | 13,466 | 383 | 19 | 296 | 5,088 | 2,122 | 56 | 102 | 7,369 | 21,534 |
| 2025 | 13,827 | 391 | 20 | 296 | 5,257 | 2,191 | 58 | 106 | 7,611 | 22,145 |
| 2026 | 14,305 | 399 | 20 | 296 | 5,443 | 2,267 | 60 | 109 | 7,879 | 22,901 |
| 2027 | 14,683 | 408 | 21 | 296 | 5,637 | 2,347 | 62 | 113 | 8,159 | 23,568 |
|
||||||||||
5.4 Premium Reductions and Rebate
The employer premiums can be reduced through a lower employer multiplier when its employees are covered under a qualified wage-loss plan which reduces EI special benefits otherwise payable, provided that at least 5/12 of the reduction is passed on to the employees. Premiums paid by employees and their employers can also be reduced when employees are covered under a plan established under provincial law which reduces EI maternity and parental (MP) benefits otherwise payable. An agreement must be in place between the Government of Canada and the province to establish a system for reducing premiums paid by residents of that province and their employers.
Budget 2019 announced an EI Small Business Premium Rebate to offset the upward pressure on EI premiums resulting from the EI Training Support Benefit (originally expected to be launched in late 2020, but now postponed to December 2021). This rebate is proposed to be available to any business that pays employer EI premiums equal to or less than $20,000 for the 2021 calendar year. Using forecasted calendar expenditures received from the Minister of ESD, the cost of the EI Training Support Benefit in 2021 (including the administration costs related to this benefit) is expected to represent 2 cents (1.77 cents unrounded, or 0.0177%). This cost is included in the 7‑year forecast break-even rate of 1.93%. The details of the rebate were not confirmed at the time the report was produced and will still need to be approved through legislation.
Table 7 shows the projection of the expected premium reductions and rebate up to 2027 taken into account in the determination of the 7-year forecast break-even rate.
| Calendar Year | Qualified Wage-Loss Plans | Provincial Plans | SBPRTable 7 - Footnote * |
|---|---|---|---|
| 2021 | 1,055 | 1,421 | 26 |
| 2022 | 1,114 | 1,371 | 27 |
| 2023 | 1,157 | 1,384 | 28 |
| 2024 | 1,202 | 1,474 | 29 |
| 2025 | 1,252 | 1,481 | 29 |
| 2026 | 1,294 | 1,570 | 29 |
| 2027 | 1,338 | 1,619 | 29 |
|
|||
5.5 7-Year Forecast Break-Even Rate
The 7-year forecast break-even rate is the rate that, based on relevant assumptions, is expected to generate sufficient premium revenue during the next seven years to ensure that, at the end of that seven-year period, the amounts credited and charged to the EI Operating Account (EIOA) after 31 December 2008 are equal.
For 2021, the Government has already confirmed that the premium rate would not be allowed to increase and would remain frozen at the 2020 premium rate level of 1.58%. For information purposes, this report shows how the 7-year forecast break-even rate is determined in order for the projected balance in the EI Operating Account as at 31 December 2027 to be $0. This rate is expected to generate sufficient premium revenue during the 2021-2027 period to pay for the expected EI expenditures over that same period and to eliminate the projected deficit that has accumulated in the EI Operating Account as of 31 December 2020.
The expected amounts of the premium reductions over the next seven years for qualified wage‑loss plans (WLP) and for provincial plans (PP), as well as the Small Business Premium Rebate related to the EI Training Support Benefit expected to launch in December 2021 are included in the EI expenditures for purposes of determining the 7-year forecast break-even rate.
This ensures that in the absence of wage-loss plans, provincial plans and Small Business Premium Rebate, a premium rate set at the 7-year forecast break-even rate would generate enough revenues to cover all EI expenses for employees of every employer residing in any province.
Table 8 shows the projection of the variables used to determine the 7-year forecast break-even rate. The annual expected pay-as-you-go rates (PayGo) are the rates required to cover the expected expenditures of that year. The 7-year forecast break-even rate is higher than the average PayGo rates since the projected deficit as at 31 December 2020 is considered.
| Calendar Year |
Expenditures Covered by the 7-Year Forecast Break-Even Rate | Surplus (Deficit) in the EIOA as at 31 December 2020 |
Earnings Base |
Annual PayGo Rate / 7-Year Forecast Break- Even Rate |
||||
|---|---|---|---|---|---|---|---|---|
| EI Expenditures | Reduction for WLP |
Reduction for PP |
SBPRTable 8 - Footnote * | Total Expenditures Before Reductions and Rebate |
||||
| 2021 | 30,990 | 1,055 | 1,421 | 26 | 33,493 | 1,587,073 | 2.11% | |
| 2022 | 26,478 | 1,114 | 1,371 | 27 | 28,990 | 1,660,174 | 1.75% | |
| 2023 | 25,002 | 1,157 | 1,384 | 28 | 27,571 | 1,727,247 | 1.60% | |
| 2024 | 25,081 | 1,202 | 1,474 | 29 | 27,787 | 1,794,745 | 1.55% | |
| 2025 | 25,685 | 1,252 | 1,481 | 29 | 28,446 | 1,857,685 | 1.53% | |
| 2026 | 26,426 | 1,294 | 1,570 | 29 | 29,318 | 1,919,987 | 1.53% | |
| 2027 | 27,080 | 1,338 | 1,619 | 29 | 30,067 | 1,986,275 | 1.51% | |
| 2021-27 | 186,742 | 8,412 | 10,321 | 198 | 205,673 | (35,789) | 12,533,186 | 1.93%Table 8 - Footnote ** |
|
||||||||
Table 9 shows the projection of revenues, EI expenditures, and the account balance using the 7‑year forecast break-even rate and the premium reductions.
| Calendar Year |
Premium Rate (%) |
Revenues | Net Premiums |
Expenditures | Annual Surplus (Deficit) |
Cumulative Surplus (Deficit) 31 December |
||||
|---|---|---|---|---|---|---|---|---|---|---|
| Gross Premiums after Refunds |
Reduction for WLP |
Reduction for Provincial Plans |
SBPRTable 9 - Footnote * | Other Adj. Table 9 - Footnote ** |
||||||
| 2019 | 1.62% | 25,420 | (1,004) | (1,307) | - | 58 | 23,169 | 21,269 | 1,900 | 5,174 |
| 2020 | 1.58% | 23,257 | (1,007) | (1,255) | - | (86) | 20,909 | 61,872 | (40,963) | (35,789) |
| 2021 | 1.93% | 30,631 | (1,055) | (1,421) | (26) | - | 28,128 | 30,990 | (2,862) | (38,651) |
| 2022 | 1.93% | 32,041 | (1,114) | (1,371) | (27) | - | 29,529 | 26,478 | 3,051 | (35,600) |
| 2023 | 1.93% | 33,336 | (1,157) | (1,384) | (28) | - | 30,766 | 25,002 | 5,764 | (29,835) |
| 2024 | 1.93% | 34,639 | (1,202) | (1,474) | (29) | - | 31,933 | 25,081 | 6,852 | (22,984) |
| 2025 | 1.93% | 35,853 | (1,252) | (1,481) | (29) | - | 33,092 | 25,685 | 7,407 | (15,577) |
| 2026 | 1.93% | 37,056 | (1,294) | (1,570) | (29) | - | 34,164 | 26,426 | 7,737 | (7,839) |
| 2027 | 1.93% | 38,335 | (1,338) | (1,619) | (29) | - | 35,349 | 27,080 | 8,268 | 429 |
|
||||||||||
The 2021 EI 7-year forecast break‑even rate is 1.93%. This rate would balance out the EI Operating Account at the end of 2027. The cumulative balance in the EI Operating Account at the end of 2027 is not exactly $0 since the 7-year forecast break-even rate is rounded to the nearest cent.
5.6 2021 Premium Freeze
On 6 August 2020, the Government confirmed that it will freeze the EI premium rate for 2021 at the 2020 premium rate. Consequently, the premium rate applicable to residents of all provinces except Québec will be 1.58%. The premium rate applicable to residents of Québec will be 1.18% (1.58% - 0.40%).
Table 10 shows the projection of revenues and the corresponding account balances for 2020 and 2021 based on a premium rate of 1.58%. Expenditures and premium reductions are the same as the ones shown in Table 9. For years after 2021, a premium rate would be recalculated each year based on the 7-year forecast break-even rate methodology considering the existing economic environment and revised assumptions at that time. The expected deficit at the end of calendar year 2020 corresponds to $35.8 billion and is mainly attributable to the EI ERBFootnote 6 introduced by the Government at the beginning of the COVID‑19 pandemic.
| Calendar Year |
Premium Rate (%) |
Revenues | Net Premiums |
Expenditures | Annual Surplus (Deficit) |
Cumulative Surplus (Deficit) 31 December |
||||
|---|---|---|---|---|---|---|---|---|---|---|
| Gross Premiums after Refunds |
Reduction for WLP |
Reduction for Provincial Plans |
SBPRTable 10 - Footnote * | Other Adj. Table 10 - Footnote ** |
||||||
| 2019 | 1.62% | 25,420 | (1,004) | (1,307) | - | 58 | 23,169 | 21,269 | 1,900 | 5,174 |
| 2020 | 1.58% | 23,257 | (1,007) | (1,255) | - | (86) | 20,909 | 61,872 | (40,963) | (35,789) |
| 2021 | 1.58% | 25,076 | (1,055) | (1,421) | (26) | - | 22,573 | 30,990 | (8,417) | (44,206) |
|
||||||||||
5.7 Québec Parental Insurance Plan (QPIP) Reduction for 2021
EI MP benefits included in Part I special benefits, as well as direct EI administrative costs incurred to provide MP benefits (variable administration costs (VAC)), are required to determine the QPIP reduction. The VAC represent the direct operating costs incurred by the EI program associated with the administration of EI MP benefits outside Québec. They are determined each year by ESDC in accordance with the agreement between Canada and Québec, which stipulates a minimum VAC amount.
EI MP benefits are projected from the base year (2019) and reflect the impacts of any program changes and special measures. The projected EI MP expenditures used to determine the 2021 QPIP reduction are shown in Table 11. They include the cost estimates provided by ESDC for the new Parental Sharing Benefits implemented in March 2019 and the temporary measures recently announced by the Government aimed at facilitating access to EI benefits.
| Actual | Forecast | ||
|---|---|---|---|
| 2019 | 2020 | 2021 | |
| EI MP Benefits | 4,139 | 4,313 | 4,954 |
| Variable Administration Costs | 17 | 17 | 17 |
| MP Expenditures | 4,156 | 4,330 | 4,971 |
The QPIP reduction is equal to the ratio of EI MP expenditures (EI MP benefits and VAC) to the earnings base of residents of all provinces without a provincial plan, that is, residents of all provinces except Québec. It is the premium reduction for Québec residents as it relates to the savings to the EI Program resulting from the QPIP.
Table 12 shows the estimates of the variables that are required in the calculation of the 2021 QPIP reduction, as well as the resulting 2021 QPIP reduction.
| 2021 Forecast | |
|---|---|
| MP Expenditures | 4,971 |
| MP Earnings Base (Out-of-Québec residents) | 1,231,817 |
| Unrounded QPIP Reduction | 0.4035% |
| QPIP Reduction | 0.40% |
5.8 Qualified Wage-Loss Plan Reductions for 2021
Based on the methodology developed in Appendix B and on the 2021 projected insurable earnings of employees covered by a qualified wage-loss plan, the 2021 estimated reduction in employer premiums due to qualified wage-loss plans is $1,055 million, compared to $1,007 million for 2020.
Table 13 shows the main results. A detailed explanation of the data and methodology used to derive the results are available in Appendix E.
| Wage-Loss Plan Category |
Unrounded Rate of Reduction |
Rounded Rate of Reduction |
Employer Multiplier (Out-of-Québec)Table 13 - Footnote * |
Employer Multiplier (Québec)Table 13 - Footnote * |
2021 Estimated Insurable Earnings ($ million) |
2021 Estimated Premium Reduction ($ million) |
|---|---|---|---|---|---|---|
| Category 1 | 0.2254% | 0.23% | 1.257 | 1.209 | 51,771 | 117 |
| Category 2 | 0.3704% | 0.37% | 1.166 | 1.086 | 25,785 | 96 |
| Category 3 | 0.3683% | 0.37% | 1.166 | 1.086 | 202,476 | 746 |
| Category 4 | 0.4048% | 0.40% | 1.144 | 1.057 | 24,049 | 97 |
| Total | N/A | N/A | N/A | N/A | 304,081 | 1,055 |
|
||||||
6. Uncertainty of Results
The 7-year forecast break-even rate and the subsequent impact on the EI Operating Account (EIOA) depends on different demographic and economic factors. The age distribution of the Canadian population has changed considerably over the last decades; the average age has been increasing as the baby boom cohorts have continued to age, the fertility rate has remained low and longevity has been increasing. Larger numbers of young people have chosen to pursue higher levels of education, delaying their full-time entry into the workforce. These changes have had a direct impact on the labour force. Countering these effects have been factors such as younger cohorts’ greater attachment to the labour force due to their higher level of education and older workers delaying their retirement due to their expected increase in longevity.
Economic cycles have also had an impact on the labour force and the unemployment rate. In times of recession, jobs were lost and workers found themselves involuntarily unemployed, while in times of growth, more workers were needed and wages tended to increase as companies competed for qualified labour. The current health and economic crisis resulting from the COVID-19 pandemic created an unprecedented shock to the Canadian labour market. The situation remains fluid and will likely continue to evolve for some time. The final impacts on the assumptions used in this report are still unknown.
The objective of this section is to illustrate the sensitivity of the 7-year forecast break-even rate to changes in the unemployment rate and the recipiency rate assumptions. Afterwards, the effect of a variation in the premium rate on the EIOA is examined.
6.1 Unemployment Rate
The unemployment rate is closely related to the state of the economy and the supply of labour. The following table shows that a variation in the average unemployment rate of 0.5% over the period 2021-2027 would result in an increase/decrease of about 0.07% in the 2021 EI 7‑year forecast break-even rate (assuming all other assumptions remain constant).
| Variation in Average UR (2021-2027) |
Average UR (2021-2027) |
Resulting 7-Year Forecast Break-Even Rate |
|---|---|---|
| (1.0%) | 5.3% | 1.79% |
| (0.5%) | 5.8% | 1.86% |
| Base | 6.3% | 1.93% |
| 0.5% | 6.8% | 2.00% |
| 1.0% | 7.3% | 2.07% |
6.2 Recipiency Rate
The volatility shown by the recipiency rate in the past can be attributed to a number of factors, such as the decision of those eligible for EI to apply (or not) for the benefit. The following table shows that a variation in the average recipiency rate of 5% over the period 2021-2027 would result in an increase/decrease of about 0.06% in the 2021 EI 7-year forecast break-even rate (assuming all other assumptions remain constant).
| Variation in Average RR (2021-2027) |
Average RR (2021-2027) |
Resulting 7-Year Forecast Break-Even Rate |
|---|---|---|
| (10.0%) | 63.9% | 1.81% |
| (5.0%) | 68.9% | 1.87% |
| Base | 73.9% | 1.93% |
| 5.0% | 78.9% | 1.98% |
| 10.0% | 83.9% | 2.04% |
6.3 Premium Rate
As shown in the following table, a variation in the premium rate of one‑hundredth percentage point (0.01% of insurable earnings) from the 7-year forecast break-even rate would result in a $1,253 million increase/decrease in the cumulative balance of the EIOA at the end of the 7‑year forecast period.
| Variation in EI 7-Year Forecast Break-Even Rate |
Resulting EI 7-Year Forecast Break-Even Rate |
Cumulative EIOA Balance as at 31 Dec. 2027 ($ million) |
Variation in EIOA Cumulative Balance as at 31 Dec. 2027 ($ million) |
|---|---|---|---|
| (0.05%) | 1.88% | (5,838) | (6,267) |
| (0.01%) | 1.92% | (824) | (1,253) |
| Base | 1.93% | 429 | - |
| 0.01% | 1.94% | 1,682 | 1,253 |
| 0.05% | 1.98% | 6,695 | 6,267 |
7. Reconciliation of Changes in the 7-Year Forecast Break‑Even Rate
The main elements of change in the 7-year forecast break-even rate since the 2020 Actuarial Report are presented in Table 17.
| 7-Year Forecast Break-Even Rate (%) |
|
|---|---|
| 2020 Actuarial Report - After Rounding | 1.58 |
| 2020 Actuarial Report - Before Rounding | 1.5764 |
| Higher than Projected EI Operating Account as at 31 December 2019 | (0.0086) |
| Change in Unemployment Rate assumptions over 7-year period | 0.1398 |
| Changes in Economics - Earnings Base | 0.0053 |
| Changes in Economics - Expenditures | (0.1235) |
| EI - Emergency Response Benefit | 0.2888 |
| Temporary Measures - Transition from CERB/EI ERB | 0.0611 |
| Change in 7-year period (2020-2026 to 2021-2027) | (0.0129) |
| 2021 Actuarial Report - Before Rounding | 1.9265 |
| 2021 Actuarial Report - After Rounding | 1.93 |
The 2019 experience was better than anticipated overall as revenues were slightly higher than projected in the 2020 Actuarial Report while expenditures were lower than expected. The net effect is an increase in the Cumulative Surplus of the EI Operating Account as at 31 December 2019 of $1,053 million, i.e. $5,174 million compared to $4,121 million projected in the 2020 Actuarial Report. This lowered the 7‑year forecast break-even rate.
As shown in the sensitivity test section, the unemployment rate assumption has a significant impact on the 7-year forecast break-even rate. In comparison with the 2020 Actuarial Report, the unemployment rate assumption was revised upward, from around 5.8% to 6.9% on average for the 2020-2026 period. The increase of the expected unemployment rate in the short term is due to the health and economic crisis resulting from the COVID-19 pandemic. This increased the 7-year forecast break-even rate.
Although the unemployment rate reached a record high in May 2020 and is expected to remain higher than the previous report’s projection for the next few years, the total amount of normal EI benefit expenditures for the projection period is similar to the previous report since unemployed Canadians were covered by the emergency response benefits (CERB and EI ERBFootnote 1) put in place as part of the Government of Canada’s COVID-19 Economic Response Plan. In the above table, this is reflected in the item “Changes in Economics – Expenditures”. The estimated cost of the EI ERB significantly increased the 7-year forecast break-even rate, accounting for more than 80% of the total increase.
The Government has confirmed the introduction of temporary transition measures aimed at facilitating access to EI. These measures include the application of a minimum unemployment rateFootnote 7 and a minimum weekly benefit rate, as well as a credit of insurable hours for regular and special EI benefits. These measures increased the 7-year forecast break-even rate.
Overall, the 7-year forecast break‑even rate increased from 1.58% in 2020 to 1.93% in 2021. However, as already mentioned, the Government confirmed that it will freeze the EI premium rate at 1.58% in 2021.
8. Conclusion
This report was prepared by the Actuary in accordance with the relevant legislation and provides to the Commission the forecasts and estimates for the purposes of sections 4 (MIE), 66 (EI premium rate) and 69 (employers who sponsor qualified wage-loss plans and premium reductions for Québec residents and their employers) of the EI Act.
In accordance with the methodology detailed in the EI Act and the relevant economic data, the 2021 MIE is $56,300. In addition, the 2021 estimated employer premium reduction due to qualified wage-loss plans is $1,055 million, and the 2021 QPIP reduction is 0.40%.
Based on the assumptions of the relevant economic and demographic variables provided by the Minister of Finance, on the expenditure estimates provided by the Minister of ESD, and on the methodology and other assumptions developed by the Actuary, the 7-year forecast break-even rate that would generate sufficient premium revenue to cover the expected cost of the EI program for the period 2021-2027 and eliminate the projected $35.8 billion cumulative deficit in the EI Operating Account as of 31 December 2020, is 1.93% of insurable earnings. The increase between the 2020 and 2021 forecast break-even rate (1.58% to 1.93%) is the result of the situation created by the COVID-19 pandemic. Based on estimates received from ESDC, the largest part of this increase (0.29%) can be attributed to the EI ERBFootnote 1. Another portion of the increase (0.06%) can be attributed to the upcoming temporary measures recently announced by the Government to help people transition from the CERB and the EI ERB to EI.
However, the Government already confirmed that it will freeze the EI premium rate for 2021 at the 2020 premium rate. Consequently, the 2021 premium rate will be equal to:
- 1.58% of insurable earnings for residents of all provinces except Québec; and
- 1.18% of insurable earnings for residents of Québec, after taking into account the QPIP reduction of 0.40%.
9. Actuarial Opinion
In our opinion, considering that this report was prepared pursuant to the Canada Employment Insurance Act and Regulations:
- the data on which this report is based are sufficient and reliable for the purposes of this report;
- the assumptions used are, individually and in aggregate, reasonable and appropriate for the purposes of this report; and
- the methods employed are appropriate for the purposes of this report.
Based on the results of this valuation, we hereby certify that the 7-year forecast break-even rate required to generate sufficient premium revenue to cover the expected cost of the EI program over the period 2021-2027 and eliminate the projected cumulative deficit in the EI Operating Account as of 31 December 2020, is 1.93% of insurable earnings.
This report has been prepared, and our opinions given, in accordance with accepted actuarial practice in Canada, in particular, the General Standards of the Standards of Practice of the Canadian Institute of Actuaries.
The estimates presented in this report are based on the Employment Insurance provisions as of 22 July 2020. They also take into account additional information received from Employment and Social Development Canada on 6 August 2020, including upcoming temporary measures. However, the estimates were not revised after the Government announcement on 20 August 2020 stating that the CERB (including the EI ERB) would be extended by an additional four weeks, providing a maximum of 28 weeks, rather than 24 weeks.
As of the date of the signing of this report, we have not learned of any other events, subsequent to 22 July 2020, that would have a material impact on the 2021 7-year forecast break-even rate presented in this report.
Annie St-Jacques, FCIA, FSA
Senior Actuary, Employment Insurance Premium Rate-Setting
Myriam Demers, ACIA, ASA
21 August 2020
Appendix A - Summary of EI Legislation
The Unemployment Insurance program was first implemented in 1940, with the last major reform occurring in 1996. At that time, the name of the program was changed from “Unemployment Insurance” to “Employment Insurance” to reflect the program’s primary objective of promoting employment in the labour force and to better emphasize that individuals’ access to the program is linked to significant workforce attachment.
The EI program provides temporary income support to individuals who have lost their employment through no fault of their own or are unable to work due to specific life circumstances. This Appendix provides a brief overview of the EI program.
A.1 EI Part I Benefits
Although access and entitlement to benefits vary depending on each benefit type, the calculation of weekly benefit rates is the same for most benefit types. Weekly benefits are generally equal to 55% of the claimants’ insurable earnings, during their variable best weeks over the qualifying period (generally 52 weeks), up to a maximum amount. The number of best weeks taken into account is determined by the regional unemployment rate and varies from 14 to 22 insurable earnings weeks. The maximum amount payable is determined by the maximum insurable earnings (MIE).
The EI family supplement provides additional benefits to low-income families with children. The family supplement rate is based on the net family income up to a maximum of $25,921 per year and the number of children in the family and their ages. The family supplement may increase benefits up to 80% of average insurable earnings.
Benefits are not paid until claimants have served a waiting period of one week of unemployment.
To stay connected to the labour market and earn some additional income, EI claimants can work while they are on claim. This measure is available to those collecting regular, fishing, maternity, parental, sickness, compassionate care or family caregiver benefits. Claimants can keep 50 cents of their EI benefits for every dollar they earn, up to a maximum of 90 per cent of the weekly insurable earnings used to calculate their EI benefit amount.
A.1.1 Regular Benefits
EI regular benefits are provided to eligible insured persons who have lost their jobs through no fault of their own (for example, due to a shortage of work, seasonal or mass lay-offs) and are available for and able to work but can’t find a job.
To qualify for regular benefits, individuals must have been without work and without pay for at least seven consecutive days. Claimants must have worked at least the minimum required hours of insurable employment, between 420 and 700 hours, as determined by the regional unemployment rate, in the last 52-week qualifying period. The number of insurable hours required to qualify is increased in cases of violations regarding prior EI claims. Claimants must also be actively looking for work in order to maintain eligibility.
The maximum number of regular benefit weeks varies from 14 to 45 weeks, depending on the number of insurable hours accumulated in the qualifying period and the regional unemployment rate. From time to time, the maximum duration of benefits can be extended through temporary special measures.
A.1.2 Fishing Benefits
EI provides fishing benefits to qualifying self-employed fishers who are actively seeking work. Unlike regular EI benefits, eligibility for EI fishing benefits is determined by the claimant's insurable fishing earnings accumulated during the qualifying period, not the number of hours worked. A self‑employed person engaged in fishing who has earned at least between $2,500 and $4,200 (depending on the regional unemployment rate) during the maximum 31 week qualifying period is eligible to receive up to 26 weeks of EI fishing benefits.
A.1.3 Work-Sharing Benefits
To avoid lay-offs due to a temporary reduction in the normal level of business activity that is beyond the control of the employer, employers and employees can enter into a Work-Sharing agreement with the Canada Employment Insurance Commission (Commission) through Service Canada to provide EI benefits to eligible workers willing to work a temporarily reduced work week. This enables employers to retain staff and adjust their work activity during temporary work shortages, as well as avoid the expenses of hiring and training new staff once business levels return to normal. Employees are able to retain their skills and jobs while receiving EI benefits for the days that they do not work.
Work-Sharing agreements have a minimum duration of 6 weeks and a maximum of 26 weeks, with a possible extension of up to 12 weeks for a maximum duration of 38 weeks. From time to time, the maximum duration of Work-Sharing agreements may be extended through temporary special measures.
A.1.4 Special Benefits
To qualify for special benefits, the claimant's normal weekly earnings must be reduced by over 40%. In addition, special benefits require a minimum of 600 hours of insurable employment in the 52-week qualifying period. Special benefits include:
- Maternity benefits, for mothers who give birth. These benefits can be paid for a maximum of 15 weeks. They can start as early as 12 weeks before the expected date of birth, and can end as late as 17 weeks after the actual date of birth.
- Parental benefits, for a parent to take care of their newborn or newly adopted child. Parents may share the available weeks of parental benefits. There are two options available:
- Standard parental benefits can be paid for a maximum of 40 weeks at 55% of the claimant’s average weekly insurable earnings (up to a maximum) and must be claimed within a 52 week period (12 months) after the week the child was born or placed for the purpose of adoption. As no parent can access more than 35 weeks, sharing parental benefits is required to access the additional weeks.
- Extended parental benefits can be paid for a maximum of 69 weeks at 33% of the claimant’s average weekly insurable earnings (up to a maximum) and must be claimed within a 78 week period (18 months) after the week the child was born or placed for the purpose of adoption. As no parent can access more than 61 weeks, sharing parental benefits is required to access the additional weeks.
- Sickness benefits, for people who are unable to work due to illness, injury or quarantine. These benefits can be paid for a maximum of 15 weeks.
- Compassionate care benefits, for people who take a temporary leave from work to provide end-of-life care or support for a family member who has a significant risk of death in the next 6 months. These benefits can be paid for a maximum of 26 weeks, which can be shared among eligible family caregivers.
- Family Caregiver Benefit for Children, for family members who must be away from work to care for or support a critically ill or injured child. This benefit can be paid for a maximum of 35 weeks, which can be shared among eligible family caregivers.
- Family Caregiver Benefit for Adults, for family members who must be away from work to care for or support a critically ill or injured adult. This benefit can be paid for a maximum of 15 weeks, which can be shared among eligible family caregivers.
Since 2006, the Province of Québec has been responsible for providing maternity, parental and adoption (MPA) benefits to residents of Québec through the Québec Parental Insurance Plan (QPIP). All other types of EI benefits remain available to residents of Québec.
Self-employed fishers can qualify for special benefits with fishing earnings of $3,760 during the 31-week qualifying period.
Self-employed Canadians voluntarily enter into an agreement with the Commission through Service Canada to contribute EI premiums and access EI special benefits. They must be registered for at least one year prior to claiming benefits and their self-employment earnings must meet the minimum self-employment eligibility threshold in the year preceding the claim.
Self-employed residents of Québec entering into an agreement with the Commission cannot access EI MP benefits, as maternity and parental (including adoption) benefits are already payable through QPIP, but can access sickness, compassionate care and family caregiver benefits.
A.2 EI Part II Benefits
Part II of the EI Act includes Employment Benefits and Support Measures (EBSM), which are labour market programs and services established to help Canadians find and keep employment and to develop a labour force that meets the current and emerging needs of employers. These programs are delivered mostly by provincial and territorial governments through Labour Market Development Agreements (LMDAs).
A.3 EI Part VIII.4 – EI ERB
Part VIII.4 of the EI Act introduces the EI ERB, which provides a benefit of $500 per week to eligible insured persons who are unable to work for reasons related to COVID‑19.
To qualify for the benefit, individuals must reside in Canada, be at least 15 years of age, have insurable earnings of at least $5,000 in 2019 or in the 52 weeks preceding the day on which they make the claim, have ceased to work for at least seven consecutive days within the two‑week period in respect of which they claim the benefit and have no income from employment or self‑employment in respect of the consecutive days on which they ceased working.
The maximum number of benefit weeks payable for claims made for any two-week period between 15 March 2020 and 3 October 2020 is 24Footnote 8. No claim can be made after 2 December 2020.
A.4 Financing
The EI program is financed by contributions from employees and employers, via premiums paid on insurable earnings up to the MIE. Employee premiums apply to insurable earnings, up to the MIE. However, the EI program has specific provisions for contributors who are unlikely to qualify for benefits, e.g. employees with insured earnings of less than $2,000 are entitled to a refund of their EI premiums when they file an income tax return.
In addition, in accordance with subsection 69(2) of the EI Act and related regulations, a mechanism to reduce EI premiums paid by Québec residents and their employers was introduced. The reduced premium rate reflects the savings to the EI program due to the existence of the QPIP.
Since 31 January 2010, self-employed individuals may voluntarily opt into the EI program to receive EI special benefits. Self-employed individuals pay the same EI premium rate as salaried employees but are not required to pay the employer portion of premiums, as they do not have access to EI regular benefits.
Employers pay premiums at the rate of 1.4 times those of employees. Employers bear a higher overall share of program costs based on the principle that they have more control over layoffs. However, in accordance with subsection 69(1) of the EI Act, employers who sponsor a qualified wage-loss plan which reduces the EI special benefits otherwise payable receive a premium reduction if they meet the requirements set out by the Commission. In such cases, the employer pays premiums at a rate that is lower than 1.4 times those of employees, and a portion of those savings must be returned to their employees.
A.5 Premium Rate
In accordance with subsection 66(1) of the EI Act, the Commission shall set the premium rate for each year in order to generate just enough premium revenue to ensure that, at the end of the seven-year period that commences at the beginning of that year, the total of the amounts credited to the EI Operating Account after 31 December 2008 is equal to the total of the amounts charged to that Account after that date. This calculated premium rate is referred to as the 7-year forecast break-even rate.
Legislative Framework
The EI Act includes the following dates by which various responsibilities related to the setting of the EI premium rate must be met.
22 July
The Minister of Employment and Social Development (ESD) shall provide the information prescribed in subsection 66.1(1) of the EI Act.
The Minister of Finance shall provide the information prescribed in subsection 66.2(1) of the EI Act.
22 August
In accordance with section 66.3 of the EI Act, the Actuary shall prepare actuarial forecasts and estimates for the purposes of sections 4, 66 and 69 of the EI Act, and shall provide the Commission with a report that sets out:
- the forecast premium rate for the following year and a detailed analysis in support of the forecast;
- the calculations performed under sections 4 and 69 of the EI Act;
- the information provided under section 66.1 of the EI Act; and
- the source of the data, the actuarial and economic assumptions and the actuarial methodology used.
31 August
The Commission shall provide the Ministers of ESD and Finance with the report referred to in section 66.3 and a summary of that report.
14 September
The Commission shall set the premium rate for the following year and make available to the public the report referred to in section 66.3 of the EI Act and a summary of that report. After the premium rate is set and the report and its summary are made available to the public, the Minister of ESD shall cause them to be laid before each House of Parliament on any of the next 10 days during which that House is sitting.
30 September
The Governor in Council may set a premium rate that is different from the one set by the Commission, based on the joint recommendation of the Ministers of ESD and Finance, if it is considered to be in the public interest.
Appendix B - Premium Calculation Methodology
B.1 Premium Rate
Based on relevant assumptions and prior to any limit to the annual change in the premium rate, the 7-year forecast break-even rate for 2021 is the premium rate that is expected to generate sufficient premium revenue to ensure that at the end of 2027 the amounts credited and charged to the EI Operating Account after 31 December 2008 are equal. It is therefore based on the projected balance of the EI Operating Account as of 31 December 2020 and the projection over a period of seven years (2021-2027) of both the earnings base and EI expenditures.
The earnings base represents the total insurable earnings on which salaried employees and their employers pay EI premiums, and the earnings on which self‑employed individuals that opted into the EI program pay EI premiums. The employer portion of the earnings base for salaried employees is equal to 1.4 times the employee portion of the earnings base for salaried employees, prior to the adjustment to reflect employee premium refunds.
In accordance with section 69 of the EI Act and related regulations, premium reductions are granted to employers who sponsor a qualified wage-loss plan as well as to employees residing in a province that has established a provincial plan and their employers. The expected costs of these premium reductions over the next seven years are included in the EI expenditures for purposes of determining the 7-year forecast break-even rate. More information on these premium reductions as well as the methodology used for calculating the applicable reductions for 2021 are provided in subsections B.2 (wage-loss) and B.3 (provincial plan).
For purposes of determining the 7-year forecast break-even rate, the earnings base and EI expenditures are projected over a seven-year period using the expected growth rates in the relevant economic and demographic variables applied to the base year, i.e. the last year for which complete data are available. The base year for the earnings base is 2018, which is the most recent year for which fully assessed T4 data are available. However, for certain assumptions, the 2019 partially assessed information is used. Complete data for 2019 will not become available until January 2021. The base year for EI benefits is calendar year 2019.
The earnings base and EI expenditures are projected from the base year using:
- Data and assumptions provided by the Minister of ESD, including prescribed information as set out in section 66.1 of the EI Act;
- Assumptions and forecasts provided by the Minister of Finance in accordance with section 66.2 of the EI Act;
- Additional data provided by Service Canada, ESDC, and the Canada Revenue Agency (CRA); and
- Methodology and other assumptions developed by the Actuary.
The 7-year forecast break-even rate is calculated such that the sum of expected revenues from insurable and self-employed covered earnings over the next seven years and the EI Operating Account balance as of 31 December 2020 are equal to the expected EI expenditures over the same period. For this purpose, the expected EI expenditures include the expected amount of premium reductions granted to employers who sponsor a qualified wage-loss plan as well as to employees residing in a province that has established a provincial plan and their employers.
The expected EI expenditures are comprised of:
- Direct program expenditures, including:
- EI Part I benefits, net of benefit repayments that apply in certain situations (e.g. if a claimant’s income for a tax year exceeds 1.25 times the annual MIE, the claimant may be required to repay a portion of benefits received);
- EI Part II benefits, that is, employment benefits and support measures;
- Additional benefits paid through various pilot projects and special measures. In 2020, this includes the new Part VIII.4 (EI ERB) benefit;
- Administration costs; and
- Other costs such as bad debt expense, net of penalties and interests recovered from claimants.
- Premium reductions granted to employers who sponsor qualified wage‑loss plans;
- Premium reductions granted to employees residing in a province that has established a provincial plan and to their employers; and
- Premium rebate granted to small businesses related to the new EI Training Support Benefit expected to launch in late 2020 and later postponed to December 2021. The details of the rebate still need to be confirmed through legislation.
The expected revenues are comprised of:
- Employer premiums paid on behalf of salaried employees over the next seven years prior to premium reductions and rebate;
- Employee premiums over the next seven years for earnings included in insured employment of salaried employees, net of refunds that apply in certain situations (e.g. insurable earnings below $2,000, over contributions due to multiple employments in the year) and prior to premium reductions for provincial plans; and
- Employee premiums over the next seven years for self-employed individuals who voluntarily opted into the EI program prior to premium reductions for provincial plans.
Depending on the projected cumulative balance in the EI Operating Account as at 31 December 2020, the 7-year forecast break-even rate could either increase or decrease. For 2021, given that the projected EI Operating Account as of 31 December 2020 is projected to be in deficit, the amortization of the projected EI Operating account balance increases the 7-year forecast break-even rate.
The formula for calculating the 7-year forecast break-even rate is developed as follows:
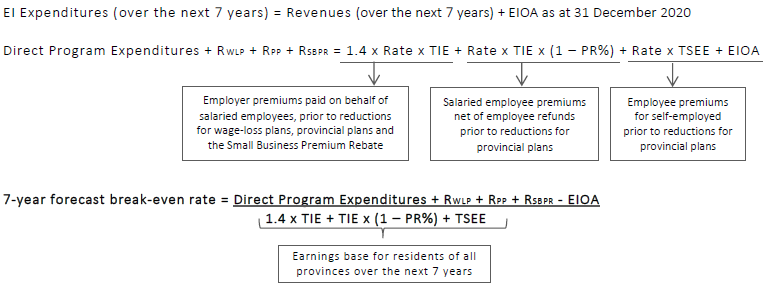
Text version
The EI expenditures over the next 7 years are equal to the sum of the revenues over the same period and the EI Operating Account’s balance as of 31 December 2020.
The EI expenditures on the left side of the equation are expressed as the sum of the direct program expenditures, the amount of reduction in the employer premiums due to qualified wage-loss plans, the amount of reduction in employee and employer premiums due to provincial plans and the small business premium rebate that will offset costs of the new EI Training Support Benefit proposed in Budget 2019 and expected to launch in late 2021.
The EI revenues on the right side of the equation represent the sum of employer premiums paid on behalf of salaried employees (prior to reductions for wage-loss plans, provincial plans and the small business premium rebate), salaried employee premiums (net of employee refunds prior to reductions for provincial plans) and employee premiums for self–employed (prior to reductions for provincial plans).
The employer premiums paid on behalf of salaried employees (prior to reductions for wage-loss plans, provincial plans and the small business premium rebate) are equal to 1.4 multiplied by the rate and the total insurable earnings for salaried employees prior to adjustments for employee premium refunds (referred to as TIE).
The salaried employee premiums (net of employee refunds prior to reductions for provincial plans) are equal to the product of the rate, the TIE and (1 minus the average adjustment over the next 7 years to reflect employee premium refunds, expressed as a percentage of TIE).
The employee premiums for self-employed (prior to reductions for provincial plans) are calculated by multiplying the rate by the total self-employed earnings over the next 7 years for individuals who opted into the EI program.
The resulting 7-year forecast break-even rate is equal to the ratio of the sum over the next 7 years of the direct program expenditures, the amount of reduction in employer premiums due to qualified wage-loss plans, the amount of reduction in employee and employer premiums due to the provincial plans and the small business premium rebate that will offset costs of the new EI Training Support Benefit proposed in Budget 2019 and expected to launch in late 2021 net of the EI Operating Account’s balance as of 31 December 2020 over the earnings base of residents of all provinces over the next 7 years.
The earnings base of residents of all provinces over the next 7 years is calculated as:
1.4 times the TIE, plus the TIE times (1 minus the adjustment to reflect employee premium refunds which is expressed as a percentage of TIE) plus the total self-employed earnings for individuals who opted into the EI program.
Where:
RWLP = amount of reduction in employer premiums due to qualified wage -loss plans over the next 7 years;
RPP = amount of reduction in employee and employer premiums due to provincial plans over the next 7 years;
RSBPR = small business premium rebate to offset costs of the new EI training support benefit proposed in Budget 2019 and expected to launch in December 2021;
EIOA = EI Operating Account as of 31 December 2020 (surplus/(deficit));
TIE = total insurable earnings over the next 7 years for salaried employees prior to adjustments for employee premium refunds;
PR% = average adjustment over the next 7 years to reflect employee premium refunds (as a percentage of TIE);
TSEE = total self -employed earnings over the next 7 years for individuals who opt into the EI program.
A description of the assumptions used in projecting the variables included in the above formulas is provided in Section 4 of the main report, with additional supporting information provided in Appendix D.
B.2 Reduction in Employer Premiums Due to Qualified Wage-Loss Plans
Generally, EI premiums paid by the employer are equal to 1.4 times the premiums deducted by the employer on behalf of the employee, referred to as the employer multiplier. However, pursuant to subsection 69(1) of the EI Act, the employer premiums can be reduced through a lower employer multiplier when its employees are covered under a qualified wage-loss plan which reduces EI special benefits otherwise payable, provided that at least 5/12 of the reduction is passed on to the employees.
In accordance with sections 63, 64, 65 and 66 of the Employment Insurance Regulations (“EI Regulations”), there are four distinct categories of qualified wage-loss plans, and a separate rate of reduction, expressed as a percentage of insurable earnings, is calculated annually for each category. These rates of reduction are then converted into reduced employer multipliers for each category and applicable premium rate. The principle in determining the rates of reduction is that the EI program is paying lower sickness benefits due to the presence of qualified wage-loss plans, and that these savings to the EI program should be passed on to the employers who sponsor these plans and their employees. For administrative simplicity, the full premium reduction is provided to the employer who is then responsible for returning the employees’ portion of the reduction to them.
As discussed in the previous subsection, the projection over seven years of the reduction in employer premiums due to qualified wage-loss plans is taken into account in the determination of the 7-year forecast break-even rate. For this purpose, it is viewed as a cost to the EI program and included in the numerator of the 7-year forecast break-even rate calculation. However, the cost to the EI program of granting premium reductions to employers with qualified wage-loss plans is offset by the savings to the EI program generated by lower EI sickness benefits due to the existence of qualified wage-loss plans. In addition to determining the 7-year forecast break-even rate, one of the purposes of this report is to determine the reduction in employer premiums due to qualified wage‑loss plans that will apply for 2021. The remainder of this subsection provides summarized information on this.
The methodology to calculate the rates of reduction applicable for 2021 is prescribed in section 62 of the EI Regulations. Pursuant to this section, the employer’s premium rate shall be reduced by the percentage by which the first payer cost ratio in respect of all insured persons exceeds the experience cost ratio in respect of insured persons covered by a qualified wage-loss plan of that employer’s category. The formula used in determining the rate of reduction of each category is provided below:
Rate of reduction(x) = First Payer Cost ratio – Experience Cost ratio(x)
Where:
x = Category of wage-loss plan (1 to 4).
First-Payer Cost (FPC) ratio
The FPC ratio, which is identical for all insured persons and categories, represents the average estimated job-attachedFootnote 9 EI sickness benefits that would have been paid if benefits payable under a group sickness or disability wage-loss indemnity plan or paid sick leave plan were disregarded for purposes of determining benefits otherwise payable to persons under the EI Act. It is expressed as a percentage of average insurable earnings for all insured persons. The FPC for each year is determined by multiplying the hypothetical number of first payer job-attached EI sickness benefit weeks by the average weekly sickness benefits that would apply in such circumstance.
For the purposes of calculating the 2021 rates of reduction, the FPC ratio is equal to the average of the FPC for the years 2017 to 2019, divided by the average insurable earnings of all insured persons for the years 2017 to 2019. The formula used in determining the FPC ratio is provided below:
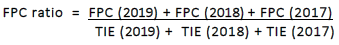
Text version
The first payer cost ratio is calculated by dividing the sum of the first payer cost for years 2019, 2018 and 2017 by the sum of the total insurable earnings for years 2019, 2018 and 2017 for all salaried employees, prior to adjustments for employee premium refunds.
Where:
TIE = total insurable earnings for all salaried employees prior to adjustments for employee premium refunds.
Experience Cost (EC) ratio
The EC ratio is different for each category and reflects the actual average job‑attached EI sickness benefits paid for each category. It is expressed as a percentage of average insurable earnings for the insured persons in that category.
The EC for each year and category, as well as the allocation of insurable earnings amongst categories are based on an analysis of administrative data provided by Service Canada and ESDC.
Similarly to the calculation of the FPC ratio, for the purposes of calculating the 2021 rates of reduction, the EC ratio of each category is based on the years 2017 to 2019. The formula used in determining the EC ratio of each category is provided below:
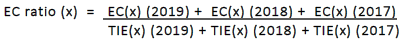
Text version
The experience cost ratio for a given category of wage-loss plan (1 to 4) is equal to the sum of the experience cost of that category for years 2019, 2018 and 2017, divided by the sum of the total insurable earnings for years 2019, 2018 and 2017 for salaried employees of that given category, prior to adjustments for employee premium refunds.
Where:
x = Category of wage-loss plan (1 to 4);
TIE(x) = total insurable earnings for salaried employees of the category x, prior to adjustments for employee premium refunds.
Rates of Reduction and Amount of Premium Reduction
The resulting uniform FPC ratio applicable to all categories and the EC ratio of each category are used to determine the 2021 rates of reduction per category. The 2021 estimated insurable earnings per category are then used to estimate the 2021 employer premium reduction due to qualified wage-loss plans.
The estimated employer premium reduction due to qualified wage-loss plans for years 2022 to 2027 are projected assuming that the 2019 FPC and EC ratios remain constant throughout the projection (with an adjustment in 2020 due to COVID-19).
Additional supporting information on the calculation of the 2021 employer premium reduction due to qualified wage-loss plans and of each separate component is provided in Appendix E.
B.3 Reduction in Premiums Due to Provincial Plan
In accordance with subsection 69(2) of the EI Act and related regulations, premiums paid by employees and their employers can be reduced when employees are covered under a plan established under provincial law which reduces EI maternity and parental (MP) benefits otherwise payable, provided that an agreement has been entered into between the Government of Canada and the province to establish a system for reducing premiums paid by residents of that province and their employers.
As discussed in the previous subsection, the projection over seven years of the reduction in premiums due to the presence of provincial plans is taken into account in the determination of the 7-year forecast break-even rate. For this purpose, it is viewed as a cost to the EI program and included in the numerator of the 7-year forecast break-even rate calculation. However, the cost to the EI program of granting these premium reductions is offset by the savings to the EI program generated by lower EI MP benefits due to the existence of provincial plans. In addition to determining the 7-year forecast break-even rate, one of the purposes of this report is to determine the reduction in premiums due to provincial plans that will apply for 2021. The remainder of this subsection provides more information on this.
Since 1 January 2006, the province of Québec has been responsible for providing maternity, parental and adoption (MPA) benefits to the residents of Québec through the Québec Parental Insurance Plan (QPIP). Pursuant to subsection 69(2) of the EI Act and related regulations, a mechanism to reduce EI premiums paid by Québec residents and their employers was introduced. The reduced premium rate reflects the savings to the EI program due to the existence of the QPIP. To date, the QPIP is the only provincial plan established in Canada.
Pursuant to the agreement signed between the Government of Canada and the Government of Québec and in accordance with Part III.1 of EI Regulations, the 2021 premium reduction for the MP provincial plan in the province of Québec, also referred to as the QPIP reduction, is equal to the ratio of the 2021 EI MP expenditures, including EI MP benefits and the variable administrative costs related to administering EI MP benefits, to the 2021 earnings base of residents outside the province of Québec. Accordingly, the formula for the QPIP reduction is as follows:
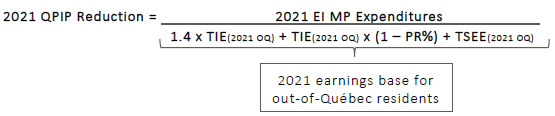
Text version
The 2021 QPIP reduction is equal to the 2021 EI MPA expenditures divided by the 2021 earnings base for out-of-Quebec residents.
The earnings base for out-of-Quebec residents is developed as follows: 1.4 times the 2021 TIE for out-of-Quebec residents, plus the 2021 TIE for out-of-Quebec residents times (1 minus the adjustment to reflect employee premium refunds which is expressed as a percentage of TIE), plus the 2021 total self-employed earnings for out-of-Quebec residents who opted into the EI program.
Where:
TIE(2021 OQ) = 2021 total insurable earnings for out -of-Québec resident salaried employees, prior to adjustments for employee premium refunds;
PR% = adjustment to reflect 2021 employee premium refunds (as a percentage of TIE);
TSEE(2021 OQ) = 2021 total self-employed earnings for out-of-Québec residents who opted into the EI program.
Appendix C - Maximum Insurable Earnings (MIE)
Section 4 of the Employment Insurance Act (“EI Act”) provides details on how to determine the yearly MIE, the income level up to which EI premiums are paid and up to which EI benefits are calculated.
Based on the EI Act, the annual MIE is set at $39,000, beginning in 1996, until this threshold is surpassed by 52 times the product obtained by multiplying:
- the average for the 12-month period ending on April 30 in the preceding year of the Average Weekly Earnings (AWE), according to the latest revision of Statistics CanadaFootnote 10, for each month in that period
by
- the ratio that the average for the 12-month period ending on April 30 in that preceding year of the AWE for each month in that 12-month period bears to the average for the 12-month period ending twelve months prior to April 30 of that preceding year of the AWE for each month in that 12-month period ending twelve months prior to April 30 of that preceding year.
In the year in which the threshold is surpassed, the MIE is equal to the amount calculated as described above, and is rounded down to the nearest multiple of $100.
For subsequent years, the MIE before rounding is equal to the previous year’s MIE before rounding, multiplied by the average of the AWE for each month for the twelve month period ending on April 30 of the previous year divided by the average of the AWE for each month for the twelve month period ending on April 30 in the year prior to the previous year. This unrounded MIE is then rounded down to the nearest multiple of $100.
In accordance with the EI Act, the first time the $39,000 threshold was exceeded was for 2007. The revised unrounded MIE for 2007 is $40,072.92Footnote 11.
The unrounded MIE for 2021 is equal to the unrounded MIE from 2007 ($40,072.92) multiplied by the average of the AWE for each month for the twelve month period ending 30 April 2020 ($1,045.3308) divided by the average of the AWE for each month for the twelve month period ending 30 April 2006 ($743.5792).
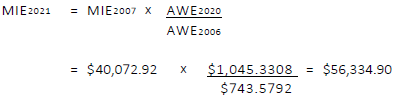
Text version
The 2021 MIE is calculated by multiplying the 2007 MIE by the ratio of the 2020 AWE to the 2006 AWE, that is, $40,072.92 times $1,045.3308 divided by $743.5792, which is equal to $56,334.90.
Rounded down to the nearest multiple of $100, the MIE is $56,300 for 2021. This is an increase of $2,100 or 3.9% from the 2020 MIE of $54,200.
| Year | 12-Month AWE Average as of 30 April |
Revised Unrounded MIE |
Applicable MIE | % change in Applicable MIE |
|---|---|---|---|---|
| 2005 | 717.4750 | 37,256.86 | 39,000 | - |
| 2006 | 743.5792 | 38,374.17 | 39,000 | - |
| 2007 | 764.8708 | 40,072.92 | 40,000 | 2.6% |
| 2008 | 796.5883 | 41,220.37 | 41,100 | 2.8% |
| 2009 | 814.8108 | 42,929.69 | 42,300 | 2.9% |
| 2010 | 830.0800 | 43,911.73 | 43,200 | 2.1% |
| 2011 | 862.2858 | 44,734.62 | 44,200 | 2.3% |
| 2012 | 878.4533 | 46,470.25 | 45,900 | 3.8% |
| 2013 | 901.3908 | 47,341.55 | 47,400 | 3.3% |
| 2014 | 919.2325 | 48,577.70 | 48,600 | 2.5% |
| 2015 | 943.4517 | 49,539.22 | 49,500 | 1.9% |
| 2016 | 952.8042 | 50,844.44 | 50,800 | 2.6% |
| 2017 | 961.3083 | 51,348.46 | 51,300 | 1.0% |
| 2018 | 985.3458 | 51,806.77 | 51,700 | 0.8% |
| 2019 | 1,007.1592 | 53,102.19 | 53,100 | 2.7% |
| 2020 | 1,045.3308 | 54,277.76 | 54,200 | 2.1% |
| 2021 | N/A | 56,334.90 | 56,300 | 3.9% |
The MIE for years prior to 2021 are not revised and are based on the legislation that applied at the time they were determined. However, the 2021 MIE reflects retroactive adjustments to the calculation in accordance with current legislation.
2021 Minimum Self-Employed Earnings (MSEE)
To qualify for EI special benefits, self-employed individuals who opted in the EI program need to earn at least the MSEE during the calendar year before the year they submit a claim. For claims filed in 2020, in accordance with subsection 11.1 of the EI Regulations, the unrounded MSEE of 2020 was $1,007.1592 of self‑employed earnings in 2019. It is adjusted annually on a compound basis by the same ratio used for the indexation of the MIE (see previous section), rounded down to the nearest dollar.

Text version
The minimum self-employed earnings for 2021 is calculated by multiplying the minimum self-employed earnings for 2020, by the ratio of the 2020 AWE to the 2019 AWE, that is, $7,279.91 times $1,045.3308 divided by $1,007.1592, which is equal to $7,552.82.
Appendix D – Data, Methodology and Assumptions
This appendix describes the data, methodology and assumptions that underlie the projections of the earnings base and expenditures included in this report. Although the assumptions have been developed using the most up-to-date available information, the resulting estimates should be interpreted with caution. These estimates are projections, and eventual differences between future experience and these projections will be analyzed and taken into account in subsequent reports.
D.1 Prescribed Data
D.1.1 Minister of Employment and Social Development
Under subsection 66.1(1) of the Employment Insurance Act (“EI Act”), the Minister of Employment and Social Development (ESD) shall provide the Actuary, on or before 22 July of each year, with:
- the forecast change in payments to be made under paragraphs 77(1) (a), (b) or (c) of the EI Act during each of the following seven years if any changes to the payments to be made are announced;
- the forecast administration costs to be paid under paragraphs 77(1) (d),(d.1) and (g) of the EI Act during each of the following seven years, including any forecast change in those costs resulting from any change to the payments to be made under paragraphs 77(1) (a), (b) or (c) of the EI Act; and
- the total amounts charged to the EI Operating Account as of the last day of the most recent month for which that total is known.
Given the exceptional circusmtances created by the COVID-19 pandemic, the Minister of ESD provided additional information on 6 August 2020.
For the purposes of determining the 2021 EI 7-year forecast break‑even rate under section 66 of the EI Act, the Minister of ESD has provided the Actuary with the following information:
| Actual | Forecast | ||||||||
|---|---|---|---|---|---|---|---|---|---|
| Part I | 2019 | 2020 | 2021 | 2022 | 2023 | 2024 | 2025 | 2026 | 2027 |
| Pilot Projects / Special Measures | |||||||||
| Pilot Project - Support for eligible seasonal claimants in targeted regions | 68.4 | 83.6 | 80.2 | 51.9 | 9.6 | - | - | - | - |
| Extending the Maximum Duration of Work-Sharing Agreements | 0.3 | 11.5 | 2.9 | - | - | - | - | - | - |
| Work-Sharing Program - COVID-19 | - | 7.5 | 2.5 | - | - | - | - | - | - |
| Regular Benefits - 13.1% UR for all regions | - | 181.4 | 943.9 | 296.2 | 2.5 | - | - | - | - |
| Regular Benefits - 300 Insurable Hours Credit | - | 527.4 | 2,194.0 | 556.9 | 4.7 | - | - | - | - |
| Regular Benefits - Minimum benefit rate of $400 | - | 94.8 | 699.2 | 134.0 | 0.1 | - | - | - | - |
| Special Benefits - 13.1% UR for all regions | - | 7.7 | 58.8 | 11.4 | 0.0 | - | - | - | - |
| Special Benefits - 480 Insurable Hours Credit | - | 118.4 | 917.2 | 211.3 | 0.1 | - | - | - | - |
| Special Benefits - Minimum benefit rate of $400 | - | 38.0 | 280.3 | 53.7 | 0.0 | - | - | - | - |
| Sub-Total | 68.7 | 1,070.3 | 5,178.9 | 1,315.4 | 17.1 | - | - | - | - |
| Recent Proposed and Permanent Changes | |||||||||
| Parental Sharing Benefits | 223.1 | 277.1 | 288.6 | 300.5 | 312.9 | 325.8 | 339.2 | 353.2 | 367.8 |
| EI Canada Training Benefit | |||||||||
| Training Support Benefit | - | - | 21.6 | 285.0 | 294.0 | 296.3 | 296.3 | 296.3 | 296.3 |
| Small Business Premium Rebate | - | - | 26.4 | 27.3 | 28.2 | 28.9 | 29.0 | 29.0 | 29.0 |
| Sub-Total | 223.1 | 277.1 | 336.6 | 612.8 | 635.1 | 651.0 | 664.5 | 678.5 | 693.1 |
| Part VIII.4 | |||||||||
| Emergency Response Benefit - EI Portion | - | 36,200.0 | - | - | - | - | - | - | - |
| Total | 291.8 | 37,547.4 | 5,515.5 | 1,928.2 | 652.2 | 651.0 | 664.5 | 678.5 | 693.1 |
| Actual | Forecast | ||||||||
| Part II | 2019-20 | 2020-21 | 2021-22 | 2022-23 | 2023-24 | 2024-25 | 2025-26 | 2026-27 | 2027-28 |
| Employment Benefits and Support MeasuresTable 19 - Footnote * | 2,476.2 | 2,449.3 | 2,530.9 | 2,532.0 | 2,107.0 | 2,107.0 | 2,107.0 | 2,107.0 | 2,107.0 |
| Administration CostsTable 19 - Footnote ** | 1,909.0 | 1,971.1 | 1,806.6 | 1,792.2 | 1,787.6 | 1,782.8 | 1,782.8 | 1,782.8 | 1,782.8 |
|
|||||||||
In addition, the Minister of ESD provided an EI Operating Account summary that shows a preliminary cumulative surplus of $3.9 billion as of 31 March 2020, the most recent month for which that total is known.
Additional information with regards to the pilot projects, special measures and new permanent changes shown in Table 19 can be found below.
Pilot Projects and Special Measures
In August 2018, the Government of Canada announced, that as part of a Budget 2018 commitment, it would invest $189 million to implement a new pilot project to provide up to five additional weeks of EI regular benefits to eligible seasonal claimants in 13 targeted EI economic regions. The additional five weeks of benefits are available for claims established between 5 August 2018 and 30 May 2020. In June 2020, the EI regulations were amended to extend the period of eligibility to October 2021. The revised projected cost for this pilot project provided by the Minister of ESD totals $294 million.
Budget 2016 extended the maximum duration of Work-Sharing agreements that began or ended between 1 April 2106 and 31 March 2017, from 38 weeks to 76 weeks. The Softwood Lumber Action Plan announced in June 2017 extended the maximum duration of Work-Sharing agreements beginning between 30 July 2017 and 28 March 2020 to support workers affected by the downturn in the Forestry sector. In June 2018, the Government of Canada also announced the extension to the maximum duration of Work-Sharing agreements from 5 August 2018 to 27 March 2021 to support workers who may be affected by the recent U.S. tariffs imposed on Canadian steel and aluminium shipments.
In March 2020, as part of the Government of Canada’s COVID-19 Economic Response Plan, the Government announced new emergency response benefits and temporary changes to the Work-Sharing program as follows:
- The Canada Emergency Response Benefit (CERB) and EI Emergency Response Benefit (EI ERB) were implemented to support eligible workers by providing $500 a week for up to 24 weeks for the period between 15 March 2020 and 3 October 2020. As a result of the implementation of the EI ERB, new EI regular and sickness benefit claims during this period were processed as claims for the EI ERB. Claims established prior to 15 March 2020 continued to be processed under the traditional EI rules. EI special benefits, excluding EI sickness benefits, continued unchanged.
- Several temporary special Work-Sharing measures, such as extending the maximum duration of agreements, waiving the mandatory waiting period, expanding the eligibility criteria and streamlining the application process from 30 days to 10 days, were implemented. The temporary measures are in place between 15 March 2020 and 14 March 2021.
On 6 August 2020, ESDC confirmed that the Government would be introducing a number of transition measures for a period of one year to facilitate access to EI. These measures include the application of a minimum unemployment rate, insurable hours credits and minimum weekly benefit rates for EI regular and special benefits. Specifically, they include the following:
- A minimum unemployment rate of 13.1% will be used for all EI regions beginning 9 August 2020 (announced by the Government on 10 August 2020). Accordingly, there will be a uniform entrance requirement of 420 hours for EI regular benefits (before application of the hours credit) and a minimum entitlement to 26 weeks of EI regular benefits.
- For EI regular benefits, including Work-Sharing benefits, EI claimants will receive a credit of 300 insurable hours and the minimum weekly benefit rate will be $400 as announced by the Government on 20 August 2020.
- For EI special benefits, EI claimants will receive a credit of 480 insurable hours and the minimum weekly benefit rate will be $400 ($240 for extended parental benefits) as announced by the Government on 20 August 2020.
Budget 2017 announced additional funding under the LMDAs over six years starting in 2017‑2018 to provide more opportunities to Canadians to upgrade their skills, gain experience or get help to start their own business.
Further amendments to the LMDAs were announced as part of a broader Budget 2018 commitment to support workers in seasonal industries and additional amendments were announced in June 2018 to support workers directly and indirectly affected by trade disputes in the steel and aluminium industries.
Recent Proposed and Permanent Changes
Budget 2018 introduced a new EI Parental Sharing Benefit. This benefit became permanent in March 2019, three months earlier than originally planned. The measure provides parents with an additional 5 weeks of standard parental benefits or 8 weeks of extended parental benefits for new parents who agree to share parental benefits. This new benefit is available to eligible two-parent families, including adoptive and same-sex couples.
Budget 2019 announced a new EI Training Support Benefit to help workers cover their living expenses when they require time off work to pursue training. The benefit will provide eligible claimants with up to four weeks of income support in a four-year period at 55 per cent of their average weekly insurable earnings. It was originally expected to launch in late 2020, but ESDC has indicated that it would be delayed by at least one year. In addition, the Government announced an EI Premium Rebate for Small Businesses to help offset the upward pressure on EI premiums resulting from the introduction of the new EI Training Support Benefit. This rebate would be available to employers who pay employer EI premiums equal to or less than $20,000 starting in 2021.
D.1.2 Minister of Finance
Under subsection 66.2(1) of the EI Act, the Minister of Finance shall provide the Actuary, on or before 22 July of each year, with the following:
- the most current forecast values of the economic variables relevant to the determination of the 7-year forecast break-even rate for the following seven years;
- the forecast amounts to be credited and charged to the EI Operating Account for the current year and an estimate of the total amounts credited to the Account as at 31 December of the previous year.
Accordingly, for the purposes of determining the 2021 EI 7-year forecast break‑even rate under section 66 of the EI Act, the Minister of Finance has provided the Actuary with the following information:
| Actual | Forecast | ||||||||
|---|---|---|---|---|---|---|---|---|---|
| 2019 | 2020 | 2021 | 2022 | 2023 | 2024 | 2025 | 2026 | 2027 | |
| Population (15+) | 30,739 | 31,165 | 31,537 | 31,918 | 32,296 | 32,671 | 33,043 | 33,408 | 33,772 |
| Labour Force | 20,195 | 19,773 | 20,052 | 20,192 | 20,403 | 20,653 | 20,902 | 21,146 | 21,390 |
| Employment | 19,050 | 17,844 | 18,489 | 18,839 | 19,142 | 19,435 | 19,674 | 19,904 | 20,143 |
| Employees | 16,148 | 15,043 | 15,660 | 16,006 | 16,299 | 16,569 | 16,786 | 16,988 | 17,194 |
| Self-Employed | 2,902 | 2,801 | 2,830 | 2,833 | 2,843 | 2,865 | 2,888 | 2,916 | 2,948 |
| Unemployed | 1,145 | 1,929 | 1,563 | 1,354 | 1,261 | 1,219 | 1,228 | 1,242 | 1,247 |
| Unemployment Rate | 5.7% | 9.8% | 7.8% | 6.7% | 6.2% | 5.9% | 5.9% | 5.9% | 5.8% |
| Average Weekly Earnings ($) | 1,028 | 1,057 | 1,075 | 1,104 | 1,131 | 1,156 | 1,182 | 1,208 | 1,236 |
| Average Employment Income Growth | 2.8% | 1.4% | 2.6% | 2.9% | 2.6% | 2.1% | 2.3% | 2.2% | 2.5% |
D.2 Earnings Base
The earnings base represents the total insurable earnings on which salaried employees and their employers pay EI premiums, and the earnings on which self‑employed individuals that opted into the EI program pay EI premiums. The earnings base is comprised of:
- the total insurable earnings on which employers pay EI premiums prior to any adjustment for qualified wage-loss plans or the small business premium rebate;
- the total insurable earnings on which employees pay EI premiums, adjusted to reflect employee premium refunds; and
- the earnings on which self‑employed individuals that opted into the EI program pay EI premiums.
Section 4 of the report presents an overview of the assumptions used in determining the earnings base. The following subsections provide additional information and data in support of the development of these assumptions.
D.2.1 Number of Earners
In order to calculate the earnings base, an assumption is required for the number of earners, as well as the split of these earners between those who have earnings below and above the maximum insurable earnings (MIE).
The annual statistic on the number of employees provided by the Minister of Finance represents an average of the number of individuals who work for a public or private sector employer in a month. The number of earners provided by CRA is always greater than the average monthly number of employees since it represents a count of all individuals who received one or more T4 slips in the year and had employment income and/or insurable earnings during the year. This is mainly due to the fact that the number of earners includes all individuals who had earnings at any time during the year, whereas the number of employees only indicates a monthly average.
A historical comparison of the number of employees and the number of earners is presented in Table 21. The preliminary number of earners for the year 2019 is set such that the resulting insurable earnings are in line with the expected assessed premiums for 2019, which are derived from the 2019 year-to-date assessed premiums and the 2019 increase in average employment income provided by the Minister of Finance.
| Year | Number of Employees |
Increase in Number of Employees |
Number of Earners (CRA T4 Data) |
Increase in Number of Earners |
Difference in Annual Increases (%) |
|---|---|---|---|---|---|
| 2013 | 14,955 | 18,424 | |||
| 2014 | 15,072 | 0.78% | 18,645 | 1.20% | 0.41% |
| 2015 | 15,189 | 0.78% | 18,851 | 1.11% | 0.33% |
| 2016 | 15,314 | 0.83% | 18,874 | 0.12% | (0.71%) |
| 2017 | 15,613 | 1.95% | 19,219 | 1.83% | (0.12%) |
| 2018 | 15,794 | 1.16% | 19,620 | 2.09% | 0.93% |
| 2019 | 16,148 | 2.24% | 20,032 | 2.10% | (0.14%) |
The projected number of earners is obtained by a regression based on a correlated historical relationship from 1989 to 2018 between the number of earners and the number of employees.
Table 22 shows projected number of employees as provided by the Minister of Finance as well as the projected number of earners for the years 2020 to 2027.
| Year | Projected Number of Employees |
Increase in Number of Employees |
Projected Number of Earners |
Increase in Number of Earners |
|---|---|---|---|---|
| 2020 | 15,043 | 18,672 | ||
| 2021 | 15,660 | 4.10% | 19,386 | 3.82% |
| 2022 | 16,006 | 2.21% | 19,783 | 2.05% |
| 2023 | 16,299 | 1.83% | 20,118 | 1.70% |
| 2024 | 16,569 | 1.66% | 20,426 | 1.53% |
| 2025 | 16,786 | 1.30% | 20,666 | 1.18% |
| 2026 | 16,988 | 1.21% | 20,888 | 1.07% |
| 2027 | 17,194 | 1.21% | 21,113 | 1.08% |
As shown in Table 23, based on information with regards to the historical number of earners across income ranges, the distribution of earners by level of average employment income is fairly stable from year to year.
| Year | Average Employment Income ($) |
Range as a % of Average Employment Income | |||||
|---|---|---|---|---|---|---|---|
| 0 - 25% | 25 - 50% | 50 - 75% | 75 - 100% | 100 - 125% | > 125% | ||
| 2013 | 45,227 | 21.9% | 14.7% | 13.0% | 12.4% | 9.9% | 28.2% |
| 2014 | 46,415 | 21.8% | 14.7% | 13.1% | 12.4% | 9.9% | 28.1% |
| 2015 | 47,223 | 22.0% | 14.7% | 13.3% | 12.4% | 9.9% | 27.8% |
| 2016 | 46,872 | 21.4% | 14.6% | 13.2% | 12.4% | 10.0% | 28.4% |
| 2017 | 48,200 | 21.6% | 14.5% | 13.3% | 12.4% | 9.9% | 28.2% |
| 2018 | 49,709 | 20.9% | 14.4% | 13.8% | 12.7% | 10.2% | 28.0% |
The 2018Footnote 5 distribution of the number of earners by level of average employment income is used to determine the proportion of earners with employment income below and above the MIE for years 2019 to 2027.
Table 24 shows the resulting split of the number of earners between those with employment income below the MIE and those with employment income above the MIE. Actual data is also shown for the years 2013 to 2018.
| Year | MIE ($) | MIE as a Proportion of Average Employment Income |
Proportion of Earners Below MIE |
Thousands | ||
|---|---|---|---|---|---|---|
| Total Number of Earners |
Number of Earners Below MIE |
Number of Earners Above MIE |
||||
| 2013 | 47,400 | 1.0480 | 64.1% | 18,424 | 11,803 | 6,621 |
| 2014 | 48,600 | 1.0471 | 64.2% | 18,645 | 11,962 | 6,683 |
| 2015 | 49,500 | 1.0482 | 64.5% | 18,851 | 12,168 | 6,683 |
| 2016 | 50,800 | 1.0838 | 65.3% | 18,874 | 12,327 | 6,547 |
| 2017 | 51,300 | 1.0643 | 64.7% | 19,219 | 12,425 | 6,794 |
| 2018 | 51,700 | 1.0400 | 63.8% | 19,620 | 12,513 | 7,107 |
| 2019 | 53,100 | 1.0396 | 63.8% | 20,032 | 12,773 | 7,258 |
| 2020 | 54,200 | 1.0467 | 64.1% | 18,672 | 11,969 | 6,703 |
| 2021 | 56,300 | 1.0599 | 64.7% | 19,386 | 12,536 | 6,850 |
| 2022 | 57,200 | 1.0460 | 64.1% | 19,783 | 12,674 | 7,108 |
| 2023 | 58,400 | 1.0413 | 63.9% | 20,118 | 12,846 | 7,273 |
| 2024 | 59,900 | 1.0464 | 64.1% | 20,426 | 13,091 | 7,335 |
| 2025 | 61,300 | 1.0472 | 64.1% | 20,666 | 13,252 | 7,414 |
| 2026 | 62,700 | 1.0478 | 64.2% | 20,888 | 13,400 | 7,487 |
| 2027 | 64,100 | 1.0452 | 64.0% | 21,113 | 13,519 | 7,594 |
D.2.2 Average and Total Employment Income
The projected increase in average employment income, provided by the Minister of Finance, combined with the increase in the projected number of earners, are used to determine the total employment income for years 2019 to 2027. Table 25 shows the derivation of the projected total employment income for years 2019 to 2027, as well as actual data provided by CRA for years 2013 to 2018.
| Year | Number of Earners from CRA T4 Data (thousands) |
Increase in Number of Earners |
Average Employment Income from CRA T4 Data ($) |
Increase in Average Employment Income |
Increase in Total Employment Income |
Total Employment Income ($ thousands) |
|---|---|---|---|---|---|---|
| 2013 | 18,424 | 45,227 | 833,270,357 | |||
| 2014 | 18,645 | 1.20% | 46,415 | 2.63% | 3.85% | 865,389,791 |
| 2015 | 18,851 | 1.11% | 47,223 | 1.74% | 2.87% | 890,187,256 |
| 2016 | 18,874 | 0.12% | 46,872 | (0.74%) | (0.62%) | 884,643,535 |
| 2017 | 19,219 | 1.83% | 48,200 | 2.83% | 4.71% | 926,339,401 |
| 2018 | 19,620 | 2.09% | 49,709 | 3.13% | 5.28% | 975,279,385 |
| 2019 | N/A | 2.10% | N/A | 2.76% | 4.91% | 1,023,211,640 |
| 2020 | N/A | (6.79%) | N/A | 1.37% | (5.51%) | 966,855,060 |
| 2021 | N/A | 3.82% | N/A | 2.58% | 6.51% | 1,029,774,171 |
| 2022 | N/A | 2.05% | N/A | 2.95% | 5.05% | 1,081,819,243 |
| 2023 | N/A | 1.70% | N/A | 2.55% | 4.29% | 1,128,263,669 |
| 2024 | N/A | 1.53% | N/A | 2.07% | 3.63% | 1,169,223,134 |
| 2025 | N/A | 1.18% | N/A | 2.26% | 3.46% | 1,209,730,943 |
| 2026 | N/A | 1.07% | N/A | 2.22% | 3.32% | 1,249,898,682 |
| 2027 | N/A | 1.08% | N/A | 2.49% | 3.59% | 1,294,788,017 |
As shown in Table 26, the historical distribution of total employment income as a percentage of average employment income is relatively stable from year to year.
| Year | Average Employment Income ($) |
Range as a % of Average Employment Income | |||||
|---|---|---|---|---|---|---|---|
| 0 - 25% | 25 - 50% | 50 - 75% | 75 - 100% | 100 - 125% | > 125% | ||
| 2013 | 45,227 | 2.4% | 5.4% | 8.1% | 10.8% | 11.1% | 62.3% |
| 2014 | 46,415 | 2.4% | 5.4% | 8.2% | 10.8% | 11.1% | 62.2% |
| 2015 | 47,223 | 2.3% | 5.4% | 8.3% | 10.8% | 11.1% | 62.1% |
| 2016 | 46,872 | 2.3% | 5.4% | 8.2% | 10.8% | 11.2% | 62.1% |
| 2017 | 48,200 | 2.3% | 5.4% | 8.3% | 10.8% | 11.1% | 62.0% |
| 2018 | 49,709 | 2.3% | 5.4% | 8.6% | 11.0% | 11.4% | 61.3% |
The 2018Footnote 5 distribution of total employment income as a percentage of average employment income is used to determine the proportion of employment income that relates to earners with employment income below and above the MIE for years 2019 to 2027. Table 27 shows the total employment income split between earners with employment income below the MIE and earners with employment income above the MIE for years 2019 to 2027. Actual data is also shown for years 2013 to 2018.
| Year | MIE ($) | MIE as a Proportion of Average Employment Income |
Proportion of Employment Income for Earners Below MIE |
($ thousands) | ||
|---|---|---|---|---|---|---|
| Total Employment Income |
Total Employment Income for Earners Below MIE |
Total Employment Income for Earners Above MIE |
||||
| 2013 | 47,400 | 1.0480 | 28.9% | 833,270,357 | 240,789,645 | 592,480,712 |
| 2014 | 48,600 | 1.0471 | 28.9% | 865,389,791 | 250,470,009 | 614,919,782 |
| 2015 | 49,500 | 1.0482 | 29.1% | 890,187,256 | 259,085,340 | 631,101,916 |
| 2016 | 50,800 | 1.0838 | 30.6% | 884,643,535 | 271,084,982 | 613,558,553 |
| 2017 | 51,300 | 1.0643 | 29.8% | 926,339,401 | 275,896,851 | 650,442,550 |
| 2018 | 51,700 | 1.0400 | 29.2% | 975,279,385 | 285,255,566 | 690,023,819 |
| 2019 | 53,100 | 1.0396 | 29.3% | 1,023,211,640 | 299,294,009 | 723,917,630 |
| 2020 | 54,200 | 1.0467 | 29.6% | 966,855,060 | 286,144,101 | 680,710,958 |
| 2021 | 56,300 | 1.0599 | 30.2% | 1,029,774,171 | 310,930,778 | 718,843,393 |
| 2022 | 57,200 | 1.0460 | 29.6% | 1,081,819,243 | 319,789,127 | 762,030,116 |
| 2023 | 58,400 | 1.0413 | 29.3% | 1,128,263,669 | 330,996,273 | 797,267,396 |
| 2024 | 59,900 | 1.0464 | 29.6% | 1,169,223,134 | 345,874,337 | 823,348,797 |
| 2025 | 61,300 | 1.0472 | 29.6% | 1,209,730,943 | 358,307,195 | 851,423,748 |
| 2026 | 62,700 | 1.0478 | 29.6% | 1,249,898,682 | 370,569,094 | 879,329,588 |
| 2027 | 64,100 | 1.0452 | 29.5% | 1,294,788,017 | 382,259,940 | 912,528,077 |
D.2.3 Total Insurable Earnings
Total insurable earnings for salaried employees are equal to total employment income, up to the annual MIE, earned by a person employed in insured employment. They are used to determine the earnings base for salaried employees. Prior to any adjustments for employee premium refunds, the earnings base for salaried employees is equal to 2.4 times the total insurable earnings.
Historical information regarding total insurable earnings is derived from aggregate assessed EI premiums gathered from T4 slips of all salaried employees, and is provided by CRA. Insurable earnings can be calculated by dividing gross EI premium revenues by 2.4 times the weighted-average premium rate. Gross EI premium revenues are derived by adding the following components to the net EI assessed premiums:
- Unadjusted employee premium refunds (multiple employments, insurable earnings below $2,000 and net adjustments for Québec residents working outside of Québec and vice-versa);
- Overage (correction to EI premiums due to employer-related administrative errors);
- Employer premium reductions for qualified wage-loss plans;
- Net adjustment payments between the Government of Canada and the Government of Québec for Québec residents working outside of Québec and vice-versa; and
- Other accounting adjustments.
Gross EI premium revenues represent employee EI premiums deducted at source and the corresponding employer premium before adjusting for qualified wage-loss plans, and reflect the employee’s province of work. Therefore, the annual weighted-average premium rates are calculated from the split of insurable earnings between Québec and out-of-Québec as reflected in the T4 data provided by CRA (i.e. on a province of employment basis, not province of residence). The derivation of insurable earnings for years 2013 to 2018 from the CRA statement of premium revenue is shown in Table 28. Net premiums assessed shown in the table are prior to the reduction in premiums due to the hiring credit for small businesses and small business job credit.
| 2013 | 2014 | 2015 | 2016 | 2017 | 2018 | |
|---|---|---|---|---|---|---|
| Net Premiums Assessed | 21,881.2 | 22,838.3 | 23,459.0 | 23,915.1 | 21,196.7 | 22,648.4 |
| Unadjusted Employee Premium Refunds | 253.8 | 266.0 | 254.0 | 241.1 | 242.6 | 262.5 |
| Overage | 3.1 | 3.0 | 3.1 | 2.7 | 3.2 | 2.9 |
| Wage-Loss Premium Reduction | 909.0 | 854.0 | 837.4 | 871.2 | 922.2 | 953.2 |
| Net Adjustment Payments (QPIP) | 8.4 | 7.4 | 6.3 | 7.3 | 6.6 | 5.6 |
| Other Accounting Adjustments | 8.8 | 5.7 | 5.0 | 21.7 | 7.3 | 6.3 |
| Gross EI Premium Revenues | 23,064.4 | 23,974.3 | 24,564.7 | 25,059.2 | 22,378.6 | 23,878.9 |
| Distribution of Insurable Earnings (Province of Employment): | ||||||
| Out-of-Québec | 78.0% | 78.2% | 78.4% | 78.2% | 78.1% | 78.0% |
| Québec | 22.0% | 21.8% | 21.6% | 21.8% | 21.9% | 22.0% |
| EI Premium Rate: | ||||||
| Out-of-Québec | 1.88% | 1.88% | 1.88% | 1.88% | 1.63% | 1.66% |
| Québec | 1.52% | 1.53% | 1.54% | 1.52% | 1.27% | 1.30% |
| Weighted Average Premium Rate | 1.80% | 1.80% | 1.81% | 1.80% | 1.55% | 1.58% |
| Total Insurable Earnings | 533,682 | 553,812 | 566,606 | 579,630 | 601,138 | 629,357 |
For employees with multiple employments in a year, the information is based on the combined total EI premiums. This means that although insurable earnings of each employment are capped at the MIE, the combined total insurable earnings can exceed the MIE. The adjustment to insurable earnings and the earnings base to reflect multiple employments is captured in the employee premium refund section.
The 2018Footnote 5 distributions of total number of earners and total employment income as a percentage of average employment income are used to calculate insurable earnings for years 2019 to 2027. Total employment income capped at the MIE is derived from these distributions. The resulting capped employment income is adjusted for consistency with total insurable earnings, which takes into account multiple employments as well as excluded employments. The adjustment varies based on expected changes in the unemployment rate; for years 2019 to 2021, the adjustment is expected to be 96.5%, 95.4% and 95.9% respectively. It is expected to reach its ultimate value of 96.2% in year 2022. Table 29 shows details of the projected total insurable earnings calculations for years 2019 to 2027, as well as actual data for years 2013 to 2018. The resulting insurable earnings for 2019 reflect the year-to-date assessed premiums and related total expected assessed premiums for the year.
| Year | MIE ($) | Total Employment Income for Earners Below MIE ($ thousands) |
Number of Earners Above MIE (thousands) |
Total Employment Income for Earners Above MIE, Capped at MIE ($ thousands) |
Total Employment Income, Capped at MIE ($ thousands) |
Total Insurable Earnings ($ thousands) |
Increase in Total Insurable Earnings |
|---|---|---|---|---|---|---|---|
| 2013 | 47,400 | 240,789,645 | 6,621 | 313,835,684 | 554,625,329 | 533,682,404 | |
| 2014 | 48,600 | 250,470,009 | 6,683 | 324,804,152 | 575,274,161 | 553,811,508 | 3.77% |
| 2015 | 49,500 | 259,085,340 | 6,683 | 330,817,311 | 589,902,651 | 566,606,136 | 2.31% |
| 2016 | 50,800 | 271,084,982 | 6,547 | 332,577,288 | 603,662,269 | 579,630,252 | 2.30% |
| 2017 | 51,300 | 275,896,851 | 6,794 | 348,518,759 | 624,415,610 | 601,138,318 | 3.71% |
| 2018 | 51,700 | 285,255,566 | 7,107 | 367,436,863 | 652,692,429 | 629,356,781 | 4.69% |
| 2019 | 53,100 | 299,294,009 | 7,258 | 385,410,782 | 684,704,791 | 660,523,390 | 4.95% |
| 2020 | 54,200 | 286,144,101 | 6,703 | 363,290,883 | 649,434,984 | 619,560,975 | (6.20%) |
| 2021 | 56,300 | 310,930,778 | 6,850 | 385,644,396 | 696,575,174 | 668,015,592 | 7.82% |
| 2022 | 57,200 | 319,789,127 | 7,108 | 406,591,879 | 726,381,006 | 698,778,528 | 4.61% |
| 2023 | 58,400 | 330,996,273 | 7,273 | 424,724,974 | 755,721,247 | 727,003,839 | 4.04% |
| 2024 | 59,900 | 345,874,337 | 7,335 | 439,373,897 | 785,248,235 | 755,408,802 | 3.91% |
| 2025 | 61,300 | 358,307,195 | 7,414 | 454,472,398 | 812,779,594 | 781,893,969 | 3.51% |
| 2026 | 62,700 | 370,569,094 | 7,487 | 469,461,947 | 840,031,041 | 808,109,861 | 3.35% |
| 2027 | 64,100 | 382,259,940 | 7,594 | 486,765,912 | 869,025,852 | 836,002,870 | 3.45% |
D.2.4 Split of Total Insurable Earnings Due to Provincial Plan
On 1 March 2005, an agreement was reached between the Government of Canada and the Government of Québec, which gave the Government of Québec the means to set up, starting 1 January 2006, the Québec Parental Insurance Plan (QPIP). Under the QPIP, Québec is responsible for MPA benefits claimed by residents of Québec. The final agreement between the Governments of Canada and Québec includes a financial mechanism whereby the Government of Canada reduces EI premiums paid by Québec residents and their employers so that the Government of Québec can collect premiums for its own program. The premium reduction reflects the savings to the EI Account realized as a result of Québec's program, including MP benefits that are no longer paid under EI and administrative savings.
Given that eligibility for the QPIP is based on the province of residence, for the purposes of calculating the QPIP reduction, insurable earnings must be split between Québec and all other provinces based on the province of residence. The information regarding historical insurable earnings provided by CRA (T4 basis) is based on the province of employment. Therefore, an adjustment is required to transfer insurable earnings from Québec to out-of-Québec and vice-versa to reflect the province of residence.
Split Based on Province of Employment (T4)
Premiums are remitted by employers and employees based on province of employment, i.e. on a T4 basis. The information regarding historical insurable earnings provided by CRA is also on a T4 basis, and is therefore based on the province of employment. The historical distribution of insurable earnings on a T4 basis shows that the proportion of insurable earnings that relates to employment in Québec generally decreased until 2015; between 2015 and 2019, a slight increase was observed. Based on the historical pattern, it is expected that the proportion of insurable earnings that relates to employment in Québec will remain relatively stable at 22.2% in 2019 and 2020, and will slightly decrease over the 7-year projection period, but will remain close to 22%. This is highlighted in Table 30.
| Year | Proportion of Insurable Earnings for Employment in Québec |
Proportion of Insurable Earnings for Employment Out-of-Québec |
|---|---|---|
| 2013 | 22.02% | 77.98% |
| 2014 | 21.79% | 78.21% |
| 2015 | 21.64% | 78.36% |
| 2016 | 21.84% | 78.16% |
| 2017 | 21.91% | 78.09% |
| 2018 | 21.97% | 78.03% |
| 2019 | 22.23% | 77.77% |
| 2020 | 22.17% | 77.83% |
| 2021 | 22.11% | 77.89% |
| 2022 | 22.05% | 77.95% |
| 2023 | 21.99% | 78.01% |
| 2024 | 21.93% | 78.07% |
| 2025 | 21.87% | 78.13% |
| 2026 | 21.82% | 78.18% |
| 2027 | 21.76% | 78.24% |
The proportions shown in the table above are used to split the insurable earnings between Québec and out-of-Québec based on province of employment. Adjustments to these proportions are required to reflect the province of residence.
Split Based on Province of Residence (T1)
The premiums are remitted based on the province of employment, in accordance with the Canada-Québec Agreement and for the purpose of facilitating inter-provincial mobility. However, when a worker’s premium, as well as the related employer’s premium is collected under the EI MP or the QPIP, and the person for whom the premium is collected is not covered by the regime to which they have contributed because of their province of residence, adjustment payments between the Government of Canada and the Government of Québec are made as long as this person is covered under the other regime. These adjustment payments are based on information included in individual tax returns and reflect the province of residence as of 31 December.
The information on historical assessed premiums provided by CRA includes the annual adjustment payments between the Government of Canada and the Government of Québec. A split between the employee adjustment payments and the employer adjustment payments, and a split between the transfer from the Government of Canada to the Government of Québec and vice-versa is provided. Table 31 shows the detailed adjustment payments between both parties for calendar years 2013 to 2018. The adjustment payments for calendar years 2017 and 2018 are preliminary.
| 2013 | 2014 | 2015 | 2016 | 2017 | 2018 | |
|---|---|---|---|---|---|---|
| Adjustment Payments from Government of Canada to Government of Québec (i.e. for Québec residents working outside of Québec): | ||||||
| Employee Portion | 12,060 | 12,155 | 12,241 | 13,145 | 13,652 | 13,807 |
| Employer Portion | 15,738 | 15,894 | 15,920 | 17,283 | 17,884 | 18,212 |
| Total | 27,799 | 28,049 | 28,161 | 30,428 | 31,537 | 32,019 |
| Adjustment Payments from Government of Québec to Government of Canada (for non-Québec residents working in Québec): | ||||||
| Employee Portion | 11,607 | 12,451 | 13,285 | 13,562 | 14,782 | 15,596 |
| Employer Portion | 7,744 | 8,234 | 8,581 | 9,528 | 10,196 | 10,844 |
| Total | 19,351 | 20,685 | 21,866 | 23,090 | 24,978 | 26,440 |
| Net Adjustment Payment from Government of Canada to Government of Québec: | ||||||
| Employee Portion | 454 | (296) | (1,044) | (417) | (1,130) | (1,789) |
| Employer Portion | 7,994 | 7,660 | 7,339 | 7,755 | 7,688 | 7,368 |
| Total | 8,448 | 7,364 | 6,295 | 7,338 | 6,558 | 5,579 |
The rules on how these adjustment payments are calculated are established in Division 4 of the Employment Insurance Regulations and Division 5 of An Act Respecting Parental Insurance (QPIP). Under these rules, the employer adjustment payment for each T4 slip of a given employee is generally equal to that employee’s insurable earnings times the QPIP reduction times the employer’s multiplier. Therefore, by using the aggregate employer adjustment payments provided by CRA and an average employer multiplier, it is possible to calculate the insurable earnings of Québec residents working outside of Québec and vice-versa. Given that a similar exercise is not possible using the employee adjustment payments due to different rules that apply to various individual situations, the employer adjustment payments are used to calculate the transfer of insurable earnings on a province of employment basis from Québec to out‑of‑Québec and vice-versa to reflect the province of residence.
Based on information provided by CRA, insurable earnings for employees who reside in Québec and work outside of Québec correspond to 0.63% of total insurable earnings on average for the last five years of available data, 2014 to 2018. Insurable earnings for employees who reside outside of Québec and work in Québec correspond to 0.35% of total insurable earnings for the same period. The resulting net effect is that, from the split based on province of employment, an average net transfer of 0.28% of total insurable earnings from out-of-Québec to Québec occurs to reflect the province of residence. This is outlined in Table 32.
| 2013 | 2014 | 2015 | 2016 | 2017 | 2018 | |
|---|---|---|---|---|---|---|
| Total Insurable Earnings ($) | 533,682,404 | 553,811,508 | 566,606,136 | 579,630,252 | 601,138,318 | 629,356,781 |
| QPIP Reduction | 0.36% | 0.35% | 0.34% | 0.36% | 0.36% | 0.36% |
| Average Employer Multiplier: | ||||||
| Out-of-Québec Employers | 1.30 | 1.31 | 1.32 | 1.32 | 1.30 | 1.30 |
| Québec Employers | 1.29 | 1.31 | 1.31 | 1.31 | 1.29 | 1.30 |
| Employer Adjustment Payments: | ||||||
| From Government of Canada to Government of Québec | 15,738 | 15,894 | 15,920 | 17,283 | 17,884 | 18,212 |
| From Government of Québec to Government of Canada | 7,744 | 8,234 | 8,581 | 9,528 | 10,196 | 10,844 |
| Estimated Transfer of Insurable Earnings to Reflect Province of Residence (Employer Adjustment Payments / (QPIP reduction x Average Employer Multiplier)) |
||||||
| From Government of Canada to Government of Québec ($) | 3,365,149 | 3,460,215 | 3,550,507 | 3,644,693 | 3,820,121 | 3,885,976 |
| From Government of Québec to Government of Canada ($) | 1,663,509 | 1,802,579 | 1,928,919 | 2,025,281 | 2,193,687 | 2,321,926 |
| Net Transfer (from Canada to Québec) ($) | 1,701,640 | 1,657,636 | 1,621,588 | 1,619,412 | 1,626,434 | 1,564,050 |
| Estimated Transfer of Insurable Earnings to Reflect Province of Residence as a % of Total Insurable Earnings | ||||||
| From Government of Canada to Government of Québec | 0.63% | 0.62% | 0.63% | 0.63% | 0.64% | 0.62% |
| From Government of Québec to Government of Canada | 0.31% | 0.33% | 0.34% | 0.35% | 0.36% | 0.37% |
| Net From Government of Canada to Government of Québec | 0.32% | 0.30% | 0.29% | 0.28% | 0.27% | 0.25% |
The information included in the administrative files that are exchanged between CRA and Revenu Québec was used to validate the methodology developed to estimate the transfer of insurable earnings using aggregate data. This file includes information on all taxfilers who are Québec residents and work outside of Québec and vice-versa. The actual insurable earnings of Québec residents working outside of Québec (roughly 123,000 people in 2018) and of non‑Québec residents working in Québec (roughly 93,000 people in 2018) were close to the ones calculated on an aggregate basis.
It is assumed that the net transfer of insurable earnings on a T4 basis to reflect actual province of residence for years 2019 to 2027 will be equal to the average transfer for years 2014 to 2018, that is 0.28%. The resulting insurable earnings on a province of residence basis are outlined in Table 33.
| Year | Proportion of Insurable Earnings - Province of Work (T4 Basis) |
Net Transfer to Québec | Proportion of Insurable Earnings - Province of Residence | Total Insurable Earnings - Province of Residence ($ thousands) |
||||
|---|---|---|---|---|---|---|---|---|
| Out-of-Québec | Québec | Out-of-Québec | Québec | Canada | Out-of-Québec | Québec | ||
| 2018 | 78.03% | 21.97% | 0.25% | 77.78% | 22.22% | 629,356,781 | 489,523,046 | 139,833,735 |
| 2019 | 77.77% | 22.23% | 0.28% | 77.49% | 22.51% | 660,523,390 | 511,860,752 | 148,662,637 |
| 2020 | 77.83% | 22.17% | 0.28% | 77.55% | 22.45% | 619,560,975 | 480,489,401 | 139,071,574 |
| 2021 | 77.89% | 22.11% | 0.28% | 77.61% | 22.39% | 668,015,592 | 518,468,319 | 149,547,273 |
| 2022 | 77.95% | 22.05% | 0.28% | 77.67% | 22.33% | 698,778,528 | 542,763,687 | 156,014,841 |
| 2023 | 78.01% | 21.99% | 0.28% | 77.73% | 22.27% | 727,003,839 | 565,123,394 | 161,880,446 |
| 2024 | 78.07% | 21.93% | 0.28% | 77.79% | 22.21% | 755,408,802 | 587,656,727 | 167,752,075 |
| 2025 | 78.13% | 21.87% | 0.28% | 77.85% | 22.15% | 781,893,969 | 608,729,524 | 173,164,445 |
| 2026 | 78.18% | 21.82% | 0.28% | 77.90% | 22.10% | 808,109,861 | 629,543,492 | 178,566,370 |
| 2027 | 78.24% | 21.76% | 0.28% | 77.96% | 22.04% | 836,002,870 | 651,774,641 | 184,228,228 |
D.2.5 Employee Premium Refunds
In general, salaried employees contribute EI premiums on their total insurable earnings in a given tax year up to the annual MIE limit. However, when filing their tax returns, employees will receive a refund if they have exceeded the maximum contribution due to multiple employments in the same year or if their insurable earnings were below $2,000. The insurable earnings that are subject to any subsequent premium refund must be excluded from the earnings base. The data from T4 slips that are used for projection purposes include insurable earnings for which premiums may later be refunded. Therefore, an adjustment must be made to reduce the earnings base. In addition, since the employer does not receive a refund, only the employee’s portion of the total earnings base is adjusted.
The annual employee refunds provided by CRA reflect the net impact of total EI premiums paid and the employee adjustment payments between the Government of Canada and the Government of Québec to account for employees who reside in Québec and work outside of Québec and vice-versa.
For example, the information provided for a resident outside of Québec who is working in Québec for the same employer throughout the year will include a refund equal to the difference between the premium paid to the QPIP and the premium owed for EI MP coverage. However, the total insurable earnings should not be adjusted to reflect this refund.
Another example is the case of a Québec resident who is working outside of Québec and who has exceeded the maximum EI contribution due to multiple employments in the year. In this case, the refund provided by CRA is net of the QPIP premium payable. The insurable earnings base should be adjusted for the refund related to the EI premium overpayment rather than the EI premium overpayment minus the QPIP premium payable.
The refunds provided by CRA must therefore be adjusted to reflect only refunds that relate to multiple employment and insurable earnings below $2,000. They should be decreased by any refund that relates to QPIP premiums paid by out‑of‑Québec residents who worked in Québec, and increased by any QPIP premiums payable by Québec residents who had multiple employments and worked outside of Québec. Given that the latter is not as common, the adjusted premium refunds will be lower than the refunds provided by CRA.
The adjusted premium refunds are estimated such that the net assessed premiums shown in Table 28 remain unchanged after taking into account the split of insurable earnings based on province of residence. In the reconciliation of the net assessed premiums using the province of residence (Table 34), the net adjustment payments (QPIP) shown in Table 28 are re-allocated between two items: the gross premium revenues and the premium refunds. Consequently, Table 34 shows net adjustment payments (QPIP) of $0.
The portion of net adjustment payments that is re-allocated to gross premium revenues is calculated by taking the difference between gross premiums calculated using the weighted-average premium rate on a province of residence basis and gross premiums calculated using the weighted-average premium rate on a province of employment basis. Given that the proportion of Québec insurable earnings is higher under the province of residence basis and that Québec residents have a lower premium rate, the gross premium revenues on a province of residence basis are lower than those on a province of employment basis.
The portion of net adjustment payments that has not been allocated to the change in gross premium revenues to reflect the province of residence is allocated to premium refunds. The resulting adjusted premium refunds relate only to multiple employment and insurable earnings below $2,000 and do not reflect any other adjustments due to the province of employment being different than the province of residence.
Table 34 shows the reconciliation of net premiums and the inherent calculation of adjusted premium refunds for years 2013 to 2018. By comparing this table to Table 28 for year 2018, it can be seen that adjustment payments of $5.6 million are reflected in Table 34 through gross premiums that are $13.6 million lower ($23,878.9 – $23,865.3) and in Table 35 through premium refunds that are $8.0 million lower ($262.5 – $254.5), with no resulting effect on the total net premium.
| 2013 | 2014 | 2015 | 2016 | 2017 | 2018 | |
|---|---|---|---|---|---|---|
| Total Insurable Earnings | 533,682 | 553,812 | 566,606 | 579,630 | 601,138 | 629,357 |
| Split of Insurable Earnings (Province of Residence): | ||||||
| Outside Québec | 77.7% | 77.9% | 78.1% | 77.9% | 77.8% | 77.8% |
| Québec | 22.3% | 22.1% | 21.9% | 22.1% | 22.2% | 22.2% |
| EI Premium Rate: | ||||||
| Outside Québec | 1.88% | 1.88% | 1.88% | 1.88% | 1.63% | 1.66% |
| Québec | 1.52% | 1.53% | 1.54% | 1.52% | 1.27% | 1.30% |
| Weighted Average Premium Rate | 1.80% | 1.80% | 1.81% | 1.80% | 1.55% | 1.58% |
| Gross Premium Revenues | 23,049.6 | 23,960.3 | 24,551.3 | 25,045.1 | 22,364.5 | 23,865.3 |
| Adjusted Premium Refunds | 247.5 | 259.4 | 246.9 | 234.4 | 235.2 | 254.5 |
| Overage | 3.1 | 3.0 | 3.1 | 2.7 | 3.2 | 2.9 |
| Wage-Loss Premium Reduction | 909.0 | 854.0 | 837.4 | 871.2 | 922.2 | 953.2 |
| Net Adjustment Payments (QPIP) | - | - | - | - | - | - |
| Other Accounting Adjustments | 8.8 | 5.7 | 5.0 | 21.7 | 7.3 | 6.3 |
| Net Premium Assessed | 21,881.2 | 22,838.3 | 23,459.0 | 23,915.1 | 21,196.7 | 22,648.4 |
The adjusted premium refunds divided by the average premium rate are used to estimate the total insurable earnings subject to a subsequent employee refund. The calculations are based on historical data provided by CRA. Table 35 shows that the total insurable earnings subject to a subsequent employee refund as a percentage of total insurable earnings averages 2.47% from 2014 to 2018. It is assumed to remain constant at 2.47% until 2027.
| 2013 | 2014 | 2015 | 2016 | 2017 | 2018 | |
|---|---|---|---|---|---|---|
| Total Insurable Earnings (TIE) | 533,682 | 553,812 | 566,606 | 579,630 | 601,138 | 629,357 |
| Adjusted Premium Refunds | 248 | 259 | 247 | 234 | 235 | 255 |
| Average Premium Rate | 1.80% | 1.80% | 1.81% | 1.80% | 1.55% | 1.58% |
| TIE Subject to Refund | 13,754 | 14,388 | 13,674 | 13,022 | 15,172 | 16,110 |
| TIE Subject to Refund (% of TIE) | 2.58% | 2.60% | 2.41% | 2.25% | 2.52% | 2.56% |
D.2.6 Self-Employed Earnings
Pursuant to the Fairness for the Self-Employed Act, starting 31 January 2010, self-employed persons can enter into a voluntary agreement with the Canada Employment Insurance Commission (Commission) through Service Canada to participate in the EI program, contribute EI premiums at the employee rate and have access to special benefits. Self-employed residents of Québec will continue to receive MPA benefits through the QPIP, however they are able to access sickness, compassionate care and Family Caregiver Benefits through the EI program. As such, the earnings base used in calculating the 7-year forecast break-even rate must take into account the covered earnings of self-employed individuals who opt into the EI program.
Participants in the self-employed EI program contribute premiums on their covered earnings, (i.e. their self-employed earnings up to the annual MIE), at the employee rate corresponding to their province of residence, and there are no employer premium contributions. Therefore, as with salaried employees’ insurable earnings, self-employed covered earnings must be split between residents of Québec’s covered earnings and residents out-of-Québec’s covered earnings.
The expected increase in self-employed covered earnings reflects the expected increase in the number of participants, and the expected increase in average earnings of self-employed individuals.
Projected Number of Participants
ESDC tracks the number of weekly self-employed enrolments by province for the EI program and was able to provide enrolment data for each week up to June 2020. The enrolment data also includes adjustments for individuals who have opted out of the program in each week. Table 36 shows the evolution of the number of participants starting with the cumulative number as at 31 December 2010, with a split between Québec and out-of-Québec residents.
The projection of enrolments from 2021 to 2027 is based on the average weekly enrolments over the last 3 years (2017-2019), while the assumption to complete year 2020 is based on the 3-year average of weekly enrolments during the last 6 months of the year. The number of enrolments is projected independently for Québec and out-of-Québec residents and reflects the slower pace of enrolment of Québec residents.
Using cumulative enrolments up to June 2020 and projected enrolments, Table 36 shows the historical and projected number of self-employed participants from 2010 to 2027.
| Cumulative Participants as of the last week of: |
Out-of-Québec Residents | Québec Residents | Total |
|---|---|---|---|
| 2010 | 4,443 | 1,367 | 5,810 |
| 2011 | 7,114 | 2,482 | 9,596 |
| 2012 | 9,059 | 3,092 | 12,151 |
| 2013 | 10,574 | 3,358 | 13,932 |
| 2014 | 11,893 | 3,482 | 15,375 |
| 2015 | 13,422 | 3,656 | 17,078 |
| 2016 | 14,997 | 3,824 | 18,821 |
| 2017 | 16,708 | 3,978 | 20,686 |
| 2018 | 18,483 | 4,198 | 22,681 |
| 2019 | 20,322 | 4,429 | 24,751 |
| 2020 | 27,890 | 6,579 | 34,469 |
| 2021 | 29,665 | 6,781 | 36,445 |
| 2022 | 31,474 | 6,986 | 38,460 |
| 2023 | 33,249 | 7,188 | 40,437 |
| 2024 | 35,024 | 7,389 | 42,413 |
| 2025 | 36,799 | 7,591 | 44,390 |
| 2026 | 38,574 | 7,793 | 46,367 |
| 2027 | 40,349 | 7,994 | 48,343 |
Increase in Average Earnings
Historical data on the evolution of average earnings of self-employed individuals who opted into the EI program compared to average earnings of all self‑employed individuals or of salaried employees are either not available or incomplete. As such, it is assumed that the average earnings of self-employed individuals who have opted into the EI program will increase at the same pace as the average earnings of salaried employees from 2020 to 2027.
The most recent year for which complete data is available with regards to self‑employed EI premiums and inherent covered earnings is tax year 2018. The projected increase in average employment earnings, combined with the increase in the number of self-employed participants are used to determine the self-employed covered earnings for years 2020 to 2027. It is important to note that regardless of the timing of enrolment during the year, premiums are paid on total covered earnings in that year. Table 37 shows the projected self‑employed covered earnings for Québec residents and out‑of‑Québec residents for years 2019 to 2027.
| Year | Out-of-Québec Residents | Québec Residents | Canada | ||||||
|---|---|---|---|---|---|---|---|---|---|
| Increase in Average Earnings | Increase in Number of Participants | Increase in Covered Earnings | Total Covered Earnings | Increase in Average Earnings | Increase in Number of Participants | Increase in Covered Earnings | Total Covered Earnings | Total Covered Earnings | |
| 2019 | 191,238 | 21,590 | 212,829 | ||||||
| 2020 | 1.37% | 37.2% | 39.1% | 266,057 | 1.37% | 48.5% | 50.6% | 32,510 | 298,568 |
| 2021 | 2.58% | 6.4% | 9.1% | 290,303 | 2.58% | 3.1% | 5.7% | 34,373 | 324,676 |
| 2022 | 2.95% | 6.1% | 9.2% | 317,088 | 2.95% | 3.0% | 6.1% | 36,459 | 353,547 |
| 2023 | 2.55% | 5.6% | 8.3% | 343,523 | 2.55% | 2.9% | 5.5% | 38,469 | 381,992 |
| 2024 | 2.07% | 5.3% | 7.5% | 369,353 | 2.07% | 2.8% | 4.9% | 40,367 | 409,720 |
| 2025 | 2.26% | 5.1% | 7.4% | 396,848 | 2.26% | 2.7% | 5.1% | 42,407 | 439,255 |
| 2026 | 2.22% | 4.8% | 7.2% | 425,245 | 2.22% | 2.7% | 4.9% | 44,502 | 469,747 |
| 2027 | 2.49% | 4.6% | 7.2% | 455,874 | 2.49% | 2.6% | 5.1% | 46,789 | 502,663 |
D.3 Expenditures
EI expenditures include Part I and Part II (Employment Benefits and Support Measures) benefit payments, administration costs and doubtful debts. EI benefits also include temporary spending initiatives, such as pilot projects or special measures announced by the Government of Canada; in 2020, this includes the new Part VIII.4 (EI ERB) benefit.
EI benefits paid under Part I of the EI Act include:
- Regular benefits, which provide temporary income support for unemployed persons;
- Fishing benefits, for self-employed fishers;
- Work-Sharing benefits, for workers willing to work a temporarily reduced work week to avoid lay-offs;
- Special benefits, for those who are sick (sickness benefits), pregnant or caring for a newborn or adopted child (maternity and parental benefits), for those caring for a seriously ill family member at end-of-life (compassionate care benefits), or for those providing care or support to a critically ill or injured family member (Family Caregiver benefits); and
- Training Support Benefit (proposed in Budget 2019 and expected to be launched in 2021).
To project EI expenditures, in addition to demographic and economic forecasts, a number of assumptions are required, namely average weekly benefits, number of potential claimants and recipiency rate. Those three assumptions are discussed below, and formulas for the projection of regular, fishing, Work-Sharing and special benefits are explained. Details on benefit repayments, Part II benefits, administration costs, bad debt expenses, penalties and interest on overdue accounts receivable are also included in this section.
D.3.1 Average Weekly Benefits
The average weekly benefits (AWB) are equal to benefit payments divided by the number of benefit weeks paid for Part I benefits.
Weekly benefits are generally equal to 55% of the claimant’s variable best weeks over the qualifying period (generally 52 weeks). The number of best weeks taken into account is determined by the regional unemployment rate and varies between 14 and 22 insurable earnings weeks.
The maximum amount payable is determined by the MIE. For 2021, the maximum weekly benefit is 55% of the $56,300 annual MIE divided by 52, or $595.
The AWB are determined by the sum of the change in the MIE and in the average weekly earnings, weighted by the proportion of benefit weeks for claimants with insurable earnings above and below the annual MIE and by the prior year AWB for claimants with insurable earnings above and below the annual MIE.
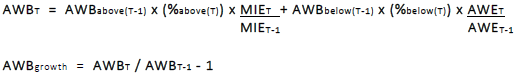
Text version
The average weekly benefits growth is equal to the ratio of the average weekly benefits in the projection year to the previous year’s average weekly benefits, minus 1.
The average weekly benefits in the projection year are calculated as the sum of the following:
- The previous year’s average weekly benefits for claimants with insurable earnings above the maximum insurable earnings (referred to MIE), multiplied by the percentage of benefit weeks for claimants in the projection year with insurable earnings above the MIE, and multiplied by the ratio of the MIE in the projection year to the prior year’s MIE.
- The previous year’s average weekly benefits for claimants with insurable earnings below the MIE, multiplied by the percentage of benefit weeks for claimants in the projection year with insurable earnings below the MIE, and multiplied by the ratio of the average weekly earnings in the projection year to the prior year’s average weekly earnings.
Where:
AWB = average weekly benefits;
AWBabove = AWB for claimants with insurable earnings above the MIE;
AWBbelow = AWB for claimants with insurable earnings below the MIE;
MIE = maximum insurable earnings;
AWE = average weekly earnings;
%above = percentage of benefit weeks for claimants with earnings above the MIE; and
%below = percentage of benefit weeks for claimants with earnings below the MIE.
The percentage of benefit weeks for claimants with insurable earnings above the annual MIE is based on an analysis of administrative data provided by ESDC.
The proportion of benefit weeks for claimants with insurable earnings above the MIE increased in 2014 and 2015 following the introduction of the variable best weeks, that is, a change in the benefit rate calculation. A further increase was observed in 2016 and is attributable in part to the temporary extension of EI regular benefits in regions affected by commodities downturn since some regions with higher earnings than the average normal EI claimants were selected.
The proportion of benefit weeks for claimants with earnings above the MIE decreased to 46.5% in 2017 before increasing to 47.0% and 47.9% in 2018 and 2019 respectively. Based on partial data, this proportion is expected to be 47.2% in 2020. It is assumed to remain constant at 47.2% thereafter.
| Year | % Above MIE |
|---|---|
| 2013 | 41.9% |
| 2014 | 44.6% |
| 2015 | 47.2% |
| 2016 | 48.0% |
| 2017 | 46.5% |
| 2018 | 47.0% |
| 2019 | 47.9% |
| 2020 | 47.2% |
| 2021-2027 | 47.2% |
The 2019 AWB for claimants with insurable earnings above and below the MIE was $562 and $372 respectively.
Based on the growth in average weekly earnings and the MIE, and on the proportion of benefit weeks for claimants with earnings above the MIE, the annual average weekly benefits growth rates are forecasted at 2.1% and 3.0% for 2020 and 2021 respectively. The average annual increase for years 2022 to 2027 is 2.3%. These AWB growth rates generally apply to all benefit types for 2021 and onwards.
| Actual | Forecast | ||||||||
|---|---|---|---|---|---|---|---|---|---|
| 2019 | 2020 | 2021 | 2022 | 2023 | 2024 | 2025 | 2026 | 2027 | |
| Average Weekly Earnings ($) | 1,028 | 1,057 | 1,075 | 1,104 | 1,131 | 1,156 | 1,182 | 1,208 | 1,236 |
| % Change | 2.7% | 2.8% | 1.7% | 2.7% | 2.4% | 2.2% | 2.2% | 2.2% | 2.3% |
| MIE ($) | 53,100 | 54,200 | 56,300 | 57,200 | 58,400 | 59,900 | 61,300 | 62,700 | 64,100 |
| % Change | 2.7% | 2.1% | 3.9% | 1.6% | 2.1% | 2.6% | 2.3% | 2.3% | 2.2% |
| Proportion Above MIE | 47.9% | 47.2% | 47.2% | 47.2% | 47.2% | 47.2% | 47.2% | 47.2% | 47.2% |
| Proportion Below MIE | 52.1% | 52.8% | 52.8% | 52.8% | 52.8% | 52.8% | 52.8% | 52.8% | 52.8% |
| AWB Growth | 1.7% | 2.1% | 3.0% | 2.1% | 2.2% | 2.4% | 2.3% | 2.2% | 2.3% |
D.3.2 Potential Claimants
The EI Program is designed to provide temporary income support to eligible insured persons who have lost their jobs through no fault of their own, such as due to a shortage of work, or as a result of seasonal or mass lay-offs, and are available for work.
Hence, to receive EI regular benefits, an individual needs to:
- be insured, that is, have paid EI premiums in the qualifying period, usually the 52 weeks preceding the claim for benefits;
- have lost their employment;
- have had a valid job separation; and
- be available for work.
The number of potential claimants is therefore estimatedFootnote 12 as the sum of:
- The number of unemployed individuals provided by the Minister of Finance from which is subtracted:
- The number of unemployed individuals without insurable earnings (IE) in the last 52 weeks, that is, self-employed, unpaid family workers and individuals who have not worked in the last 52 weeks;
- The number of unemployed individuals with an invalid job separationFootnote 13; and
- The average number of EI regular beneficiaries currently employed, that is, individuals receiving regular benefits, but excluded from the unemployed statistics (beneficiaries Working While on Claim). These individuals need to be added since they are not accounted for in the definition of the unemployed.
The following table shows the development of the historical number of potential claimants.
| Calendar Year | Number of Unemployed (U) | No Insurable Earnings in Last 52 Weeks | Invalid Job SeparationFootnote * | Working Beneficiaries | Potential Claimants | ||||
|---|---|---|---|---|---|---|---|---|---|
| Number | As a % of U | Number | As a % of U | Number | As a % of U | Number | As a % of U | ||
| 2009 | 1,523 | 440 | 28.9% | 190 | 12.5% | 102 | 6.7% | 995 | 65.3% |
| 2010 | 1,486 | 532 | 35.8% | 175 | 11.8% | 110 | 7.4% | 888 | 59.8% |
| 2011 | 1,399 | 546 | 39.0% | 178 | 12.7% | 96 | 6.9% | 771 | 55.1% |
| 2012 | 1,372 | 535 | 39.0% | 188 | 13.7% | 92 | 6.7% | 740 | 54.0% |
| 2013 | 1,347 | 516 | 38.3% | 201 | 14.9% | 85 | 6.3% | 715 | 53.1% |
| 2014 | 1,322 | 508 | 38.4% | 197 | 14.9% | 83 | 6.3% | 701 | 53.0% |
| 2015 | 1,331 | 492 | 36.9% | 165 | 12.4% | 86 | 6.5% | 761 | 57.2% |
| 2016 | 1,361 | 507 | 37.3% | 162 | 11.9% | 88 | 6.5% | 779 | 57.3% |
| 2017 | 1,247 | 502 | 40.3% | 149 | 12.0% | 88 | 7.1% | 683 | 54.8% |
| 2018 | 1,155 | 461 | 39.9% | 182 | 15.8% | 77 | 6.7% | 589 | 51.0% |
| 2019 | 1,144 | 427 | 37.3% | 172 | 15.0% | 74 | 6.5% | 619 | 54.1% |
|
|||||||||
The number of unemployed individuals is provided by the Minister of Finance. Assumptions for the evolution of the number of unemployed individuals without insurable earnings in the last 52 weeks, the number of unemployed individuals with an invalid job separation and the number of working beneficiaries as a percentage of the number of unemployed are made as follows:
- The percentage of unemployed without insurable earnings in the last 52 weeks has increased following the economic downturn of 2008-2009. It reached 39.0% in 2011 and 2012 before decreasing in the next three years to 36.9% in 2015. The percentage then increased to reach 40.3% in 2017 before decreasing again in the following two years to reach 37.3% in 2019. The number of individuals without insurable earnings in the last 52 weeks decreased from 461,000 to 427,000 between 2018 and 2019. Based on the experience observed for the first six months of 2020, the proportion of individuals with no insurable earnings in the last 52 weeks is expected to decrease to 27.0% in 2020. It is subsequently assumed to increase until it reaches an ultimate value of 38.0% of unemployed in 2024. The large decrease in 2020 is attributable to the forced shutdown of the economy created by the COVID‑19 pandemic. Compared to other years, more employees with insurable earnings in the last 52 weeks lost their job, putting downward pressure on the percentage of unemployed without insurable earnings in the last 52 weeks.
- The percentage of unemployed individuals with an invalid job separation is highly behaviour driven and fluctuates with the economic situation. The proportion of 15.8% observed in 2018 is considerably higher than the 12.0% observed in 2017. It is expected to decrease to 15.0% in 2019 and to 11.0% in 2020 before increasing to an ultimate value of 13.0% in 2022. The large decrease in 2020 is attributable to the forced shutdown of the economy created by the COVID‑19 pandemic. Based on the first few months of 2020 data published by Statistics Canada, a smaller proportion of people left their jobs for reason such as going to school, being dissatisfied or retiring when compared to other years. This created downward pressure on the percentage of unemployed individuals with an invalid job separation.
- The ratio of working beneficiaries to unemployed is normally relatively stable and can be projected using an average of the last few years. However, given the COVID-19 pandemic, the ratio is expected to decrease significantly in 2020. Based on the first few months of available information for 2020, it is estimated that the ratio of working beneficiaries to unemployed will decrease to 3.5% in 2020. It will then slowly increase to reach an ultimate value of 6.5% in 2023.
The resulting projected proportion and number of potential claimants are presented in Table 41. The number of potential claimants as a percentage of unemployed is expected to decrease from 65.5% in 2020 to 55.5% in 2024.
| Calendar Year | Number of Unemployed (U) (thousands) | No Insurable Earnings in Last 52 Weeks | Invalid Job Separation | Working Beneficiaries | Potential Claimants | |
|---|---|---|---|---|---|---|
| As a % of U | As a % of U | As a % of U | As a % of U | Number (thousands) | ||
| 2020 | 1,929 | 27.0% | 11.0% | 3.5% | 65.5% | 1,265 |
| 2021 | 1,563 | 35.0% | 12.0% | 4.5% | 57.5% | 899 |
| 2022 | 1,354 | 36.0% | 13.0% | 5.5% | 56.5% | 765 |
| 2023 | 1,261 | 37.0% | 13.0% | 6.5% | 56.5% | 712 |
| 2024 | 1,219 | 38.0% | 13.0% | 6.5% | 55.5% | 676 |
| 2025 | 1,228 | 38.0% | 13.0% | 6.5% | 55.5% | 681 |
| 2026 | 1,242 | 38.0% | 13.0% | 6.5% | 55.5% | 690 |
| 2027 | 1,247 | 38.0% | 13.0% | 6.5% | 55.5% | 692 |
D.3.3 Recipiency Rate (Share of potential claimants receiving benefits)
Beneficiaries, as reported by Statistics Canada, refers to the number of active regular claimants in a given month who received EI regular benefits during the reference week of the labour force survey, usually the week containing the 15th day of the month. The recipiency rate represents the proportion of potential claimants in a given period who are receiving EI regular benefits and ignores individuals outside the target population of the EI program, such as the long-term unemployed and those who did not contribute to the program in the previous year. The recipiency rate is thus directly linked to the target population of the EI program (i.e. potential claimants).
The recipiency rate is lower than 100% for multiple reasons including:
- Some potential claimants have not accumulated the required number of insurable hours, which varies between 420 and 700 hours depending on the economic region in which they reside;
- Some potential claimants do not apply for benefits; and
- Some potential claimants are waiting to receive their benefits, or have received benefits in the past but have exhausted the number of weeks they were entitled to receive regular benefits and remain unemployed.
For the purposes of forecasting regular benefit payments, historical recipiency rates shown in the following table are calculated based on the number of beneficiaries as reported by Statistics Canada and the number of potential claimants as discussed in the previous section.
| Calendar Year | Number of Potential Claimants (thousands) | Regular Beneficiaries (thousands) | Recipiency Rate |
|---|---|---|---|
| 2009 | 995 | 770 | 77.4% |
| 2010 | 888 | 718 | 80.9% |
| 2011 | 771 | 608 | 78.8% |
| 2012 | 740 | 555 | 75.0% |
| 2013 | 715 | 523 | 73.2% |
| 2014 | 701 | 508 | 72.5% |
| 2015 | 761 | 535 | 70.2% |
| 2016 | 779 | 564 | 72.3% |
| 2017 | 683 | 533 | 78.0% |
| 2018 | 589 | 464 | 78.8% |
| 2019 | 619 | 452 | 72.9% |
The recipiency rate decreased from 80.9% in 2010 to 70.2% in 2015; however, it increased to 72.3% in 2016 and to 78.0% in 2017 due to the temporary and permanent measures (extension of number of weeks of benefits in selected regions affected by commodities downturn, elimination of the category of claimants who are new entrants and re-entrants and the change in the waiting period from two to one week in 2017). The rate remained high (78.8%) in 2018 due to the continuation of the extension of number of weeks of benefits in selected regions affected by commodities downturn. It is expected to decrease to 72.9% in 2019 due to the termination of some temporary measures. The preliminary estimate for 2020 is 45.0% and it is assumed to increase to 70.0% in 2021 and to 72.5% in 2022 before reaching its ultimate value of 75.0% in 2023. The low recipiency rate for 2020 and 2021 is attributable to the EI ERB put in place by the Government for claims starting 15 March 2020, as well as to the transition measures aimed at facilitating access to EI as the EI ERB and the CERB are being wound down. The majority of people who would have normally received regular EI benefits and been counted as regular EI recipients are receiving the special measure benefits instead, and are accounted for elsewhere as recipients of that measure.
D.3.4 Number of Weeks
EI expenditures are reported in the EI Operating Account on an accrual basis, that is, they are recorded in the period for which they should have been paid, without regards to the delay in processing the payment. For example, if a claimant is eligible to receive benefits starting the first week of December 2019, but receives his first benefit payment only in February 2020, the portion of the benefits that relates to December will be recorded in the EI Operating Account for the year 2019.
Furthermore, EI benefits are paid on a weekly basis, but only weekdays that belong to a particular period are reported in that period. For example, if December 31st is a Thursday then for every benefit week that should have been paid for the week of December 31st, four days will be reported in the current calendar year and one will be reported in the following calendar year.
The number of weeks affects Part I expenditures as benefits are payable for every weekday of the year, regardless of holidays. The number of workdays in a year ranges from 260 days to 262 days, resulting in a number of weeks ranging from 52.0 to 52.4 as shown in the following table.
| Calendar Year | 2019 | 2020 | 2021 | 2022 | 2023 | 2024 | 2025 | 2026 | 2027 |
|---|---|---|---|---|---|---|---|---|---|
| Number of Weeks | 52.2 | 52.4 | 52.2 | 52.0 | 52.0 | 52.4 | 52.2 | 52.2 | 52.2 |
D.3.5 Regular Benefits
EI regular benefits provide temporary income support to eligible insured persons who have lost their jobs through no fault of their own, such as due to shortage of work, or seasonal or mass lay-offs, and are available to work.
Regular benefit payments are equal to the average weekly benefits multiplied by the number of weeks paid, as determined by the number of potential claimants multiplied by the recipiency rate and by the number of weeks in the year.
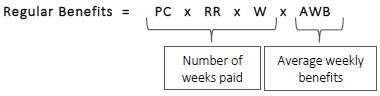
Text version
The regular benefits are equal to the product of the number of potential claimants, the recipiency rate, the number of weeks in the year and the average weekly benefits. This is equivalent to the product of the number of weeks paid and the average weekly benefits.
Where:
PC = number of potential claimants;
RR = recipiency rate;
W = number of weeks in the year; and
AWB = average weekly benefits.
For projection purposes, the above formula is modified such that the increase in each variable is applied to the previous year’s EI regular benefits paid. As the actual regular benefit expenditures in the base year include expenditures attributed to a pilot project, it is first subtracted before the growth factors are applied.
The base year on which the projected growth factors are applied is 2019, that is, the latest year of known actual regular EI income benefits. Regular benefits are therefore projected as follows, starting from the base year.
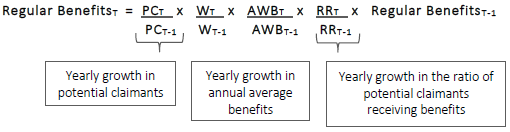
Text version
The regular benefits in the projection year are equal to the prior year’s regular benefits times the yearly growth in potential claimants, the yearly growth in average annual benefits and the yearly growth in the ratio of potential claimants receiving benefits.
The yearly growth in potential claimants is calculated as the ratio of the number of potential claimants in the projection year to the prior year’s number of potential claimants.
The yearly growth in average benefits is calculated as the ratio of the number of weeks in the projection year to the previous year’s number of weeks, multiplied by the ratio of the average weekly benefits in the projection year to the previous year’s average weekly benefits.
The yearly growth in the ratio of potential claimants receiving benefits is equal to the recipiency rate in the projection year, divided by the previous year’s recipiency rate.
Where:
PC = number of potential claimants;
W = number of weeks in a year;
AWB = average weekly benefits; and
RR = recipiency rate.
The pilot project and special measures are then added to the regular benefits projection as shown in Table 44.
| Actual | Forecast | ||||||||
|---|---|---|---|---|---|---|---|---|---|
| 2019 | 2020 | 2021 | 2022 | 2023 | 2024 | 2025 | 2026 | 2027 | |
| Regular Benefits (Base) | 10,647 | 13,732 | 15,567 | 13,950 | 13,745 | 13,466 | 13,827 | 14,305 | 14,683 |
| Extension of the Seasonal-Worker Pilot Project | 68 | 84 | 80 | 52 | 10 | - | - | - | - |
| Measure - 13.1% UR for all regions | - | 181 | 944 | 296 | 2 | - | - | - | - |
| Measure - 300 Insurable Hours Credit | - | 527 | 2,194 | 557 | 5 | - | - | - | - |
| Measure - Minimum Benefit Rate of $400 | - | 95 | 699 | 134 | 0 | - | - | - | - |
| Total Regular Benefits | 10,715 | 14,619 | 19,485 | 14,989 | 13,762 | 13,466 | 13,827 | 14,305 | 14,683 |
D.3.6 Fishing Benefits
As with regular benefits, fishing benefits are equal to the number of benefit weeks multiplied by the average weekly benefits. Fishing benefits can be projected from the base year using the expected change in the number of benefit weeks and average weekly benefits. However, as the number of fishing claimants and the average duration of fishing claims are relatively stable, only the expected change in average weekly benefits is used in forecasting fishing benefits.
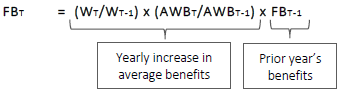
Text version
The fishing benefits in the projection year are equal to the prior year’s fishing benefits times the yearly increase in average benefits.
The yearly increase in average benefits is calculated as the ratio of the number of weeks in the projection year to the previous year’s number of weeks, multiplied by ratio of the average weekly benefits in the projection year to the previous year’s average weekly benefits.
Where:
FB = fishing benefits;
W = number of weeks in the year; and
AWB = average weekly benefits.
The fishing benefits projection is shown in the following table.
| Actual | Forecast | ||||||||
|---|---|---|---|---|---|---|---|---|---|
| 2019 | 2020 | 2021 | 2022 | 2023 | 2024 | 2025 | 2026 | 2027 | |
| Fishing Benefits | 340 | 348 | 357 | 363 | 371 | 383 | 391 | 399 | 408 |
D.3.7 Work-Sharing Benefits
To avoid temporary lay-offs due to a reduction in the normal level of business activity caused by factors that are beyond the control of the employer, employers and employees can enter into a Work-Sharing agreement with the Commission through Service Canada to provide EI income benefits to eligible workers willing to work a temporarily reduced work week. This enables employers to retain staff and adjust their work activity during temporary work shortages, as well as avoid the expenses of hiring and training new staff once business levels return to normal. Employees are able to retain their skills and jobs while receiving EI benefits for the days that they do not work.
Work-Sharing benefits are projected using the expected 2020 base Work-Sharing expenditures, multiplied by the expected change in the number of employees and the average weekly benefits rate. Based on the first six months of 2020, the number of weeks of work-sharing benefits has increased significantly, resulting in an adjustment of 600% compared to the previous year. The increase can most likely be attributed to the COVID-19 pandemic and is expected to be temporary. Consequently, the number of weeks of benefits was adjusted downward in both 2021 and 2022. Additionnaly, the average weekly benefit is adjusted upward by 20% in 2020, as observed in the first six months of experience.
Projected Work-Sharing benefits due to the extension of the maximum duration for softwood lumber and steel and aluminium industries and the temporary work-sharing enhancement due to COVID-19 are provided by the Minister of ESD and added to the base Work-Sharing benefits.
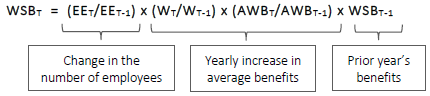
Text version
The work-sharing benefits in the projection year are equal to the prior year’s benefits times the change in the number of employees and the yearly increase in average benefits.
The change in the number of employees is calculated as the ratio of employees in the projection year to the prior year’s employees.
The yearly increase in average benefits is calculated as the ratio of the number of weeks in the projection year to the previous year’s number of weeks, multiplied by the ratio of the average weekly benefits in the projection year to the previous year’s average weekly benefits.
Where:
WSB = Work-Sharing benefits;
EE = employees;
W = number of weeks in a year; and
AWB = average weekly benefits.
Table 46 shows the actual 2019 Work-Sharing benefits as well as the projection until 2027.
| Actual | Forecast | ||||||||
|---|---|---|---|---|---|---|---|---|---|
| 2019 | 2020 | 2021 | 2022 | 2023 | 2024 | 2025 | 2026 | 2027 | |
| Work-Sharing Benefits (Base) | 12 | 98 | 42 | 17 | 18 | 19 | 20 | 20 | 21 |
| Extending the Maximum Duration | 0 | 12 | 3 | - | - | - | - | - | - |
| Work-Sharing Temporary Measure – COVID-19 | - | 8 | 3 | - | - | - | - | - | - |
| Total Work-Sharing Benefits | 13 | 117 | 47 | 17 | 18 | 19 | 20 | 20 | 21 |
D.3.8 Special Benefits
Special benefits include MP benefits, for those who are pregnant or caring for a newborn or adopted child, sickness benefits for those who are unable to work due to sickness, injury or quarantine, compassionate care benefits for those who take a temporary leave from work to provide care or support to a family member who is gravely ill and at risk of dying within 26 weeks, and benefits for those who take leave from work to provide care or support to a critically ill or injured family member (Family Caregiver benefits for children or adults).
Salaried
Each special benefit for salaried employees is forecasted from the base year 2019 using the expected change in the number of employees and in the average weekly benefits.
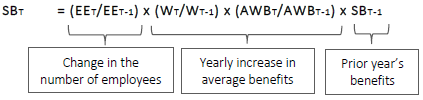
Text version
The special benefits in the projection year are equal to the prior year’s special benefits times the change in the number of employees and the yearly increase in average benefits.
The change in the number of employees is calculated as the ratio of the number of employees in the projection year to the prior year’s number of employees.
The yearly increase in average benefits is calculated as the ratio of the number of weeks in the projection year to the previous year’s number of weeks, multiplied by the ratio of the average weekly benefits in the projection year to the previous year’s average weekly benefits.
Where:
SB = special benefits;
EE = employees;
W = number of weeks in a year; and
AWB = average weekly benefits.
Sickness claims data show a decrease in the number of weeks of sickness benefits for the first six months of 2020. For the full year, the number of weeks of sickness benefits is adjusted downward by 20%. This decrease in the number of weeks of sickness benefits is expected to be temporary due to COVID-19 and the EI ERB. As the situation reverts to normal and the EI ERB is phased out, the number of weeks of sickness benefits is adjusted upward by 10% in 2021, 7.5% in 2022 and 1.5% in 2023. The average weekly benefit is adjusted upward by 2.5% in 2020.
Maternity and Parental (MP) claims data show a higher number of weeks of MP benefits than expected for the first six months of 2020. For the full year 2020, the number of weeks of benefits is adjusted upward by 5%. For 2021, the number of weeks for normal benefits (i.e. before the temporary transition measures are applied) is adjusted downward by 9.0%. It is then expected to increase by 8.0% and 1.75% in 2022 and 2023 respectively.
For projection purposes, expenditures attributed to recent measures and changes to the program are excluded from the base year before the growth factors are applied. Expenditures attributed to recent program changes are subsequently added separately to obtain the total special benefits. Thus, the transition measures introduced by the Government are expected to more than compensate the temporary reduction in sickness and MP benefits.
Self-employed
Starting 31 January 2010, self-employed persons can enter into a voluntary agreement with the Commission through Service Canada to participate in the EI program.
Self-employed benefits are forecasted to increase in line with covered earnings, that is, in line with the self-employed covered population and related insured earnings growth. Projections take into account that self-employed persons must wait 12 months after registration to claim EI special benefits.
It is expected that in 2021, self-employed participants enrolling in the EI Program will receive $16.2 million in MP benefits, $0.9 million in sickness benefits, $43 thousand in compassionate care benefits and $119 thousand in Family Caregiver benefits.
| Actual | Forecast | ||||||||
|---|---|---|---|---|---|---|---|---|---|
| 2019 | 2020 | 2021 | 2022 | 2023 | 2024 | 2025 | 2026 | 2027 | |
| Salaried Employees ($ millions) | |||||||||
| MP Benefits | 3,905 | 3,914 | 3,802 | 4,267 | 4,520 | 4,742 | 4,895 | 5,066 | 5,244 |
| Sickness Benefits | 1,864 | 1,459 | 1,713 | 1,913 | 2,022 | 2,121 | 2,190 | 2,266 | 2,346 |
| Compassionate Care Benefits | 49 | 46 | 49 | 51 | 53 | 56 | 58 | 60 | 62 |
| Family Caregiver Benefit | 88 | 84 | 90 | 94 | 97 | 102 | 105 | 109 | 113 |
| Sub-total | 5,906 | 5,503 | 5,654 | 6,325 | 6,693 | 7,021 | 7,249 | 7,501 | 7,764 |
| Self-Employed ($ thousands) | |||||||||
| MP Benefits | 10,236 | 11,367 | 16,177 | 17,541 | 18,983 | 20,529 | 21,935 | 23,468 | 25,123 |
| Sickness Benefits | 555 | 617 | 878 | 952 | 1,030 | 1,114 | 1,190 | 1,273 | 1,363 |
| Compassionate Care Benefits | 17 | 30 | 43 | 46 | 50 | 54 | 58 | 62 | 66 |
| Family Caregiver Benefit | 75 | 83 | 119 | 129 | 139 | 150 | 161 | 172 | 184 |
| Sub-total | 10,883 | 12,097 | 17,215 | 18,667 | 20,202 | 21,847 | 23,344 | 24,975 | 26,736 |
| Recent Permanent Changes ($ millions) | |||||||||
| Parental Sharing Benefit | 223 | 277 | 289 | 301 | 313 | 326 | 339 | 353 | 368 |
| Recent Temporary Changes ($ millions) | |||||||||
| Measure - 13.1% UR for all regionsFootnote * | - | 8 | 59 | 11 | 0 | - | - | - | - |
| Measure - 480 Insurable Hours CreditFootnote * | - | 118 | 917 | 211 | 0 | - | - | - | - |
| Measure - Minimum Benefit Rate ($400)Footnote * | - | 38 | 280 | 54 | 0 | - | - | - | - |
| Total ($ millions) | |||||||||
| MP Benefits | 4,139 | 4,313 | 4,954 | 4,771 | 4,852 | 5,088 | 5,257 | 5,443 | 5,637 |
| Sickness Benefits | 1,864 | 1,509 | 2,095 | 1,998 | 2,023 | 2,122 | 2,191 | 2,267 | 2,347 |
| Compassionate Care Benefits | 49 | 48 | 59 | 54 | 54 | 56 | 58 | 60 | 62 |
| Family Caregiver Benefit | 88 | 87 | 108 | 98 | 97 | 102 | 106 | 109 | 113 |
| Total Special Benefits | 6,140 | 5,956 | 7,216 | 6,921 | 7,026 | 7,369 | 7,611 | 7,879 | 8,159 |
|
|||||||||
D.3.9 Benefit Repayments
If a claimant’s income for a tax year exceeds 1.25 times the annual MIE, the claimant may be required to repay a portion of EI regular or fishing benefits received. Benefit repayments, as reported in the EI Operating Account, include an estimate for the current tax year, based on regular and fishing benefit payments, and a reconciliation between actual and estimated benefit repayments for the previous tax year.
The current year forecast is projected from the prior year actual based on the expected increase/decrease in regular and fishing benefits. The estimate for the forecast 2020 prior year actual is based on the actual first 6 months of benefit repayments and the historical average completion ratio after 6 months.
| Actual | Forecast | ||||||||
|---|---|---|---|---|---|---|---|---|---|
| 2019 | 2020 | 2021 | 2022 | 2023 | 2024 | 2025 | 2026 | 2027 | |
| Current Year Forecast | 335 | 356 | 472 | 365 | 336 | 330 | 338 | 350 | 359 |
| Prior Year | |||||||||
| Actual | 298 | 263 | 356 | 472 | 365 | 336 | 330 | 338 | 350 |
| Forecast | (336) | (335) | (356) | (472) | (365) | (336) | (330) | (338) | (350) |
| Sub-Total (Adjustment for prior year) | (38) | (72) | - | - | - | - | - | - | - |
| Refunds | (8) | (8) | (8) | (8) | (8) | (8) | (8) | (8) | (8) |
| Total | 289 | 276 | 464 | 357 | 328 | 321 | 330 | 342 | 351 |
D.3.10 EI Part II Benefits
The programs delivered under Part II of the EI Act are called Employment Benefits and Support Measures (EBSM). The expected annual estimates for EBSM are provided by ESDC on a fiscal year basis.
Amounts presented in Table 49 include the additional LMDA investment of $1.8 billion announced in Budget 2017 ($1.25 billion remaining in calendar years 2020 to 2022), LMDA funding to support workers in seasonal industries announced in Budget 2018 ($3.7 million remaining in calendar year 2020), and LMDA funding to support workers impacted by steel and aluminium tariffs announced in June 2018 ($14.1 million remaining in calendar year 2020).
| Actual | Forecast | ||||||||
|---|---|---|---|---|---|---|---|---|---|
| 2019-20 | 2020-21 | 2021-22 | 2022-23 | 2023-24 | 2024-25 | 2025-26 | 2026-27 | 2027-28 | |
| EBSM (Fiscal Year) | 2,476 | 2,449 | 2,531 | 2,532 | 2,107 | 2,107 | 2,107 | 2,107 | 2,107 |
| Actual | Forecast | ||||||||
| 2019 | 2020 | 2021 | 2022 | 2023 | 2024 | 2025 | 2026 | 2027 | |
| EBSM (Calendar Year) | 2,464 | 2,899 | 2,529 | 2,532 | 2,107 | 2,107 | 2,107 | 2,107 | 2,107 |
D.3.11 Administration Costs
As with Part II benefits, the expected annual estimates for EI administration costs are provided by ESDC on a fiscal year basis. The calendar year costs shown in Table 50 are based on 25% of the current fiscal year and 75% of the next fiscal year.
| Actual | Forecast | ||||||||
|---|---|---|---|---|---|---|---|---|---|
| 2019-20 | 2020-21 | 2021-22 | 2022-23 | 2023-24 | 2024-25 | 2025-26 | 2026-27 | 2027-28 | |
| Administration Costs (Fiscal Year)Footnote * | 1,909 | 1,971 | 1,807 | 1,792 | 1,788 | 1,783 | 1,783 | 1,783 | 1,783 |
| Actual | Forecast | ||||||||
| 2019 | 2020 | 2021 | 2022 | 2023 | 2024 | 2025 | 2026 | 2027 | |
| Administration Costs (Calendar Year)Footnote * | 1,890 | 1,944 | 1,860 | 1,796 | 1,789 | 1,784 | 1,783 | 1,783 | 1,783 |
|
|||||||||
As mentioned previously, the calculation of the reduction related to the EI program’s savings due to the Québec Parental Insurance Plan includes variable administration costs (VAC). The VAC represent direct operating costs incurred by the EI program associated with the administration of MP benefits outside Québec.
These costs represent the savings to the EI program if it ceased to provide EI MP benefits. The responsibility of determining the VAC each year lies with ESDC. It should be noted that under the Canada-Québec Final Agreement, the Government of Canada provided assurance that the VAC multiplied by the ratio of the insurable earnings in Québec to the insurable earnings outside Québec would not be less than $5 million. The 2020 to 2027 VAC are projected from actual costs incurred in 2019 as a constant percentage of MP benefits. When applicable, VAC are increased to reflect the minimum under the Canada-Québec Final Agreement.
| Actual | Forecast | ||||||||
|---|---|---|---|---|---|---|---|---|---|
| 2019 | 2020 | 2021 | 2022 | 2023 | 2024 | 2025 | 2026 | 2027 | |
| Variable Administration Costs | 17.2 | 17.3 | 17.3 | 17.4 | 17.5 | 17.5 | 17.6 | 17.6 | 17.8 |
D.3.12 Bad Debt
Bad debt expenses relate to overpayments and penalties owed and are equal to the amount written off during the year and the change in the annual allowance for doubtful debts. The allowance is calculated on the outstanding balance in the accounts at the end of the fiscal year and is based on the collection policy, the age of the accounts and the amounts written off.
The calendar year bad debt expense included in the closing balance of the EI Operating Account as of 31 December 2019 was equal to 25% of the 2018-2019 expense and 75% of the 2019-2020 expense.
Based on fiscal year 2019-2020, the allowance for doubtful debts is forecasted as 1.9% of total projected Part I benefits. The write-offs for 2020-2021 and following fiscal years are forecasted based on the proportion of write-offs over the opening allowance for doubtful debts for 2019‑2020 as well as the expected increase in benefit payments.
The bad debt expense for a given year corresponds to the difference between the allowance calculated for the year and the net allowance of the previous year (i.e. allowance at the end of the previous year reduced by the write-offs that occurred during the year).
| Actual | Forecast | ||||||||
|---|---|---|---|---|---|---|---|---|---|
| 2019-20 | 2020-21 | 2021-22 | 2022-23 | 2023-24 | 2024-25 | 2025-26 | 2026-27 | 2027-28 | |
| Allowance for Doubtful Accounts (Current Year) | 399 | 506 | 422 | 401 | 403 | 414 | 428 | 441 | 454 |
| Net Allowance (Prior Year) | |||||||||
| Allowance for Doubtful Accounts (Prior Year) | 400 | 399 | 506 | 422 | 401 | 403 | 414 | 428 | 441 |
| Write-Offs | (66) | (82) | (97) | (60) | (64) | (68) | (71) | (73) | (75) |
| Total | 334 | 317 | 409 | 362 | 337 | 335 | 343 | 355 | 366 |
| Bad Debt Expense (Fiscal Year) | 65 | 189 | 13 | 40 | 66 | 79 | 85 | 86 | 88 |
| Actual | Forecast | ||||||||
| 2019 | 2020 | 2021 | 2022 | 2023 | 2024 | 2025 | 2026 | 2027 | |
| Bad Debt Expense (Calendar Year) | 74 | 158 | 57 | 33 | 59 | 76 | 83 | 86 | 88 |
D.3.13 Penalties
The Commission may impose a penalty on a claimant, any person acting on behalf of a claimant or an employer under sections 38 and 39 of the EI Act should it become aware that they knowingly provided false or misleading information.
Penalties are correlated with benefit overpayments and are forecasted from the base year using the expected annual change in Part I benefits.
| Actual | Forecast | ||||||||
|---|---|---|---|---|---|---|---|---|---|
| 2019 | 2020 | 2021 | 2022 | 2023 | 2024 | 2025 | 2026 | 2027 | |
| Penalties | 55 | 72 | 93 | 77 | 74 | 74 | 76 | 79 | 81 |
D.3.14 Interest
Interest is charged on outstanding EI debts caused through misrepresentation. This includes overpayments and penalties. As per the Interest and Administrative Charges Regulations, the rate of interest charged to EI claimants, employers or third parties on outstanding debts is equal to 3% above the average Bank of Canada discount rate (overnight rate plus 0.25%) from the previous monthFootnote 14.
The 2019 overnight rate was 1.75%. It was lowered to 1.25% on 4 March 2020, 0.75% on 16 March 2020 and 0.25% on 27 March 2020. The corresponding discount rate (Bank Rate) starting in March 2020 is 0.50% (0.25% + 0.25%). The overnight rate is projected for 2020 and 2021 based on the 3-month T‑Bill forecast from the May 2020 Department of Finance private sector survey. It is then expected to increase further in the following years to reach an ultimate value of 2.1% with a corresponding discount rate of 2.35% in 2027. The rate of interest charged on overdue accounts is thus projected at 5.35% (2.35% + 3.00%) in 2027.
As the interest earned is correlated with the amount of outstanding benefit overpayments, it is forecasted using the expected annual change in Part I benefits and the 12-month average of the interest rate. Expected interest for 2020 is based on interest in 2019, increased for changes in Part I benefits and average interest rate from 2019 to 2020.
| Actual | Forecast | ||||||||
|---|---|---|---|---|---|---|---|---|---|
| 2019 | 2020 | 2021 | 2022 | 2023 | 2024 | 2025 | 2026 | 2027 | |
| Average Interest Rate | 5.00% | 3.93% | 3.75% | 3.85% | 4.15% | 4.35% | 4.65% | 4.95% | 5.35% |
| Interest | 22 | 22 | 27 | 23 | 23 | 24 | 27 | 30 | 33 |
Appendix E - Reduction in Employer Premiums Due to Qualified Wage-Loss Plans
This appendix describes the data, methodology and assumptions that underlie the calculation of the 2021 reduction in employer premiums due to qualified wage‑loss plans included in this report. Data and assumptions were updated to reflect the most recent experience, but the methodology used is the same as in the previous actuarial report.
E.1 Background and Legislation on the Premium Reduction Program
Under subsection 69(1) of the Employment Insurance Act (“EI Act”), the Commission shall, with the approval of the Governor in Council, make regulations to provide a system for reducing employer premiums when employees are covered by a qualified wage-loss plan which reduces EI special benefits otherwise payable, provided that at least 5/12 of the reduction is passed on to employees.
Under subsection 69(3) of the EI Act, the Commission makes regulations for the operation of a premium reduction system, including the method for determining the amount of reduction, the use of actuarial calculations and estimates, and the specific details related to the administration of the program such as minimum qualification criteria and other registration conditions.
The Premium Reduction Program (PRP) was introduced in 1971 at the same time that sickness benefits were introduced to the Unemployment Insurance Program. At the time, many workers were already covered against loss of wages due to illness through employer sponsored plans. It was recognized that the introduction of EI sickness benefits could cause a duplication of costs to both employers and employees. As stated in the 1970 White Paper on Unemployment Insurance, cost concerns and a desire to recognize the role of existing wage-loss plans contributed to the decision to supplement rather than pre-empt those plans. With the exception of benefits paid from registered Supplemental Unemployment Benefit (SUBFootnote 15) plans, it was therefore decided that benefits payable from employer sponsored wage-loss plans would be deducted from EI sickness benefits. In other words, the EI program would adopt a second payer position relative to employer sponsored wage-loss plans that are not registered SUB plans. This implies that employees who become ill and who are not covered by a registered SUB plan first make use of their employer’s plan and only make use of EI sickness benefits if they have no employer plan, or if they have exhausted the benefits from their employer’s plan.
Employers who have a wage-loss plan that meets specific qualification requirements may apply for a reduction of EI premiums under the PRP. In addition to meeting the qualification requirements, participation in the PRP is conditional upon the employer passing on at least 5/12 of the premium reduction to the employees. For administrative simplicity, the full premium reduction is provided to the employer who is then responsible for returning the employees’ portion of the reduction to them through cash or fringe benefits.
In accordance with sections 63, 64, 65 and 66 of the Employment Insurance Regulations (“EI Regulations”), there are four categories of qualified wage-loss plans, which correspond to the main types of wage-loss plans offered to workers. A summary of each category is shown below:
Category 1: Cumulative paid sick leave plans that allow for a minimum monthly accumulation of at least one day and for a maximum accumulation of at least 75 days.
Category 2: Enhanced cumulative paid sick leave plans that allow for a minimum monthly accumulation of at least one day and two thirds and for a maximum accumulation of at least 125 days.
Category 3: Weekly indemnity plans with a maximum benefit period of at least 15 weeks.
Category 4: Special weekly indemnity plans provided by certain public and parapublic employers of a province with a maximum benefit period of at least 52 weeks.
For each category, a rate of reduction, expressed as a percentage of insurable earnings, is calculated annually. These rates of reduction are then converted into reduced employer multipliers for each category and applicable premium rate.
The principle in determining the rates of reduction is that the EI program is paying lower sickness benefits due to the presence of qualified wage-loss plans, and that these savings to the EI program should be passed on to the employers who sponsor these plans and their employees. As it would not be practical to do this on an individual employer basis nor even possible to make the calculation for new employers or small firms, the rates of reduction compensate employers (and their employees) for the average rate of EI benefit savings that are generated by qualified plans in each category. Given that EI sickness benefits paid to employees who are covered by a qualified wage-loss plan depend on the category, the savings generated, and therefore the rates of reduction, vary by category.
The methodology to calculate the rates of reduction is prescribed in section 62 of the EI Regulations. Pursuant to this section, the employer’s premium shall be reduced by the percentage by which the first payer cost ratio in respect of all insured persons exceeds the experience cost ratio in respect of insured persons covered by a qualified wage-loss plan of that employer’s category.
Both the first payer cost ratio and the experience cost ratio are based on averages from the three years ending with the second year preceding the year for which the calculation is made. Accordingly, for 2021, the years 2017, 2018 and 2019 are used to calculate the first payer cost ratio and the experience cost ratio. The detailed formula for calculating the rates of reduction is presented in Appendix B of this report.
More information on the first payer cost ratio and the experience cost ratio is presented in the following subsections, as well as the resulting rates of reduction, reduced employer multipliers and estimated amount of premium reduction for 2021.
E.2 First Payer Cost Ratio
The first payer cost ratio represents the average hypothetical job-attachedFootnote 16 EI sickness benefits that would have been paid if benefits payable under a group sickness or disability wage-loss indemnity plan or paid sick leave plan were disregarded for purposes of determining benefits otherwise payable to persons under the EI Act. It is expressed as a percentage of average insurable earnings for all insured persons. This produces a uniform first payer cost ratio reflecting the national average usage for all EI contributors and is consistent with the fact that EI contributors are charged a uniform premium rate in accordance with the pooling of risk principle.
For the purposes of calculating the 2021 rates of reduction, the first payer cost ratio is equal to the average of the first payer cost for the years 2017 to 2019, divided by the average insurable earnings of all insured persons for the years 2017 to 2019.
The first payer cost for each year is determined by multiplying the hypothetical number of first payer job-attached EI sickness benefit weeks (namely, those that would have been paid if benefits under a group sickness or disability wage-loss indemnity plan or paid sick leave plan were disregarded for EI benefit purposes) by the average weekly sickness benefits that would apply in such circumstances.
The first payer cost was not revised for previously calculated years (i.e. 2017 and 2018). More information on the 2017 and 2018 first payer cost can be found in the 2020 Actuarial Report.
E.2.1 First payer job-attached EI sickness benefit weeks
The hypothetical number of first payer job-attached EI sickness benefit weeks is equal to the product of the hypothetical number of first payer job-attached EI sickness claims and the average duration in weeks of these claims. The hypothetical number of first payer job-attached EI sickness claims is based on the number of individuals with insurable earnings and on an assumed job-attached EI sickness usage rate. This assumed job-attached EI sickness usage rate depends on a number of factors such as the probability of being sick for more than one week (EI sickness incidence rate), the probability of being eligible and applying for EI benefits and the probability of being job-attached at the time of illness.
Employer and employee-wide data on sickness incidences and their duration are not readily available. The most exhaustive and complete data that are available is through the combination of the EI administrative data file and the Canada Revenue Agency T4 data file. The EI sickness incidence rate is therefore estimated based on an analysis of administrative EI and T4 data. Given that the EI claims data are incomplete for employees covered by a qualified wage-loss plan (i.e. only residual claims are paid from the EI program), the EI sickness usage rate of individuals that are not covered by a qualified wage-loss plan was used as a basis for developing the overall EI sickness incidence rate of the entire insured population.
This overall EI sickness incidence rate is adjusted to reflect the estimated impact on incidence rates of different age, sector of employment and salary profiles between individuals with and without a qualified wage-loss plan. The job‑attached EI sickness usage rate differs by sector of employment and depending on whether or not an individual is covered by a qualified wage-loss plan due to different EI eligibility/benefit application rates and varying degrees of job attachment. Individuals who are covered by a qualified wage-loss plan have more stable full-time employment and are more likely to meet the EI eligibility requirements and be job-attached at the time of the illness. Furthermore, they are more likely to apply for EI benefits given that under the hypothetical first payer scenario, employers sponsoring a qualified wage-loss plan are assumed to adopt a second payer position rather than eliminating sickness coverage altogether.
Based on quantitative and qualitative analysis, assumptions were developed to estimate the job-attached EI sickness usage rate of all insured persons under a hypothetical first payer scenario and the resulting hypothetical number of first payer EI sickness claims. The hypothetical number of first payer job-attached EI sickness benefit weeks is calculated by multiplying the hypothetical number of first payer EI sickness claims by the estimated average duration in weeks. To obtain the average duration of claims, the wage-loss status of individuals was taken into account. This is because employees with a wage-loss plan tend to have stronger labour force attachment and that individuals with strong labour force attachment have slightly longer claim durations based on administrative claims data.
Consequently, the 2019 hypothetical number of first payer job-attached EI sickness claims is 685,319 and the assumed average duration of these claims is 9.0 weeks. The resulting hypothetical number of first payer job-attached EI sickness benefit weeks for 2019 is 6,195,852.
The hypothetical number of first payer job-attached EI sickness benefit weeks for 2017 and 2018 is 5,591,763 and 5,990,174 respectively. More information is provided in the 2020 Actuarial Report.
E.2.2 Average Weekly Sickness Benefits
The average weekly benefits can be calculated by multiplying the following elements:
- Benefit rate (i.e. 55%);
- Weekly insurable earnings of all EI contributors; and
- Ratio of insurable earnings used to calculate the benefits of claimants to the insurable earnings of all EI contributors (“Ratio”). This Ratio captures the effect of the formula used to determine EI weekly benefits and any structural differences between insurable earnings of contributors and claimants.
The average weekly sickness benefits of individuals that are not covered by a qualified wage-loss plan were analysed and broken down into these separate elements. It was observed that the Ratio for individuals with a strong labour force attachment is significantly lower than the Ratio for all individuals. In addition, the Ratio for individuals with insurable earnings at the maximum insurable earnings is close to 1. Based on this analysis, an assumption was developed for the Ratio that would be applicable under a hypothetical first payer scenario. This Ratio was then applied to the benefit rate and weekly insurable earnings to derive the average weekly sickness benefits under a hypothetical first payer scenario.
The resulting average weekly sickness benefits under a hypothetical first payer scenario is $454.02 for 2019. The average weekly sickness benefits under a hypothetical first payer scenario for 2017 and 2018 are $435.14 and $443.12 respectively, as calculated in the 2020 Actuarial Report.
E.2.3 Resulting First Payer Cost and First Payer Cost Ratio
Based on the foregoing, the first payer cost ratio used for the calculation of the 2021 rates of reduction is 0.4176%. Table 55 shows more details on how this first payer cost ratio is determined.
| 2017Footnote * | 2018Footnote * | 2019 | Average for 2021 Rates of Reduction | |
|---|---|---|---|---|
| First Payer EI Sickness Benefit Weeks (A) | 5,591,763 | 5,990,174 | 6,195,852 | N/A |
| First Payer Average EI Sickness Benefits (B) ($) | 435.14 | 443.12 | 454.02 | N/A |
| First Payer Cost (A x B) ($) | 2,433,215,000 | 2,654,347,000 | 2,813,033,000 | 2,633,531,667 |
| Total Insurable Earnings (TIE) ($) | 601,522,510,514 | 629,771,993,554 | 660,523,389,608 | 630,605,964,559 |
| First Payer Cost Ratio (% of TIE) | 0.4045% | 0.4215% | 0.4259% | 0.4176% |
|
||||
E.3 Experience Cost Ratio
Under certain circumstances, EI sickness benefits are paid to individuals covered by a qualified wage-loss plan. The costs to the EI program of these benefits are deducted from the premium reduction granted through the experience cost ratio, which is subtracted from the first payer cost ratio for purposes of calculating the rates of reduction.
The experience cost ratio, which is different for each category, reflects the actual average job-attached EI sickness benefits paid for each category. It is expressed as a percentage of average insurable earnings for the insured persons in that category. In accordance with the EI Regulations, EI sickness benefits paid to individuals who were not job-attached at the time of the claim are not included in the experience cost ratio.
The allocations of annual job-attached EI sickness benefits paid and of insurable earnings among each category are based on an analysis of administrative data and reports provided by Service Canada and ESDC. For 2017, 2018 and 2019, the total cost of job-attached EI sickness benefits for each category is shown in Table 56, and the insurable earnings for each category are shown in Table 57 ; the amounts shown for 2019 are based on preliminary data.
| 2017 | 2018 | 2019 | Average for 2021 Rates of Reduction | |
|---|---|---|---|---|
| Category 1 | 91,717,891 | 91,297,594 | 101,420,377 | 94,811,954 |
| Category 2 | 10,471,109 | 11,262,658 | 12,847,740 | 11,527,169 |
| Category 3 | 90,160,920 | 93,045,944 | 105,041,667 | 96,082,844 |
| Category 4 | 2,562,627 | 2,769,051 | 3,485,271 | 2,938,983 |
| Total | 194,912,548 | 198,375,247 | 222,795,054 | 205,360,950 |
| 2017 | 2018 | 2019 | Average for 2021 Rates of Reduction | |
|---|---|---|---|---|
| Category 1 | 47,640,582,833 | 49,122,215,497 | 51,190,562,695 | 49,317,787,008 |
| Category 2 | 23,699,986,914 | 24,057,290,154 | 25,496,202,839 | 24,417,826,636 |
| Category 3 | 189,720,199,816 | 194,914,432,005 | 200,204,639,390 | 194,946,423,737 |
| Category 4 | 22,075,876,136 | 22,797,746,167 | 23,778,842,026 | 22,884,154,776 |
| Total | 283,136,645,699 | 290,891,683,823 | 300,670,246,949 | 291,566,192,157 |
The experience cost ratio used in the calculation of the 2021 rates of reduction for each category is shown in Table 58.
| Average EI Sickness Costs ($) (A) |
Average Insurable Earnings ($) (B) |
Experience Cost Ratio (A/B) |
|
|---|---|---|---|
| Category 1 | 94,811,954 | 49,317,787,008 | 0.1922% |
| Category 2 | 11,527,169 | 24,417,826,636 | 0.0472% |
| Category 3 | 96,082,844 | 194,946,423,737 | 0.0493% |
| Category 4 | 2,938,983 | 22,884,154,776 | 0.0128% |
E.4 Rates of Reduction
Pursuant to section 62 of the EI Regulations and section 68 of the EI Act, the employer’s premium shall be reduced by the percentage by which the first payer cost ratio in respect of all insured persons exceeds the experience cost ratio in respect of insured persons covered by a qualified wage-loss plan of that employer’s category. The premium reduction is therefore granted by reducing the employer multiple below 1.4 to a value rounded to 3 decimals.
Table 59 shows the 2021 rates of reduction for each category of qualified wage-loss plan, along with the corresponding reduced employer multiplier for out-of-Québec and Québec employers. The employer multipliers presented in the table are calculated with the frozen rate of 1.58% for residents of all provinces except Québec. The corresponding premium rate that applies to residents of Québec is 1.18%. Pursuant to section 62 of the EI Regulations and section 68 of the EI Act, the employer multiplier is calculated from the unrounded ratesFootnote 17 of reduction and the rounded rates of reduction are shown for illustration purposes only.
| First Payer Cost Ratio | Experience Cost Ratio | Unrounded Rate of Reduction | Rounded Rate of Reduction | Employer Multiplier (Out-of-Québec) | Employer Multiplier (Québec) | |
|---|---|---|---|---|---|---|
| Category 1 | 0.4176% | 0.1922% | 0.2254% | 0.23% | 1.257 | 1.209 |
| Category 2 | 0.4176% | 0.0472% | 0.3704% | 0.37% | 1.166 | 1.086 |
| Category 3 | 0.4176% | 0.0493% | 0.3683% | 0.37% | 1.166 | 1.086 |
| Category 4 | 0.4176% | 0.0128% | 0.4048% | 0.40% | 1.144 | 1.057 |
The Commission will notify each registered employer of the applicable 2021 rate of reduction and employer multiplier. Pro-rated rates apply for plans that do not qualify for a reduction for the full twelve months in the calendar year. In addition, adjusted rates may apply for employers who deduct QPIP premiums for a portion but not all of their employees.
E.5 Amount of Premium Reduction
Table 60 shows the estimated amount of premium reduction to be granted in 2021. The estimates are based on the historical distribution of insurable earnings by category, which was derived from Canada Revenue Agency T4 data.
| Estimated Number of Qualified Employers | 2021 Insurable Earnings ($ millions) | Rates of Reduction | Premium Reduction ($ millions) | |
|---|---|---|---|---|
| Category 1 | 2,400 | 51,771 | 0.2254% | 117 |
| Category 2 | 600 | 25,785 | 0.3704% | 96 |
| Category 3 | 25,400 | 202,476 | 0.3683% | 746 |
| Category 4 | 300 | 24,049 | 0.4048% | 97 |
| Total | 28,700 | 304,081 | N/A | 1,055 |
Appendix F - Acknowledgements
We would like to thank the staff at Employment and Social Development Canada, Canada Revenue Agency, Finance Canada and Service Canada who provided the relevant data used in this report. Without their useful assistance, we would not have been able to produce this report.
The following people assisted in the preparation of this report:
Assia Billig, FCIA, FSA
Alice Chiu, ACIA, ASA
Pascale Jomphe
Maxime L. Delisle, FCIA, FSA, CERA
Kelly Moore
Footnotes
- Footnote 1
-
Had the EI ERB not been put in place, a large number of people would have received EI regular and sickness benefits instead, still causing a large deficit and a significant increase in the premium rate.
- Footnote 2
-
Shown in Table 9 of the main report for information purposes.
- Footnote 3
-
The number of earners is derived from the T4 data provided by CRA.
- Footnote 4
-
The number of employees is based on the latest Statistics Canada Labour Force Survey.
- Footnote 5
-
The 2020 distribution may be affected by the COVID-19 pandemic; it will be analyzed when the data becomes available.
- Footnote 6
-
Had the EI ERB not been put in place, a large number of people would have received EI regular and sickness benefits instead, still causing a large deficit.
- Footnote 7
-
The application of a minimum unemployment rate results in a lower number of required insurable hours to qualify for regular benefits, as well as more weeks of regular benefits entitlement.
- Footnote 8
-
On 20 August 2020, the Government announced a 4-week extension, bringing the maximum number of weeks to 28. The estimates shown in the report were not revised following this announcement.
- Footnote 9
-
A sickness claim is considered job-attached if the interruption of earnings with the employer was by reason of illness, injury or quarantine.
- Footnote 10
-
The AWE series has been revised by Statistics Canada since the 2020 Actuarial Report.
- Footnote 11
-
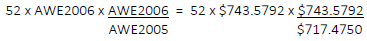
Text Version
52 multiplied by the 2006 AWE and the ratio of the 2006 AWE to the 2005 AWE is equal to 52 times $743.5792 multiplied by $743.5792 divided by $717.4750.
- Footnote 12
-
In theory, EI regular beneficiaries outside the labour force (inactive) should also be added to the number of potential claimants since they receive benefits but are not counted as unemployed in the Labour Force Survey. Due to the lack of availability of data, those EI regular beneficiaries are not included in the analysis, which results in an implicit assumption of constant proportion as a percentage of unemployed.
- Footnote 13
-
The number of unemployed individuals with an invalid job separation is obtained by multiplying the number of unemployed individuals by the percentage of unemployed with an invalid job separation. This percentage is determined using the EI Monitoring and Assessment report, which is based on Statistics Canada’s EI Coverage Survey. Invalid job separations include: voluntarily leaving employment without just cause or to go to school; being dismissed for misconduct; or being unemployed because of a direct participation in a labour dispute (https://www.canada.ca/en/employment-social-development/programs/ei/ei-list/reports/regularbenefits/apply.html).
- Footnote 14
-
Interest rates can be found at http://www.tpsgc-pwgsc.gc.ca/recgen/txt/tipp-ppir-eng.html
- Footnote 15
-
A SUB is a supplemental payment to an employee who is receiving EI benefits during a period of unemployment due to temporary stoppage of work, training, illness, injury or quarantine. These payments are made according to the terms of a SUB plan financed by the employer. Payments from a registered SUB plan that meets the requirements of section 37 of the Employment Insurance Regulations are not deducted from the employee’s EI benefits.
- Footnote 16
-
A sickness claim is considered job-attached if the interruption of earnings with the employer was by reason of illness, injury or quarantine.
- Footnote 17
-
Due to administration system limitations, categories 2 and 3 employer multipliers in this report (1.166 and 1.086 for out-of-Québec and Québec employers respectively) are based on the rounded rate as the employer multiplier can not be different for a same rounded rate of reduction. Based on the unrounded rates, employer multipliers for category 2 would have been the same (1.166 and 1.086), while employer multipliers for category 3 would have been slightly higher (1.167 and 1.088).