Actuarial Report (19th) on the Pension Plan for the Public Service of Canada as at 31 March 2020
Accessibility statement
The Web Content Accessibility Guidelines (WCAG) defines requirements for designers and developers to improve accessibility for people with disabilities. It defines three levels of conformance: Level A, Level AA, and Level AAA. This report is partially conformant with WCAG 2.0 level AA. If you require a compliant version, please contact webmaster@osfi-bsif.gc.ca.
The Honourable Jean-Yves Duclos, P.C., M.P.
President of the Treasury Board
Ottawa, Canada
K1A 0R5
Dear Minister:
Pursuant to Section 6 of the Public Pensions Reporting Act, I am pleased to submit the report on the actuarial review as at 31 March 2020 of the pension plan for the Public Service of Canada. This actuarial review is in respect of pension benefits and contributions which are defined by Parts I, III and IV of the Public Service Superannuation Act, the Special Retirement Arrangements Act and the Pension Benefits Division Act.
Yours sincerely,
Assia Billig, FCIA, FSA, PhD
Chief Actuary
Table of contents
Tables
- Table 1 - Main Results as at 31 March 2020
- Table 2 - PSSA Current Service Cost on a Calendar Year Basis
- Table 3 - PSSA Current Service Cost on a Calendar Year Basis - Group 1
- Table 4 - PSSA Current Service Cost on a Calendar Year Basis - Group 2
- Table 5 - Member Contribution Rates
- Table 6 - RCA No. 1 Current Service Cost on a Calendar Year Basis
- Table 7 - Ultimate Best-Estimate Economic Assumptions
- Table 8 - Demographic Assumptions
- Table 9 - State of the Superannuation Account
- Table 10 - Balance Sheet - Pension Fund
- Table 11 - Reconciliation of PSSA Financial Position
- Table 12 - Experience Gains and (Losses)
- Table 13 - Gains and (Losses) due to Revision of Actuarial Assumptions
- Table 14 - Current Service Cost for Plan Year 2022
- Table 15 - Reconciliation of PSSA Current Service Cost
- Table 16 - Projection of Current Service Cost on a Plan Year Basis
- Table 17 - Pension Fund Administrative Expenses
- Table 18 - Estimated Contributions for Prior Service BuyBack
- Table 19 - Sensitivity of Valuation Results to Variations in Mortality Improvement Rates
- Table 20 - Sensitivity of Valuation Results to Variations in Key Economic Assumptions
- Table 21 - State of the RCA No. 1 Account
- Table 22 - State of the RCA No. 2 Account
- Table 23 - RCA No. 1 - Current Service Cost
- Table 24 - Estimated Government Credits
- Table 25 - Estimated Government Cost - Pension Fund
- Table 26 - Member Contribution Rates
- Table 27 - Reconciliation of Balances in Superannuation Account
- Table 28 - Reconciliation of Balances in Pension Fund
- Table 29 - Reconciliation of Balances in RCA No. 1 Account
- Table 30 - Reconciliation of Balances in RCA No. 2 Account
- Table 31 - Rates of Interest (Return)
- Table 32 - Summary of Membership Data
- Table 33 - Reconciliation of Group 1 Contributors
- Table 34 - Reconciliation of Group 2 Contributors
- Table 35 - Reconciliation of Pensioners
- Table 36 - Reconciliation of Surviving Spouses
- Table 37 - Reconciliation of Children Survivors
- Table 38 - Reconciliation of Pensioners with ERI Benefits
- Table 39 - Actuarial Value of Pension Fund Assets
- Table 40 - Asset Mix
- Table 41 - Real Rate of Return by Asset Type
- Table 42 - Overall Rate of Return on Assets of the Pension Fund
- Table 43 - Rates of Return on Assets in Respect of the Pension Fund
- Table 44 - Transfer Value Real Interest Rates
- Table 45 - Economic Assumptions
- Table 46 - Sample of Assumed Seniority and Promotional Salary Increases
- Table 47 - Assumed Annual Increases in Number of Contributors
- Table 48 - Sample of Assumed Rates of Retirement - Main Group 1 - Male
- Table 49 - Sample of Assumed Rates of Retirement - Main Group 1 - Female
- Table 50 - Sample of Assumed Rates of Retirement - Main Group 2 - Male
- Table 51 - Sample of Assumed Rates of Retirement - Main Group 2 - Female
- Table 52 - Sample of Assumed Rates of Retirement - Operational Service
- Table 53 - Sample of Assumed Rates of Pensionable Disability
- Table 54 - Sample of Assumed Rates of Withdrawal - Main Group - Male
- Table 55 - Sample of Assumed Rates of Withdrawal - Main Group - Female
- Table 56 - Sample of Assumed Rates of Withdrawal - Operational Group
- Table 57 - Sample of Proportions Opting for a Deferred Annuity - Main Group - Male
- Table 58 - Sample of Proportions Opting for a Deferred Annuity - Main Group - Female
- Table 59 - Sample of Proportions Opting for a Deferred Annuity - Operational Service Group
- Table 60 - Sample of Assumed Rates of Mortality Weighted by Salary
- Table 61 - Sample of Assumed Mortality Improvement Rates
- Table 62 - Cohort Life Expectancy of Contributors and Retirement Pensioners
- Table 63 - Sensitivity of Life Expectancy to Variations in Mortality Improvement Rates
- Table 64 - Assumptions for Survivor Spouse Allowances
- Table 65 - Sample of Assumed Proportion Eligible Spouse at Termination of Member
- Table 66 - Sample of Assumed Divorce Rates
- Table 67 - Financial Positions at Tail-Events of Best-Estimate Portfolio as at 31 March 2023
- Table 68 - Male Contributors (Main Group)
- Table 69 - Main Male - Summary
- Table 70 - Female Contributors (Main Group)
- Table 71 - Main Female - Summary
- Table 72 - Male Contributors (Operational Group)
- Table 73 - CSC Male - Summary
- Table 74 - Female Contributors (Operational Group)
- Table 75 - CSC Female - Summary
- Table 76 - Contributors on Leave Without Pay and Non-active Contributors
- Table 77 - LWOP - Summary
- Table 78 - Male Retired Pensioners
- Table 79 - Pensioner Male - Summary
- Table 80 - Female Retired Pensioners
- Table 81 - Pensioner Female - Summary
- Table 82 - Male Disabled Pensioners
- Table 83 - Male Disabled Pensioner- Summary
- Table 84 - Female Disabled Pensioners
- Table 85 - Female Disabled Pensioner - Summary
- Table 86 - Surviving Spouses
- Table 87 - Survivor - Summary
Charts
- Chart 1 - Evolution of Liabilities of Superannuation Account and Pension Fund over Time
- Chart 2 - Evolution of Cash Flows over Time
- Chart 3 - Evolution of Group 1 and Group 2 Active Membership
- Chart 4 - Range of Potential Funding Ratio for the Best-Estimate Portfolio - PS Pension Fund
- Chart 5 - Likelihood of Deficit, Permitted and Non-Permitted Surplus due to Investment Experience
1. Executive Summary
This actuarial report on the pension plan for the Public Service of Canada (PSPP) was made pursuant to the Public Pensions Reporting Act (PPRA).
This actuarial valuation is as at 31 March 2020 and is in respect of pension benefits and contributions defined by Parts I, III and IV of the Public Service Superannuation Act (PSSA), the Special Retirement Arrangements Act (SRAA), which covers the Retirement Compensation Arrangements Regulations No. 1 and No. 2 (RCA), and the Pension Benefits Division Act (PBDA).
The previous actuarial report was prepared as at 31 March 2017. The next periodic review is scheduled to occur no later than 31 March 2023.
1.1 Purpose of Actuarial Report
The purposes of this actuarial valuation are to determine the state of the Public Service Superannuation Account (Superannuation Account), the Public Service Pension Fund (Pension Fund) and the RCA Accounts, to determine the projected current service costs for the Pension Fund and the RCA Accounts as well as to assist the President of the Treasury Board in making informed decisions regarding the financing of the government’s pension benefit obligations. This report may not be suitable for another purpose.
1.2 Main Findings
| Superannuation Account |
Pension Fund |
RCA No. 1 Account |
RCA No. 2 Account |
|
|---|---|---|---|---|
| Financial Position | ||||
| Recorded Balance/Actuarial Value of Assets | 91,537 | 125,409 | 2,615 | 1,272 |
| Actuarial Liability | 98,837 | 110,909 | 2,192 | 1,142 |
| Actuarial Excess(Shortfall)/Surplus(Deficit) | (7,300) | 14,500 | 423 | 130 |
| Current Service Costs for Calendar Year 2022 | ||||
| Member Contributions | - | 2,754 | 6.6 | - |
| Government Current Service Cost | - | 2,783 | 39.0 | - |
| Total Current Service Cost/Credit | - | 5,537 | 45.6 | - |
| Special Credits/Payments in Plan Year 2022 | 7,805 | - | - | - |
Table 1 Footnote
|
||||
The proposed amounts to be credited to (or debited from) the Accounts and the Pension Fund are shown on a calendar year basis in this section, beginning with calendar year 2022, which is the first calendar year that follows the expected tabling of this report. Valuation results on a plan yearFootnote 1 basis are shown in Section II.
1.2.1 Superannuation Account (Service prior to 1 April 2000) as at 31 March 2020
- The balance of the Superannuation Account is $91,537 million;
- the actuarial liability for service prior to 1 April 2000Footnote 2 is $98,837 million;
- the resulting actuarial shortfall is $7,300 million;
- it is expected that the government will make a one-time credit of $7,805 million as at 31 March 2022 to eliminate the actuarial shortfall.
The time, manner and amount of such credits are to be determined by the President of the Treasury Board.
1.2.2 Pension Fund (Service since 1 April 2000)
1.2.2.1 Financial Position as at 31 March 2020
- The actuarial value of the assets in respect of the Pension Fund is $125,409 million;
- the actuarial liability is $110,909 million;
- the resulting actuarial surplus is $14,500 million;
- the funding ratio is 113.1%.
1.2.2.2 Current Service CostFootnote 3
Table 2 shows the projected current service cost expressed in millions of dollars and as a percentage of the expected pensionable payrollFootnote 4 for the three calendar years following the expected tabling of this report. The ratio of government current service cost to contributor current service cost is also shown. Tables 3 and 4 show the same results for Group 1Footnote 5 and Group 2Footnote 6, respectively.
Projected current service costs shown in these tables are based on the memberFootnote 7 contribution rates presented in Table 5.
| Calendar Year | Current Service Cost ($ millions) |
Current Service Cost (% of pensionable payroll) |
Ratio of Government to Contributor Current Service Cost |
||||
|---|---|---|---|---|---|---|---|
| Contributors | Government | Total | Contributors | Government | Total | ||
| 2022 | 2,754 | 2,783 | 5,537 | 9.74% | 9.84% | 19.58% | 1.01 |
| 2023 | 2,850 | 2,880 | 5,730 | 9.68% | 9.79% | 19.47% | 1.01 |
| 2024 | 2,945 | 2,977 | 5,921 | 9.64% | 9.74% | 19.38% | 1.01 |
| Calendar Year | Current Service Cost ($ millions) |
Current Service Cost (% of pensionable payroll) |
Ratio of Government to Contributor Current Service Cost |
||||
|---|---|---|---|---|---|---|---|
| Contributors | Government | Total | Contributors | Government | Total | ||
| 2022 | 1,717 | 1,746 | 3,463 | 10.47% | 10.64% | 21.11% | 1.02 |
| 2023 | 1,675 | 1,705 | 3,380 | 10.47% | 10.65% | 21.12% | 1.02 |
| 2024 | 1,632 | 1,664 | 3,296 | 10.46% | 10.66% | 21.12% | 1.02 |
| Calendar Year | Current Service Cost ($ millions) |
Current Service Cost (% of pensionable payroll) |
Ratio of Government to Contributor Current Service Cost |
||||
|---|---|---|---|---|---|---|---|
| Contributors | Government | Total | Contributors | Government | Total | ||
| 2022 | 1,037 | 1,037 | 2,074 | 8.73% | 8.73% | 17.46% | 1.00 |
| 2023 | 1,175 | 1,175 | 2,350 | 8.75% | 8.75% | 17.50% | 1.00 |
| 2024 | 1,313 | 1,313 | 2,626 | 8.78% | 8.78% | 17.56% | 1.00 |
1.2.2.3 Member Contribution Rates
The current service cost is borne jointly by the plan members and the government. Group 1 and Group 2 member contribution rates are determined such that the government share of the current service cost contribution is 50%. Table 5 shows the member contribution rates for the three calendar years following the expected tabling of this report.
| Calendar year | Group 1 | Group 2 | ||
|---|---|---|---|---|
| Below YMPE | Above YMPE | Below YMPE | Above YMPE | |
| 2022 | 9.36% | 12.48% | 7.95% | 11.82% |
| 2023 | 9.35% | 12.37% | 7.93% | 11.72% |
| 2024 | 9.35% | 12.25% | 7.94% | 11.54% |
1.2.3 RCA No. 1 Account as at 31 March 2020
- The balance of the RCA No. 1 Account is $2,615 million;
- the actuarial liability is $2,192 million;
- the resulting actuarial excess is $423 million.
Table 6 shows the projected current service cost in millions of dollars and as a percentage of the expected pensionable payroll for the three calendar years following the expected tabling of this report. The ratio of government current service cost to contributor current service cost is also shown.
| Calendar Year | Current Service Cost ($ millions) |
Current Service Cost (% of pensionable payroll) |
Ratio of Government to Contributor Current Service Cost |
||||
|---|---|---|---|---|---|---|---|
| Contributors | Government | Total | Contributors | Government | Total | ||
| 2022 | 6.6 | 39.0 | 45.6 | 0.03% | 0.15% | 0.18% | 5.91 |
| 2023 | 7.2 | 38.1 | 45.3 | 0.03% | 0.15% | 0.18% | 5.29 |
| 2024 | 7.9 | 36.6 | 44.5 | 0.03% | 0.15% | 0.18% | 4.63 |
1.2.4 RCA No. 2 Account as at 31 March 2020
- The balance of the RCA No. 2 Account is $1,272 million;
- the actuarial liability is $1,142 million;
- the resulting actuarial excess is $130 million.
1.3 Valuation Basis
This report is based on pension benefit provisions enacted by the legislation, summarized in Appendices A and B.
The Public Service Superannuation Act was amended by Bill C-97 which received Royal Assent on 21 June 2019. The amendment modified the rule regarding the non-permitted surplus, increasing the permitted surplus from 10% to 25% of liabilities.
Other minor amendments applied to the PSSA and the Public Service Superannuation Regulations since the previous valuation. Those modifications did not have any impact on the actuarial valuation of the plan.
The Funding Policy for the Public Sector Pension Plans (Funding Policy) was approved by the Treasury Board in 2018. The policy provides guidance and rules to support prudent governance of the plansFootnote 8 and ensures that sufficient assets are accumulated to meet the cost of the accrued pension benefits. The methods, assumptions and results of this actuarial valuation are consistent with the provisions of the Funding Policy.
The financial data on which this valuation is based on are composed of:
- The Pension Fund invested assets that the government has earmarked for the payment of benefits for service since 1 April 2000;
- the Superannuation Account established to track the government’s pension benefit obligations for service prior to 1 April 2000.
- the RCA Accounts established to track the benefit obligations in excess of those that can be provided under the Income Tax Act limits for registered pension plans.
These pension assets and account balances are summarized in Appendix C.
The membership data are provided by the Department of Public Services and Procurement Canada (PSPC). Membership data and tests performed on them are summarized in Appendix D.
The valuation was prepared using accepted actuarial practices, methods and assumptions, which are summarized in Appendices E to I.
All actuarial assumptions used in this report are best-estimate assumptions and do not include any margin for adverse deviations. They are independently reasonable and appropriate in aggregate for the purposes of the valuation at the date of this report.
Actuarial assumptions used in the previous report were revised based on economic trends and demographic experience. A complete description of the assumptions is detailed in Appendices F to I.
Table 7 presents a summary of the ultimate economic assumptions used in this report and those used in the previous report.
| 31 March 2020 | 31 March 2017 | |
|---|---|---|
| Assumed level of inflation | 2.0% | 2.0% |
| Real increase in average pensionable earnings | 0.7% | 0.8% |
| Real rate of return on the Pension Fund | 3.9% | 4.0% |
| Real projected yield on the Superannuation Account | 2.1% | 2.7% |
| Real projected yield on the RCA No. 1 and No. 2 Accounts | 2.1% | 2.7% |
Table 8 presents a summary of the demographic assumptions used in this report and those used in the previous report.
| 31 March 2020 | 31 March 2017 | |
|---|---|---|
| Promotional and seniority rate of increase | ||
| Male | 0.6 - 5.9% | 0.6 - 5.6% |
| Female | 0.7 - 6.1% | 0.7 - 5.7% |
| Life expectancy at age 65Table 8 footnote 1 | ||
| Male | 22.9 years | 21.9 years |
| Female | 24.6 years | 23.7 years |
| Average retirement age | ||
| Group 1 | 60.1 years | 59.3 years |
| Group 2 | 62.1 years | 61.6 years |
Table 8 footnote
|
||
We have reflected the impacts of the COVID-19 pandemic on the economic assumptions used in this report. Notable examples are assumptions for plan years 2020 to 2024 for the Year’s Maximum Pensionable Earnings (YMPE) and the Maximum Pensionable Earnings (MPE). The impact of COVID-19 on the economic assumptions is explained in Appendix F. It is important to note that the pandemic is a very fluid situation that will likely continue to evolve for some time. We have estimated the impacts based on the information known at the time the report was prepared. The final impacts of this health and economic crisis will likely generate some differences in the future.
2. Valuation Results
This report is based on the pension benefit provisions enacted by the legislation, summarized in Appendices A and B, and the financial and membership data, summarized in Appendices C and D, respectively. The valuation was prepared using accepted actuarial practices, methods and assumptions summarized in Appendices E to I. Emerging experience that differs from the corresponding assumptions will result in gains or (losses), which will be revealed in subsequent reports.
2.1 PSSA - Financial Position
Since 1 April 2000, member and government contributions to the PSPP are credited to the Pension Fund, and the total amount of contributions net of benefits paid and administrative expenses is transferred to the Public Sector Pension Investment Board (PSPIB) and invested in the financial markets.
This section presents the financial positions for both PSSA financing arrangements as at 31 March 2020. The results of the previous valuation are also shown for comparison.
| 31 March 2020 | 31 March 2017 | |
|---|---|---|
| Recorded Account balance | 91,516 | 94,209 |
| Present value of prior service contributions | 21 | 61 |
| Total | 91,537 | 94,270 |
| Actuarial Liability | ||
| Active contributors | 12,422 | 17,142 |
| Non-active contributors | 111 | 80 |
| Retirement pensioners | 76,266 | 69,978 |
| Disability pensioners | 2,523 | 2,617 |
| Surviving dependents | 6,985 | 6,526 |
| Outstanding payments | 7 | 12 |
| Administrative expenses | 523 | 782 |
| Total Actuarial Liability | 98,837 | 97,137 |
| Actuarial Excess/(Shortfall) | (7,300) | (2,867) |
In accordance with the PSSA, the actuarial shortfall of $7,300 million could be amortized over a maximum period of 15 years beginning on 31 March 2022. If the shortfall is amortized over the maximum period, 15 equal annual credits of $626 million could be made to the Superannuation Account. The time, manner and amount of such credits are to be determined by the President of the Treasury Board.
It is expected that the government will eliminate the actuarial shortfall of the Superannuation Account by making a one-time credit of $7,805 million as at 31 March 2022 to take into account the interest on the shortfall accumulated from 31 March 2020 to 31 March 2022.
| 31 March 2020 | 31 March 2017 | |
|---|---|---|
| Assets | ||
| Market value of assets | 123,433 | 98,770 |
| Actuarial smoothing adjustmentTable 10 footnote 1 | 1,248 | (6,672) |
| Present value of prior service contributions | 728 | 858 |
| Total actuarial value of assets | 125,409 | 92,956 |
| Actuarial Liability | ||
| Active contributors | 68,398 | 57,387 |
| Non-active contributors | 210 | 114 |
| Retirement pensioners | 39,237 | 27,617 |
| Disability pensioners | 1,929 | 1,435 |
| Surviving dependents | 963 | 624 |
| Outstanding payments | 172 | 136 |
| Total Actuarial Liability | 110,909 | 87,313 |
| Actuarial Surplus/(Deficit) | 14,500 | 5,643 |
Table 10 footnote
|
||
As at 31 March 2020, the Pension Fund has a surplus of $14,500 million and the funding ratio is 113.1%. As such, no special payments are required and there is no non-permitted surplusFootnote 9.
2.2 PSSA - Reconciliation of the Changes in Financial Position
Table 11 shows the reconciliation of the changes in the financial positions of the Superannuation Account and the Pension Fund. Explanations of the items largely responsible for the changes follow the table.
| Superannuation Account Actuarial Excess/(Shortfall) |
Pension Fund Actuarial Surplus/(Deficit) |
|
|---|---|---|
| As at 31 March 2017 | (2,867) | 5,643 |
| Recognized investment gains as at 31 March 2017 | - | 6,672 |
| Change in methodology | (57) | 1,235 |
| Retroactive changes to the population data | (129) | (895) |
| Revised Initial Financial Position as at 31 March 2017 | (3,053) | 12,655 |
| Expected interest on initial financial position | (381) | 2,036 |
| Special credits / payments | 3,225 | 377 |
| Net experience gains and (losses) | 327 | 1,479 |
| Revision of actuarial assumptions | (7,598) | (3,400) |
| Change in the present value of administrative expenses | 181 | - |
| Change in the present value of prior service contributions | (1) | 105 |
| Unrecognized investment losses as at 31 March 2020 | - | 1,248 |
| As at 31 March 2020 | (7,300) | 14,500 |
2.2.1 Recognized Investment Gains as at 31 March 2017
An actuarial asset valuation method that minimizes the impact of short-term fluctuations in the market value of assets was used in the previous valuation report, causing the actuarial value of the Pension Fund assets to be $6,672 million less than its market value.
2.2.2 Change in Methodology
Two changes occurred since the last valuation:
- A new actuarial valuation software was used to complete the valuation.
- As a result of the change in actuarial valuation software, the Age Last approach was replaced by an Age Nearest approach. These two methodologies are detailed in Appendix E.2.4.
The combined changes increased the Superannuation Account liability by $57 million and decreased the Pension Fund liability by $1,235 million.
2.2.3 Retroactive Changes to the Population Data
The population data maintained by PSPC is constantly subject to retroactive changes such as new collective agreements. The impacts of these changes increased the Superannuation Account liability as at 31 March 2017 by $129 million and the initial Pension Fund liability as at the same date by $895 million.
2.2.4 Expected Interest on Revised Initial Financial Position
The amount of interest expected to accrue during the intervaluation period increased the shortfall by $381 million for the Superannuation Account and increased the surplus by $2,036 million for the Pension Fund.
These amounts of interest were based on the Superannuation Account yields and the Pension Fund returns projected in the previous report for the three-year intervaluation period.
2.2.5 Special Credits and Payments Made in the Intervaluation Period
The government made a one-time special credit to eliminate the $2,867 million shortfall reported in the Superannuation Account as at 31 March 2017. After factoring the expected interest, this credit resulted in an increase of $3,225 million in the recorded balance of the Superannuation Account as at 31 March 2020.
A deficit was reported in the Pension Fund as at 31 March 2014 which were to be amortized over a period of 15 years in accordance with the legislation. A special paymenf of $340 million was made to the Pension Fund during the intervaluation period that resulted in an increase of $377 million in the assets of the Pension Fund after factoring the expected interest to 31 March 2020.
2.2.6 Experience Gains and (Losses)
Since the previous valuation, experience gains and losses decreased the Superannuation Account shortfall by $327 million and increased the Pension Fund surplus by $1,479 million. The main experience gain and loss items are shown in Table 12.
| Superannuation Account | Pension Fund | |
|---|---|---|
| Demographic experience (i) | ||
| New members | $30 | $140 |
| Rehired pensioner members | 0 | (35) |
| Terminations | (5) | (262) |
| Retirements | (382) | (599) |
| Disabilities with an annuity | (13) | (62) |
| Active deaths | 8 | (133) |
| Retired pensioner mortality | (216) | (70) |
| Disabled pensioner mortality | (23) | (55) |
| Widow(er) mortality | 8 | 0 |
| Total | (593) | (1,076) |
| Investment earnings (ii) | (56) | 583 |
| Service/contributions difference (iii) | 2 | 571 |
| Expected/actual disbursements (iv) | (39) | 172 |
| Pension indexation (v) | 381 | 218 |
| Promotional and seniority increases (vi) | 223 | 999 |
| Economic salary increases (vii) | 43 | 321 |
| YMPE and MPE increases | 0 | 16 |
| Outstanding payments | 5 | (36) |
| Pension benefit division | 6 | 52 |
| Administrative expenses | 17 | (13) |
| Miscellaneous | 338 | (329) |
| Experience Gains and (Losses) | 327 | 1,479 |
-
The net impact of the demographic experience increased the Superannuation Account liability by $593 million and the Pension Fund liability by $1,076 million. The increases in liability were largely due to
- higher than expected number of retirements;
- higher transfer values paid upon termination of active members;
- mortality experience was different than expected, resulting in a loss.
-
The rates of interest credited to the Superannuation Account were in aggregate smaller than the corresponding projected Account yields in the previous valuation resulting in an experience loss of $56 million.
The return realized on the Pension Fund for plan years 2018 to 2020 were 9.8%, 7.1% and -0.6% versus the expected returns of 4.7%, 5.1%, and 5.5%, respectively. Consequently, the Pension Fund experienced an investment gain of $583 million over the three‑year intervaluation period.
-
Unexpected revised credited service resulted in a decrease of $2 million in the Superannuation Account shortfall. Lower than anticipated part-time service and service buyback contributions resulted in an increase of $571 million in the Pension Fund surplus.
-
Higher than anticipated pension payments resulted in an increase of $39 million in the Superannuation Account shortfall, while lower than anticipated pension payments resulted in an increase of $172 million in the Pension Fund surplus.
-
The pension benefit indexation rates for the period from January 2018 to January 2020 were, in aggregate, 0.6% lower than the projected pension indexation, resulting in a $381 million decrease in the Superannuation Account liability and a $218 million decrease in the Pension Fund liability.
-
Lower than expected promotional salary increases resulted in a decrease of $223 million in the Superannuation Account liability and a decrease of $999 million in the Pension Fund liability.
-
Lower than anticipated economic salary increases resulted in a decrease of $43 million in the Superannuation Account liability and a decrease of $321 million in the Pension Fund liability.
2.2.7 Revision of Actuarial Assumptions
Actuarial assumptions were revised based on economic trends and demographic experience as described in Appendices F to I. These revisions have increased the Superannuation Account shortfall by $7,598 million and decreased the Pension Fund surplus by $3,400 million. The impact of these revisions is shown in Table 13 with the most significant items discussed thereafter.
| Assumptions | Superannuation Account |
Pension Fund |
|---|---|---|
| Economic assumptions | ||
| Yields and Rates of return | (7,304) | (4,921) |
| Increase in average pensionable earnings | 108 | 2,120 |
| Pension indexation | (56) | (48) |
| Total | (7,252) | (2,849) |
| Demographic assumptions | ||
| Withdrawals | (8) | (91) |
| Pensionable retirements | (45) | (20) |
| Disabled retirements | (3) | 11 |
| Healthy pensioner and contributor mortality rates | (656) | (718) |
| Disabled pensioner mortality rates | 26 | 15 |
| Spouse mortality rates | (56) | (42) |
| Proportion married at death of member | 163 | 105 |
| Promotional salary increases | 8 | 104 |
| Spouse Age difference | 225 | 49 |
| Proportion of Member Electing for deferred pension | 0 | 11 |
| Other items | 0 | 25 |
| Total | (346) | (551) |
| Net impact of revision | (7,598) | (3,400) |
The net impact of the revision of the assumptions is largely attributable to the changes in economic assumptions.
The following revisions were made to the economic assumptions used in the previous report:
- ultimate real rate of return on the Pension Fund decreased from 4.0% to 3.9%;
- ultimate real projected yield on the Superannuation Account was decreased from 2.7% to 2.1%;
- ultimate real increases in YMPE and MPE were decreased from 1.1% to 1.0%; and
- ultimate real increase in average pensionable earnings decreased from 0.8% to 0.7%.
Details of the changes in economic assumptions are described in Appendix F.
The main revision to the demographic assumptions is a change to the mortality improvement rates. Details of the changes in demographic assumptions are described in Appendix G.
2.2.8 Change in the Present Value of Administrative Expenses
The previous report annual administrative expense assumption of 0.45% of total pensionable payroll decreased to 0.40% in this report. This decrease is based on an analysis of the trend in administrative expenses charged to both the Superannuation Account and the Pension Fund over the last three years.
For plan year 2021, 44% of total administrative expenses are being charged to the Superannuation Account; it is assumed that the proportion charged to the Superannuation Account will reduce at the rate of 2.0% per year as in the previous report. These changes in the annual administrative expenses resulted in an decrease of $181 million of the Superannuation Account shortfall as at 31 March 2020.
2.2.9 Change in the Present Value of Prior Service Contributions
New members’ prior service election paid through instalments since the last report and changes to payment schedules for some members resulted in a change in the present value of prior service contributions. This change increased the Superannuation Account shortfall by $1 million and the Pension Fund surplus by $105 million.
2.2.10 Unrecognized Investment Gains
An actuarial asset valuation method that minimizes the impact of short-term fluctuations in the market value of assets was also used for this valuation. This method, which is described in Section E.1, resulted in an actuarial value of assets that is $1,248 million more than the market value of the Pension Fund assets as at 31 March 2020.
2.3 PSSA - Cost Certificate
2.3.1 Current Service Cost
The details of the current service cost for plan year 2022 and reconciliation with the 2019 current service cost are shown below.
| Member required contributions | 2,675 |
|---|---|
| Government current service cost | 2,701 |
| Total current service cost | 5,376 |
| Expected pensionable payroll | 27,332 |
| Total current service cost as % of expected pensionable payroll | 19.67% |
| For plan year 2019 | 20.16 |
|---|---|
| Expected current service cost change | (0.47) |
| Change in methodology | (0.20) |
| Change in demographics | (0.47) |
| Changes in assumptions | |
| Economic assumptions | 0.47 |
| Demographic assumptions | 0.18 |
| For plan year 2022 | 19.67 |
2.3.2 Projection of Current Service Costs
The current service cost is borne jointly by the plan members and the government. Group 1 and Group 2 member contribution rates are determined such that the government share of the current service cost contribution is 50%. They are determined on a calendar year basis and are shown in Table 2.
Current service costs on a plan year basis, expressed in dollar amount as well as in percentage of the projected pensionable payroll, are shown in Table 16.
| Plan Year | $ Millions | Percentage of Pensionable Payroll | Portion Borne by the GovernmentTable 16 footnote 1 |
||||
|---|---|---|---|---|---|---|---|
| Contributors | Government | Total | Contributors | Government | Total | ||
| 2022 | 2,675 | 2,701 | 5,376 | 9.79% | 9.88% | 19.67% | 50.23% |
| 2023 | 2,778 | 2,807 | 5,585 | 9.73% | 9.83% | 19.56% | 50.26% |
| 2024 | 2,874 | 2,904 | 5,778 | 9.67% | 9.77% | 19.44% | 50.26% |
| 2025 | 2,971 | 3,003 | 5,974 | 9.63% | 9.74% | 19.37% | 50.28% |
Table 16 footnote
|
|||||||
2.3.3 Administrative Expenses
The Pension Fund administrative expenses are included in the total current service costs and are estimated to be as follows.
| Plan Year | ($ millions) |
|---|---|
| 2022 | 68 |
| 2023 | 74 |
| 2024 | 79 |
| 2025 | 84 |
The Superannuation Account administrative expenses have been capitalized and are shown as a liability in the balance sheet.
2.3.4 Contributions for Prior Service Elections
Member and government contributions for prior service elections were estimated as follows:
| Plan Year | Superannuation Account | Pension Fund | ||
|---|---|---|---|---|
| Contributors | Government | Contributors | Government | |
| 2022 | 2 | 2 | 97 | 71 |
| 2023 | 2 | 1 | 95 | 67 |
| 2024 | 1 | 1 | 93 | 63 |
| 2025 | 1 | 1 | 92 | 59 |
2.4 Sensitivity of Valuation Results to Assumptions
The information required by statute, which is presented in the main report, has been derived using best‑estimate assumptions regarding future demographic and economic trends. The key best‑estimate assumptions, i.e. those for which changes within a reasonable range have the most significant impact on the long-term financial results, are described in Appendices F and G. Given the length of the projection period and the number of assumptions required, it is unlikely that the actual experience will develop precisely in accordance with the best‑estimate assumptions. Individual sensitivity tests have been performed, projecting the pension plan’s financial status using alternative assumptions.
This valuation assumes that the current mortality rates applicable to members of the PSPP will improve over time in line with the mortality improvement assumption contained in the 30th Actuarial Report on the Canada Pension Plan. Table 19 presents the effect of varying the mortality improvement assumption on the plan year 2021 current service cost and the liabilities for the Superannuation Account and the Pension Fund. The best-estimate mortality improvement assumption is described in Table 61 of Appendix G.
| Mortality Improvement Rates | Current Service Cost as a percentage of pensionable payroll |
Actuarial Liability ($ millions) | Age 65 Life Expectancy in 2020 | |||||
|---|---|---|---|---|---|---|---|---|
| Superannuation Account |
Pension Fund | |||||||
| Male | Female | |||||||
| 2022 | Effect | Effect | Effect | |||||
| Best-estimate basis | 19.67 | None | 98,837 | None | 110,909 | None | 22.9 | 24.6 |
| - if 0% | 18.94 | (0.73) | 95,606 | (3,231) | 107,313 | (3,596) | 21.5 | 23.3 |
| - if ultimate 50% higher | 19.82 | 0.15 | 99,126 | 289 | 111,503 | 594 | 23.1 | 24.8 |
| - if ultimate 50% lower | 19.51 | (0.16) | 98,551 | (286) | 110,313 | (596) | 22.6 | 24.5 |
| - if kept at 2021 level | 20.23 | 0.56 | 100,677 | 1,840 | 113,413 | 2,504 | 23.9 | 25.4 |
Table 20 shows the effect on the plan year 2022 current service cost and the liabilities for the Superannuation Account and the Pension Fund when key economic assumptions are varied by one percentage point per annum.
| Assumption(s) Varied | Current Service Cost (%) | Actuarial Liability ($ millions) | ||||
|---|---|---|---|---|---|---|
| Superannuation Account | Pension Fund | |||||
| 2022 | Effect | Effect | Effect | |||
| None (i.e. current basis) | 19.67 | None | 98,837 | None | 110,909 | None |
| Investment yield/return | ||||||
| - if 1% higher | 15.80 | (3.87) | 88,204 | (10,633) | 93,866 | (17,043) |
| - if 1% lower | 25.03 | 5.36 | 111,769 | 12,932 | 133,072 | 22,163 |
| Pension indexation | ||||||
| - if 1% higher | 21.97 | 2.30 | 110,989 | 12,152 | 124,634 | 13,725 |
| - if 1% lower | 17.71 | (1.96) | 88,599 | (10,238) | 99,267 | (11,642) |
| Salary, YMPE and MPE | ||||||
| - if 1% higher | 21.53 | 1.86 | 98,990 | 153 | 115,933 | 5,024 |
| - if 1% lower | 18.10 | (1.57) | 98,703 | (134) | 106,523 | (4,386) |
| InflationTable 20 footnote 1 | ||||||
| - if 1% higher | 19.21 | (0.46) | 98,433 | (404) | 109,463 | (1,446) |
| - if 1% lower | 20.15 | 0.48 | 99,263 | 426 | 112,410 | 1,501 |
Table 20 footnote
|
||||||
The differences between the results above and those shown in the valuation can also serve as a basis for approximating the effect of other numerical variations in one of a key assumptions to the extent that such effects are assumed to be linear.
2.5 RCA - Financial Position
This section shows the financial position of the RCA accounts as at 31 March 2020. The results of the previous valuation are also shown for comparison.
| 31 March 2020 | 31 March 2017 | |
|---|---|---|
| RCA No. 1 recorded account balance | 1,315 | 1,193 |
| Refundable tax | 1,297 | 1,184 |
| Present value of prior service contributions | 3 | 2 |
| Total | 2,615 | 2,379 |
| Actuarial Liability | ||
| Pensionable excess earnings | ||
| • Active contributors | 689 | 592 |
| • Pensioners | 1,003 | 666 |
| Survivor Allowance | ||
| • Active contributors | 99 | 97 |
| • Pensioners | 363 | 228 |
| Former deputy heads | 38 | 35 |
| Total Actuarial Liability | 2,192 | 1,618 |
| Actuarial Excess/(Shortfall) | 423 | 761 |
The sum of the recorded balance of the RCA No. 1 Account, the refundable tax and the present value of prior service cost contributions as at 31 March 2020 is $2,615 million, which exceeds the actuarial liability of $2,192 million by $423 million.
| 31 March 2020 | 31 March 2017 | |
|---|---|---|
| RCA No. 2 Recorded Account Balance | 628 | 718 |
| Refundable tax | 644 | 731 |
| Total | 1,272 | 1,449 |
| Actuarial Liability | 1,142 | 1,208 |
| Actuarial Excess/(Shortfall) | 130 | 241 |
Since the previous valuation, the actuarial excess of the RCA No. 2 Account reduced from $241 million to $130 million.
2.6 RCA No. 1 Current Service Cost
The projected current service cost, which is borne jointly by the members and the government, decreased by 0.05% to 0.18% of pensionable payroll in this valuation for plan year 2022 from 0.23% of pensionable payroll calculated in the previous actuarial report.
The RCA No. 1 current service cost is estimated to be 0.18% of pensionable payroll for plan year 2022 to 2025.
Table 23 shows the estimated RCA No. 1 current service cost for the next four plan years.
| Plan Year | ||||
|---|---|---|---|---|
| 2022 | 2023 | 2024 | 2025 | |
| Total current service cost | ||||
| Pensionable excess earnings | 34.1 | 33.3 | 32.2 | 30.8 |
| Survivor allowance | 11.5 | 12.3 | 12.9 | 13.6 |
| Total | 45.7 | 45.7 | 45.2 | 44.4 |
| Member contributions | ||||
| Pensionable excess earnings | 7.9 | 6.8 | 7.4 | 8.0 |
| Total | 7.9 | 6.8 | 7.4 | 8.0 |
| Government current service cost | 37.8 | 38.9 | 37.8 | 36.4 |
The current service cost for former deputy heads is negligeable for years 2022 to 2025, due to the very low number of active members.
2.7 Summary of Estimated Government Costs
Table 24 summarizes the estimated total government credits for the RCA No. 1 and the Superannuation Account on a plan year basis. Table 25 summarizes the estimated total government costs for the Pension Fund on a plan year basis.
| Plan Year | RCA No. 1 | Superannuation Account | Total Government Credits | |
|---|---|---|---|---|
| Current Service Cost | Total Prior Service Contributions | Expected Special Credits | ||
| 2022 | 38 | 2 | 7,805 | 7,845 |
| 2023 | 39 | 1 | 0 | 40 |
| 2024 | 38 | 1 | 0 | 39 |
| 2025 | 36 | 1 | 0 | 37 |
| Plan Year | Current Service Cost | Total Prior Service Contributions | Total Government Cost |
|---|---|---|---|
| 2022 | 2,701 | 71 | 2,772 |
| 2023 | 2,807 | 95 | 2,902 |
| 2024 | 2,904 | 93 | 2,997 |
| 2025 | 3,003 | 92 | 3,095 |
3. Actuarial Opinion
In our opinion, considering that this report was prepared pursuant to the Public Pensions Reporting Act,
- the valuation data on which the valuation is based are sufficient and reliable for the purposes of the valuation;
- the assumptions used are individually reasonable and appropriate in aggregate for the purposes of the valuation; and
- the methods employed are appropriate for the purposes of the valuation.
This report has been prepared, and our opinion given, in accordance with accepted actuarial practice in Canada. In particular, this report was prepared in accordance with the Standards of Practice (General Standards and Practice - Practice-Specific Standards for Pension Plans) published by the Canadian Institute of Actuaries.
We have reflected the impacts of the COVID-19 pandemic on the economic assumptions used in this report. It is important to note that the pandemic is a very fluid situation that will likely continue to evolve for some time. We have estimated the impacts based on the information known at the time the report was prepared. The final impacts of this health and economic crisis will likely generate some differences in the future.
To the best of our knowledge, after discussion with Public Services and Procurement Canada and the Treasury Board of Canada Secretariat, there were no subsequent events between the valuation date and the date of this report that would have a material impact on the results of this valuation.
Assia Billig, FCIA, FSA
Chief Actuary
Laurence Frappier, FCIA, FSA
Véronique Ménard, FCIA, FSA
Ottawa (Canada)
29 September 2021
Appendix A - Summary of Pension Benefit Provisions
The government has been providing its employees with a pension plan since 1870. Pensions for members of the Public Service are provided primarily under the Public Service Superannuation Act (PSSA) as enacted in 1954 and modified thereafter. Benefits are also provided to public servants under the Special Retirement Arrangements Act. Benefits may be modified in accordance with the Pension Benefits Division Act if there is a breakdown of a spousal union.
Changes Since the Last Valuation
The Public Service Superannuation Actwas amended by Bill C-97 which received Royal Assent on 21 June 2019. The amendment modified the rule regarding the non-permitted surplus, increasing the permitted surplus from 10% to 25% of liabilities.
Other minor amendments applied to the PSSA and the Public Service Superannuation Regulations since the previous valuation. Those modifications did not have any impact on the actuarial valuation of the plan.
Summary of Pension Benefit Provisions
Summarized in this Appendix are the pension benefits provided under the PSSA registered provisions, which are in compliance with the Income Tax Act. The portion of the benefits in excess of the Income Tax Act limits for registered pension plans is provided under the retirement compensation arrangements described in Appendix B.
In case of any discrepancy between this summary and the legislation, the legislation shall prevail.
A.1 Membership
Subject to the exceptions mentioned in the next paragraph, membership in the plan is compulsory for all full‑time and part-time employees working 12 or more hours per week (except those who were grandfathered as at 4 July 1994) in the Public Service. This includes all positions in any department or portion of:
- the Executive Government of Canada;
- the Senate and the House of Commons;
- the Library of Parliament; and
- any board, commission or corporation listed in a Schedule to the Act, as well as those designated as contributors by the President of the Treasury Board either individually or as members of a class for persons engaged as seasonal employees and some others.
The main groups of persons employed in the Public Service to which the Act does not apply are:
- part-time employees working less than 12 hours per week;
- persons locally engaged outside Canada;
- employees of some Crown corporations, boards or commissions covered by their own pension plans; and
- seasonal employees, and some others, unless designated as contributors by the President of the Treasury Board.
Since the previous valuation, no entities have left the plan.
A.2 Contributions
A.2.1 Members
Different contribution rates apply to Group 1Footnote 10 and Group 2Footnote 11 contributors. The expected rates are consistent with the government objective of maintaining a 50:50 employer to employee current service cost sharing ratio.
During the first 35 years of pensionable service, members contribute according to the rates shown in the following table.
| Calendar year | Group 1 | Group 2 | ||
|---|---|---|---|---|
| Below YMPE | Above YMPE | Below YMPE | Above YMPE | |
| 2020Table 26 footnote 1 | 9.53% | 11.72% | 8.69% | 10.15% |
| 2021Table 26 footnote 2 | 9.83% | 12.26% | 8.89% | 10.59% |
| 2022 | 9.36% | 12.48% | 7.95% | 11.82% |
| 2023 | 9.35% | 12.37% | 7.93% | 11.72% |
| 2024 | 9.35% | 12.25% | 7.94% | 11.54% |
Table 26 footnotes
|
||||
The contribution rates shown after calendar year 2022 are estimates and subject to change.
After 35 years of pensionable service, members contribute only 1% of pensionable earnings.
In order to keep their rights to an early retirement benefit, deemed operational members of Correctional Service Canada (CSC) contribute 0.62% of total earnings during a calendar year in addition to the above contribution rates.
A.2.2 Government
A.2.2.1 Current Service
The government determines the normal monthly contribution as the amount which, when combined with the required contributions by members in respect of current service and expected interest earnings, is sufficient to cover the cost, as estimated by the President of the Treasury Board, of all future payable benefits that have accrued in respect of pensionable service during that month and the Pension Fund administrative expenses incurred during that month.
A.2.2.2 Elected Prior Service
The government matches member contributions made to the Superannuation Account for prior service elections; however, it makes no contributions if the member is paying the double rate.
Government contributions to the Pension Fund in respect of elected prior service are calculated using the same ratio of Government contributions to employee contributions as for the current service cost. For member paying the double rate, the government contributes only the excess of the ratio of Government contributions to employee contributions over 1.
A.2.2.3 Actuarial Excess and Surplus
The PSSA gives the government the authority to:
- debit the excess of the Superannuation Account over the actuarial liability subject to limitations, and
- deal with any actuarial surplus, subject to limitations, in the Pension Fund as they occur, either by
- reducing employer contributions or
- reducing employer and employee contributions or
- by making withdrawals.
A.2.2.4 Actuarial Shortfall and Deficit
In accordance with the PSSA, if either a Superannuation Account actuarial shortfall or a Pension Fund actuarial deficit is identified through a triennial statutory actuarial valuation, the actuarial shortfall/deficit can be amortized over a period of up to 15 years.
The President of the Treasury Board will determine the time, the manner and the amount of credits to be made. The shortfall/deficit must be fully paid by the end of the fifteenth fiscal year following the tabling of that report at the latest.
A.3 Summary Description of Benefits
The objective of the PSPP is to provide an employment earnings-related lifetime retirement pension to eligible members. Benefits to members in case of disability and to the spouse and children in case of death are also provided.
Subject to coordination with the pensions paid by the Canada Pension Plan (CPP) or the Québec Pension Plan (QPP), the initial rate of retirement pension is equal to 2% of the highest average of annual pensionable earnings over any period of five consecutive years, multiplied by the number of years of pensionable service not exceeding 35. Once in pay, the pension is indexed annually with the Consumer Price Index. Such indexation also applies to deferred pensions during the deferral period. Detailed notes on the following overview are provided in the following section.
| Contributor’s Type of Termination | Benefit |
|---|---|
| With less than two years of serviceTable footnote 1 | Return of contributions |
| With two or more years of serviceTable footnote 1; and | |
| Disability | Immediate annuity |
| Death leaving no surviving spouse or eligible children | Minimum benefit |
| Death leaving surviving spouse and/or eligible children | Survivor allowance(s) |
| Leaving prior to age 45, except for death or disability | |
| Actual operational service between 20 and 25 years | Actual operational service annual allowanceTable footnote 2 |
| Actual operational service 25 years or more | Immediate annuity |
| Otherwise | Deferred annuity or transfer value |
| Leaving at ages 45 to 49, except for death or disability, and | |
| Deemed operational service 20 years or more | Deemed operational service annual allowanceTable footnote 3 |
| Actual operational service between 20 and 25 years | Actual operational service annual allowanceTable footnote 2 |
| Actual operational service 25 years or more | Immediate annuity |
| Otherwise | Deferred annuity or transfer value |
| Leaving at age 50 or over, except for death or disability, and | |
| Deemed operational service between 20 and 25 years | Deemed operational service annual allowanceTable footnote 3 |
| Deemed operational service 25 years or more | Immediate annuity |
| Actual operational service between 20 and 25 years | Actual operational service annual allowanceTable footnote 2 |
| Actual operational service 25 years or more | Immediate annuity |
| Otherwise, but Group 1, age 60 or over, or age 55 or over and service 30 years or more | Immediate annuity |
| Otherwise, but Group 2, age 65 or over, or age 60 or over and service 30 years or more | Immediate annuity |
| Otherwise | Deferred annuity or annual allowance |
| Deferred and Immediate Pensioner’s Type of Termination | Benefit |
| Group 1 disability before age 60 while entitled to a deferred annuity or an annual allowance | Immediate annuity |
| Group 2 disability before age 65 while entitled to a deferred annuity or an annual allowance | Immediate annuity |
| Death leaving no eligible survivor | Minimum benefit |
| Death leaving eligible survivor(s) | Survivor allowance(s) |
Table footnotes
|
|
A.4 Explanatory Notes
A.4.1 Pensionable Earnings
Pensionable earnings means the annual employment earnings (excluding overtime but including pensionable allowances such as bilingual bonuses) of a contributor.
Pensionable payroll means the aggregate pensionable earnings of all contributors with less than 35 years of pensionable service.
A.4.2 Indexation
A.4.2.1 Level of Indexation Adjustments
All immediate and deferred annuities (pensions and allowances) are adjusted every January to the extent warranted by the increase, as at 30 September of the previous year, in the 12-month average Consumer Price Index relative to the corresponding figure one year earlier. If the indicated adjustment is negative, annuities are not decreased for that year; however, it is carried-forward and the next positive adjustment is diminished accordingly.
A.4.2.2 First Indexation Adjustment
Indexation adjustments accrue from the end of the month in which employment terminates. The first annual adjustment following termination of employment is prorated accordingly.
A.4.2.3 Commencement of Indexation Payments
The indexation portion of a retirement, disability or survivor pension normally starts being paid when the pension is put into pay. However, regarding an operational service retirement pension, indexation payments start only when the pensioner is either
- at least 55 years old, provided the sum of age and pensionable service is at least 85; or
- at least 60 years old.
A.4.3 Pensionable Service, Actual Operational Service and Deemed Operational Service
Pensionable service of a contributor includes any period of service in the Public Service for which the contributor has been required to contribute or has elected to contribute, if eligible to do so, and such other types of service for which the contributor has elected to make the required special contributions to the SuperannuationAccount or the Pension Fund. Pensionable service is limited to 35 years.
Actual operational service refers to CSC employees working in federal correctional facilities, parole offices and community correctional centres. More specifically, operational service is defined as service by a person employed by CSC whose principal place of work is not: the national headquarters or a regional headquarters of CSC; the offices of the CSC Commissioner; or a regional CSC Staff College or any other institution that provides similar training to CSC employees.
Deemed operational service refers to CSC employees in operational service for one or more periods totalling at least 10 years, who then cease to be engaged in operational service but continue to be employed by CSC and elect to continue to accumulate operational service and contribute an additional 0.62% of earnings.
A.4.4 Return of Contributions
Return of contributions means the payment of an amount equal to the accumulated current and prior service contributions paid or transferred by the contributor into the plan. Interest is credited quarterly on returned contributions in accordance with the investment return on the Pension Fund.
A.4.5 Immediate Annuity
Immediate annuity means an unreduced pension that becomes payable immediately upon a pensionable retirement or pensionable disability. The annual amount is equal to 2% of the highest average of annual pensionable earnings of the contributor over any period of fiveFootnote 12 consecutive years, multiplied by the number of years of pensionable service not exceeding 35. For contributors with periods of part-time pensionable service, earnings used in the five-year average are based on a full 37.5‑hour workweek but the resulting average is multiplied by the proportion of the actual workweek over a full workweek averaged by the contributor over the entire period of pensionable service.
When a pensioner attains age 65 or becomes entitled to a disability pension from the CPP or the QPP, the annual pension amount is reduced by a percentage of the indexed CPP annual pensionable earningsFootnote 13 (or, if lesser, the indexed five-yearFootnote 12 pensionable earnings average on which the immediate annuity is based), multiplied by the years of CPP pensionable serviceFootnote 14. The applicable percentage is 0.625%.
Annuities are payable at the end of month until the month in which the pensioner dies or until the disabled pensioner recovers from disability (the last payment would then be pro-rated). Upon the death of the pensioner, either a survivor allowance (Note A.4.13) or a residual death benefit (Note A.4.14) may be payable.
A.4.6 Deferred Annuity
Deferred annuity means an annuity that normally becomes payable to a former Group 1 contributor who reaches age 60 or a former Group 2 contributor who reaches age 65. The annual payment is determined as for an immediate annuity (Note A.4.5) but is also adjusted to reflect the indexation (Note A.4.2) from the date of termination to the commencement of benefit payments.
The deferred annuity of a former Group 1 contributor becomes an immediate annuity during any period of disability beginning before age 60. If the disability ceases before age 60, the immediate annuity reverts to the original deferred annuity unless the pensioner elects an annual allowance (Notes A.4.8, A.4.9, and A.4.10) that is the prescribed actuarial equivalent to the deferred annuity. Similarly, the deferred annuity of a former Group 2 contributor becomes an immediate annuity during any period of disability beginning before age 65, and reverts back to the original deferred annuity if the disability ceases before age 65, unless the pensioner elects an annual allowance as described above.
A.4.7 Transfer Value
A contributor who has ceased to be employed in the public service and has to his credit two or more years of pensionable service, is a Group 1 contributor and is under age 50, or is a Group 2 contributor and is under age 55, and is eligible for a deferred annuity may elect to transfer the commuted value of his benefit, determined in accordance with the regulations, to
- a locked-in Registered Retirement Savings Plan of the prescribed kind; or
- another pension plan registered under the Income Tax Act; or
- a financial institution for the purchase of a locked-in immediate or deferred annuity of the prescribed kind.
A.4.8 Annual Allowance For Members
For a Group 1 member, annual allowance means an annuity payable immediately on retirement or upon attaining age 50, if later. The amount of the allowance is equal to the amount of the deferred annuity to which the member would otherwise be entitled, reduced by 5% for each year between 60 and the age when the allowance becomes payable. However, if the member is at least 50 years old at termination, and has at least 25 years of pensionable serviceFootnote 15, then the difference is reduced (subject to the above as a maximum) to the greater of
- 55 minus the age, and
- 30 minus the number of years of pensionable serviceFootnote 15.
For a Group 2 member, the eligibility age is increased by 5 years, so that annual allowance means an annuity payable immediately on retirement or upon attaining age 55 if later. The amount of the allowance is equal to the amount of the deferred annuity to which the member would otherwise be entitled, reduced by 5% for each year between 65 and the age when the allowance becomes payable. However, if the member is at least 55 years old at termination, and has at least 25 years of pensionable serviceFootnote 15, then the difference is reduced (subject to the above as a maximum) to the greater of
- 60 minus the age, and
- 30 minus the number of years of pensionable serviceFootnote 15.
The Treasury Board can waive all or part of the reduction for Group 1 contributors who are involuntarily retired at ages 55 and over with at least 10 years of Public Service employment, or for Group 2 contributors who are involuntarily retired at ages 60 and over with at least 10 years of Public Service employment.
When a Group 1 member in receipt of an annual allowance becomes disabled before reaching age 60, or a Group 2 member in receipt of an annual allowance becomes disabled before reaching age 65, the annual allowance becomes an immediate annuity adjusted in accordance with the regulations to take into account the amount of any annual allowance received prior to becoming disabled.
A.4.9 Deemed Operational Service - Immediate Annuity and Annual Allowance
A deemed operational service immediate annuitydiffers from an immediate annuity (Note A.4.5) only in that it is available as early as age 50 with 25 years of operational service.
A deemed operational service annual allowance differs from an annual allowance (Note A.4.8) in two ways. Firstly it is available as early as age 45 with 20 years of operational service. Secondly the reduction factor is 5% multiplied by the greater of
- 50 minus the age, and
- 25 minus the years of operational service.
The foregoing operational service-related benefits are calculated in relation to both deemed and actual operational service only. Additional non-operational service results in the applicable non-operational benefit where any thresholds or reductions are based on total pensionable service, including operational service.
A.4.10 Actual Operational Service - Immediate Annuity and Annual Allowance
An actual operational service immediate annuitydiffers from an immediate annuity (Note A.4.5 and Note A.4.9) only in that it is available when the member has accrued 25 years of actual operational service.
An actual operational service annual allowance differs from other annual allowances (Note A.4.8 and Note A.4.9) in two ways. Firstly it is available as soon as 20 years of actual operational service is accrued. Secondly the reduction factor is 5% multiplied by
- 25 minus the years of actual operational service.
The foregoing operational service-related benefits are calculated in relation to actual operational service only. Additional non-operational service results in the applicable non-operational benefit where any thresholds or reductions are based on total pensionable service, including operational service. Also, additional deemed operational service results in the applicable deemed operational benefit where any thresholds or reductions are based on operational pensionable service.
A.4.11 Eligible Surviving Spouse
Eligible surviving spouse means the surviving spouse (includes a common-law or same‑sex partner recognized under the plan) of a contributor or pensioner except if:
- the contributor or pensioner died within one year of commencement of the spousal union, unless the Treasury Board is satisfied that the health of the contributor or pensioner at the time of such commencement justified an expectation of surviving for at least one year; or
- the pensioner married after ceasing to be a contributor, unless after such marriage the pensioner either:
- became a contributor again, or
- made an optional survivor benefit election within 12 months following marriage to accept a reduced pension so that the new spouse would be eligible for a survivor benefit. This reduction is reversed if and when the new spouse predeceases the pensioner or the spousal union is terminated for reason other than death.
A.4.12 Eligible Surviving Children
Eligible surviving children includes all children of the contributor or pensioner who are under age 18, and any child of the contributor or pensioner who is age 18 or over but under 25, in full-time attendance at a school or university, having been in such attendance substantially without interruption since he or she reached age 18 or the contributor or pensioner died, whichever occurred later.
A.4.13 Annual Allowance for Eligible Survivor(s)
Annual allowance means, for the eligible surviving spouse and children of a contributor or pensioner, an annuity that becomes payable immediately upon the death of that individual. The amount of the allowance is determined with reference to a basic allowance that is equal to 1% of the highest average of annual pensionable earnings of the contributor over five consecutive years, multiplied by the number of years of pensionable service not exceeding 35.
The annual allowance for a spouse is equal to the basic allowance unless the spouse became eligible as a result of an optional survivor benefit election, in which case it is equal to the percentage of the basic allowance specified by the pensioner making the election.
The annual allowance for an eligible surviving child is equal to 20% of the basic allowance, subject to a reduction if there are more than four eligible surviving children in the same family. The allowance otherwise payable to an eligible surviving child is doubled if there is no eligible surviving spouse.
Survivor annual allowances are not integrated with the CPP or the QPP and are payable in equal monthly instalments in arrears until the end of the month in which the survivor dies or otherwise loses eligibility. If applicable, a residual benefit (Note A.4.14) is payable to the estate upon the death of the last survivor.
A.4.14 Minimum and Residual Death Benefits
If a contributor or a pensioner dies leaving no eligible survivor, the lump sum normally paid is the excess of five times the annual amount of the immediate annuity to which the contributor would have been entitled, or the pensioner was entitled, at the time of death, less any pension payments already received. Indexation adjustments are excluded from these calculations.
The same formula is used to determine the residual death benefit, which is the lump sum payable upon the death of an eligible survivor but also subtracting all amounts (excluding indexation adjustments) already paid to the survivor.
A.4.15 Division of Pension with Former Spouse
In accordance with the Pension Benefits Division Act, upon the breakdown of a spousal union (including common-law), a lump sum can be debited by court order or by mutual consent from the accounts and/or the Pension Fund, as the case may be, to the credit of the former spouse of a contributor or pensioner. The maximum transferable amount is half the value, calculated as at the transfer date, of the retirement pension accrued by the contributor or pensioner during the period of cohabitation. If the member’s benefits are not vested, the maximum transferable amount corresponds to half the member’s contributions made during the period subject to division, accumulated with interest at the rate applicable on a refund of contributions. The accrued benefits of the contributor or pensioner are then reduced accordingly.
Appendix B - Retirement Compensation Arrangement Benefit Provisions
Retirement compensation arrangements (RCAs) are arrangements for benefits in excess of benefit limitations of registered pension plans and therefore are less tax-advantageous as the fund must transfer a 50% refundable tax to the Canada Revenue Agency (CRA) immediately. Under the PSSA RCA a debit is made from the RCA Account such that in total roughly half the recorded balance in the RCA Account is held as a tax credit (CRA refundable tax). This Appendix describes the Public Service pension benefits financed through retirement compensation arrangements (RCA No. 1 and RCA No. 2) rather than through the registered PSSA provisions that have a material impact on this valuation
Effective 15 December 1994, RCA No. 1 was established pursuant to the Special Retirement Arrangements Act (SRAA) to provide for all pension benefits in excess of those that may, in accordance with the Income Tax Act (ITA) restrictions on registered pension plans, be paid under the PSSA registered provisions.
Effective 1 April 1995, RCA No. 2 was established by the RCA regulations as a program for certain Public Service employees declared surplus before 1 April 1998 as part of the downsizing initiative. Participation was limited to individuals between ages 50 and 54 who met the conditions specified in the regulations. RCA No. 2 pays the difference between a pension unreduced for early retirement and the reduced pension payable in accordance with the PSSA. It is financed entirely by the government.
The following benefits have been provided under RCA No. 1 since 20 November 1997, unless otherwise indicated, to the extent that they are in excess of the ITA limit.
| Benefit | PSSA Registered Provisions limit |
|---|---|
| Survivor allowance for service from 1 January 1992 onward (see Note A.4.13 of Appendix A) |
Pre‑retirement death
Post‑retirement death The amount of spouse allowance is limited in any year to a maximum of two-thirds the retirement benefit that would have been payable to the member in that year. |
| Minimum lump sum death benefit (see Note A.4.14 of Appendix A) |
Pre‑retirement death The amount of pre‑retirement death benefit if the member has no eligible dependants is limited to the greater of the member contributions with interest and the present value of the member’s accrued benefits on the day prior to death. Post‑retirement death If the member has no eligible dependants at retirement, then the minimum death benefit is limited to the member contributions with interest. |
| Continued benefit accrual for former deputy heads (provided since 15 December 1994 for service since then) |
This entire benefit is outside the registered plan limit. Deputy heads ceasing employment under age 60 may elect to be deemed full-time employees absent from the Public Service on leave without pay up to age 60. |
| Elective service for service prior to 1 January 1990 |
The amount of lifetime retirement benefits for each such year of service is limited to two-thirds of the defined benefit limit (i.e. $3,245.56 for calendar year 2021) for the year in which the lifetime retirement benefits commence to be paid. For years subsequent to the commencement year of lifetime retirement benefits, this amount can be adjusted to reflect increases in the Consumer Price Index. |
| Excess pensionable earnings (provided since 15 December 1994 for service since then) |
The highest average of pensionable earnings is subject to a prescribed yearly maximum that varies by calendar year and the registered plan’s benefit formula. The calendar year 2021 Maximum Pensionable Earnings is $181,600. |
Appendix C - Assets, Accounts and Rates of Return
C.1 Assets and Account Balances
The government has a statutory obligation to fulfill the pension promise enacted by legislation to members of the Public Service. Since 1 April 2000, the government has earmarked invested assets (the Pension Fund) to meet the cost of pension benefits.
With respect to the unfunded portion of the PSPP, accounts were established to track the government’s pension benefit obligations, such as the Superannuation Account for service prior to 1 April 2000, and the RCA No. 1 and No. 2 Accounts for benefits in excess of those that can be provided under the Income Tax Act limits for registered pension plans.
C.1.1 Public Service Superannuation Account
PSSA member contributions, government costs and benefits earned up to 31 March 2000 are tracked entirely through the Public Service Superannuation Account, which forms part of the Accounts of Canada.
The Superannuation Account is credited with all PSSA member contributions and government costs prior to 1 April 2000, as well as with prior service contributions and costs for elections made prior to 1 April 2000 and for periods before 1 April 2000 but credited after that date. It is charged with both the benefit payments made in respect of service earned under the Superannuation Account and the allocated portion of the plan administrative expenses.
The Superannuation Account is credited with interest earnings as though net cash flows were invested quarterly in 20‑year Government of Canada bonds issued at prescribedFootnote 16 interest rates and held to maturity. No formal debt instrument is issued to the Superannuation Account by the government in recognition of the amounts therein. Interest is credited every three months on the basis of the average yield for the same period on the combined Superannuation Accounts of the Public Service, Canadian Forces and RCMP pension plans.
| Plan Year | 2018 | 2019 | 2020 | 2018-2020 | |
|---|---|---|---|---|---|
| Opening balance as at 1 April of the previous year | 94,209 | 92,536 | 93,700 | 94,209 | |
| INCOME | |||||
| Interest earnings | 3,830 | 3,593 | 3,411 | 10,834 | |
| Employer contributions | 7 | 5 | 3 | 15 | |
| Member contributions | 8 | 6 | 4 | 18 | |
| Transfers received | - | 1 | - | 1 | |
| Actuarial liability adjustments | - | 3,107 | - | 3,107 | |
| Subtotal | 3,845 | 6,712 | 3,418 | 13,975 | |
| EXPENDITURES | |||||
| Annuities | 5,413 | 5,456 | 5,512 | 16,381 | |
| Pension divisions | 17 | 17 | 14 | 48 | |
| Return of contributions | - | - | - | - | |
| Pension transfer value payments | 13 | 10 | 12 | 35 | |
| Transfers to other pension plans | 4 | 4 | 3 | 11 | |
| Minimum benefits | 16 | 15 | 14 | 45 | |
| Administrative expenses | 55 | 46 | 47 | 148 | |
| Subtotal | 5,518 | 5,548 | 5,602 | 16,668 | |
| Closing balance as at 31 March of the plan year | 92,536 | 93,700 | 91,516 | 91,516 | |
Since the last valuation, the Account balance has decreased by $2.7 billion (a 2.9% reduction) to reach $91.5 billion as at 31 March 2020.
C.1.2 Public Service Pension Fund
Since 1 April 2000, PSSA contributions (except for prior service elections made prior to 1 April 2000) have been credited to the Pension Fund. The Pension Fund is invested in the financial markets with a view to achieving maximum rates of return without undue risk.
The Pension Fund has been credited with all PSSA contributions since 1 April 2000, as well as with prior service contributions in respect of elections made since that date. The Pension Fund is also credited with the net investment returns generated by the capital assets managed by PSPIB. It is debited with both the benefit payments made in respect of service earned and prior service elections made since 1 April 2000 and the allocated portion of the plan administrative expenses.
| Plan Year | 2018 | 2019 | 2020 | 2018-2020 |
|---|---|---|---|---|
| Opening balance as at 1 April of the previous year | 98,770 | 111,381 | 121,991 | 98,770 |
| INCOME | ||||
| Investment earnings | 9,805 | 8,070 | (763) | 17,112 |
| Employer contributions | 2,371 | 2,571 | 2,579 | 7,521 |
| Member contributions | 2,414 | 2,627 | 2,656 | 7,697 |
| Transfers received | 51 | 56 | 67 | 174 |
| Actuarial liability adjustments | 340 | - | - | 340 |
| Subtotal | 14,981 | 13,324 | 4,539 | 32,844 |
| EXPENDITURES | ||||
| Annuities | 2,002 | 2,255 | 2,529 | 6,786 |
| Pension divisions | 36 | 42 | 39 | 117 |
| Return of contributions | 15 | 16 | 19 | 50 |
| Pension transfer value payments | 219 | 288 | 388 | 895 |
| Transfers to other pension plans | 37 | 42 | 48 | 127 |
| Minimum benefits | 15 | 19 | 18 | 52 |
| Administrative expenses | 46 | 52 | 56 | 154 |
| Subtotal | 2,370 | 2,714 | 3,097 | 8,181 |
| Closing balance as at 31 March of the plan year | 111,381 | 121,991 | 123,433 | 123,433 |
Since the last valuation, the Pension Fund balance has increased by $24.7 billion (a 25.0% increase) to reach $123.4 billion as at 31 March 2020.
C.1.3 Public Service RCA No. 1 Account
The amount in the RCA No. 1 Account is composed of the recorded balance in the Retirement Compensation Arrangements Account, which forms part of the Accounts of Canada, and a tax credit (CRA refundable tax). Each calendar year, a debit/credit is made from the RCA Account such that in total roughly half the recorded balance in the RCA Account is held as a tax credit (CRA refundable tax).
No formal debt instrument is issued to the RCA No. 1 Account by the government in recognition of the amounts therein. Interest earnings are credited every three months on the basis of the average yield for the same period on the combined Superannuation Accounts of the Public Service, Canadian Forces and RCMP pension plans.
| Plan Year | 2018 | 2019 | 2020 | 2018-2020 |
|---|---|---|---|---|
| Opening balance as at 1 April of the previous year | 1,193 | 1,241 | 1,266 | 1,193 |
| INCOME | ||||
| Interest earnings | 0 | 0 | 0 | 0 |
| Employer contributions | 84 | 41 | 75 | 200 |
| Member contributions | 12 | 14 | 21 | 47 |
| Transfers received | 0 | 0 | 0 | 0 |
| Actuarial liability adjustments | 50 | 49 | 47 | 146 |
| Subtotal | 146 | 104 | 143 | 393 |
| EXPENDITURES | ||||
| Annuities | 45 | 49 | 57 | 151 |
| Pension divisions | 0 | 1 | 0 | 1 |
| Return of contributions | 0 | 0 | 0 | 0 |
| Pension transfer value payments | 1 | 1 | 2 | 4 |
| Transfers to other pension plans | 1 | 0 | 1 | 2 |
| Minimum benefits | 0 | 0 | 0 | 0 |
| Amount transfer to CRA | 51 | 28 | 34 | 113 |
| Subtotal | 98 | 79 | 94 | 271 |
| Closing balance as at 31 March of the plan year | 1,241 | 1,266 | 1,315 | 1,315 |
| CRA Refundable tax | 1,235 | 1,263 | 1,297 | 1,297 |
Since the last valuation, the RCA No. 1 Account balance has grown by $122 million (a 10.2% increase) to reach 1,315 million as at 31 March 2020 and the refundable tax has increased by $113 million (a 9.5% increase) to reach $1,297 million.
C.1.4 Public Service RCA No. 2 Account
The amount in the RCA No. 2 Account is composed of the recorded balance in the Retirement Compensation Arrangements Account, which forms part of the Accounts of Canada, and a tax credit (CRA refundable tax). Each calendar year, a debit/credit is made from the RCA Account such that in total roughly half the recorded balance in the RCA Account is held as a tax credit (CRA refundable tax).
No formal debt instrument is issued to the RCA No. 2 Account by the government in recognition of the amounts therein. Interest earnings are credited every three months on the basis of the average yield for the same period on the combined Superannuation Accounts of the Public Service, Canadian Forces and RCMP pension plans.
| Plan Year | 2018 | 2019 | 2020 | 2018-2020 |
|---|---|---|---|---|
| Opening balance as at 1 April of the previous year | 718 | 689 | 659 | 718 |
| INCOME | ||||
| Interest earnings | 29 | 26 | 23 | 78 |
| Actuarial liability adjustments | 0 | 0 | 0 | 0 |
| Subtotal | 29 | 26 | 23 | 78 |
| EXPENDITURES | ||||
| Annuities | 85 | 85 | 85 | 255 |
| Amount transfer to CRA | (27) | (29) | (30) | (86) |
| Subtotal | 58 | 56 | 55 | 169 |
| Closing balance as at 31 March of the plan year | 689 | 659 | 627 | 627 |
| CRA Refundable tax | 703 | 674 | 644 | 644 |
Since the last valuation, the RCA No. 2 Account balance has decreased by $91 million (a 12.7% reduction) to $627 million as at 31 March 2020 and the refundable tax has decreased by $87 million (an 11.8% reduction) to $644 million.
C.2 Rates of Interest (Return)
The interest earnings in respect of the Superannuation Account were calculated using the entries in Table 31, which are based on book values since the notional bonds are deemed to be held to maturity. The interest earnings were computed using the dollar-weighted approach and assume that cash flows occur in the middle of the plan year (except for actuarial liability adjustments, which occur on 31 March). The Pension Fund rates of return are those from the PSPIB Annual Report for the respective plan years.
| Plan Year | Superannuation Account | Pension Fund |
|---|---|---|
| 2018 | 4.2% | 9.8% |
| 2019 | 4.0% | 7.1% |
| 2020 | 3.7% | (0.6%) |
C.3 Sources of Asset Data
The Superannuation Account, the RCA No. 1 Account, the RCA No. 2 Account and the Pension Fund entries shown in Section C.1 above were taken from the Public Accounts of Canada and the financial statements of the Public Sector Pension Investment Board.
Appendix D - Membership Data
D.1 Sources of Membership Data
The valuation data required in respect of contributors (both active and non-active), pensioners and survivors are extracted from master computer files maintained by the Department of Public Services and Procurement Canada (PSPC).
The main valuation data file supplied by PSPC contained the historical status information on all members up to 31 March 2020.
D.2 Validation of Membership Data
We performed certain tests on internal consistency, as well as tests of consistency with the data used in the previous valuation, with respect to membership reconciliation, basic information (date of birth, date of hire, date of termination, gender, etc.), salary levels, and pensions to survivors and pensioners.
We assumed that members with unknown gender were 50% male and 50% female.
Based on the omission and discrepancies identified by these and other tests, appropriate adjustements were made to the basic data after consulting with the data provider.
D.3 Membership Data
A summary of the valuation data as at 31 March 2020 and reconciliations of contributors, pensioners and survivors during the intervaluation period are shown in Table 32 to Table 38. Detailed membership data upon which this valuation is based are shown in Appendix L.
| As at 31 March 2020 |
As at 31 March 2017 |
|
|---|---|---|
| ContributorsTable 32 footnote 1 | ||
| Number | 331,406 | 295,881 |
| Average Annual Earnings | $84,915 | $79,495 |
| Average Pensionable Service | 11.63 | 12.63 |
| Average Age | 44.39 | 44.58 |
| Retirement PensionersTable 32 footnote 2 | ||
| Number | 243,024 | 229,045 |
| Average Annual Pension | $31,502 | $29,399 |
| Average Age | 68.66 | 67.64 |
| Disabled Pensioners | ||
| Number | 15,513 | 15,159 |
| Average Annual Pension | $18,168 | $18,345 |
| Average Age | 64.73 | 64.10 |
| Surviving Spouses | ||
| Number | 47,677 | 49,206 |
| Average Annual Pension | $16,021 | $14,516 |
| Average Age | 79.62 | 78.89 |
| Surviving Children | ||
| Number | 1,159 | 1,068 |
| Average Annual Pension | $2,201 | $2,388 |
| Average Age | 13.29 | 14.42 |
Table 32 footnotes
|
||
| Participating and Accruing | Participating Non-Accruing | Total Participating |
Non-Participating Non-Accruing |
|||||
|---|---|---|---|---|---|---|---|---|
| Male | Female | Male | Female | Male | Female | Total | ||
| As at 31 March 2017 | 102,383 | 131,298 | 2,468 | 1,737 | 237,886 | 457 | 523 | 980 |
| Data corrections | (1,232) | (1,031) | 691 | 159 | (1,413) | 41 | 84 | 125 |
| New contributors | ||||||||
| Re-qualifying contributorsTable 33 footnote 1 | 168 | 326 | 2 | - | 496 | 44 | 85 | 129 |
| Rehired pensioners | 414 | 696 | 1 | - | 1,111 | 5 | 16 | 21 |
| Subtotal | 582 | 1,022 | 3 | - | 1,607 | 49 | 101 | 150 |
| Changes of | ||||||||
| Participating accruing | 103 | 235 | - | - | 338 | (103) | (235) | (338) |
| Participating non-accruing | (1,767) | (1,182) | 1,767 | 1,182 | - | - | - | - |
| Non-participating non-accruing | (378) | (414) | (52) | (13) | (857) | 430 | 427 | 857 |
| Subtotal | (2,042) | (1,361) | 1,715 | 1,169 | (519) | 327 | 192 | 519 |
| ROC or TVTable 33 footnote 2 | (1,308) | (1,481) | (68) | (5) | (2,862) | (28) | (42) | (70) |
| Pensionable terminations | ||||||||
| Disabled Pensioners | (506) | (1,242) | (22) | (6) | (1,776) | - | (1) | (1) |
| Deferred Retired Pensioners | (2,363) | (2,427) | (29) | (6) | (4,825) | (20) | (49) | (69) |
| Retired Pensioners in Pay | (9,397) | (12,316) | (1,626) | (1,532) | (24,871) | (219) | (188) | (407) |
| Death (no survivors) | (148) | (145) | (18) | (6) | (317) | (5) | (6) | (11) |
| Death (with survivors) | (284) | (246) | (27) | (9) | (566) | (13) | (3) | (16) |
| Subtotal | (12,698) | (16,376) | (1,722) | (1,559) | (32,355) | (257) | (247) | (504) |
| As at 31 March 2020 | 85,685 | 112,071 | 3,087 | 1,501 | 202,344 | 589 | 611 | 1,200 |
Table 33 footnotes
|
||||||||
| Participating and Accruing | Participating Non-Accruing | Total Participating |
Non-Participating Non-Accruing |
|||||
|---|---|---|---|---|---|---|---|---|
| Male | Female | Male | Female | Male | Female | Total | ||
| As at 31 March 2017 | 25,088 | 31,247 | 85 | 12 | 56,432 | 237 | 346 | 583 |
| Data corrections | 1,162 | 1,998 | 101 | 8 | 3,268 | 73 | 117 | 190 |
| New contributors | ||||||||
| New entrants | 35,672 | 46,796 | 182 | 26 | 82,675 | 436 | 622 | 1,058 |
| Rehired cash-out | 1,038 | 1,703 | 1 | 1 | 2,743 | 20 | 46 | 66 |
| Rehired pensioners | 150 | 242 | - | - | 392 | 2 | 5 | 7 |
| Subtotal | 36,860 | 48,741 | 183 | 27 | 85,810 | 458 | 673 | 1,131 |
| Changes of | ||||||||
| Participating accruing | 372 | 532 | - | - | 904 | (372) | (532) | (904) |
| Participating non-accruing | (207) | (20) | 209 | 20 | 2 | (2) | - | (2) |
| Non-participating non-accruing | (352) | (524) | (2) | - | (878) | 354 | 524 | 878 |
| Subtotal | (187) | (12) | 207 | 20 | 28 | (20) | (8) | (28) |
| ROC or TVTable 34 footnote 1 | (6,387) | (8,113) | (41) | (5) | (14,546) | (259) | (393) | (652) |
| Pensionable terminations | ||||||||
| Disabled Pensioners | (29) | (41) | - | - | (70) | - | - | - |
| Deferred Retired Pensioners | (1,623) | (1,891) | (2) | (1) | (3,517) | (19) | (40) | (59) |
| Retired Pensioners in Pay | (263) | (236) | (18) | (3) | (520) | (8) | (4) | (12) |
| Death (no survivors) | (58) | (48) | (1) | (1) | (108) | (1) | - | (1) |
| Death (with survivors) | (36) | (31) | - | - | (67) | - | - | - |
| Subtotal | (2,009) | (2,247) | (21) | (5) | (4,282) | (28) | (44) | (72) |
| As at 31 March 2020 | 54,526 | 71,613 | 514 | 57 | 126,710 | 461 | 691 | 1,152 |
Table 34 footnote
|
||||||||
| Deferred Retired Pensioners | Disabled Pensioners | Retired Pensioners in PayTable 35 footnote 1 | |||||||
|---|---|---|---|---|---|---|---|---|---|
| Male | Female | Total | Male | Female | Total | Male | Female | Total | |
| As at 31 March 2017 | 11,462 | 14,733 | 26,195 | 5,855 | 9,304 | 15,159 | 111,828 | 91,022 | 202,850 |
| Data corrections | (526) | (761) | (1,287) | (84) | 28 | (56) | (234) | (237) | (471) |
| New pensioners | 4,067 | 4,445 | 8,512 | 660 | 1,291 | 1,951 | 11,552 | 14,298 | 25,850 |
| Transfer status to | |||||||||
| Rehired | (513) | (875) | (1,388) | (1) | (3) | (4) | (58) | (81) | (139) |
| Disabled Pensioners | (13) | (29) | (42) | 13 | 29 | 42 | - | - | - |
| Retired Pensioners in Pay | (1,468) | (1,707) | (3,175) | - | - | - | 1,468 | 1,707 | 3,175 |
| Subtotal | (1,994) | (2,611) | (4,605) | 12 | 26 | 38 | 1,410 | 1,626 | 3,036 |
| Cash paid out | (1) | (2) | (3) | - | - | - | - | - | - |
| Death (no survivors) | (14) | (13) | (27) | (442) | (559) | (1,001) | (5,659) | (4,585) | (10,244) |
| Death (with survivors) | (11) | (7) | (18) | (392) | (186) | (578) | (5,608) | (1,156) | (6,764) |
| Subtotal | (26) | (22) | (48) | (834) | (745) | (1,579) | (11,267) | (5,741) | (17,008) |
| As at 31 March 2020 | 12,983 | 15,784 | 28,767 | 5,609 | 9,904 | 15,513 | 113,289 | 100,968 | 214,257 |
Table 35 footnote
|
|||||||||
| Widows | Widowers | Total | |
|---|---|---|---|
| As at 31 March 2017 | 42,950 | 6,256 | 49,206 |
| Data corrections | 288 | 76 | 364 |
| New from Contributors | 338 | 260 | 598 |
| New from Pensioners | 5,987 | 1,356 | 7,343 |
| Spouse deaths | (8,833) | (1,001) | (9,834) |
| As at 31 March 2020 | 40,730 | 6,947 | 47,677 |
| Children | Students | Total | |
|---|---|---|---|
| As at 31 March 2017 | 805 | 263 | 1,068 |
| Data corrections | 67 | 211 | 278 |
| New from Contributors | 283 | 90 | 373 |
| New from Pensioners | 57 | 49 | 106 |
| Termination of benefits | (227) | (439) | (666) |
| Eligible as student | (129) | 129 | - |
| As at 31 March 2020 | 856 | 303 | 1,159 |
| Male | Female | Total | |
|---|---|---|---|
| As at 31 March 2017 | 5,968 | 3,904 | 9,872 |
| Data corrections | (22) | (14) | (36) |
| Pensioner deaths | (394) | (197) | (591) |
| Rehired | - | - | - |
| As at 31 March 2020 | 5,552 | 3,693 | 9,245 |
Appendix E - PSSA Valuation Methodology
E.1 Plan Assets
E.1.1 Public Service Superannuation Account
The balance of the Superannuation Account forms part of the Accounts of Canada. The underlying notional bond portfolio described in Appendix C is shown at the book value.
The only other Superannuation Account-related amount consists of the discounted value of future member contributions and government credits in respect of prior service electionsFootnote 17. The discounted value of future member contributions and government credits was calculated using the projected Superannuation Account yields.
The present value of contributions, determined as at 31 March 2020 is $21 million.
E.1.2 Public Service Pension Fund
For valuation purposes, an adjusted market value method is used to determine the actuarial value of assets in respect of the Pension Fund. The method is unchanged from the previous valuation.
Under the adjusted market value method, the difference between the observed investment returns during a given plan year and the expected investment returns for that year based on the previous report assumptions, is recognized over five years at the rate of 20% per year. The actuarial value is then determined by applying a 10% corridor, such that the actuarial value of assets is within 10% of the market value of assets. The value produced by this method is related to the market value of the assets but is more stable than the market value.
The only other Pension Fund-related asset consists of the discounted value of future member and government contributions in respect of prior service electionsFootnote 17. The discounted value of future member and government contributions was calculated using the assumed rates of return on the Pension Fund.
The actuarial value of the assets, determined as at 31 March 2020 is $125,409 million and was determined as follows.
| Plan Year | 2016 | 2017 | 2018 | 2019 | 2020 | Total |
|---|---|---|---|---|---|---|
| Actual net investment return (A) | 583 | 11,012 | 9,805 | 8,070 | (763) | |
| Expected investment return (B) | 4,147 | 4,312 | 4,700 | 5,744 | 6,769 | |
| Investment gains (losses) (C = A-B) | (3,564) | 6,700 | 5,105 | 2,326 | (7,532) | |
| Unrecognized percentage (D) | 0% | 20% | 40% | 60% | 80% | |
| Unrecognized investment gains (losses) (CxD) | - | 1,340 | 2,042 | 1,396 | (6,026) | (1,248) |
| Market value as at 31 March 2020 | 123,433 | |||||
| Plus | ||||||
| Actuarial Smoothing Adjustment, before application of corridor | 1,248 | |||||
| Actuarial value as at 31 March 2020 (before application of corridor) | 124,681 | |||||
| Impact of application of corridorTable 39 footnote 1 | - | |||||
| Actuarial value as at 31 March 2020 (after application of corridor) | 124,681 | |||||
| Present value of prior service contributions | 728 | |||||
| Actuarial value as at 31 March 2020 | 125,409 | |||||
Table 39 footnote
|
||||||
E.2 Actuarial Cost Method
As benefits earned in respect of current service will not be payable for many years, the purpose of an actuarial cost method is to assign costs over the working lifetime of the members.
As in the previous valuation, the projected accrued benefit actuarial cost method (also known as the projected unit credit method) was used to determine the current service cost and actuarial liability. Consistent with this cost method, pensionable earnings are projected up to retirement using the assumed annual increases in pensionable earnings (including seniority and promotional increases). The yearly maximum salary cap and other benefit limits under the Income Tax Act described in Appendix B were taken into account to determine the benefits payable under the PSSA and those payable under the RCA No. 1.
E.2.1 Current Service Costs and Member Contribution Rates
Under the projected accrued benefit actuarial cost method, the current service cost, also called the normal cost, computed in respect of a given year is the sum of the value, discounted in accordance with the actuarial assumptions for the Pension Fund, of all future payable benefits considered to accrue in respect of that year of service. The Pension Fund administrative expenses are also included in the total current service cost.
Under this method, the current service cost for an individual member will increase each year as the member approaches retirement. However, all other things being equal, the current service cost for the total population, expressed as a percentage of total pensionable payroll, can be expected to remain stable as long as the average age and service of the total population remain constant. This is true to the extent that the plan population is mature and stable. For a given year, the government current service cost is the total current service cost reduced by the members contributions during the year.
Member contribution rates were determined such that the members and the government share the total current service at 50/50Footnote 18.
The current service costs for Group 1 and Group 2 were determined as follows:
-
the current service cost and member contribution rates were determined for Group 1 contributors based on the total Public Service population (i.e., Group 1 and Group 2 members) and on the benefits available to Group 1 members. The result effectively levels the current service cost of Group 1 contributors since members of Group 2 are treated as though they are entitled to pre-2013 retirement benefits;
-
an amount equal to the excess of the actual current service cost for Group 1 contributors over the average current service cost of the combined Group 1 and Group 2 population determined in i) above was determined;
-
the excess amount determined in ii) above was then added to the current service cost for Group 2, which was determined based on the Group 2 population and the benefits available to Group 2 contributors.
The Group 2 population is young and its average age is expected to increase until the group reaches a mature state. As such, the contributions rates are expected to increase over time. The impact of the transfer of cost calculated in step ii) is expected to reduce over time, as Group 2 population grows while Group 1 is closed. These two trends, which partially offset each other, help stabilizing Group 2 contribution rates.
The following adjustments were made given member contribution rates are effective on a calendar year basis:
-
valuation runs were performed as at 31 December 2019;
-
active member population was assumed to be the same at 31 December 2019 as at 31 March 2020, with salaries adjusted for 3 months; and
-
mortality decrements and expected rates of return were adjusted to be applied on a calendar year basis.
This modified cost method respects the fundamental attributes of the projected unit credit cost method and provides an appropriate allocation of the cost between Group 1 and Group 2 contributors.
E.2.2 Actuarial Liability
The actuarial liability with respect to contributors corresponds to the value, discounted in accordance with the actuarial assumptions, of all future payable benefits accrued as at the valuation date in respect of all previous service. For pensioners and survivors, the actuarial liability corresponds to the value, discounted in accordance with the actuarial assumptions, of future payable benefits.
E.2.3 Government Contributions
The recommended government contribution corresponds to the sum of:
-
the government current service cost;
-
the government contributions for prior service; and
-
as applicable, special credits/payments in respect of a shortfall/deficit or as the case may be, debits when an actuarial surplus exists.
E.2.4 Age and Service Determination
In the previous valuation, the Age Last methodology was applied to determine ages and services used for eligibility and decrements. Under this approach, age is the age at the most recent birthday and service is based on the member’s completed years of pensionable service.
In this valuation, the Age Nearest methodology is applied; age and service are determined by rounding the exact value to the nearest integer.
The change from Age Last to Age Nearest methodology mainly affects the timing of benefit eligibility and application of age and/or service-dependent decrements.
Appendix F - PSSA Economic Assumptions
As per the Funding Policy, all of the assumptions used in this report are best-estimate assumptions, i.e., they reflect our best judgement of the future long-term experience of the plan and do not include margins.
F.1 Inflation-Related Assumptions
F.1.1 Level of Inflation
Price increases, as measured by changes in the Consumer Price Index (CPI), tend to fluctuate from year to year. In 2016, the Bank of Canada and the Government renewed their commitment to keep inflation between 1% and 3% until the end of 2021. The Bank of Canada will renew its monetary policy framework in 2021. As a result of the COVID-19 pandemic, a slowdown in inflation is expected during plan year 2021. Based on economic forecasts, the CPI is expected to increase at a rate above 2% for the following two years and to revert to the Bank of Canada’s long-term target thereafter. It is assumed that the Bank of Canada will remain committed to meeting the mid-range 2% target. In this report, it is assumed that the level of inflation will increase from 0.7% in plan year 2021 to 2.3% in plan year 2022 and 2.2% in plan year 2023. The ultimate rate of 2.0% is reached in 2024. It is unchanged from the assumed rate in the previous valuation.
F.1.2 Increase in Pension Factor
The assumption in respect to the year’s pension indexing factor is required to account for indexation of pensions each January 1. It is derived by applying the indexation formula described in Appendix A, which relates to the assumed CPI increases over successive 12-month periods ending on September 30.
F.2 Employment Earnings Increases
F.2.1 Increase in the Year’s Maximum Pensionable Earnings (YMPE)
Since the benefit payable under the plan when a pensioner attains age 65Footnote 19 is calculated based on the YMPE, an assumption for the increase in the YMPE is required in the valuation process. The assumed increase in the YMPE for a given calendar year is derived, in accordance with the Canada Pension Plan, to correspond to the increase in the average weekly earnings (AWE), as calculated by Statistics Canada, over successive 12-month periods ending on 30 June. The AWE, and thus the YMPE, is deemed to include a component for seniority and promotional increases.
The YMPE is equal to $61,600 for calendar year 2021. It increased by 4.9% compared to 2020, which is the largest increase in YMPE since the early 1990s. The increase was the result of lower wage earners loosing employment in the first half of 2020 as a result of the COVID-19 pandemic. This resulted in a significant increase in AWE. Until employment levels for lower wage earners return to their pre-pandemic level, the AWE increase is expected to remain high. It is assumed that the 2022 YMPE will increase by 6.2%. Subsequent increases in the YMPE are assumed to be lower, as it is assumed that employment levels for lower wage earners gradually increase over time. Future increases in the YMPE correspond to the assumed realFootnote 20 increase in the AWE plus assumed increases in the CPI.
The real-wage differential (real increase in the AWE) is developed taking into account historical trends, a possible labour shortage, and an assumed moderate economic growth for Canada. After the initial disruption due to COVID-19, it is assumed to gradually converge to the ultimate assumption of 1.0% by 2027 (1.1% in the previous valuation). The ultimate real-wage differential assumption combined with the ultimate price increase assumption results in an assumed annual increase in nominal wages of 3.0% in 2027 and thereafter. Thus, the ultimate rate of increase for the YMPE is 3.0%.
F.2.2 Increase in Pensionable Earnings
Pensionable earnings are applicable to PSPP members only, whereas the YMPE applies to the general working population in Canada. In addition, increases in pensionable earnings are exclusive of seniority and promotional increases, which are considered as a separate demographic assumption. Increases up to plan year 2022 are based on current collective agreements. Subsequent increases are based on average increases over recent rounds of collective bargaining and are assumed to gradually converge to the ultimate level in 2029. Over the long term, the annual increase in pensionable earnings is assumed to be 0.3% lower than the corresponding increase in the YMPE (unchanged from the previous valuation). This correspond to an ultimate value of 2.7% in 2029 and theafter (2.8% in the previous valuation for plan year 2024 and thereafter).
F.2.3 Increase in Maximum Pensionable Earnings (MPE)
The maximum annual pension accrual of $3,092.22 for 2020 will increase to $3,245.56 for 2021, in accordance with Income Tax Regulations. Thereafter, the maximum annual pension accrual is assumed to increase in accordance with the assumed annual increase in the YMPE, which is the same as the assumed annual increase in the AWE.
The tax-related maximum pensionable earnings were derived from both the maximum annual pension accrual under a registered defined benefit plan and the YMPE. The MPE is equal to $181,600 for calendar year 2021.
F.3 Investment-Related Assumptions
F.3.1 New Money Rate
The new money rate is the nominal yield on 10-year-plus Government of Canada bonds and is set for each year in the projection period. The real yield on 10-year-plus federal bonds is equal to the new money rate less the assumed rate of inflation.
During the last quarter of plan year 2020, the emerging COVID-19 pandemic marked the beginning of a severe humanitarian and economic shock. Many governments enacted unprecedented measures to support families and workers, and central banks reacted swiftly to support the economy and stabilize financial markets. In Canada, the net effect was a decrease in both short-term and long-term interest rates during the early months of the pandemic. This economic shock occurred in a context where interest rates were already considered low by historical standards and where many were already contemplating the prospects of a “low-for-long” interest rates environment. Consequently, the new money rate is assumed to be lower than in the previous valuation.
The annual nominal yield on 10-year-plus federal bonds is assumed to be 1.2% in plan year 2021. Then it is projected to increase gradually to its ultimate level of 4.1% in plan year 2034. The assumed rates over the short-term (2021-2025) are consistent with the average of private sector forecasts and take into account the recent market conditions. The ultimate level of 4.1% is equivalent to an ultimate real rate of 2.1%. The ultimate real yield was assumed to be 2.7% in 2027 in the previous valuation. The real new money rates over the plan years 2021 to 2033 are on average 1.3% lower than those assumed in the previous valuation over the same period.
F.3.2 Projected Yields on Superannuation Account
The projected yields assumed for computing the present value of accrued benefits for service prior to 1 April 2000 and to be credited to the Superannuation Account are the projected annual yields on the combined book value of the Superannuation Accounts of the Public Service, Canadian Forces and RCMP pension plans.
The projected Account yields were determined by an iterative process involving the following:
- the combined notional bond portfolio of the three Superannuation Accounts as at the valuation date;
- the assumed future new money interest rates;
- the expected future benefits payable in respect of all pension entitlements accrued up to 31 March 2000;
- the expected future contributions for prior service elections made up to 31 March 2000; and
- the expected future administrative expenses,
taking into account that each quarterly interest credit to a Superannuation Account is calculated as if the principal at the beginning of a quarter remains unchanged during the quarter. The projected yield on the Account is 3.5% in plan year 2021. It is projected to reach a low of 2.4% in 2032 and to reach its ultimate value of 4.1% in 2052.
F.3.3 Rate of Return on the Pension Fund
The expected annual nominal rates of return on the Pension Fund are required for the computation of present values of benefits to determine the liability for service since 1 April 2000 and the current service cost. The following sections describe how the rates of return on the Pension Fund are determined.
F.3.3.1 Investment Strategy
Since 1 April 2000, government and employee contributions, net of benefit payments and administrative expenses, are invested in capital markets by the Public Sector Pension Investment Board (PSPIB). PSPIB’s mandate is to achieve a maximum rate of return, without undue risk of loss, with regard to the funding, policies and requirements of the PSPP. PSPIB’s investment policy is set and approved by its Board of Directors and takes into account the Funding Policy for the Public Sector Pension PlansFootnote 21, including the Reference Portfolio set out in this Funding Policy, as well as financial market constraints. The Reference Portfolio is a passively managed, easily investable portfolio used to express the funding risk target of the Government of Canada in respect to the public sector pension plans. It is communicated by the Treasury Board of Canada Secretariat on behalf of the President of the Treasury Board to PSPIB, which then uses this portfolio as an anchor for its investment policy.
For the purpose of this report and in line with the PSPIB investment policy, the investments have been grouped into four broad categories: fixed income securities, equities, real assets and credit. Fixed income securities consist of a mix of federal, provincial and inflation-linked bonds. Equities consist of public (Canadian and foreign) and private equities. Real assets include real estate, infrastructure and natural resources. Credit is composed of private debt investments, non-investment-grade public debt and quasi-debt investments.
As at 31 March 2020, PSPIB’s assets consisted of 20% fixed income securities (including 0.5% cash), 43% equity (including 0.5% complementary investments), 29% real assets and 8% credit. PSPIB has developed a long-term target Policy Portfolio (approved by its Board of Directors in the fall of 2020 and subject to an annual review), which consists of 21% fixed income securities, 39% equity, 31% real assets and 9% credit. The Policy Portfolio asset mix weights represent long-term targets. Therefore, it is assumed that the initial asset mix (derived using the actual investments reported by PSPIB as at 31 March 2020) will gradually converge towards the long-term target Policy Portfolio. The ultimate asset mix is assumed to be reached in plan year 2023.
Net cash flows (contributions less expenditures, disregarding special payments) are expected to become negative during plan year 2031 at which point a portion of assets will be required to pay benefits. Changes to the assumed asset mix may be required in the future to comply with the Funding Policy and to take into account the maturity of the plan.
Table 40 shows the assumed asset mix for each plan year throughout the projection period.
| Plan Year | Fixed Income Securities |
Cash | Public Equity | Private Equity | Real Assets | Credit |
|---|---|---|---|---|---|---|
| 2021 | 19% | 1% | 29% | 14% | 29% | 8% |
| 2022 | 19% | 1% | 28% | 13% | 30% | 9% |
| 2023+ | 19% | 2% | 27% | 12% | 31% | 9% |
F.3.3.2 Rates of Return by Asset Class
Rates of return are determined for each asset class in which the Pension Fund assets are invested. With the exception of fixed income securities and cash, rates of return are assumed to remain constant for the entire projection period. The expected progression of fixed income securities’ rates of return reflects the current context of low yields and the general outlook that yields will remain low for a few years and slowly increase thereafter. A constant rate of return is assumed for more volatile asset classes, reflecting the difficulty to predict annual market returns.
The rates of return were developed by looking at historical returns (expressed in Canadian dollars); these returns were then adjusted upward or downward to reflect future expectations. Given the long projection period, future gains and (losses) due to currency variations were expected to offset each other over time. Hence, it was assumed that currency variations will not have an impact on the long‑term rates of return.
As in the previous valuation, an overall allowance for diversification has been added to the rate of return on the total assets. Such diversification is achieved through the rebalancing of the portfolio and aims at keeping the asset mix constant. Details are presented in Section F.3.3.2.
All rates of return described in this section are shown before reduction for assumed investment expenses; Section F.3.3.3 describes how the returns are adjusted for investment expenses.
Cash
The real yield on cash is expected to be negative over the first years of the projection period, particularly in fiscal year 2022 and 2023 as a result of higher expected inflation. Yield on cash, which is currently near-zero (in nominal terms) due to central banks’ response to the pandemic, is expected to gradually increase over time as the effects of the pandemic dissipate. The real yield on cash is expected to reach 0.5% in 2034.
Fixed Income Securities
As at 31 March 2020, PSPIB had 20% of its portfolio invested in fixed income securities, including Canadian fixed income, inflation-linked bonds (mostly US Treasury Inflation-Protected Securities (TIPS)) and cash. It is assumed that the proportion invested in fixed income securities will reach the level of 21% for the projection period.
As per the information communicated by PSPIB, the allocation to Canadian fixed income is expected to change, going from 12.6% as at 31 March 2020 to a target allocation of 7% in plan year 2023. Cash allocation will increase from 0.5% to 2% and the allocation to emerging market debt will reach 5%. Consequently, the fixed income securities’ ultimate mix (excluding cash) in plan year 2023 and thereafter is expected to consist of 17% federal bonds, 20% provincial bonds, 37% US TIPS and 26% emerging market debt, which reflects PSPIB’s long-term target allocation.
As described in Section F.3.1 above, the assumed real yield on 10-year-plus federal bonds is expected to be positive for plan year 2021, then negative until plan year 2023, and then increase gradually to its ultimate level of 2.1% in plan year 2034. Compared to cash, the yield on 10-year-plus federal bond is 102 basis points higher at the valuation date. The spread is assumed to reach 160 basis points in 2034.
Since the current PSPIB Policy Portfolio and its long-term target Policy Portfolio are composed of universe bonds (long, mid and short terms), it is assumed that fixed income securities are composed of universe bonds for the entire projection period. Due to their overall shorter maturity, the yields on universe bonds are lower than the yields on long-term bonds. As a result, the spreads of universe bonds over cash are lower than those of long-term bonds over cash. The spread of the universe federal bonds over cash is assumed to increase from 64 basis points in plan year 2021 to 88 basis points in plan year 2034.
Credit quality is another important factor affecting bond spreads. The spread on provincial bonds versus cash is expected to be greater than the spread of federal bonds versus cash. However, that spread is smaller than the spread on emerging market bonds, which present additional credit risk and currency risks. The initial spread of universe provincial bonds over cash is assumed to be 190 basis points while the ultimate spread is assumed to be 179 basis points (in plan year 2034). The initial spread of emerging market debt over cash is assumed to be 256 basis points and the ultimate spread is assumed to increase to 282 basis points in plan year 2034. Inflation-linked bonds offer protection against inflation, which tend to lower spread versus cash. The initial spread of inflation-linked bonds (US TIPS) over cash is assumed to be 52 basis points and is expected to increase to 124 basis points in plan year 2034.
The expected real rates of return for individual bonds take into account the coupons and market value fluctuations due to the expected movement of their respective yield rates. The real yield on 10-year-plus federal bonds is assumed to remain negative until plan year 2023 (except for plan year 2021), then gradually increase between plan years 2024 and 2034. Consequently, bond returns are quite low for the plan years prior to 2034. The assumed ultimate real rate of return for 10-year-plus federal bonds is 2.1% starting in plan year 2034. An ultimate fixed income real rate of return of 2.2% is assumed for 2034 and thereafter.
Equity
Currently, forty-three percent of the assets of the Pension Fund are invested in equities (both public and private). In the derivation of the real rates of return for these equity investments, consideration was given to dividend yields, expected growth of the underlying economies, and long-term equity risk premiums.
Public equities are composed of developed market equities, developed market small capitalization equities (small caps), and emerging market equities. Various elements contribute to the return on an equity investment. A company distributes some of its earnings to its shareholders via dividends. Remaining earnings are retained and reinvested in the company, thereby increasing its value. However, a significant portion of a company’s market value is influenced by investors’ expectations regarding a company’s future earnings. When future earnings are uncertain, investors require a higher risk premium. In other words, investors are willing to pay less and a company’s valuation will be lower, all other things being equal. Fluctuation in valuation and investor sentiment is thus another source of return on equity investments. Finally, the value of foreign equity investments are also affected by local currency appreciation and depreciation relative to the Canadian dollar.
Over long periods, valuation changes and currency fluctuations are not expected to contribute significantly to the return on broad equity markets. For simplicity, it is assumed that expectations regarding dividend yields and earnings growth are sufficient to project future equity returns, with additional adjustments for the riskiness of small caps and emerging market equities. Based on historical dividend yields for developed markets and PSPIB’s Policy Portfolio equity allocation, the return from dividend on developed market equities is expected to be 2.5%. Growth in earnings is derived from expected real GDP growth in developed economies. It is expected to add 1.6% to the overall real return of developed market equities. Hence, the expected return on developed market equities is 4.1%. Because of their additional risk, small caps are assumed to yield an additional 0.1% and emerging market equities are assumed to yield an additional 1.0%.
The overall return on public equities, based on PSPIB’s relative allocation to developed market, small caps and emerging market equities, is projected to be 4.4%.
The expected return for private equities is expected to be 50 basis points higher than for public equities, reflecting the additional risk inherent with investments in private markets. Thus, the real rate of return for private equity is projected at 4.9%.
Real Assets
Real assets such as real estate, infrastructure and natural resources are considered to be a hybrid of fixed income and equity. For the purpose of this report, they are assumed to share characteristics of both of these asset classes in the proportion of 25% fixed income and 75% public equity. Hence, the assumed return on real assets is composed of 25% of the return on fixed income securities and 75% of the return on public equity. Considering the inherent difficulties in modelling short-term returns for volatile assets, real assets are projected to earn 3.8% throughout the projection period.
Credit
Credit is also considered to be a hybrid of fixed income and equity. Therefore, based on information shared by PSPIB, it is assumed that credit shares characteristics of both of these asset classes in the proportion of 45% fixed income and 55% public equity. The proportion differs from the last report to reflect the evolution of market conditions and lower fixed income return going forward. Hence, the assumed return on credit is composed of 45% of the return on fixed income securities and 55% of the return on public equity. Considering the inherent difficulties in modelling short-term returns for volatile assets, credit is projected to earn 3.4% throughout the projection period.
Table 41 summarizes the assumed real rates of return by asset type throughout the projection period, prior to reduction for investment expenses.
| Plan Year | Fixed Income Securities |
Cash | Public Equity | Private Equity | Real Assets | Credit |
|---|---|---|---|---|---|---|
| 2021 | (0.4) | (0.5) | 4.4 | 4.9 | 3.8 | 3.4 |
| 2022 | (1.3) | (2.2) | 4.4 | 4.9 | 3.8 | 3.4 |
| 2023 | (2.5) | (2.1) | 4.4 | 4.9 | 3.8 | 3.4 |
| 2024 | (1.8) | (1.7) | 4.4 | 4.9 | 3.8 | 3.4 |
| 2025 | (1.4) | (1.2) | 4.4 | 4.9 | 3.8 | 3.4 |
| 2026 | 0.2 | (0.7) | 4.4 | 4.9 | 3.8 | 3.4 |
| 2027 | 0.4 | (0.3) | 4.4 | 4.9 | 3.8 | 3.4 |
| 2028 | 0.5 | (0.2) | 4.4 | 4.9 | 3.8 | 3.4 |
| 2029 | 0.7 | (0.1) | 4.4 | 4.9 | 3.8 | 3.4 |
| 2030 | 0.8 | 0.0 | 4.4 | 4.9 | 3.8 | 3.4 |
| 2031 | 0.9 | 0.2 | 4.4 | 4.9 | 3.8 | 3.4 |
| 2032 | 1.4 | 0.3 | 4.4 | 4.9 | 3.8 | 3.4 |
| 2033 | 1.5 | 0.4 | 4.4 | 4.9 | 3.8 | 3.4 |
| 2034+ | 2.2 | 0.5 | 4.4 | 4.9 | 3.8 | 3.4 |
F.3.3.3 Investment Expenses
Over the last three plan years, PSPIB’s operating and asset management expenses averaged 0.7% of average net assets. It is assumed that going forward, PSPIB investment expenses will average 0.7% of average net assets. The majority of those investment expenses were incurred through active management decisions.
The objective of active management is to generate returns in excess of those from the Policy Portfolio, after reduction for additional expenses. Thus, the additional returns from a successful active management program should equal at least the cost incurred to pursue active management. In nine of the past ten years, PSPIB’s additional returns from active management exceeded related expenses. For the purpose of this valuation, it is assumed that additional returns due to active management will equal additional expenses related to active management. These expenses are assumed to be the difference between total investment expenses of 0.7% and the assumed expenses of 0.2% that would be incurred for the passive management of the portfolio.
The next section shows the overall rate of return on the fund net of investment expenses.
F.3.3.4 Overall Rate of Return on Assets of the Pension Fund
The best-estimate rate of return on total assets is derived from the weighted average assumed rate of return on all types of assets using the assumed asset mix proportions as weights. The best-estimate rate of return is further increased to reflect additional returns due to active management and allowance for rebalancing and diversificiation, and reduced to reflect all investment expenses. Table 42 shows how the ultimate nominal and real rates of return are developed.
| Nominal | Real | |
|---|---|---|
| Weighted average rate of return | 5.6% | 3.6% |
| Additional returns due to active management | 0.5% | 0.5% |
| Allowance for rebalancing and diversificationTable 42 footnote 1 | 0.5% | 0.5% |
| Expected investment expenses | ||
| Expenses due to passive management | (0.2%) | (0.2%) |
| Additional expenses due to active management | (0.5%) | (0.5%) |
| Total expected investment expenses | (0.7%) | (0.7%) |
| Net rate of return | 5.9% | 3.9% |
Table 42 footnote
|
||
The resulting nominal and real rates of return for each projection year are as follows:
| Plan Year | Nominal | Real |
|---|---|---|
| 2021 | 4.2 | 3.5 |
| 2022 | 5.6 | 3.3 |
| 2023 | 5.2 | 3.0 |
| 2024 | 5.1 | 3.1 |
| 2025 | 5.2 | 3.2 |
| 2026 | 5.5 | 3.5 |
| 2027 | 5.6 | 3.6 |
| 2028 | 5.6 | 3.6 |
| 2029 | 5.6 | 3.6 |
| 2030 | 5.7 | 3.7 |
| 2031 | 5.7 | 3.7 |
| 2032 | 5.8 | 3.8 |
| 2033 | 5.8 | 3.8 |
| 2034+ | 5.9 | 3.9 |
| 2021-2025 | 5.1 | 3.2 |
| 2021-2030 | 5.3 | 3.4 |
| 2021-2034 | 5.5 | 3.5 |
It is assumed that the ultimate real rate of return on investments will be 3.9% in 2034, net of all investment expenses. This represents a reduction of 0.1% from the previous valuation. The real rates of return over the first ten years of the projections are on average 0.3% lower than assumed for the corresponding years in the previous valuation. The real rate of return on assets takes into account the assumed asset mix as well as the assumed real rate of return for all categories of assets. The nominal returns projected for the Pension Fund are simply the sum of the assumed level of inflation and the real return.
Using the variable real rates of return on assets in the previous table is equivalent to using a flat real discount rate of 3.6% for the purpose of calculating the liability at 31 March 2020 for service since 1 April 2000.
F.3.4 Transfer Value Real Interest Rate
Interest rates for transfer values are determined in accordance with the Standards of Practice published by the Canadian Institute of Actuaries (CIA). The CIA issued amendments to the standards for determining the interest rates used for the computation of commuted value which were effective 1 December 2020. In particular, the nominal interest rates for the computation of commuted values as at a particular date are as follows:
First 10 years:
After 10 years:
Implied increase in CPI is then determined as follows:
First 10 years:
After 10 years:
Where , and
is the long‑term real-return Government of Canada bond yield, annualized,
is the long‑term Government of Canada benchmark bond yield, annualized,
is the 7-year Government of Canada benchmark bond yield, annualized,.
is a weighted average of mid-term provincial and corporate spreads over mid-term federal bonds, with two third of the weight on the provincial spread and one third on the corporate spread, annualized, and
is a weighted average of long-term provincial and corporate spreads over long-term federal bonds, with two third of the weight on the provincial spread and one third on the corporate spread, annualized.
Nominal rates interest rates are then adjusted by implied inflation.
The obtained rates of interest are rounded to the nearest multiple of 0.10%.
For example, for plan year 2021, the assumed real rates of interest are 0.9% for the first 10 years and 1.2% thereafter. The rates are derived from the assumed CPI increase, the assumed 10-year-plus Government of Canada benchmark bond yield (which corresponds to the new money rate in this valuation), and the assumed spreadsFootnote 22 between the new money rate and the long-term real-return Government of Canada bond yield, the long-term Government of Canada benchmark bond yield, and the 7-year Government of Canada benchmark bond yield.
Table 44 shows the assumed transfer value real interest rates used in this report:
| Real Interest Rates | ||||||
|---|---|---|---|---|---|---|
| Plan Year | rL | iL | i7 | r7 | First 10 years | After 10 years |
| 2021Table 44 footnote 1 | -0.5 | 0.9 | 0.2 | -0.1 | 0.9 | 1.2 |
| 2022 | -0.1 | 1.9 | 1.2 | -0.1 | 0.9 | 1.1 |
| 2023 | 0.1 | 2.1 | 1.4 | 0.1 | 1.1 | 1.4 |
| 2024 | 0.1 | 2.3 | 1.7 | 0.1 | 1.1 | 1.4 |
| 2025 | 0.8 | 2.7 | 2.0 | 0.6 | 1.5 | 2.1 |
| 2026 | 1.1 | 3.0 | 2.4 | 0.9 | 1.9 | 2.5 |
| 2027 | 1.3 | 3.1 | 2.5 | 1.1 | 2.1 | 2.7 |
| 2028 | 1.5 | 3.3 | 2.7 | 1.2 | 2.3 | 3.0 |
| 2029 | 1.7 | 3.4 | 2.8 | 1.4 | 2.4 | 3.1 |
| 2030 | 1.9 | 3.5 | 2.9 | 1.6 | 2.5 | 3.3 |
| 2031 | 2.0 | 3.7 | 3.1 | 1.7 | 2.7 | 3.5 |
| 2032 | 2.2 | 3.8 | 3.2 | 2.0 | 2.9 | 3.6 |
| 2033 | 2.3 | 3.9 | 3.3 | 2.0 | 2.9 | 3.8 |
| 2034+ | 2.4 | 4.0 | 3.4 | 2.1 | 3.0 | 3.9 |
Table 44 footnote
|
||||||
F.3.5 Administrative Expenses
PSPIB operating expenses are implicitly recognized through a reduction in the real return on the Pension Fund. The same approach was used in the previous valuation.
Administrative expenses are assumed to be 0.40% of pensionable payroll, a decrease from 0.45% in the previous valuation. This assumption is supported by an analysis of the administrative expenses over the last three years. For plan year 2021, 44% of total administrative expenses are being charged to the Superannuation Account; it is assumed that the proportion charged for the Superannuation Account will reduce at an annual rate of 2.0% the same as in the previous report. Expenses expected to be debited to the Superannuation Account in the future have been capitalized and are shown as a liability on the balance sheet, whereas the expenses to the Pension Fund are shown on an annual basis as they occur.
F.3.6 Summary of Economic Assumptions
The economic assumptions used in this report are summarized in the Table 45.
| Plan Year | Inflation | Employment Earning Increases | Interest | |||||
|---|---|---|---|---|---|---|---|---|
| CPI Increase Table 45 footnote 2 |
Pension Indexation Table 45 footnote 3 |
YMPE Table 45 footnote 3 |
Pensionable Earnings Table 45 footnote 4 |
Maximum Pensionable Earnings Table 45 footnote 3,Table 45 footnote 5 |
New Money Rate |
Projected Yield on Account |
Projected Return on Fund |
|
| 2021 | 0.7 | 1.0 | 4.9 | 1.5 | 4.9 | 1.2 | 3.5 | 4.2 |
| 2022 | 2.3 | 1.9 | 6.2 | 1.5 | 6.2 | 1.9 | 3.3 | 5.6 |
| 2023 | 2.2 | 1.9 | 1.1 | 2.0 | 1.1 | 2.0 | 3.1 | 5.2 |
| 2024 | 2.0 | 2.3 | 0.8 | 2.0 | 0.8 | 2.3 | 3.0 | 5.1 |
| 2025 | 2.0 | 2.0 | 1.4 | 2.0 | 1.4 | 2.7 | 2.9 | 5.2 |
| 2026 | 2.0 | 2.0 | 2.4 | 2.2 | 2.4 | 3.0 | 2.8 | 5.5 |
| 2027 | 2.0 | 2.0 | 3.0 | 2.4 | 3.0 | 3.2 | 2.8 | 5.6 |
| 2028 | 2.0 | 2.0 | 3.0 | 2.6 | 3.0 | 3.3 | 2.7 | 5.6 |
| 2029 | 2.0 | 2.0 | 3.0 | 2.7 | 3.0 | 3.5 | 2.6 | 5.6 |
| 2030 | 2.0 | 2.0 | 3.0 | 2.7 | 3.0 | 3.6 | 2.5 | 5.7 |
| 2035 | 2.0 | 2.0 | 3.0 | 2.7 | 3.0 | 4.1 | 2.4 | 5.9 |
| 2040 | 2.0 | 2.0 | 3.0 | 2.7 | 3.0 | 4.1 | 2.9 | 5.9 |
| 2045 | 2.0 | 2.0 | 3.0 | 2.7 | 3.0 | 4.1 | 3.8 | 5.9 |
| 2052+ | 2.0 | 2.0 | 3.0 | 2.7 | 3.0 | 4.1 | 4.1 | 5.9 |
Table 45 footnotes
|
||||||||
Appendix G - PSSA Demographic Assumptions
G.1 Demographic Assumptions
Given the size of the population subject to the PSSA, the plan’s own experience, except where otherwise noted, was deemed to be the best model to determine the demographic assumptions. Assumptions from the previous valuation were updated to reflect past experience to the extent it was deemed credible.
The demographic assumptions in the previous report were based on the member’s completed years of pensionable service, age at most recent birthday, or both. In this valuation, members age and service are determined by rounding the exact value to the nearest integer. Previous assumptions were converted to reflect this change of methodogy.
All references to assumptions from the previous valuation in this section refer to assumptions converted to Age Nearest basis.
G.1.1 Seniority and Promotional Salary Increases
Seniority means length of service within a classification, and promotion means moving to a higher paid classification. The assumption of the previous report was changed by giving equal credibility to the plan’s experience over the last three plan years and the assumption from the previous valuation.
| Years of Pensionable Service | Male | Female |
|---|---|---|
| 0 | 5.9 | 6.1 |
| 1 | 5.5 | 5.7 |
| 2 | 5.0 | 5.2 |
| 3 | 4.4 | 4.6 |
| 4 | 3.8 | 4.0 |
| 5 | 3.3 | 3.5 |
| 6 | 3.0 | 3.1 |
| 7 | 2.7 | 2.9 |
| 8 | 2.5 | 2.7 |
| 9 | 2.3 | 2.5 |
| 10 | 2.1 | 2.4 |
| 15 | 1.5 | 1.7 |
| 20 | 1.2 | 1.4 |
| 25 | 1.0 | 1.2 |
| 30 | 0.9 | 1.0 |
G.1.2 New Contributors
As the active population of the plan is expected to grow, new contributors are projected to replace members that cease to be active as well as increase the number of contributors over time.
The assumed percentage increase in the number of contributors for each plan year is shown in Table 47.
| Plan Year | Percentage |
|---|---|
| 2021 | 4.5 |
| 2022 | 2.0 |
| 2023 | 1.0 |
| 2024 | 0.7 |
| 2025+ | 0.6 |
New contributors are assumed to share the same characteristics as participants with less than one year of service at the valuation date. In particular they are assumed to have:
- The same average age,
- The same gender distribution, and
- The same average initial salary which is adjusted by the economic salary increase for plan year 2021 and beyond.
G.1.3 Pensionable Retirement
The pensionable retirement assumption was revised to reflect the intervaluation plan experience by giving equal credibility to the plan’s experience and the assumption form the previous valuation. Where less data was available, the retirement rates from the previous valuation were not revised. In particular, the rates remained unchanged for
- Group 1 members for ages 65 and over, and
- Group 2 members with more than 8 years of service.
For Group 1 contributors below the age of 65, the assumed retirement rates decreased by an average of 4% for males and 6% for females.
For Group 2 contributors, the analysis included the plan’s experience over the last seven plan years. For Group 2 contributors below the age of 65 and with less than 8 years of service, the assumed retirement rates increased by an average of 3% for males and decreased by an average of 11% for females.
For operational service contributors, the assumed pensionable retirement rates are the same for both sexes and are on average 2% lower than assumed in the previous valuation.
For contributors who are deemed operational, the assumed rates of retirement are the same as for members of the operational service group except that rates of retirement are zero for ages below 45.
Tables 48 to 52 provide sample rates of pensionable retirement.
| AgeTable 48 footnote 1 | Years of Pensionable Service | ||||||
|---|---|---|---|---|---|---|---|
| 2 | 5 | 10 | 20 | 29 | 30 | 35 | |
| 50 | 55 | 35 | 30 | 20 | 15 | 20 | 0 |
| 55 | 60 | 50 | 25 | 20 | 130 | 250 | 315 |
| 60 | 120 | 65 | 110 | 155 | 270 | 295 | 300 |
| 65 | 205 | 165 | 185 | 220 | 255 | 305 | 325 |
| 70 | 215 | 285 | 250 | 290 | 355 | 425 | 410 |
Table 48 footnote
|
|||||||
| AgeTable 49 footnote 1 | Years of Pensionable Service | ||||||
|---|---|---|---|---|---|---|---|
| 2 | 5 | 10 | 20 | 29 | 30 | 35 | |
| 50 | 90 | 45 | 15 | 10 | 15 | 10 | 0 |
| 55 | 90 | 50 | 25 | 35 | 195 | 345 | 490 |
| 60 | 130 | 75 | 125 | 225 | 360 | 390 | 335 |
| 65 | 230 | 215 | 245 | 270 | 245 | 285 | 455 |
| 70 | 195 | 195 | 290 | 380 | 365 | 310 | 490 |
Table 49 footnote
|
|||||||
| AgeTable 50 footnote 1 | Years of Pensionable Service | ||||||
|---|---|---|---|---|---|---|---|
| 2 | 5 | 10 | 20 | 29 | 30 | 35 | |
| 55 | 30 | 40 | 25 | 20 | 20 | 20 | 15 |
| 60 | 95 | 60 | 45 | 55 | 160 | 210 | 345 |
| 65 | 170 | 170 | 220 | 295 | 400 | 455 | 425 |
| 70 | 215 | 285 | 250 | 290 | 355 | 425 | 410 |
Table 50 footnote
|
|||||||
| AgeTable 51 footnote 1 | Years of Pensionable Service | ||||||
|---|---|---|---|---|---|---|---|
| 2 | 5 | 10 | 20 | 29 | 30 | 35 | |
| 55 | 45 | 35 | 25 | 20 | 20 | 20 | 15 |
| 60 | 95 | 75 | 65 | 80 | 210 | 300 | 445 |
| 65 | 195 | 165 | 290 | 380 | 440 | 525 | 425 |
| 70 | 195 | 195 | 290 | 380 | 365 | 310 | 325 |
Table 51 footnote
|
|||||||
| AgeTable 52 footnote 1 | Years of Pensionable Service | ||||||
|---|---|---|---|---|---|---|---|
| 2 | 5 | 10 | 19 | 20 | 30 | 35 | |
| 40 | - | - | - | - | 10 | - | - |
| 45 | - | - | - | - | 5 | 20 | - |
| 50 | 75 | 40 | 25 | 10 | 10 | 130 | 160 |
| 55 | 75 | 50 | 25 | 25 | 25 | 210 | 180 |
| 60 | 125 | 70 | 120 | 155 | 195 | 345 | 320 |
| 65 | 215 | 190 | 210 | 260 | 245 | 295 | 390 |
| 70 | 205 | 245 | 270 | 315 | 330 | 375 | 445 |
Table 52 footnote
|
|||||||
G.1.4 Disability Retirement
The disability incidence rate assumption was revised to reflect the intervaluation experience, by giving equal credibility to the plan’s experience over the last three plan years and the assumption from the previous valuation.
Disability incidence is independent from plan provisions. As such, the incidence rates are the same for members not eligible to immediate retirement for both Groups. Disability incidence is assumed to be nil once a member is eligible to immediate retirement
The assumed rates of disability retirement for ages 60 to 64 are the same as in the previous valuation, although they appear different since they have been adjusted from the Age Last to the Age Nearest basis. The assumed rates of pensionable disability for contributors between the ages of 30 and 59 have decreased by an average of 3% for males and 7% for females.
It is assumed that 75% of future new disability pensioners will receive a C/QPP disability pension at the onset of disability. This is unchanged from the previous valuation.
| Age | Male | Female |
|---|---|---|
| 25 | 0.00 | 0.00 |
| 35 | 0.38 | 0.89 |
| 45 | 1.44 | 2.76 |
| 55 | 4.06 | 7.07 |
| 59 | 4.95 | 7.44 |
| 60 | 8.02 | 10.76 |
| 61 | 9.72 | 12.01 |
| 62 | 11.70 | 13.20 |
| 63 | 13.69 | 14.20 |
| 64 | 14.69 | 15.20 |
Table 53 footnote
|
||
G.1.5 Withdrawal
Withdrawal with less than two years of service includes termination of employment for any reason. Withdrawal with two or more years of service means termination of employment for reasons other than death, disability or retirement with an immediate annuity or an annual allowance. The withdrawal rate assumption was revised to reflect the plan experience.
The assumed withdrawal rates were developed by giving equal credibility to the plan’s experience over the last three plan years and the assumption from the previous valuation. However, all assumed withdrawal rates for contributors with more than 20 years of service were revised to zero.
In addition, for Group 2 contributors aged 50 to 54 with 2 to 7 years of service, the assumed withdrawal rates were developed by giving equal credibility to the plan’s experience over the last seven plan years and the assumption from the previous valuation. Finally, the assumed withdrawal rates for Group 2 contributors aged 50 to 54 with 8 to 20 years of service are assumed to be the same as in the previous valuation.
The assumed withdrawal rates for ages below the age of 50 decreased by an average of 15% for males and 22% for females.
Tables 54 to 56 provide samples of the assumed rates of withdrawal.
| AgeTable 54 footnote 1 | Years of Pensionable Service | ||||||
|---|---|---|---|---|---|---|---|
| 0 | 1 | 5 | 10 | 15 | 20 | 21 + | |
| 20 | 375 | 375 | - | - | - | - | - |
| 25 | 150 | 135 | 35 | - | - | - | - |
| 30 | 115 | 105 | 35 | 20 | - | - | - |
| 35 | 105 | 90 | 25 | 20 | 10 | - | - |
| 40 | 105 | 100 | 45 | 10 | 10 | 5 | - |
| 45 | 115 | 100 | 35 | 25 | 15 | 5 | - |
| 50 | 140 | 125 | 30 | 15 | 10 | 5 | - |
| 54 | 160 | 145 | 31 | 15 | 10 | 5 | - |
| 60 | 226 | 215 | - | - | - | - | - |
Table 54 footnote
|
|||||||
| AgeTable 55 footnote 1 | Years of Pensionable Service | ||||||
|---|---|---|---|---|---|---|---|
| 0 | 1 | 5 | 10 | 15 | 20 | 21 + | |
| 20 | 365 | 365 | - | - | - | - | - |
| 25 | 145 | 130 | 20 | - | - | - | - |
| 30 | 115 | 105 | 20 | 10 | - | - | - |
| 35 | 110 | 95 | 25 | 10 | 5 | - | - |
| 40 | 110 | 100 | 30 | 15 | 10 | 5 | - |
| 45 | 125 | 110 | 25 | 20 | 10 | 5 | - |
| 50 | 160 | 140 | 35 | 15 | 10 | 5 | - |
| 54 | 190 | 165 | 40 | 20 | 15 | 10 | - |
| 60 | 250 | 230 | - | - | - | - | - |
Table 55 footnote
|
|||||||
In the previous valuation, assumed withdrawal rates for operational service contributors varied based on both age and service, while in this report they vary on the basis of service only. Full credibility was applied to the plan’s experience over the last three years. The assumed rates of withdrawal are the same for actual operational contributors as well as for deemed operational contributors.
| Years of Pensionable Service | Unisex |
|---|---|
| 0 | 41 |
| 1 | 36 |
| 2 | 30 |
| 3 | 21 |
| 4 | 19 |
| 5 | 16 |
| 10 | 10 |
| 15 | 11 |
| 19 | 8 |
| 20 + | - |
G.1.6 Proportions of Terminating Contributor Opting for a Deferred Annuity
Upon termination, contributors are eligible to a deferred annuity payable at age 60 for Group 1 and at age 65 for Group 2, or to a commuted valued of this deferred pension, when termination occurs more than ten years prior to the deferred age of payment. Notwithstanding the above, members with less than 2 years of service are only eligible to a return of their contributions.
The assumption for proportion of terminating contributors opting for a deferred annuity applies only to members with less than 20 years of service, since withdrawal rates for members with 20 or more years of service are assumed to be zero.
The assumption for the proportion of terminating Group 1 and Group 2 contributors opting for a deferred annuity is determined by combining the experience of Group 1 and Group 2 contributors who terminated before age 50. The assumption was revised by giving equal credibility to the plan’s experience over the last three plan years and the assumption from the previous valuation for all age and service combinations where the exposures to a termination was significant.
For Group 2 contributors ages above 49, the proportion of terminating contributor opting for a deferred annuity was revised to 100% for all age and service combinations.
For Group 1 and Group 2 contributors under age 50 the assumed proportion of terminating members electing a deferred annuity increased by an average of 4% for males and decreased by an average of 3% for females. For operational service contributors under age 50 the assumed proportion of terminating members electing a deferred annuity increased by an average of 1%.
Tables 57 to 59 provide samples of the proportions of terminating contributors opting for a deferred annuity.
| AgeTable 57 footnote 1 | Years of Pensionable Service | ||||
|---|---|---|---|---|---|
| 2 | 5 | 10 | 15 | 20 | |
| 20 | 29 | - | - | - | - |
| 25 | 32 | 25 | - | - | - |
| 30 | 44 | 54 | 41 | - | - |
| 35 | 33 | 46 | 55 | 21 | - |
| 40 | 48 | 52 | 39 | 47 | 22 |
| 45 | 27 | 58 | 58 | 39 | 73 |
| 50 | 35 | 100 | 100 | 100 | 100 |
| 54 | 71 | 100 | 100 | 100 | 100 |
Table 57 footnote
|
|||||
| AgeTable 58 footnote 1 | Years of Pensionable Service | ||||
|---|---|---|---|---|---|
| 2 | 5 | 10 | 15 | 20 | |
| 20 | 44 | - | - | - | - |
| 25 | 43 | 76 | - | - | - |
| 30 | 41 | 52 | 38 | - | - |
| 35 | 42 | 52 | 44 | 66 | - |
| 40 | 43 | 60 | 52 | 41 | 17 |
| 45 | 48 | 52 | 57 | 49 | 41 |
| 50 | 100 | 100 | 100 | 100 | 100 |
| 54 | 100 | 100 | 100 | 100 | 100 |
Table 58 footnote
|
|||||
| AgeTable 59 footnote 1 | Years of Pensionable Service | ||||
|---|---|---|---|---|---|
| 2 | 5 | 10 | 15 | 19 | |
| 20 | 44 | - | - | - | - |
| 25 | 38 | 52 | - | - | - |
| 30 | 42 | 53 | 40 | - | - |
| 35 | 38 | 49 | 49 | 45 | - |
| 40 | 45 | 56 | 46 | 44 | 47 |
| 45 | 38 | 55 | 57 | 45 | 45 |
| 50 | 69 | 100 | 100 | 100 | - |
| 54 | 75 | 100 | 100 | 100 | - |
Table 59 footnote
|
|||||
G.1.7 Mortality
As in the previous valuation, the mortality rates assumed for contributors, retirement pensioners and surviving spouses were derived by giving full credibility to the plan’s experience over the last three years. The mortality experience was weighted by salaryFootnote 23 to reflect the impact of socio-economic status on mortality rates. It is assumed that an above (below) average socio-economic status, which is partly dictated by salary level, leads to longer (shorter) life expectancy.
For contributors and retirement pensioners the mortality rates for plan year 2021 are lower by an average of 2% for male and 3% for female between the ages of 60 to 100 compared to the mortality rate for plan year 2018 from the previous valuation.
Due to the limited disabled mortality experience over the three-year intervaluation period, the mortality rates for disabled pensioners were derived by giving equal credibility to the plan’s experience during that time and the projected assumption from the previous valuation. For disability pensioners the mortality rates for plan year 2021 increased by an average of 2% for males and 3% for females between the ages of 60 and 100, compared to plan year 2018.
For spouse survivors, mortality rates for ages below 60 were revised to zero given the low number of spouse survivors aged below 60. The impact of revising the rates for ages below 60 to zero was minimal. For spouse survivors over age 60, the mortality rates for plan year 2021 decreased by an average of 2% for male survivors and 4% for female survivors between the ages of 60 to 100 compared to plan year 2018 used in the previous valuation.
Table 60 shows a sample of assumed mortality rates weighted by salary.
| AgeTable 60 footnote 1 | Contributors and Retirement Pensioners | Disability Pensioners | Surviving Spouses | |||
|---|---|---|---|---|---|---|
| Male | Female | Male | Female | Male | Female | |
| 30 | 0.3 | 0.2 | 5.6 | 2.3 | 0.0 | 0.0 |
| 40 | 0.4 | 0.4 | 10.2 | 4.4 | 0.0 | 0.0 |
| 50 | 1.1 | 0.9 | 10.3 | 8.5 | 0.0 | 0.0 |
| 60 | 3.9 | 2.8 | 20.0 | 11.8 | 8.6 | 5.2 |
| 70 | 11.8 | 9.4 | 36.1 | 23.7 | 17.6 | 13.6 |
| 80 | 39.9 | 28.5 | 79.3 | 56.3 | 56.3 | 36.6 |
| 90 | 141.9 | 113.9 | 186.5 | 150.9 | 151.1 | 111.9 |
| 100 | 358.1 | 323.0 | 412.4 | 423.3 | 364.8 | 304.6 |
| 110 | 500.0 | 500.0 | 500.0 | 500.0 | 500.0 | 500.0 |
Table 60 footnote
|
||||||
Mortality rates are reduced in the future in accordance with the same mortality improvement assumption used in the 30th Actuarial Report on the Canada Pension Plan. Mortality improvements are expected to continue in the future but at a slower pace than most recently observed over the 15-year period ending in 2015. Further, it is assumed that, ultimately, mortality improvement rates for males will decrease to the same level as females.
Mortality improvement rates shown in the 30th Actuarial Report of the Canada Pension Plan are based on calendar years. These rates have been interpolated to plan year basis.
A sample of assumed mortality improvement rates is shown in Table 61.
| AgeTable 61 footnote 1 | Initial and Ultimate Plan Year Mortality Improvement Rates (%) | |||
|---|---|---|---|---|
| Male | Female | |||
| 2022 | 2037 + | 2022 | 2037 + | |
| 30 | 1.10 | 0.80 | 0.59 | 0.80 |
| 40 | 1.57 | 0.80 | 1.42 | 0.80 |
| 50 | 1.49 | 0.80 | 0.98 | 0.80 |
| 60 | 2.18 | 0.80 | 1.65 | 0.80 |
| 70 | 2.07 | 0.80 | 1.49 | 0.80 |
| 80 | 2.08 | 0.80 | 1.50 | 0.80 |
| 90 | 1.83 | 0.65 | 1.66 | 0.65 |
| 100 | 0.62 | 0.29 | 0.67 | 0.29 |
| 110+ | 0.03 | 0.01 | 0.03 | 0.01 |
Table 61 footnote
|
||||
Table 62 shows the calculated cohort life expectancyFootnote 24 for contributors and retirement pensioners based on the mortality assumptions described in this section.
| Age Nearest | As at 31 March 2020 | As at 31 March 2036 | ||
|---|---|---|---|---|
| Male | Female | Male | Female | |
| 60 | 27.7 | 29.5 | 28.6 | 30.4 |
| 65 | 22.9 | 24.6 | 23.9 | 25.5 |
| 70 | 18.4 | 20.0 | 19.3 | 20.8 |
| 75 | 14.2 | 15.7 | 15.0 | 16.5 |
| 80 | 10.4 | 11.8 | 11.2 | 12.5 |
| 85 | 7.2 | 8.3 | 7.9 | 8.9 |
| 90 | 4.7 | 5.6 | 5.2 | 6.1 |
The assumptions on mortality rates and mortality improvement rates represent best-estimate assumptions regarding future demographic trends. Given the length of the projection period, it is unlikely that the actual experience will develop precisely in accordance with best-estimate assumptions. The following table measures the effect on the life expectancy when mortality improvement rates vary.
| Age 65 Life Expectancy in 2020 | Age 65 Life Expectancy in 2037 | |||
|---|---|---|---|---|
| Male | Female | Male | Female | |
| Mortality Improvement Rates | ||||
| Current basis | 22.9 | 24.6 | 23.9 | 25.5 |
| - if 0% | 21.5 | 23.3 | 21.5 | 23.3 |
| - if ultimate 50% higher | 23.1 | 24.8 | 24.4 | 26.1 |
| - if ultimate 50% lower | 22.6 | 24.5 | 23.2 | 25.0 |
| - if kept at 2020 level | 23.9 | 25.4 | 26.3 | 27.3 |
G.1.8 Family Composition
The assumptions regarding spouse survivors were revised based on the intervaluation experience.
Between ages 30 and 90 the assumption regarding the probability of a member, upon death, leaving a spouse eligible for a survivor pension was decreased by an average of 7% for males and 3% for females.
The assumption for spouse age difference was revised as shown in Table 64. The impact of this change is immaterial to the plan.
| AgeTable 64 footnote 2 | Male | Female | ||
|---|---|---|---|---|
| Probability of an Eligible Spouse at Death of Member |
Spouse Age Difference |
Probability of an Eligible Spouse at Death of Member |
Spouse Age Difference |
|
| 30 | 0.31 | (3) | 0.42 | 2 |
| 40 | 0.45 | (3) | 0.55 | 2 |
| 50 | 0.56 | (3) | 0.55 | 2 |
| 60 | 0.61 | (3) | 0.51 | 2 |
| 70 | 0.63 | (4) | 0.39 | 0 |
| 80 | 0.59 | (4) | 0.24 | 0 |
| 90 | 0.42 | (4) | 0.07 | 0 |
| 100 | 0.13 | (4) | 0.00 | 0 |
Table 64 footnotes
|
||||
It is assumed that deceased members will leave no eligible child survivors. This change has a negligible impact on the valuation results.
The sex of each eligible surviving spouse is assumed to be the opposite of the deceased member’s.
Appendix H - Transfer Value Valuation Methodology and Assumptions
Section 92 (1) of the Public Service Superannuation Regulations states that demographic assumptions used for the calculation of transfer value are those of the last actuarial report file prior to the calculation date. This section summarizes the methodology and assumptions required for the calculation of transfer values.
H.1 Valuation Methodology
A contributor who has ceased to be employed in the public service is eligible to a deferred annuity and may elect to transfer the commuted value of the accrued pension benefits if that contributor:
- has two or more years of pensionable service and
- is under
- age 50 if a Group 1 contributor, or
- age 55 if a Group 2 contributor.
The transfer value payment made to the former contributor represents the present value of the benefit accrued at the time of termination. The present value evaluates the following benefits:
- the former contributor’s accrued pension which is payable from age 60 for a Group 1 contributor or from age 65 for a Group 2 contributor;
- the former contributor’s accrued pension which is payable immediately based on the probability that the contributor becomes disabled after termination but prior to age 60 for a Group 1 contributor or age 65 for a Group 2 contributor;
- 50% of the former contributor’s accrued pension which is payable to surviving spouses based on the probability that the former contributor has an eligible surviving spouse at the time of death.
- 10% of the former contributor’s accrued pension payable to children based on the probability that the former contributor has eligible children at the time of death.
H.2 Economic Assumptions
Interest rates for transfer value amounts are determined in accordance with Section “Pension Commuted Values” of the Standards of Practice - Pensions published by the Canadian Institute of Actuaries. The rates used for transfer value calculation are shown in Table 44 on page 64.
H.3 Demographic Assumptions
For the purpose of calculating the transfer value amount payable to a former contributor the following demographic assumptions are used.
H.3.1 Mortality Assumptions
The mortality rates and mortality improvement rates for a former contributor in receipt of an annuity, for a former contributor becoming disabled after termination, and a surviving spouse upon the death of the former contributor are respectively the same as discussed in Section G.1.7.
H.3.2 Disability Incidence
The disability incidence rates are used to determine the proportion of former contributors becoming disabled during the period after termination and prior to the attainment of age 60 for former Group 1 contributors or age 65 for former Group 2 contributors. These are shown in Table 53 on page 69.
H.3.3 Probability of an Eligible Spouse at Death of Former Contributor
In order to be eligible for a survivor benefit, the survivor must be an eligible spouseFootnote 25 as at the termination date and remain eligible up until the time of death of the former contributor. Given that the PSPP does not capture the marital status at time of termination, it is assumed that the proportions of former members married at termination are the same as for the Canadian population. As such, the data was extracted from the Statistics Canada CANSIM Table 051-0042 for the year 2020 for all ages below age 71.
The expected proportion of the former contributors having an eligible spouse at time of termination is determined by combining marital status of married (and not separated), separated (not living in common law) and living in common law.
Table 65 shows the expected proportions of former contributors having an eligible spouse at time of termination.
| AgeTable 65 footnote 2 | Male | Female |
|---|---|---|
| 20 | 0.03 | 0.07 |
| 30 | 0.52 | 0.64 |
| 40 | 0.75 | 0.77 |
| 50 | 0.75 | 0.75 |
| 60 | 0.77 | 0.72 |
| 70 | 0.80 | 0.64 |
Table 65 footnotes
|
||
Once determined to be married at termination, a former contributor’s probability of remaining in the marriage after the time of termination diminishes over time by reason of a possible divorce or death of the spouse before the member.
Once married, an individual is subject to the possibility of a divorce which would remove the survivor coverage at the former contributor’s time of death if the spouse has survived to such time. As no experience data is available for the PSPP, it was assumed that the probabilities of divorce after marriage of former members are the same as for the Canadian population. The latest available data on divorce rates are those published by Statistics Canada in the publication Divorces in Canada 84F0213X. The divorce rates were derived from the years 1996 to 2003.
| Age | Male | Female |
|---|---|---|
| 20 | 0.020 | 0.022 |
| 30 | 0.019 | 0.019 |
| 40 | 0.016 | 0.015 |
| 50 | 0.012 | 0.010 |
| 60 | 0.006 | 0.004 |
| 70 | 0.002 | 0.001 |
| 80 | 0.002 | 0.001 |
| 90 | 0.002 | 0.001 |
For individual transfer value calculation purposes, it is assumed that at the date of termination, the spouse is three years younger than the male contributor and three years older than the female contributor.
It is assumed that deceased former members will leave no eligible child survivors.
Appendix I - RCA Valuation Methodology and Assumptions
I.1 Valuation of the Account Balance
The amounts available for benefits comprise the recorded balances of the RCA (RCA No. 1 and RCA No. 2) Accounts, which form part of the Public Accounts of Canada as well as a tax credit (CRA refundable tax) with respect to the RCAs.
Interest is credited on the RCA Accounts every three months in accordance with the actual average yield on a book value basis for the same period on the combined Superannuation Accounts of the Public Service, Canadian Forces - Regular Force and RCMP pension plans. The actuarial value of the account balance is equal to the book value.
I.2 Valuation of Liabilities
Described in this Appendix are the liability valuation methodologies used and any differences in economic assumptions from those used in the PSSA valuation.
I.2.1 Terminally Funded RCA Benefits
The following RCA benefits are being terminally funded (i.e. not prefunded but on an occurrence basis):
- Early Retirement Incentive (ERI) program
- pre‑retirement survivor benefits
- minimum death benefit
- elective service
Except for the now-closed ERI program, the above benefits are terminally funded because they are uncommon or of little financial significance. For example, the pre‑retirement survivor benefit becomes payable only when the average salary is less than 1.4 times the YMPE. As well, the minimum death benefit is expected to occur only with deaths at younger ages, where the probability of death is small.
I.2.2 RCA No. 1 Post‑Retirement Survivor Benefits
The limit on the amount of spousal annual allowance that can be provided under the PSSA decreases when the member’s pension is reduced due to the CPP (or QPP) offset, which usually occurs at age 65.
This benefit was valued conservatively by assuming the plan limit is always coordinated with the CPP (or QPP). The liability overstatement is minor because the probability of the former contributor dying prior to age 65 is small. (This overstatement tends to be offset by the understatement of accrued liability caused by terminally funding the pre‑retirement survivor benefit.) The projected accrued benefit cost method was used to estimate the liabilities and normal costs for this RCA No. 1 benefit.
I.2.3 RCA No. 1 Continued Benefit Accrual for Former Deputy Heads
All former deputy heads that have accrued or are accruing benefits are included. For those accruing benefits, it was assumed that they would cease to do so when first eligible to receive an immediate annuity.
I.2.4 RCA No. 1 Excess Pensionable Earnings
The projected accrued benefit cost method was used to estimate plan liability and current service costs for retirement benefits in excess of the Maximum Pensionable Earnings (MPE).
I.2.5 Administrative Expenses
To compute the liability and current service costs, no provision was made regarding the expenses incurred for the administration of either the RCA No. 1 Account or the RCA No. 2 Account. These expenses, which are not debited from the RCA Accounts, are borne entirely by the government and are commingled with all other government expenses.
I.3 Actuarial Assumptions
The valuation economic assumptions described in Appendix F were used without any modifications.
I.4 Valuation Data
The RCA No. 1 and RCA No. 2 pension benefits in payment were provided as at 31 March 2020. RCA No. 1 and RCA No. 2 benefits expected to be paid in respect of contributors and accrued spousal allowances of current retired members were all derived from the membership data described in Appendix D and shown in Appendix L.
Appendix J - Public Service Pension Plan Projection
The results of the following projections were computed using the data described in Appendices D and L, the methodology described in Appendix E and the assumptions described in Appendices F, G and H.
J.1 Projection of the Superannuation Account and the Pension Fund Liabilities
Prior to 1 April 2000, the PSSA Superannuation Account tracked all government pension benefit obligations related to the PSSA. The Superannuation Account is now debited only with benefit payments made in respect of service earned before that date and administrative expenses; it is credited with prior service contributions related to elections made prior to 1 April 2000 and interest earnings.
Starting 1 April 2000, the PSSA is financed through the Pension Fund. The Pension Fund is credited with employer and member contributions, investment earnings and prior service contributions for elections made since 1 April 2000. The Pension Fund is debited with benefit payments made in respect of service earned since that date and administrative expenses.
The following graph presents the evolution over time of the Superannuation Account liabilities for service prior to 1 April 2000 and the Pension Fund liabilities for service after 31 March 2000.
Chart 1 - Evolution of Liabilities of Superannuation Account and Pension Fund over Time
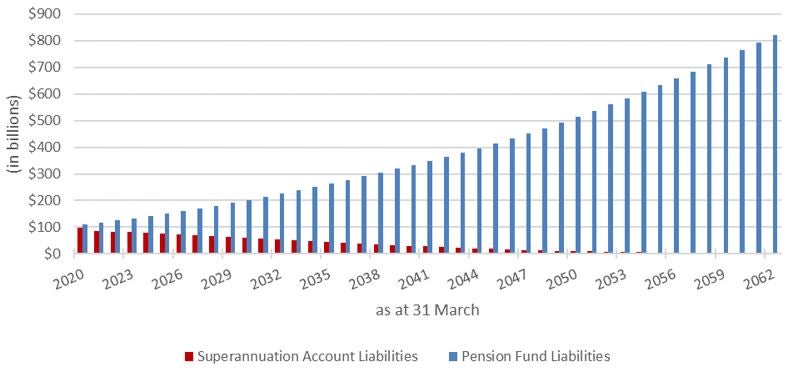
Graphic Description - Evolution of Liabilities of Superannuation Account and Pension Fund over Time
Bar graph showing the evolution of liabilities related to the Superannuation Account and to the Pension Fund over time. Y-axis represents the expected Superannuation Account and Pension Fund liabilities in billions. X-axis represents the year, starting at March 31 2020 and ending at 31 March 2062.
At 31 March 2020, the Superannuation Account liabilities were $99 billion and the Pension Fund liabilities were $111 billion. The Superannuation Account liabilities will continue to steadily decrease, by an average of $3 billion per year. The remaining liabilities are $1 billion in 2062. The Pension Fund liabilities will continue to steadily increase, by an average of $16.3 billion each year, resulting in liabilities of $821 billion in 2062.
J.2 Evolution of Cash Flows under the Pension Fund
In plan year 2021, contributions to the Pension Fund are expected to reach $5,019 million, whereas payouts, including benefit payments and administrative expenses, are expected to reach $3,474 million. Contributions that are higher than payouts ensure that the Pension Fund has sufficient liquidity to cover all the payouts in a year. However, as the population of the Pension Fund matures, the amount of payouts will increase and will eventually exceed the contributions. This will result in negative cash flows to the Pension Fund.
It is expected that the Pension Fund will have negative cash flows from plan year 2031, at which point a portion of the assets will be required to pay benefits. However, regular liquid revenue from the Pension Fund such as fixed income interest, stock dividends, infrastructure and real estate rents will be readilly available to cover the excess payouts. Nevertheless, it should be noted that although negative cash flows will begin in the plan year 2031, the Pension Fund’s overall assets are expected to grow for the entire duration of the projection presented below when investment income is taken into considerationFootnote 26.
Chart 2 - Evolution of Cash Flows over Time
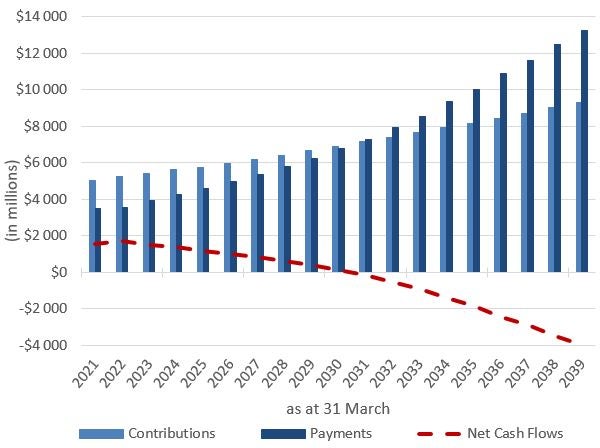
Graphic Description - Evolution of Cash Flows over Time
Bar graph showing the evolution of cash flows under the Pension Fund over time. Y-axis represents the expected contributions, payments and resulting net cash flows in millions. X-axis represents the plan year, starting in 2021 and ending in 2039.
In plan year 2021, contributions to the Pension Fund are $5,018 million, whereas payments are $3,493 million, resulting in net cash flows of $1,525 million. Both contributions and payments are increasing over time, however payments are increasing at a higher rate than the contributions. Payments will be higher than contributions starting plan year 2031.
In 2031, the chart shows payments of $7,279 million exceeding contributions of $7,145 million and resulting in net cash flows of negative $134 million. From 2031, the Pension Fund experiences negative net cash flows. In plan year 2039, contributions to the Pension Fund reach $9,292 million, whereas payouts reach $13,252 million resulting in net cash flows of negative $3,960 million.
J.3 Evolution of Group 1 and Group 2 Active Membership
Due to the implementation of Division 23 of Part 4 of the Jobs and Growth Act, 2012 (S.C. 2012, c. 31), members who entered the Plan prior to 1 January 2013 are considered Group 1 members and members who entered the Plan on or after 1 January 2013 are considered Group 2 members. The benefit costs of Group 2 members are generally less than that of Group 1 members. Chart 3 shows the evolution of membership between the two groups. Group 2 active members are expected to outnumber Group 1 active members in plan year 2023. By plan year 2063, there should be no Group 1 active members left in the Plan.
Chart 3 - Evolution of Group 1 and Group 2 Active Membership
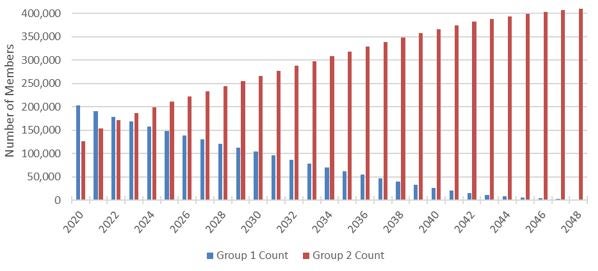
Graphic Description - Evolution of Group 1 and Group 2 Active Membership
Bar graph showing the evolution of active membership count for Group 1 and Group 2 members over time. Y-axis represents the number of members. X-axis represents the plan year, starting at 31 March 2020 and ending at 31 March 2048.
At 31 March 2020, there were 202,317 Group 1 active members and 126,710 Group 2 active members. The chart shows that, Group 1 active membership steadily decreases over time by an average of 7,166 members each year, leaving 1,669 Group 1 active members in 2048. Group 2 active membership steadily increases over time by an average of 10,122 each year resulting in 410,131 Group 2 active members in 2048. The chart shows that Group 2 active membership will surpass Group 1 active membership starting in 2023.
Appendix K - Uncertainty of Future Investment Returns
K.1 Introduction
The projected financial status of the Pension Fund depends on many demographic and economic factors, including new contributors, average earnings, inflation, level of interest rates and investment returns. The projected long-term financial status of the Pension Fund is based on best-estimate assumptions. The objective of this section is to present a range of outcomes resulting from various alternative investment returns scenarios. The alternatives presented illustrate the sensitivity of the long-term projected financial position of the Pension Fund to changes in the future economic outlook. In this appendix, any references to assets, liabilities, surplus/(deficit), annual special payments and service cost are related to those of the Pension Fund.
Section K.2 illustrates how investment experience may affect the funding status of the Pension Fund over time. The impact of financial market tail events on the financial status of the Pension Fund is explored in Section K.3, where a severe one-time financial shock is applied to the best-estimate portfolio with the purpose of quantifying the impact on the funding ratio over the short-term horizon.
K.2 Range of Potential Funding Ratio due to Investment Experience
Chart 4 illustrates a range of funded ratios (actuarial value of assets over actuarial liabilities) that could be expected under the best-estimate portfolio. It takes into account that actuarial valuation would occur every three years starting in 2020, that deficits are covered by additional government contributions, and that legislated non-permitted surplus (surplus in excess of 25% of liabilities) results in a full or partial contribution holiday for the government.
As shown in Chart 4, the median expected funded ratio is relatively flat (between 112% and 114%) over the projection period.
Chart 4 - Range of Potential Funding Ratio for the Best-Estimate Portfolio – PS Pension Fund
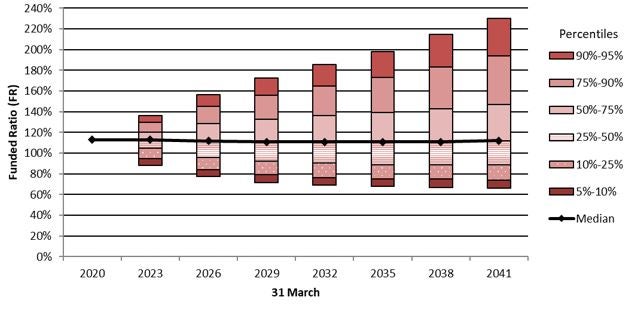
Graphic Description - Range of Potential Funding Ratio for the Best-Estimate Portfolio – PS Pension Fund
Bar graph showing the range of potential funding ratio of the Pension Fund for the best-estimate portfolio over time. Y-axis represents the funded ratio. X-axis shows the plan year, starting at 31 March 2020 and ending at 31 March 2041.
The chart shows that the funding ratio for the Pension Fund was 113% at 31 March 2020. The median expected funding ratio is stable (110.8% at 31 March 2023, 112.9% at 31 March 2032 and 114.0% at 31 March 2041) over the projection period. At the fifth percentile, the funding ratio is 88% at 31 March 2020, 69% at 31 March 2032 and 66% at 31 March 2042. At the 95th percentile, the funding ratio is 136% at 31 March 2023, 186% at 31 March 2032 and 230% at 31 March 2042.
Chart 4 shows that the range of potential outcomes widens with time. Chart 5 illustrates the probabilities associated with three possible funded statuses over the next 20 years: deficit, surplus less than 25% of liabilities, and non-permitted surplus.
Chart 5 - Likelihood of Deficit, Permitted and Non-Permitted Surplus due to Investment Experience
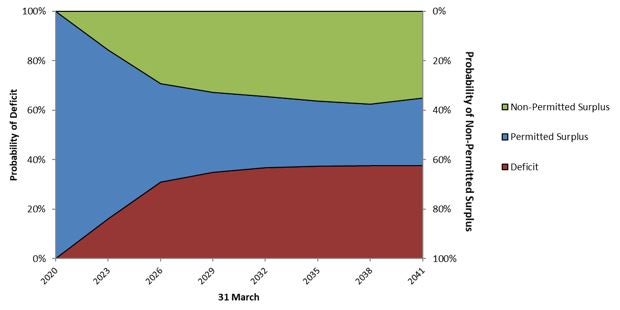
Graphic Description - Likelihood of Deficit, Permitted and Non-Permitted Surplus due to Investment Experience
Combo graph showing the Likelihood of Deficit, Permitted and Non-Permitted Surplus due to Investment Experience. The left Y-axis shows the likelihood of deficit while the right Y-axis shows the likelihood of non-permitted surplus. X-axis shows the plan year, starting at 31 March 2020 and ending at 31 March 2041.
There is permitted surplus at 31 March 2020. The probability of a deficit or a non-permitted surplus are both approximately 16% as at 31 March 2023. The probability of a deficit increases to 31% as at 31 March 2026, to reach 38 % by the fiscal year 2041. The probability of a non-permitted surplus increases to 29% as at 31 March 2026, reaching 35 % by fiscal year 2041.
On Chart 5, the left axis shows the likelihood of deficit while the right axis shows the likelihood of non-permitted surplus. The likelihood of the permitted surplus is determined as 100% minus probability of deficit minus probability of non-permitted surplus.
K.3 Financial Market Tail Events
This section focuses on the inherent volatility in the best-estimate portfolio and the potential extreme outcomes. During plan year 2009, the nominal return on Pension Fund assets was negative 22.7% due to the economic slowdown. Such an event could be characterized as low probability (also referred to as a “tail event”). However, when these events do occur, the impact on the funded ratio is significant. This section analyzes the impacts that tail-event returns would have on the Plan’s funded ratio and the projected surplus/(deficit) as at 31 March 2023 (the expected date of the next actuarial review).
To illustrate this, returns other than the best-estimate are assumed to occur in plan year 2021 followed by the best‑estimate returns for plan years 2022 and 2023.
The returns are assumed to follow a normal distribution. Two probability levels were selected to analyze: 1/10 and 1/50. The probabilities of earning these returns can be thought of as the event occurring once every 10 and 50 years, respectively. The left tail event is the occurrence of a nominal return such that the probability of earning that return or less is equal to 1/10 (or 1/50). The right tail event is the occurrence of a nominal return such that the probability of earning that return or more is equal to 1/10 (or 1/50).
| As at 31 March 2023 | |||||||
|---|---|---|---|---|---|---|---|
| Current Basis | Nominal Return at Plan Year 2021 |
Average Nominal Return from Plan Year 2021‑2023 |
Funded Ratio | Actuarial Value of Assets | Liability | Surplus/ (Deficit) | Annual Special PaymentTable 67 footnote 2 |
| 4.2% | 5.0% | 108% | 144,550 | 133,284 | 11,266 | 0 | |
| Investment returnTable 67 footnote 3 | |||||||
| - Left Tail event at 1/50th probability | (18.7%) | (2.7%) | 98% | 131,174 | 133,284 | (2,110) | 219 |
| - Left Tail event at 1/10th probability | (9.8%) | 0.7% | 104% | 139,125 | 133,284 | 5,841 | 0 |
| - Right Tail event at 1/10th probability | 19.5% | 10.4% | 124% | 165,036 | 133,284 | 31,752 | 0 |
| - Right Tail event at 1/50th probability | 28.4% | 13.1% | 130% | 172,839 | 133,284 | 39,555 | 0 |
Table 67 footnotes
|
|||||||
Table 67 shows that extreme events occurring during intervaluation period, as demonstrated by the 1/50th left and right tails, will result in the plan either requiring a special payment when there is a severe economic downtown or exceeding the non-permitted surplus threshold when market conditions are extremely favorable. Table 67 also shows that the impact of an isolated tail-event is dampened over time when investment conditions revert to the best-estimate scenario.
Appendix L - Detailed Information on Membership Data
| AgeTable 68 footnote 2 | 0-4 | 5-9 | 10-14 | 15-19 | 20-24 | 25-29 | 30-34 | 35+ | All Years of ServiceTable 68 footnote 2 |
|---|---|---|---|---|---|---|---|---|---|
| To 24 | 3,453 | 11 | 3,464 | ||||||
| $56,910 | $77,234 | $56,975 | |||||||
| 25-29 | 9,350 | 865 | 13 | 10,228 | |||||
| $67,464 | $80,436 | $92,038 | $68,592 | ||||||
| 30-34 | 8,090 | 3,473 | 1,483 | 14 | 13,060 | ||||
| $72,015 | $84,494 | $91,162 | $94,823 | $77,532 | |||||
| 35-39 | 6,021 | 3,586 | 6,134 | 1,050 | 20 | 16,811 | |||
| $75,435 | $86,960 | $93,638 | $99,058 | $106,245 | $86,048 | ||||
| 40-44 | 4,425 | 2,562 | 5,782 | 5,041 | 909 | 26 | 18,745 | ||
| $76,912 | $88,158 | $94,824 | $104,544 | $105,781 | $121,798 | $92,867 | |||
| 45-49 | 3,462 | 1,852 | 4,052 | 5,039 | 3,306 | 552 | 51 | 18,314 | |
| $79,750 | $87,902 | $94,275 | $104,221 | $109,831 | $105,536 | $102,656 | $96,792 | ||
| 50-54 | 2,754 | 1,411 | 2,903 | 3,558 | 3,082 | 2,923 | 1,338 | 94 | 18,063 |
| $80,848 | $90,083 | $93,677 | $100,965 | $108,577 | $110,660 | $100,192 | $110,222 | $98,735 | |
| 55-59 | 2,201 | 1,158 | 2,353 | 2,843 | 2,381 | 2,974 | 2,678 | 1,295 | 17,883 |
| $83,722 | $89,078 | $91,691 | $98,938 | $103,158 | $106,721 | $101,730 | $94,397 | $97,419 | |
| 60-64 | 1,063 | 663 | 1,256 | 1,543 | 1,329 | 1,226 | 1,208 | 1,131 | 9,419 |
| $83,468 | $89,386 | $89,826 | $96,820 | $100,383 | $105,757 | $104,080 | $94,292 | $96,151 | |
| 65+ | 361 | 250 | 544 | 615 | 455 | 395 | 379 | 760 | 3,759 |
| $81,759 | $92,577 | $88,739 | $95,992 | $98,835 | $98,534 | $102,959 | $101,278 | $95,731 | |
| All Ages | 41,180 | 15,831 | 24,520 | 19,703 | 11,482 | 8,096 | 5,654 | 3,280 | 129,746 |
| $72,989 | $86,983 | $93,386 | $101,835 | $106,254 | $107,565 | $101,959 | $96,409 | $89,888 | |
Table 68 footnotes
|
|||||||||
| 31 March 2020 | 31 March 2017 | |
|---|---|---|
| Average ageTable 69 footnote 1: | 45.0 years | 45.2 years |
| Average pensionable serviceTable 69 footnote 1: | 12.2 years | 13.6 years |
| Annualized pensionable payrollTable 69 footnote 2: | $11,650 million | $9,504 million |
| Total PBDATable 69 footnote 3 indexed reduction to basic annuity: | $15,050,400 | $13,300,400 |
| Total PBDATable 69 footnote 3 indexed reduction adjustment: | $2,849,800 | $2,726,200 |
Table 69 footnotes
|
||
| AgeTable 70 footnote 2 | 0-4 | 5-9 | 10-14 | 15-19 | 20-24 | 25-29 | 30-34 | 35+ | All Years of ServiceTable 70 footnote 2 |
|---|---|---|---|---|---|---|---|---|---|
| To 24 | 4,644 | 4 | 4,648 | ||||||
| $55,241 | $74,944 | $55,258 | |||||||
| 25-29 | 13,185 | 1,146 | 12 | 14,343 | |||||
| $65,961 | $77,807 | $80,275 | $66,920 | ||||||
| 30-34 | 10,005 | 4,380 | 1,992 | 7 | 16,384 | ||||
| $69,268 | $81,320 | $85,827 | $72,198 | $74,505 | |||||
| 35-39 | 7,564 | 4,055 | 8,378 | 1,600 | 8 | 21,605 | |||
| $70,339 | $82,021 | $89,132 | $94,014 | $83,223 | $81,577 | ||||
| 40-44 | 5,830 | 3,106 | 8,041 | 7,627 | 1,275 | 8 | 25,887 | ||
| $70,277 | $81,101 | $89,270 | $97,408 | $98,632 | $108,791 | $86,877 | |||
| 45-49 | 4,535 | 2,339 | 5,569 | 6,653 | 4,578 | 771 | 50 | 24,495 | |
| $69,767 | $79,900 | $87,778 | $97,843 | $102,795 | $97,809 | $89,549 | $89,551 | ||
| 50-54 | 3,344 | 1,777 | 4,109 | 4,645 | 3,722 | 3,727 | 1,858 | 40 | 23,222 |
| $69,924 | $78,158 | $82,837 | $92,244 | $100,223 | $101,590 | $92,414 | $87,897 | $89,072 | |
| 55-59 | 2,331 | 1,410 | 3,102 | 3,732 | 2,907 | 3,081 | 2,525 | 530 | 19,618 |
| $70,281 | $75,283 | $78,760 | $86,062 | $89,454 | $96,827 | $94,474 | $84,064 | $85,479 | |
| 60-64 | 1,154 | 795 | 1,661 | 1,942 | 1,493 | 1,163 | 868 | 542 | 9,618 |
| $71,144 | $74,913 | $75,790 | $81,841 | $84,256 | $91,545 | $92,493 | $87,025 | $81,742 | |
| 65+ | 324 | 300 | 565 | 608 | 466 | 318 | 278 | 344 | 3,203 |
| $71,015 | $77,259 | $74,168 | $78,482 | $81,870 | $86,421 | $84,961 | $84,681 | $79,360 | |
| All Ages | 52,916 | 19,312 | 33,429 | 26,814 | 14,449 | 9,068 | 5,579 | 1,456 | 163,023 |
| $67,658 | $79,991 | $86,088 | $93,276 | $96,480 | $97,836 | $92,962 | $85,417 | $82,370 | |
Table 70 footnotes
|
|||||||||
| 31 March 2020 | 31 March 2017 | |
|---|---|---|
| Average ageTable 71 footnote 1: | 44.1 years | 44.5 years |
| Average pensionable serviceTable 71 footnote 1: | 11.4 years | 12.7 years |
| Annualized pensionable payrollTable 71 footnote 2: | $13,415 million | $10,250 million |
| Total PBDATable 71 footnote 3 indexed reduction to basic annuity: | $5,717,100 | $3,569,700 |
| Total PBDATable 71 footnote 3 indexed reduction adjustment: | $1,189,900 | $820,500 |
Table 71 footnotes
|
||
| AgeTable 72 footnote 2 | 0-4 | 5-9 | 10-14 | 15-19 | 20-24 | 25-29 | 30-34 | 35+ | All Years of ServiceTable 72 footnote 2 |
|---|---|---|---|---|---|---|---|---|---|
| To 24 | 105 | 105 | |||||||
| $67,947 | $67,947 | ||||||||
| 25-29 | 311 | 73 | 384 | ||||||
| $72,056 | $82,981 | $74,399 | |||||||
| 30-34 | 223 | 387 | 91 | 701 | |||||
| $73,661 | $84,462 | $86,031 | $81,230 | ||||||
| 35-39 | 154 | 334 | 509 | 35 | 1,032 | ||||
| $73,821 | $84,936 | $85,267 | $90,584 | $83,724 | |||||
| 40-44 | 117 | 213 | 498 | 337 | 59 | 1,224 | |||
| $73,239 | $83,031 | $86,523 | $86,914 | $86,646 | $84,759 | ||||
| 45-49 | 98 | 146 | 360 | 420 | 446 | 29 | 3 | 1,502 | |
| $71,303 | $82,319 | $85,884 | $88,659 | $89,950 | $95,567 | $83,328 | $86,751 | ||
| 50-54 | 59 | 82 | 216 | 225 | 347 | 171 | 63 | 1,163 | |
| $76,241 | $83,264 | $85,350 | $88,798 | $89,532 | $89,053 | $85,696 | $87,219 | ||
| 55-59 | 50 | 66 | 140 | 67 | 137 | 107 | 135 | 14 | 716 |
| $73,645 | $77,454 | $82,862 | $83,102 | $87,077 | $85,398 | $86,055 | $84,801 | $83,568 | |
| 60-64 | 37 | 36 | 47 | 42 | 49 | 43 | 47 | 16 | 317 |
| $74,118 | $73,298 | $79,753 | $83,846 | $87,121 | $92,928 | $86,542 | $91,287 | $83,419 | |
| 65+ | 6 | 13 | 22 | 15 | 7 | 6 | 8 | 13 | 90 |
| $83,699 | $83,622 | $88,078 | $90,962 | $85,195 | $101,889 | $63,612 | $91,192 | $86,595 | |
| All Ages | 1,160 | 1,350 | 1,884 | 1,141 | 1,046 | 356 | 256 | 43 | 7,236 |
| $72,690 | $83,321 | $85,489 | $87,757 | $89,089 | $89,169 | $85,323 | $89,146 | $84,108 | |
Table 72 footnotes
|
|||||||||
| 31 March 2020 | 31 March 2017 | |
|---|---|---|
| Average ageTable 73 footnote 1: | 44.5 years | 41.6 years |
| Average pensionable serviceTable 73 footnote 1: | 13.0 years | 11.3 years |
| Annualized pensionable payrollTable 73 footnote 2: | $608 million | $543 million |
| Total PBDATable 73 footnote 3 indexed reduction to basic annuity: | $349,200 | $615,800 |
| Total PBDATable 73 footnote 3 indexed reduction adjustment: | $84,800 | $159,000 |
Table 73 footnotes
|
||
| AgeTable 74 footnote 2 | 0-4 | 5-9 | 10-14 | 15-19 | 20-24 | 25-29 | 30-34 | 35+ | All Years of ServiceTable 74 footnote 2 |
|---|---|---|---|---|---|---|---|---|---|
| To 24 | 125 | 125 | |||||||
| $67,322 | $67,322 | ||||||||
| 25-29 | 422 | 36 | 458 | ||||||
| $70,716 | $80,023 | $71,448 | |||||||
| 30-34 | 272 | 296 | 85 | 653 | |||||
| $74,179 | $85,073 | $83,746 | $80,363 | ||||||
| 35-39 | 167 | 272 | 423 | 38 | 900 | ||||
| $72,490 | $86,642 | $87,610 | $88,928 | $84,666 | |||||
| 40-44 | 122 | 151 | 441 | 289 | 67 | 1,070 | |||
| $71,269 | $81,795 | $86,651 | $89,563 | $85,057 | $84,898 | ||||
| 45-49 | 119 | 118 | 270 | 277 | 402 | 51 | 1,237 | ||
| $69,523 | $79,860 | $83,901 | $88,616 | $89,535 | $79,957 | $84,902 | |||
| 50-54 | 78 | 97 | 148 | 117 | 241 | 141 | 44 | 866 | |
| $65,902 | $77,711 | $80,150 | $85,621 | $88,713 | $84,832 | $81,867 | $82,565 | ||
| 55-59 | 49 | 63 | 123 | 47 | 134 | 77 | 64 | 18 | 575 |
| $67,977 | $73,708 | $77,551 | $74,979 | $83,423 | $79,660 | $78,952 | $95,402 | $78,470 | |
| 60-64 | 19 | 28 | 44 | 26 | 23 | 24 | 22 | 8 | 194 |
| $62,211 | $74,710 | $73,353 | $72,949 | $78,645 | $80,959 | $68,960 | $90,070 | $74,163 | |
| 65+ | 7 | 11 | 19 | 10 | 3 | 5 | 55 | ||
| $66,825 | $83,666 | $73,450 | $73,414 | $68,521 | $85,086 | $82,660 | |||
| All Ages | 1,380 | 1,072 | 1,553 | 804 | 871 | 296 | 133 | 31 | 6,140 |
| $70,746 | $82,647 | $84,396 | $87,042 | $87,737 | $82,167 | $77,859 | $92,362 | $81,634 | |
Table 74 footnotes
|
|||||||||
| 31 March 2020 | 31 March 2017 | |
|---|---|---|
| Average ageTable 75 footnote 1: | 43.3 years | 40.8 years |
| Average pensionable serviceTable 75 footnote 1: | 11.9 years | 10.3 years |
| Annualized pensionable payrollTable 75 footnote 2: | $500 million | $428 million |
| Total PBDATable 75 footnote 3 indexed reduction to basic annuity: | $17,700 | $33,400 |
| Total PBDATable 75 footnote 3 indexed reduction adjustment: | $5,200 | $10,300 |
Table 75 footnotes
|
||
| AgeTable 76 footnote 2 | 0-4 | 5-9 | 10-14 | 15-19 | 20-24 | 25-29 | 30-34 | 35+ | All Years of ServiceTable 76 footnote 2 |
|---|---|---|---|---|---|---|---|---|---|
| To 24 | 694 | 694 | |||||||
| $47,235 | $47,235 | ||||||||
| 25-29 | 1,626 | 181 | 3 | 1,810 | |||||
| $62,449 | $75,152 | $79,630 | $63,748 | ||||||
| 30-34 | 2,300 | 1,305 | 455 | 4,060 | |||||
| $68,950 | $80,318 | $84,395 | $74,385 | ||||||
| 35-39 | 1,475 | 1,523 | 1,708 | 167 | 4,873 | ||||
| $70,221 | $80,562 | $86,816 | $89,260 | $79,922 | |||||
| 40-44 | 791 | 794 | 1,260 | 730 | 66 | 3,641 | |||
| $69,154 | $78,545 | $85,495 | $91,566 | $89,808 | $81,785 | ||||
| 45-49 | 496 | 457 | 682 | 653 | 306 | 47 | 2,641 | ||
| $67,000 | $75,330 | $81,599 | $88,520 | $92,668 | $89,353 | $81,004 | |||
| 50-54 | 415 | 328 | 444 | 501 | 314 | 277 | 93 | 2,372 | |
| $66,790 | $69,159 | $79,185 | $86,674 | $93,038 | $90,204 | $88,966 | $80,760 | ||
| 55-59 | 396 | 321 | 440 | 459 | 312 | 312 | 158 | 60 | 2,458 |
| $63,528 | $69,859 | $72,483 | $82,580 | $85,851 | $90,642 | $83,088 | $82,682 | $77,516 | |
| 60-64 | 220 | 219 | 304 | 256 | 142 | 146 | 69 | 45 | 1,401 |
| $62,284 | $65,684 | $69,866 | $75,531 | $84,404 | $83,553 | $84,150 | $76,083 | $72,860 | |
| 65+ | 229 | 193 | 220 | 207 | 131 | 115 | 84 | 125 | 1,304 |
| $74,148 | $69,810 | $81,128 | $78,797 | $78,843 | $88,014 | $98,538 | $96,742 | $80,853 | |
| All Ages | 8,642 | 5,321 | 5,516 | 2,975 | 1,271 | 899 | 406 | 231 | 25,261 |
| $65,723 | $77,217 | $82,747 | $86,297 | $88,589 | $88,997 | $88,048 | $89,102 | $76,836 | |
Table 76 footnotes
|
|||||||||
| 31 March 2020 | 31 March 2017 | |
|---|---|---|
| Average ageTable 77 footnote 1: | 43.4 years | 41.4 years |
| Average pensionable serviceTable 77 footnote 1: | 9.6 years | 9.4 years |
| Annualized pensionable payrollTable 77 footnote 2: | $1,941 million | $1,669 million |
| Total PBDATable 77 footnote 3 indexed reduction to basic annuity: | $1,303,300 | $719,800 |
| Total PBDATable 77 footnote 3 indexed reduction adjustment: | $52,800 | $174,400 |
Table 77 footnotes
|
||
| AgeTable 78 footnote 2 | Number | Pension ($) |
RCA No. 1 | RCA No. 2 | ||
|---|---|---|---|---|---|---|
| Number | Pension ($) |
Number | Pension ($) |
|||
| To 24 | 28 | 1,898 | - | - | - | - |
| 25-29 | 359 | 3,266 | - | - | - | - |
| 30-34 | 1,031 | 5,251 | - | - | - | - |
| 35-39 | 1,757 | 7,548 | - | - | - | - |
| 40-44 | 2,167 | 9,915 | 11 | 2,628 | - | - |
| 45-49 | 2,271 | 12,514 | 20 | 8,982 | - | - |
| 50-54 | 2,573 | 16,718 | 53 | 4,839 | - | - |
| 55-59 | 7,369 | 39,655 | 440 | 6,074 | - | - |
| 60-64 | 16,578 | 46,706 | 1,244 | 6,492 | - | - |
| 65-69 | 22,819 | 40,043 | 1,209 | 7,682 | - | - |
| 70-74 | 24,738 | 36,578 | 1,171 | 6,184 | 2,323 | 11,643 |
| 75-79 | 18,618 | 32,287 | 716 | 5,256 | 3,144 | 8,628 |
| 80-84 | 12,776 | 32,653 | 286 | 3,400 | 85 | 4,990 |
| 85-89 | 8,336 | 30,872 | 73 | 2,103 | - | - |
| 90-94 | 3,584 | 30,346 | 4 | 483 | - | - |
| 95-99 | 1,119 | 32,254 | - | 3 | - | - |
| 100-104 | 146 | 30,256 | - | - | - | - |
| 105+ | 3 | 34,372 | - | - | - | - |
| All Ages | 126,272 | 35,027 | 5,227 | 6,243 | 5,552 | 9,833 |
Table 78 footnotes
|
||||||
| 31 March 2020 | 31 March 2017 | |
|---|---|---|
| Average age | 70.3 years | 69.3 years |
| Average age at termination | 56.0 years | 55.6 years |
| Average age at entitlement | 58.9 years | 58.3 years |
| Total annual pensions payable from | ||
| PS Superannuation Account | $3,026 million | $3,036 million |
| PS Pension Fund | 1,397 million | 1,013 million |
| RCA No. 1 Account | 33 million | 25 million |
| RCA No. 2 Account | 55 million | 55 million |
| AgeTable 80 footnote 2 | Number | Pension ($) |
RCA No. 1 | RCA No. 2 | ||
|---|---|---|---|---|---|---|
| Number | Pension ($) |
Number | Pension ($) |
|||
| To 24 | 41 | 1,775 | - | - | - | - |
| 25-29 | 396 | 3,092 | - | - | - | - |
| 30-34 | 1,292 | 4,743 | - | - | - | - |
| 35-39 | 2,192 | 6,745 | - | 2,904 | - | - |
| 40-44 | 2,880 | 9,060 | 7 | 1,220 | - | - |
| 45-49 | 2,879 | 11,357 | 13 | 3,843 | - | - |
| 50-54 | 2,979 | 15,262 | 44 | 3,387 | - | - |
| 55-59 | 10,612 | 37,533 | 437 | 4,749 | - | - |
| 60-64 | 21,986 | 51,944 | 1,232 | 4,654 | - | - |
| 65-69 | 24,937 | 36,601 | 830 | 5,753 | - | - |
| 70-74 | 19,672 | 24,573 | 367 | 7,108 | 1,580 | 9,857 |
| 75-79 | 11,323 | 18,188 | 139 | 6,140 | 2,068 | 7,414 |
| 80-84 | 7,246 | 16,896 | 37 | 4,216 | 46 | 4,622 |
| 85-89 | 4,736 | 15,323 | 4 | 594 | - | - |
| 90-94 | 2,383 | 14,721 | - | - | - | - |
| 95-99 | 1,038 | 15,593 | - | - | - | - |
| 100-104 | 147 | 15,673 | - | - | - | - |
| 105+ | 13 | 17,384 | - | - | - | - |
| All Ages | 116,752 | 26,536 | 3,110 | 5,278 | 3,694 | 8,424 |
Table 80 footnotes
|
||||||
| 31 March 2020 | 31 March 2017 | |
|---|---|---|
| Average age | 66.9 years | 65.7 years |
| Average age at termination | 55.2 years | 54.7 years |
| Average age at entitlement | 58.8 years | 58.3 years |
| Total annual pensions payable from | ||
| PS Superannuation Account | $1,726 million | $1,598 million |
| PS Pension Fund | 1,372 million | 965 million |
| RCA No. 1 Account | 17 million | 12 million |
| RCA No. 2 Account | 31 million | 31 million |
| AgeTable 82 footnote 2 | Number | Pension ($) |
RCA No. 1 | |
|---|---|---|---|---|
| Number | Pension ($) |
|||
| To 24 | - | - | - | - |
| 25-29 | - | - | - | - |
| 30-34 | 5 | 8,818 | - | - |
| 35-39 | 36 | 9,278 | - | - |
| 40-44 | 79 | 12,567 | - | - |
| 45-49 | 174 | 14,348 | - | - |
| 50-54 | 364 | 18,737 | 3 | 13,336 |
| 55-59 | 814 | 22,063 | 8 | 2,019 |
| 60-64 | 914 | 21,244 | 9 | 6,998 |
| 65-69 | 955 | 20,168 | 8 | 602 |
| 70-74 | 853 | 19,117 | - | - |
| 75-79 | 578 | 18,267 | - | - |
| 80-84 | 455 | 19,672 | - | - |
| 85-89 | 266 | 19,048 | - | - |
| 90-94 | 84 | 18,488 | - | - |
| 95-99 | 29 | 22,196 | - | - |
| 100-104 | 3 | 13,232 | - | - |
| 105+ | - | - | - | - |
| All Ages | 5,609 | 19,690 | 28 | 4,427 |
Table 82 footnotes
|
||||
| 31 March 2020 | 31 March 2017 | |
|---|---|---|
| Average age | 67.1 years | 66.6 years |
| Average age at disability | 50.6 years | 50.2 years |
| Total annual pensions payable from | ||
| Superannuation Account | $72 million | $85 million |
| Pension Fund | 39 million | 31 million |
| RCA Account | 0 million | 0 million |
| AgeTable 84 footnote 2 | Number | Pension ($) |
RCA No. 1 | |
|---|---|---|---|---|
| Number | Pension ($) |
|||
| To 24 | - | - | - | - |
| 25-29 | n/a | n/a | - | - |
| 30-34 | 13 | 5,045 | - | - |
| 35-39 | 99 | 9,383 | - | - |
| 40-44 | 284 | 12,366 | - | - |
| 45-49 | 558 | 14,729 | - | 1,449 |
| 50-54 | 917 | 18,040 | 5 | 1,831 |
| 55-59 | 1,814 | 21,134 | 10 | 9,463 |
| 60-64 | 2,077 | 19,554 | 18 | 3,257 |
| 65-69 | 1,553 | 17,997 | 6 | 872 |
| 70-74 | 1,070 | 15,349 | 3 | 2,118 |
| 75-79 | 612 | 12,625 | - | - |
| 80-84 | 481 | 12,200 | - | - |
| 85-89 | 271 | 11,823 | - | - |
| 90-94 | 103 | 11,122 | - | - |
| 95-99 | 44 | 11,466 | - | - |
| 100-104 | 4 | 7,491 | - | - |
| 105+ | n/a | n/a | - | - |
| All Ages | 9,904 | 17,276 | 42 | 4,177 |
Table 84 footnotes
|
||||
| 31 March 2020 | 31 March 2017 | |
|---|---|---|
| Average age | 63.4 years | 62.5 years |
| Average age at disability | 49.9 years | 49.4 years |
| Total annual pensions payable from | ||
| Superannuation Account | $89 million | $98 million |
| Pension Fund | 82 million | 64 million |
| RCA Account | 0 million | 0 million |
| AgeTable 86 footnote 1 | Number | Allowance | RCA No. 1 | |||||
|---|---|---|---|---|---|---|---|---|
| Allowance on Service Since 1992 |
Maximum Earnings Limit on Service Since 1994 | |||||||
| Widower | Widow | Number | Allowance | Number | Allowance | |||
| To 24 | n/a | n/a | n/a | n/a | n/a | - | ||
| 25-29 | 4 | 4 | 8,467 | n/a | n/a | - | ||
| 30-34 | 3 | 14 | 6,959 | n/a | n/a | - | ||
| 35-39 | 18 | 50 | 8,657 | 4 | 1,000 | - | ||
| 40-44 | 44 | 84 | 9,377 | 10 | 1,687 | - | ||
| 45-49 | 101 | 186 | 10,914 | 27 | 1,901 | - | ||
| 50-54 | 208 | 356 | 12,624 | 48 | 2,531 | - | ||
| 55-59 | 395 | 902 | 13,845 | 211 | 1,946 | - | ||
| 60-64 | 700 | 1,777 | 15,491 | 512 | 1,329 | - | ||
| 65-69 | 909 | 3,157 | 16,930 | 1,048 | 1,214 | - | ||
| 70-74 | 1,258 | 4,811 | 16,432 | 2,063 | 1,243 | - | ||
| 75-79 | 1,057 | 5,698 | 16,429 | 2,345 | 1,014 | - | ||
| 80-84 | 979 | 6,860 | 16,008 | 1,853 | 844 | - | ||
| 85-89 | 723 | 7,459 | 15,625 | 1,074 | 724 | - | ||
| 90-94 | 401 | 5,964 | 15,482 | 365 | 674 | - | ||
| 95-99 | 127 | 2,936 | 15,141 | 68 | 652 | - | ||
| 100-104 | 18 | 449 | 15,008 | 4 | 808 | - | ||
| 105+ | - | 20 | 12,572 | n/a | n/a | - | ||
| All Ages | 6,947 | 40,730 | 15,808 | 9,637 | 1,052 | - | ||
Table 86 footnotes
|
||||||||
| 31 March 2020 | 31 March 2017 | |
|---|---|---|
| Male average age | 73.6 years | 71.7 years |
| Female average age | 80.6 years | 79.6 years |
| Total annual pensions payable from | ||
| Superannuation Account | $689 million | $658 million |
| Pension Fund | 65 million | 24 million |
| RCA Account | 0 million | 0 million |
Appendix M - Acknowledgements
The Superannuation Directorate of the Department of Public Services and Procurement Canada provided the data on plan members.
The co-operation and able assistance received from the above-mentioned data provider deserve to be acknowledged.
The following individuals assisted in the preparation of this report:
- Linda Benjauthrit, ACIA, ASA
- Yann Bernard, FCIA, FSA
- François Boulé, FCIA, FSA
- Maxime Delisle, FCIA, FSA, CERA
- Mathieu Désy, FCIA, FSA, CFA
- Christopher Dieterle, FCIA, FSA
- Ayoub Ezzahouri
- Daniel Hébert, FCIA, FSA
- François Lemire, FCIA, FSA
- Guillaume Lepine-Mathieu, ACIA, ASA
- Mieke Steenbakker Lucuik
- Kelly Moore
Footnotes
- Footnote 1
-
Any reference to a given plan year in this report should be taken as the 12-month period ending 31 March of the given year.
- Footnote 2
-
The actuarial liability for service prior to April 1, 2000 refers to the actuarial liability for service accrued prior to that date except for service elections made on or after April 1, 2000. Service elections made on or after 1 April 2000 are deemed to be service accrued since that date.
- Footnote 3
-
Also called normal cost.
- Footnote 4
-
Pensionable payroll means the aggregate of pensionable earnings of all contributors with less than 35 years of service.
- Footnote 5
-
Members who entered the PSPP prior to 1 January 2013.
- Footnote 6
-
Members who entered the PSPP on or after 1 January 2013.
- Footnote 7
-
Any reference to member in this report should be read as contributor as defined in the PSSA.
- Footnote 8
-
The plans refer to the Pension Plans for the Public Service of Canada, the Canadian Forces – Regular Force and Reserve Force and the Royal Canadian Mounted Police.
- Footnote 9
-
A non-permitted surplus exists when the amount by which the assets exceed the liabilities is greater than 25 percent of the amount of liabilities.
- Footnote 10
-
Members who entered the PSPP prior to 1 January 2013.
- Footnote 11
-
Members who entered the PSPP on or after 1 January 2013.
- Footnote 12
-
If the number of years of pensionable service is less than five, then the averaging is over the entire period of pensionable service.
- Footnote 13
-
Indexed CPP annual pensionable earnings means the average of the YMPE, as defined in the CPP, over the five calendar years leading up to and including the one in which pensionable service terminated, increased by indexation proportionate to that accrued in respect of the immediate annuity.
- Footnote 14
-
Years of CPP pensionable service mean the number of years of PSSA pensionable service after 1965 or after attaining age 18, whichever is later, but not exceeding 35.
- Footnote 15
-
For privatized members who elected not to transfer their PSSA benefits to their new employer’s pension plan, service (including any operational) with the new employer is included.
- Footnote 16
-
Under Section 42 (1) (b) of the Public Service Superannuation Act, rates may be prescribed by Regulations. The interest rates are defined under Section 46 (2) (a) of the Public Service Superannuation Regulations.
- Footnote 17
-
As described in Appendix A.2.2.2 Elected Prior Service.
- Footnote 18
-
For the determination of member contribution rates, the benefits for operational service were excluded. As a result, the government contributions are slightly higher than member contributions.
- Footnote 19
-
Or becomes entitled to a disability pension from the CPP or the QPP.
- Footnote 20
-
Note that all of the real rates presented in this report are actual differentials, i.e. the difference between the effective annual rate and the rate of increase in prices. This differs from the technical definition of a real rate of return, which, for example in the case of the ultimate Pension Fund assumption would be 3.8% (derived from 1.059/1.020) rather than 3.9%.
- Footnote 21
- Footnote 22
-
The spreads for the first year are based on the average spreads for plan year 2021 of -20, 12 and -61 basis points between 10-year-plus Government of Canada bond yield and the bonds underlying rL, iL and i7 respectively. The ultimate spreads of 36, -8 and -64 basis points (starting in plan year 2034) are based on the average spreads over the last 10 years. The spreads for S1-10 and S10+ are assumed to be 1.0% and 1.3%, respectively. An interpolation reflecting the variation in new money rates is applied for intermediate years.
- Footnote 23
-
Valuation salary for contributors and adjusted salary at retirement for pensioners.
- Footnote 24
-
Cohort life expectancies take into account assumed future improvements in mortality and therefore differ from calendar year life expectancies, which are based on the mortality rates of the given attained year.
- Footnote 25
-
The eligible survivor is defined in Section A.4.11.
- Footnote 26
-
It is assumed that any non-permitted surplus would be withdrawn from the Pension Fund.