Old Age Security Program Mortality Experience: Actuarial Study No. 23 - Highlights
Accessibility statement
The Web Content Accessibility Guidelines (WCAG) defines requirements for designers and developers to improve accessibility for people with disabilities. It defines three levels of conformance: Level A, Level AA, and Level AAA. This report is partially conformant with WCAG 2.0 level AA. If you require a compliant version, please contact webmaster@osfi-bsif.gc.ca.
Life Expectancy at Age 65
In 2019, the life expectancies at age 65 for OAS beneficiaries are 19.4 years for males and 22.2 years for females. These are 3.3 years and 2.3 years higher than the corresponding life expectancies observed in 1999. The gap in life expectancies between females and males decreased from 3.8 years in 1999 to 2.8 years in 2019.
The growth in life expectancy of one month per year over the period from 2015 to 2019 has been lower than the two months per year experienced over the previous 15 years period 2000-2014. Similar trends have been observed in the United States and in the United Kingdom.
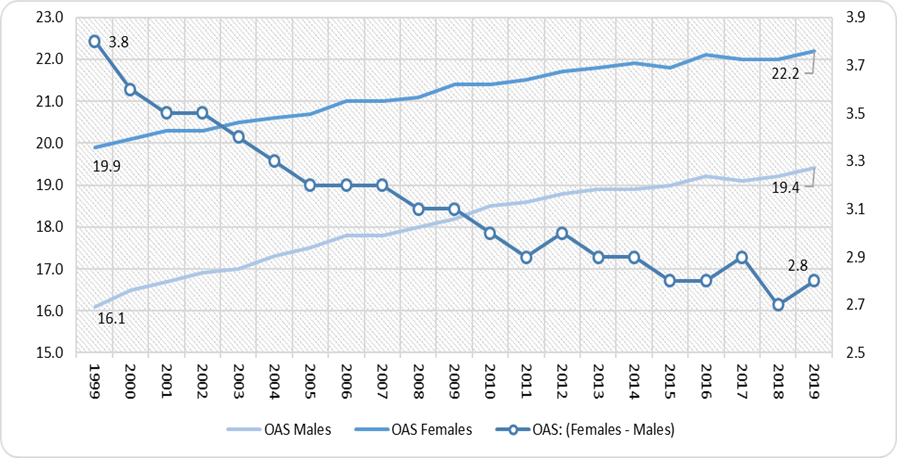
Chart Description
One line chart with two Y axis. The left Y axis showing the life expectancy at age 65 for males and females and the right Y axis showing the difference in life expectancy at age 65 between females and males. The X axis shows the year.
For the lines linked to the left Y axis.
For year 1999, the life expectancy at age 65, was 16.1 years for males and 19.9 years for females.
For year 2004, the life expectancy at age 65, was 17.3 years for males and 20.6 years for females.
For year 2009, the life expectancy at age 65, was 18.2 years for males and 21.4 years for females.
For year 2014, the life expectancy at age 65, was 18.9 years for males and 21.9 years for females.
For year 2019, the life expectancy at age 65, was 19.4 years for males and 22.2 years for females.
For the line linked to the right Y axis.
For year 1999, the difference in life expectancy at age 65 between females and males was 3.8 years.
For year 2004, the difference in life expectancy at age 65 between females and males was 3.3 years.
For year 2009, the difference in life expectancy at age 65 between females and males was 3.2 years.
For year 2014, the difference in life expectancy at age 65 between females and males was 3.0 years.
For year 2019, the difference in life expectancy at age 65 between females and males was 2.8 years.
Life Expectancy at Age 65 by Type of Benefit
Over the last 20 years, for those receiving GIS benefits, males have seen their life expectancy increase by 2.9 years (14.5 to 17.4) while it has increased by 1.9 years for females (18.8 to 20.7). In comparison, for those not receiving GIS benefits, male life expectancy has increased by 3.4 years (16.9 to 20.3) while it has increased by 2.4 years(20.8 to 23.2) for females.
From 1999 to 2019, the gap between those not receiving the GIS and those receiving the GIS has increased from 2.4 years to 2.9 years for males and from 2.1 to 2.5 years for females.
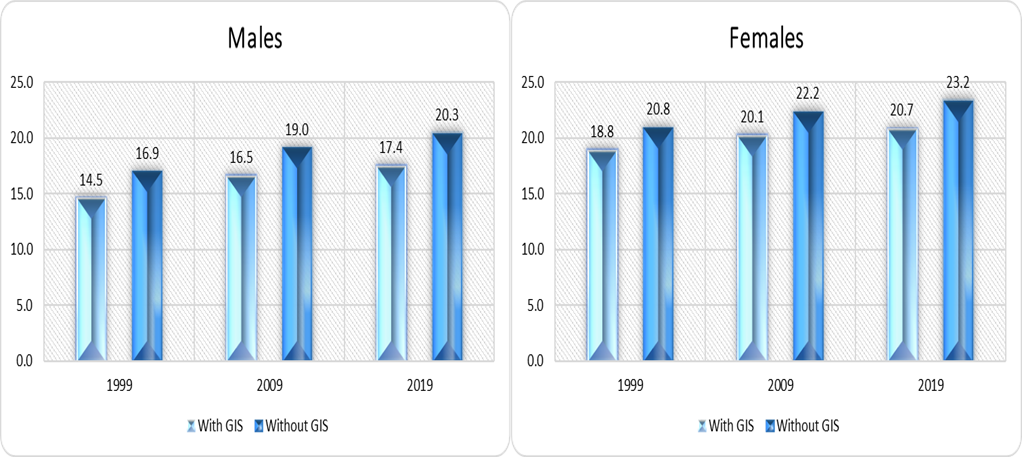
Chart Description
Two vertical bar charts. Chart 2(i) (left chart) showing the life expectancy at age 65 for males by type of benefit and Chart 2 (ii) (right chart) showing the life expectancy at age 65 for females by type of benefit. For both charts, the Y axis shows the life expectancy at age 65 and the X axis shows the years 1999, 2009 and 2019.
Chart 2(i)
For year 1999, the males’ life expectancy at age 65 for OAS beneficiaries with GIS was 14.5 years and 16.9 years for OAS beneficiaries without GIS.
For year 2009, the males’ life expectancy at age 65 for OAS beneficiaries with GIS was 16.5 years and 19.0 years for OAS beneficiaries without GIS.
For year 2019, the males’ life expectancy at age 65 for OAS beneficiaries with GIS was 17.4 years and 20.3 years for OAS beneficiaries without GIS.
Chart 2(ii)
For year 1999, the females’ life expectancy at age 65 for OAS beneficiaries with GIS was 18.8 years and 20.8 years for OAS beneficiaries without GIS.
For year 2009, the females’ life expectancy at age 65 for OAS beneficiaries with GIS was 20.1 years and 22.2 years for OAS beneficiaries without GIS.
For year 2019, the females’ life expectancy at age 65 for OAS beneficiaries with GIS was 20.7 years and 23.2 years for OAS beneficiaries without GIS.
Life Expectancy at Age 65 by Type and Marital Status
In 2019, the life expectancies at age 65 are 20.7 years for married males and 16.8 years for single males. The corresponding life expectancies at age 65 for married and single females are 23.6 years and 21.1 years.
The gap in life expectancies at age 65 between married and single beneficiaries which had remained relatively stable up to 2013, has increased in recent years. In 2005, the differential by marital status for males was 3.8 years while the differential for females was 2.1 years. In 2019, the differentials between married and single beneficiaries are 3.9 years and 2.3 years for males and females, respectively.
In 2019, middle to high income married female seniors not in receipt of GIS are expected to receive their benefits for almost nine years more than low-income single male seniors in receipt of GIS (15.3 vs. 24.1 years).
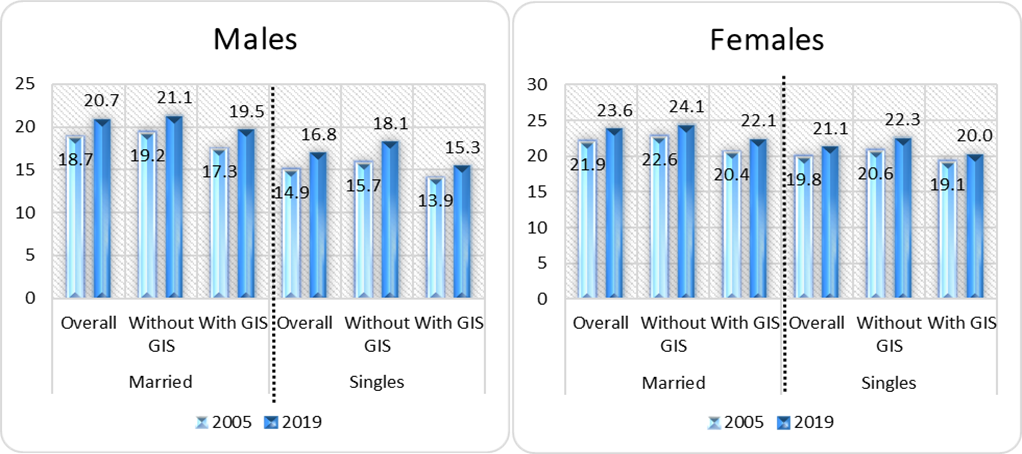
Chart Description
Two vertical bar charts. Chart 3(i) (left chart) showing the life expectancy at age 65 for males by type of benefit and marital status. Chart 3(ii) (right chart) showing the life expectancy at age 65 for females by type of benefit and marital status. For both charts, the Y axis shows the life expectancy at age 65 and the X axis shows the years 2005 and 2019.
Chart 3 (i)
For married males, the overall life expectancy at age 65 was 18.7 years in 2005 and 20.7 years in 2019.
For married males without GIS, the life expectancy at age 65 was 19.2 years in 2005 and 21.1 years in 2019.
For married males with GIS, the life expectancy at age 65 was 17.3 years in 2005 and 19. 5 years in 2019.
For single males, the overall life expectancy at age 65 was 14.9 years in 2005 and 16.8 years in 2019.
For single males without GIS, the life expectancy at age 65 was 15.7 years in 2005 and 18.1 years in 2019.
For single males with GIS, the life expectancy at age 65 was 13.9 years in 2005 and 15.3 years in 2019.
Chart 3 (ii)
For married females, the overall life expectancy at age 65 was 21.9 years in 2005 and 23.6 years in 2019.
For married females without GIS, the life expectancy at age 65 was 22.6 years in 2005 and 24.1 years in 2019.
For married females with GIS, the life expectancy at age 65 was 20.4 years in 2005 and 22.1 years in 2019.
For single females, the overall life expectancy at age 65 was 19.8 years in 2005 and 21.1 years in 2019.
For single females without GIS, the life expectancy at age 65 was 20.6 years in 2005 and 22.3 years in 2019.
For single females with GIS, the life expectancy at age 65 was 19.1 years in 2005 and 20.0 years in 2019.
Life Expectancy at Age 65 by Place of Birth
In 1999, the differential by place of birth was 1.5 years for males and 0.9 of a year for females. In 2019, the differential by place of birth for both males and females is about 2.2 years.
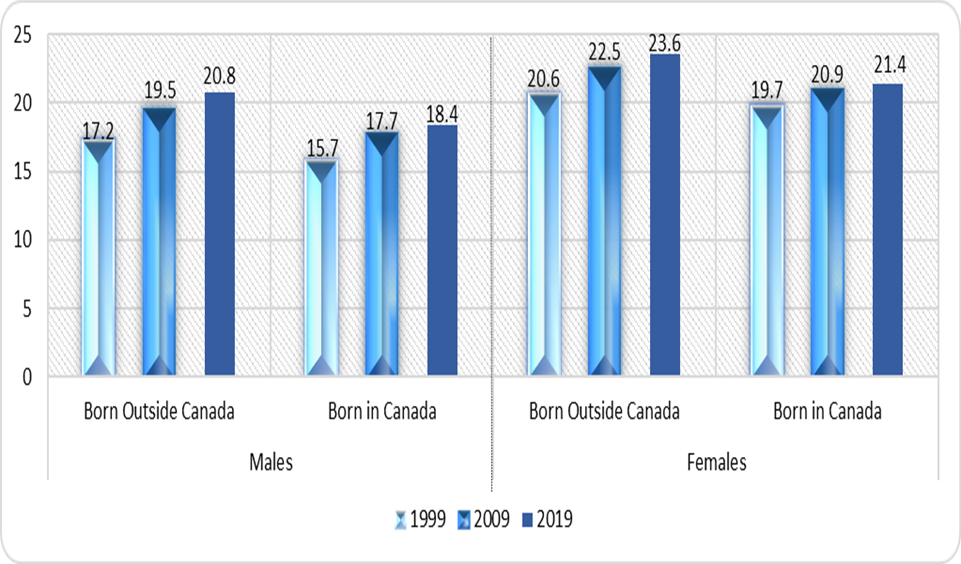
Chart Description
One vertical bar chart. The chart is showing the life expectancy at age 65 by place of birth. Chart 4(i) (left portion of the chart) is for males and Chart 4 (ii) (right portion of the chart) is for females. The Y axis shows the life expectancy at age 65 and the X axis shows the years 1999, 2009 and 2019.
Chart 4(i)
For males born outside Canada, the life expectancy at age 65 was 17.2 years in 1999, 19.5 years in 2009 and 20.8 years in 2019.
For males born in Canada, the life expectancy at age 65 was 15.7 years in 1999, 17.7 years in 2009 and 18.4 years in 2019.
Chart 4(ii)
For females born outside Canada, the life expectancy at age 65 was 20.6 years in 1999, 22.5 years in 2009 and 23.6 years in 2019.
For females born in Canada, the life expectancy at age 65 was 19.7 years in 1999, 20.9 years in 2009 and 21.4 years in 2019.
Average Annual Mortality Improvement Rates
The average annual mortality improvement rate for males in the age group 65 to 74 over the period 2000 to 2014 has been 2.7%, and this compares to 1.9% for females. In both cases, the rate was 1.0% over the 2015 to 2019 period.
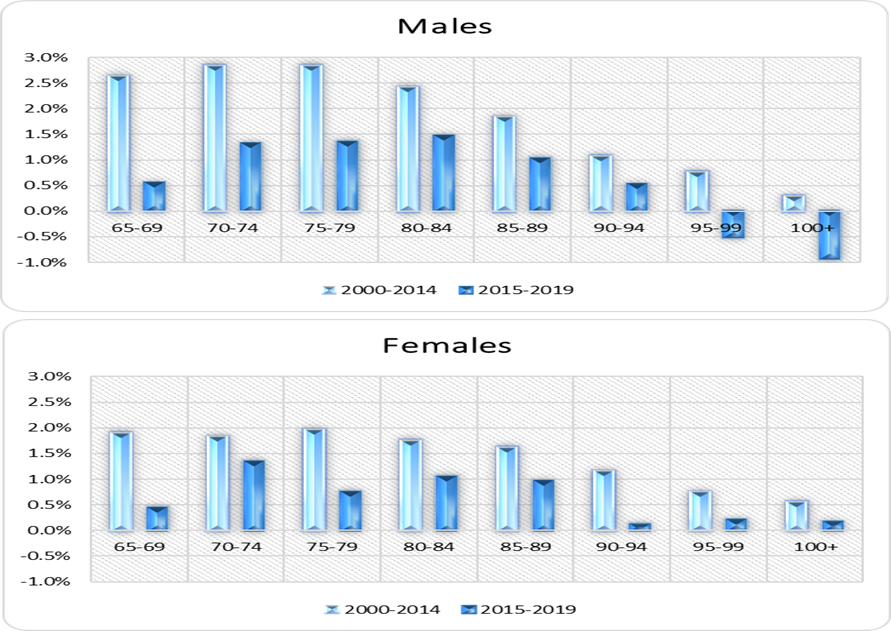
Chart Description
Two vertical bar charts showing the average mortality improvement rates over the periods 2000-2014 and 2015-2019. Chart 5(i) (top chart) are male mortality improvement rates and Chart 5(ii) (bottom chart) for female mortality improvement rates. The Y axis shows the average level of the mortality improvement rates and the X axis shows by age-group.
Chart 5(i)
For age-group 65-69, the male mortality improvement rates over the period 2000-2014 was 2.6% and 0.6% over the period from 2015-2019.
For age-group 70-74, the male mortality improvement rates over the period 2000-2014 was 2.8% and 1.3% over the period from 2015-2019.
For age-group 75-79, the male mortality improvement rates over the period 2000-2014 was 2.8% and 1.4% over the period from 2015-2019.
For age-group 80-84, the male mortality improvement rates over the period 2000-2014 was 2.4% and 1.5% over the period from 2015-2019.
For age-group 85-89, the male mortality improvement rates over the period 2000-2014 was 1.8% and 1.0% over the period from 2015-2019.
For age-group 90-94, the male mortality improvement rates over the period 2000-2014 was 1.1% and 0.5% over the period from 2015-2019.
For age-group 95-99, the male mortality improvement rates over the period 2000-2014 was 0.8% and -0.5% over the period from 2015-2019.
Chart 5(ii)
For age-group 65-69, the female mortality improvement rates over the period 2000-2014 was 1.9% and 0.4% over the period from 2015-2019.
For age-group 70-74, the female mortality improvement rates over the period 2000-2014 was 1.8% and 1.3% over the period from 2015-2019.
For age-group 75-79, the female mortality improvement rates over the period 2000-2014 was 2.0% and 0.8% over the period from 2015-2019.
For age-group 80-84, the female mortality improvement rates over the period 2000-2014 was 1.7% and 1.1% over the period from 2015-2019.
For age-group 85-89, the female mortality improvement rates over the period 2000-2014 was 1.6% and 1.0% over the period from 2015-2019.
For age-group 90-94, the female mortality improvement rates over the period 2000-2014 was 1.1% and 0.1% over the period from 2015-2019.
For age-group 95-99, the female mortality improvement rates over the period 2000-2014 was 0.7% and 0.2% over the period from 2015-2019.