Domestic Stability Buffer - Decision Summary Note
Information
Table of contents
Overview
- Today, OSFI announced that the Domestic Stability Buffer (DSB) will increase by 0.5% to 3.5% of total risk-weighted assets, effective November 1, 2023.
- The DSB is an important policy tool that contributes to the stability of Canada’s financial system. It helps ensure that Canada’s domestic systemically important banks (D-SIBs) build up a capital buffer as vulnerabilities grow so that it can be used during periods of stress.
- The decision to increase the DSB reflects OSFI’s assessment of elevated and rising systemic vulnerabilities, coupled with stable near-term risks.
- The DSB may increase if vulnerabilities persist or grow further. OSFI also stands ready to reduce the DSB swiftly if necessary to support the resilience of the financial system.
Background
DSB decisions are based on OSFI’s assessment of a wide range of quantitative and qualitative information related to vulnerabilities and risks, as well as results from recent stress tests and supervisory judgment. OSFI uses several indicators to inform its vulnerability and risk assessments. These are based on a combination of publicly available and supervisory data. This set of indicators is not exhaustive and may evolve as the economic and risk environment changes. There is also no mechanical link between any indicator and the changes to the DSB. See the Appendix for additional background on the DSB design framework and indicators used to inform decisions.
Supporting rationale
On balance, OSFI assesses that vulnerabilities remain elevated and rising. The current high interest rate environment has made highly indebted households and corporates more vulnerable to shocks. This is reflected in a steady increase in Canadian household debt service ratios in recent quarters, driven by higher interest rates, as principal payments have declined. Based on supervisory filing data, approximately 12% of uninsured mortgage borrowers are only covering interest payments or are negatively amortizing given impacts to variable rate fixed payment loans. This is also reflected in sharply rising debt service ratios on new mortgage originations. Vulnerabilities to highly-indebted corporates in higher-risk sectors remain a concern, particularly where liquid asset buffers have not grown as quickly.
Housing and commercial real estate market concerns have persisted as valuations remain high coupled with a pick-up in housing market activity. House prices have begun to rise again in recent months as the supply of new listings and inventory remain near historical lows. External vulnerabilities also continue to pose a threat because of elevated global debt levels and increased uncertainty around fiscal and monetary policy. Global central banks are committed to bringing inflation down; however, considerable uncertainty on the future path remains.
Near-term risks to D-SIB capital levels are currently assessed to be low and stable. D-SIB common equity tier 1 leverage and liquidity ratios are comfortably above minimum requirements based on recent reporting data. Operating performance remains solid despite some uptick in performing provisions. Loan delinquencies remain near historically low levels and net interest margins appear to be stabilizing.
The risk environment is expected to be characterized by heightened uncertainty as the effects of higher interest rates take hold, with risks to growth skewed to the downside. Canadian macroeconomic conditions remain supportive of an increase in the DSB, with the unemployment rate near its record low and GDP growth remaining positive. At the same time, financial market conditions have calmed after recent bouts of volatility associated with banking concerns in the US and Switzerland.
Appendix
The DSB is intended to address vulnerabilities that are cyclical, measurable, and have a system-wide impact. The main indicators used to inform the decision to adjust the DSB level, relate to Canadian household and corporate indebtedness, asset market imbalances, as well as external and related factors such as inflation, debt servicing costs and global debt levels. These systemic vulnerabilities are assessed and weighed against the potential materialization of losses to D-SIBs in the near term. For near-term risks, OSFI monitors recent and leading indicators of D-SIB financial performance, as well as economic and financial market conditions. These include D-SIB capital ratios, expected credit losses, impaired loans, the unemployment rate, and market volatility.
Core vulnerability indicators used to inform the DSB stance
Canadian Housedhold Indebtedness
- Household debt levels and serviceability
Canadian Asset Imbalances
- Housing and CRE price levels and valuations
Canadian Institutional Indebtedness
- Corporate debt levels and serviceability
- Sovereign debt levels
External Systemic Vulnerabilities
- Global debt levels
- Economic policy uncertainty
Near-Term Risk Materialization indicators used to inform the DSB stance
D-SIB financial performance - recent trends
- Capital ratios
- Credit losses and impairments
D-SIB financial performance - leading indicators
- Near-term outlook
- Market-based risk indicators
Labour Market and Economic Indicators
- Unemployment rate
- Consumer / Business Insolvencies
Financial market and liquidity conditions
- Market, funding and counterparty stress
Trends in Selected Vulnerability Indicators
Source: Statistics Canada
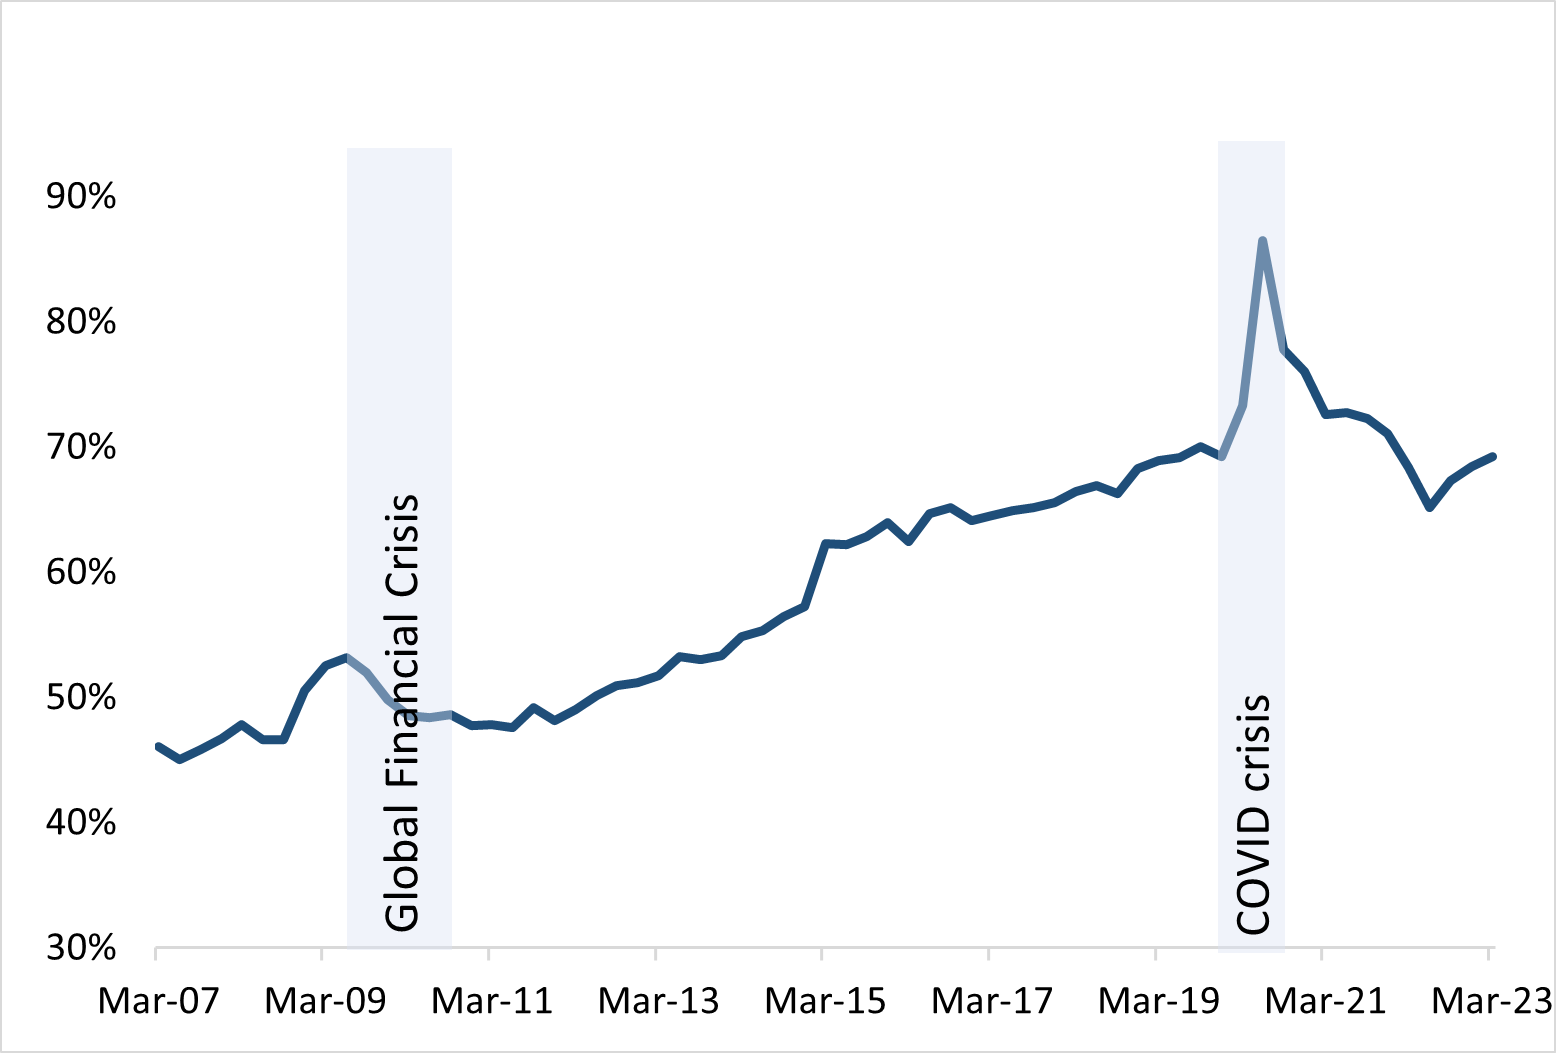
Canadian Household Debt-to-Income Ratio - text description
| Date | Debt-to income % |
|---|---|
| March 2007 | 142 |
| June 2007 | 147 |
| September 2007 | 151 |
| December 2007 | 152 |
| March 2008 | 153 |
| June 2008 | 154 |
| September 2008 | 154 |
| December 2008 | 157 |
| March 2009 | 160 |
| June 2009 | 162 |
| September 2009 | 162 |
| December 2009 | 164 |
| March 2010 | 162 |
| June 2010 | 167 |
| September 2010 | 166 |
| December 2010 | 166 |
| March 2011 | 167 |
| June 2011 | 169 |
| September 2011 | 170 |
| December 2011 | 168 |
| March 2012 | 169 |
| June 2012 | 170 |
| September 2012 | 170 |
| December 2012 | 170 |
| March 2013 | 168 |
| June 2013 | 169 |
| September 2013 | 170 |
| December 2013 | 170 |
| March 2014 | 170 |
| June 2014 | 171 |
| September 2014 | 170 |
| December 2014 | 172 |
| March 2015 | 170 |
| June 2015 | 171 |
| September 2015 | 172 |
| December 2015 | 175 |
| March 2016 | 181 |
| June 2016 | 181 |
| September 2016 | 181 |
| December 2016 | 181 |
| March 2017 | 183 |
| June 2017 | 182 |
| September 2017 | 181 |
| December 2017 | 181 |
| March 2018 | 183 |
| June 2018 | 184 |
| September 2018 | 185 |
| December 2018 | 183 |
| March 2019 | 183 |
| June 2019 | 181 |
| September 2019 | 182 |
| December 2019 | 181 |
| March 2020 | 181 |
| June 2020 | 162 |
| September 2020 | 173 |
| December 2020 | 177 |
| March 2021 | 175 |
| June 2021 | 176 |
| September 2021 | 179 |
| December 2021 | 185 |
| March 2022 | 180 |
| June 2022 | 182 |
| September 2022 | 185 |
| December 2022 | 181 |
| March 2023 | 185 |
Global Financial Crisis: September 2008 to May 2009
COVID crisis: March 2020 to May 2020
Source: Statistics Canada
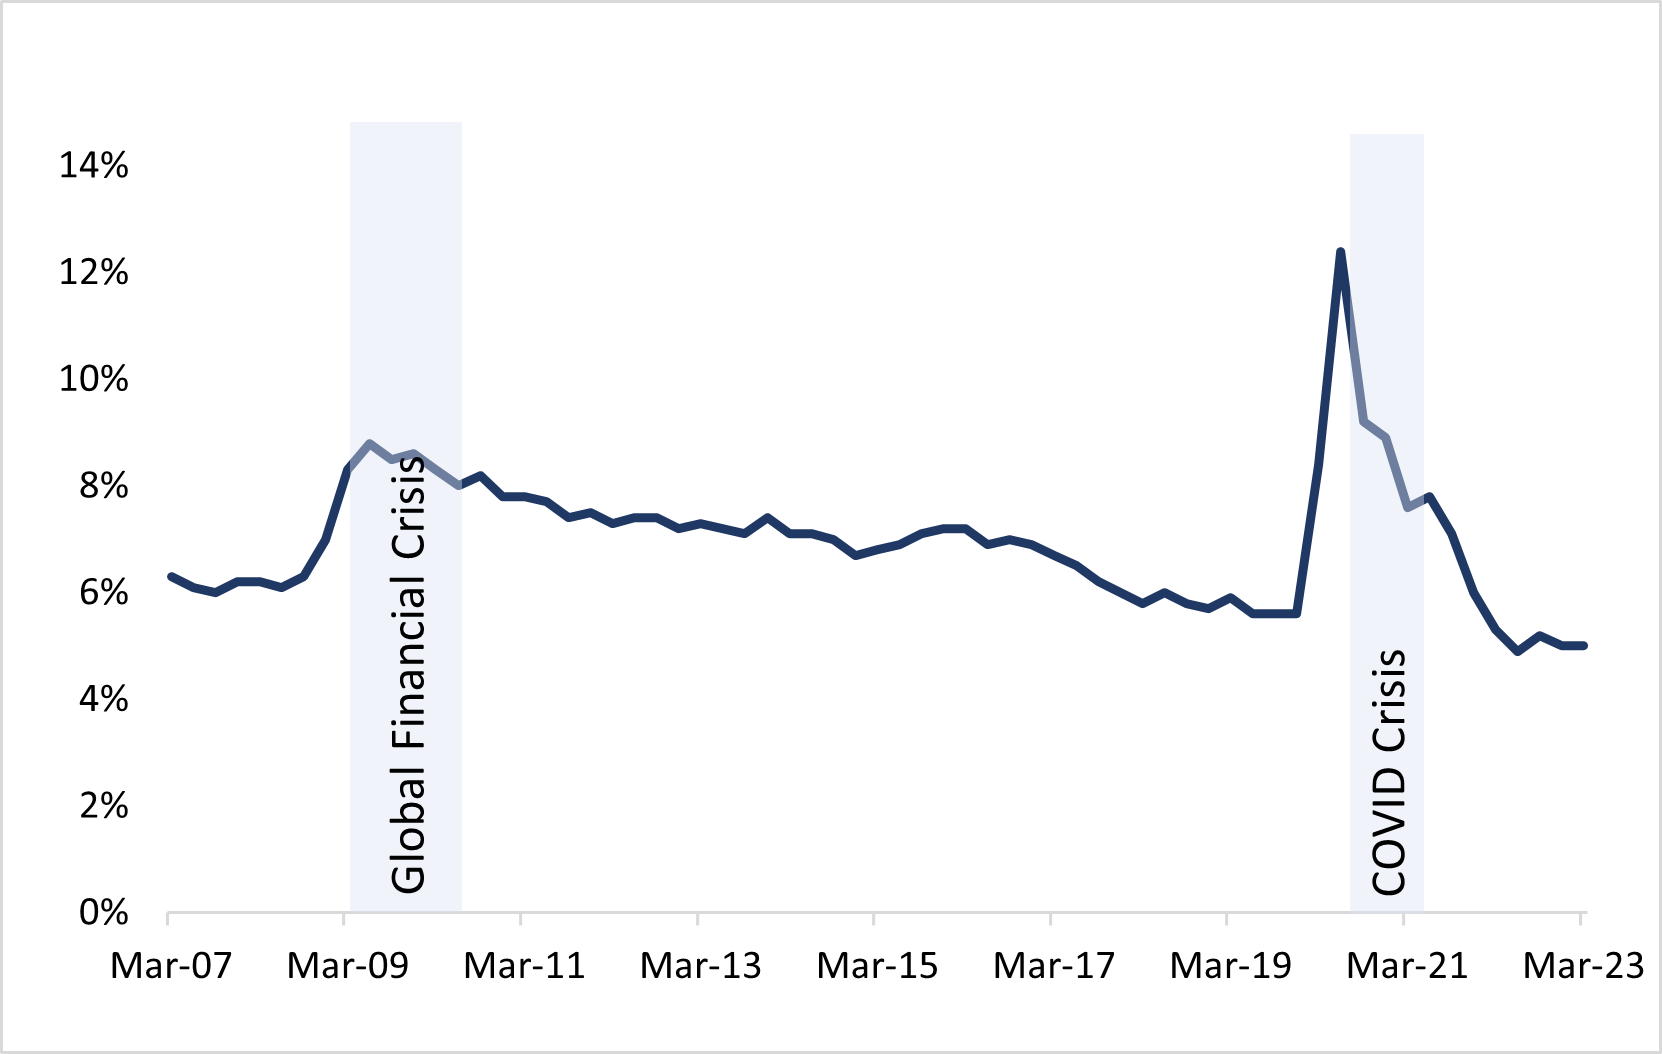
Canadian Non-Financial Corporate Debt to GDP - text description
| Date | Debt to GDP % |
|---|---|
| March 2007 | 46.06 |
| June 2007 | 45.02 |
| September 2007 | 45.86 |
| December 2007 | 46.75 |
| March 2008 | 47.86 |
| June 2008 | 46.65 |
| September 2008 | 46.62 |
| December 2008 | 50.51 |
| March 2009 | 52.55 |
| June 2009 | 53.15 |
| September 2009 | 51.95 |
| December 2009 | 49.86 |
| March 2010 | 48.55 |
| June 2010 | 48.41 |
| September 2010 | 48.63 |
| December 2010 | 47.79 |
| March 2011 | 47.84 |
| June 2011 | 47.56 |
| September 2011 | 49.18 |
| December 2011 | 48.12 |
| March 2012 | 49.01 |
| June 2012 | 50.16 |
| September 2012 | 50.95 |
| December 2012 | 51.22 |
| March 2013 | 51.78 |
| June 2013 | 53.26 |
| September 2013 | 52.99 |
| December 2013 | 53.34 |
| March 2014 | 54.83 |
| June 2014 | 55.30 |
| September 2014 | 56.45 |
| December 2014 | 57.27 |
| March 2015 | 62.26 |
| June 2015 | 62.18 |
| September 2015 | 62.86 |
| December 2015 | 63.99 |
| March 2016 | 62.43 |
| June 2016 | 64.68 |
| September 2016 | 65.14 |
| December 2016 | 64.15 |
| March 2017 | 64.49 |
| June 2017 | 64.89 |
| September 2017 | 65.17 |
| December 2017 | 65.59 |
| March 2018 | 66.41 |
| June 2018 | 66.94 |
| September 2018 | 66.31 |
| December 2018 | 68.28 |
| March 2019 | 68.88 |
| June 2019 | 69.18 |
| September 2019 | 69.99 |
| December 2019 | 69.27 |
| March 2020 | 73.33 |
| June 2020 | 86.50 |
| September 2020 | 77.78 |
| December 2020 | 76.02 |
| March 2021 | 72.59 |
| June 2021 | 72.73 |
| September 2021 | 72.28 |
| December 2021 | 71.10 |
| March 2022 | 68.39 |
| June 2022 | 65.19 |
| September 2022 | 67.30 |
| December 2022 | 68.40 |
| March 2023 | 69.24 |
Global Financial Crisis: September 2008 to May 2009
COVID crisis: March 2020 to May 2020
Source: FRFI regulatory filings, OSFI calculations
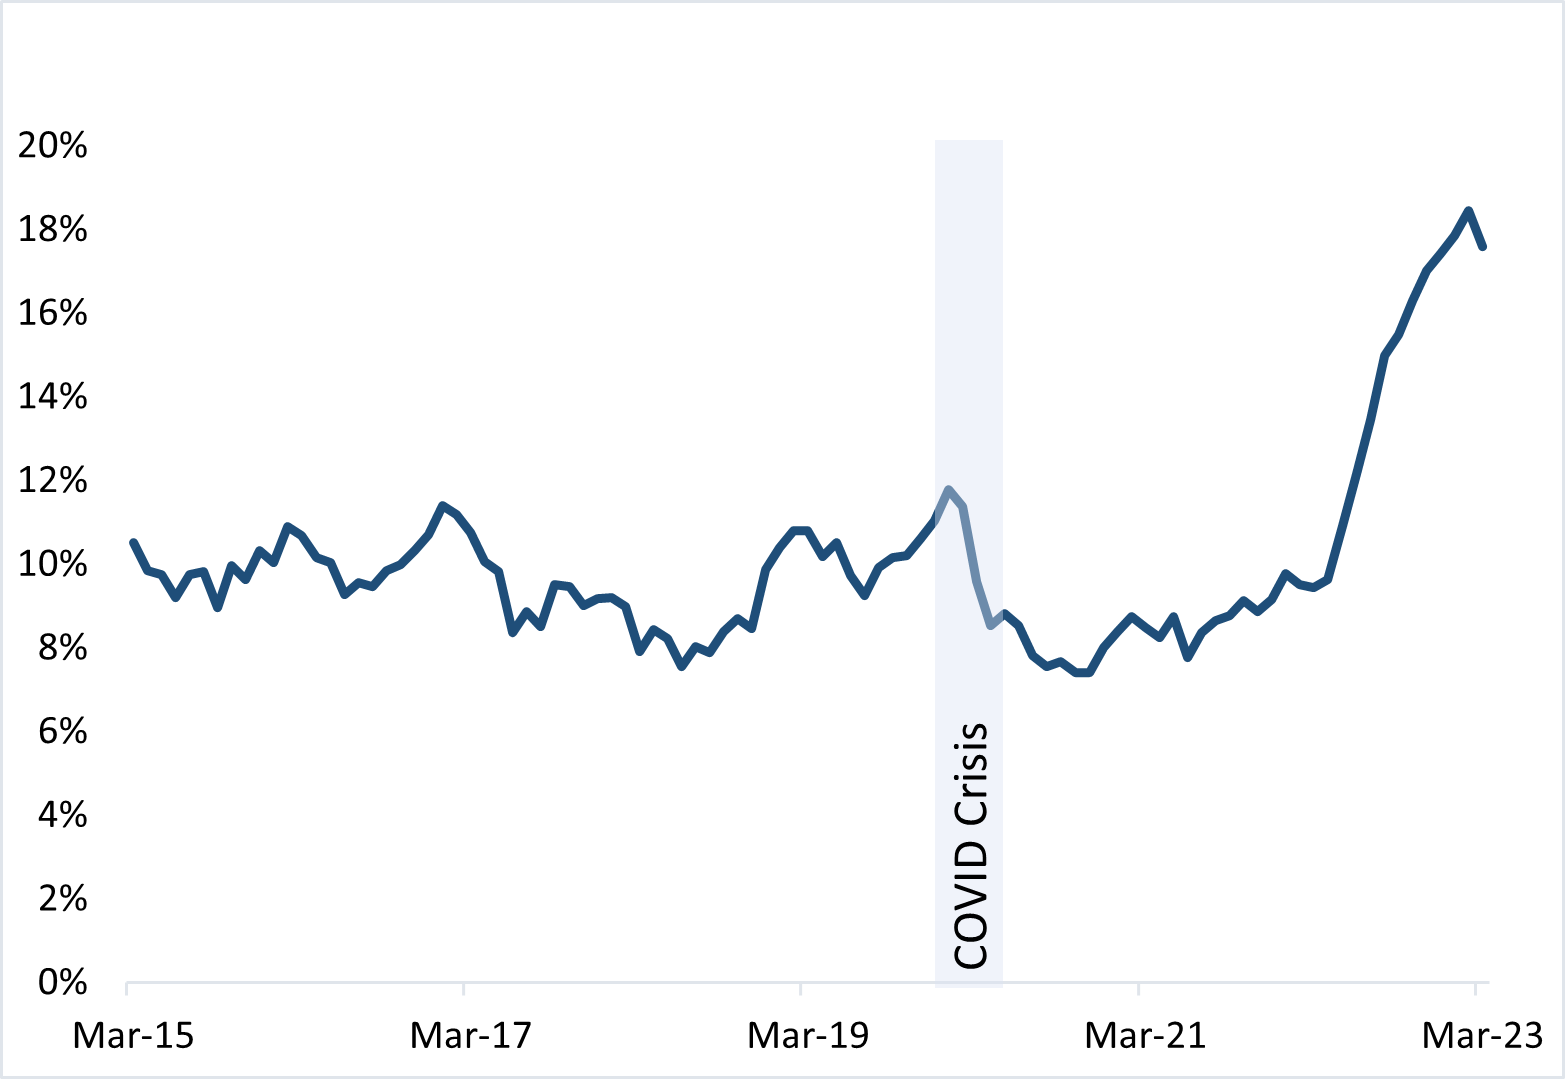
Contract Total Debt Service > 44% (% of Uninsured Originations Outstanding) - text description
| Date | Contract Total Debt Service > 44% (% of Uninsured Originations Outstanding) |
|---|---|
| March 2015 | 11 |
| April 2015 | 10 |
| May 2015 | 10 |
| June 2015 | 9 |
| July 2015 | 10 |
| August 2015 | 10 |
| September 2015 | 9 |
| October 2015 | 10 |
| November 2015 | 10 |
| December 2015 | 10 |
| January 2016 | 10 |
| February 2016 | 11 |
| March 2016 | 11 |
| April 2016 | 10 |
| May 2016 | 10 |
| June 2016 | 9 |
| July 2016 | 10 |
| August 2016 | 9 |
| September 2016 | 10 |
| October 2016 | 10 |
| November 2016 | 10 |
| December 2016 | 11 |
| January 2017 | 11 |
| February 2017 | 11 |
| March 2017 | 11 |
| April 2017 | 10 |
| May 2017 | 10 |
| June 2017 | 8 |
| July 2017 | 9 |
| August 2017 | 9 |
| September 2017 | 10 |
| October 2017 | 9 |
| November 2017 | 9 |
| December 2017 | 9 |
| January 2018 | 9 |
| February 2018 | 9 |
| March 2018 | 8 |
| April 2018 | 8 |
| May 2018 | 8 |
| June 2018 | 8 |
| July 2018 | 8 |
| August 2018 | 8 |
| September 2018 | 8 |
| October 2018 | 9 |
| November 2018 | 8 |
| December 2018 | 10 |
| January 2019 | 10 |
| February 2019 | 11 |
| March 2019 | 11 |
| April 2019 | 10 |
| May 2019 | 11 |
| June 2019 | 10 |
| July 2019 | 9 |
| August 2019 | 10 |
| September 2019 | 10 |
| October 2019 | 10 |
| November 2019 | 11 |
| December 2019 | 11 |
| January 2020 | 12 |
| February 2020 | 11 |
| March 2020 | 10 |
| April 2020 | 9 |
| May 2020 | 9 |
| June 2020 | 9 |
| July 2020 | 8 |
| August 2020 | 8 |
| September 2020 | 8 |
| October 2020 | 7 |
| November 2020 | 7 |
| December 2020 | 8 |
| January 2021 | 8 |
| February 2021 | 9 |
| March 2021 | 8 |
| April 2021 | 8 |
| May 2021 | 9 |
| June 2021 | 8 |
| July 2021 | 8 |
| August 2021 | 9 |
| September 2021 | 9 |
| October 2021 | 9 |
| November 2021 | 9 |
| December 2021 | 9 |
| January 2022 | 10 |
| February 2022 | 10 |
| March 2022 | 9 |
| April 2022 | 10 |
| May 2022 | 11 |
| June 2022 | 12 |
| July 2022 | 13 |
| August 2022 | 15 |
| September 2022 | 15 |
| October 2022 | 16 |
| November 2022 | 17 |
| December 2022 | 17 |
| January 2023 | 18 |
| February 2023 | 18 |
| March 2023 | 18 |
COVID crisis: March 2020 to May 2020
Trends in Selected Near-Term Risk Materialization Indicators
Source: Statistics Canada
Canadian Unemployment Rate - text description
| Date | Unemployment rate % |
|---|---|
| March 2007 | 6 |
| June 2007 | 6 |
| September 2007 | 6 |
| December 2007 | 6 |
| March 2008 | 6 |
| June 2008 | 6 |
| September 2008 | 6 |
| December 2008 | 7 |
| March 2009 | 8 |
| June 2009 | 9 |
| September 2009 | 9 |
| December 2009 | 9 |
| March 2010 | 8 |
| June 2010 | 8 |
| September 2010 | 8 |
| December 2010 | 8 |
| March 2011 | 8 |
| June 2011 | 8 |
| September 2011 | 7 |
| December 2011 | 8 |
| March 2012 | 7 |
| June 2012 | 7 |
| September 2012 | 7 |
| December 2012 | 7 |
| March 2013 | 7 |
| June 2013 | 7 |
| September 2013 | 7 |
| December 2013 | 7 |
| March 2014 | 7 |
| June 2014 | 7 |
| September 2014 | 7 |
| December 2014 | 7 |
| March 2015 | 7 |
| June 2015 | 7 |
| September 2015 | 7 |
| December 2015 | 7 |
| March 2016 | 7 |
| June 2016 | 7 |
| September 2016 | 7 |
| December 2016 | 7 |
| March 2017 | 7 |
| June 2017 | 7 |
| September 2017 | 6 |
| December 2017 | 6 |
| March 2018 | 6 |
| June 2018 | 6 |
| September 2018 | 6 |
| December 2018 | 6 |
| March 2019 | 6 |
| June 2019 | 6 |
| September 2019 | 6 |
| December 2019 | 6 |
| March 2020 | 8 |
| June 2020 | 12 |
| September 2020 | 9 |
| December 2020 | 9 |
| March 2021 | 8 |
| June 2021 | 8 |
| September 2021 | 7 |
| December 2021 | 6 |
| March 2022 | 5 |
| June 2022 | 5 |
| September 2022 | 5 |
| December 2022 | 5 |
| March 2023 | 5 |
Global Financial Crisis: September 2008 to May 2009
COVID crisis: March 2020 to May 2020
Source: FRFI regulatory filings, staff calculations
DSIB Average Common Equity Tier 1 (% of Risk Weighted Assets) - text description
| Date | DSIB Average CET1 Ratio % |
|---|---|
| January 2018 | 11 |
| April 2018 | 11 |
| July 2018 | 11 |
| October 2018 | 12 |
| January 2019 | 11 |
| April 2019 | 11 |
| July 2019 | 12 |
| October 2019 | 12 |
| January 2020 | 12 |
| April 2020 | 11 |
| July 2020 | 12 |
| October 2020 | 12 |
| January 2021 | 12 |
| April 2021 | 13 |
| July 2021 | 13 |
| October 2021 | 13 |
| January 2022 | 13 |
| April 2022 | 13 |
| July 2022 | 13 |
| October 2022 | 14 |
| January 2023 | 14 |
| April 2023 | 13 |
COVID crisis: March 2020 to May 2020
Source: FRFI regulatory filings, staff calculations
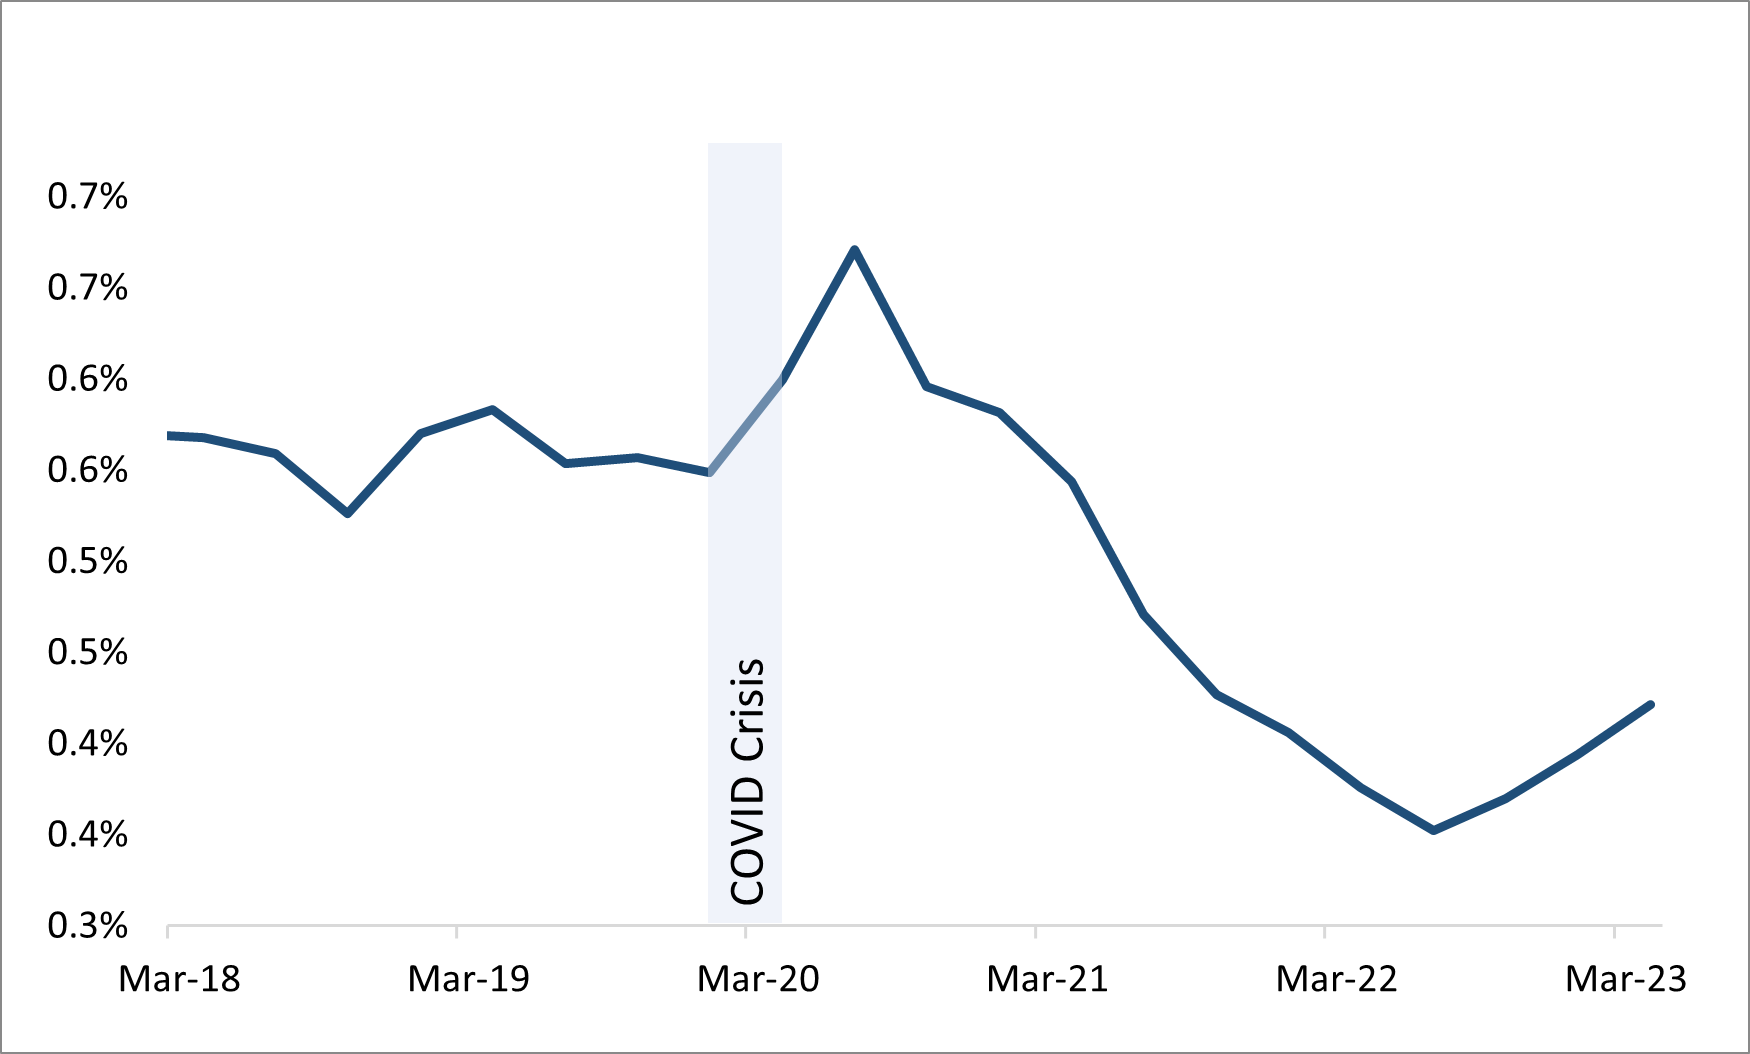
DSIB Average Gross Impaired Loans (% of Total Loans Outstanding) - text description
| Date | DSIB Average Gross Impaired Loans (% of Total Outstanding) |
|---|---|
| January 2018 | 0.6 |
| April 2018 | 0.6 |
| July 2018 | 0.6 |
| October 2018 | 0.5 |
| January 2019 | 0.6 |
| April 2019 | 0.6 |
| July 2019 | 0.6 |
| October 2019 | 0.6 |
| January 2020 | 0.5 |
| April 2020 | 0.6 |
| July 2020 | 0.7 |
| October 2020 | 0.6 |
| January 2021 | 0.6 |
| April 2021 | 0.5 |
| July 2021 | 0.5 |
| October 2021 | 0.4 |
| January 2022 | 0.4 |
| April 2022 | 0.4 |
| July 2022 | 0.4 |
| October 2022 | 0.4 |
| January 2023 | 0.4 |
| April 2023 | 0.4 |
COVID crisis: March 2020 to May 2020