Actuarial Report (18th) on the Old Age Security Program as at 31 December 2021
Office of the Chief Actuary
Office of the Superintendent of Financial Institutions Canada
255 Albert Street
Ottawa, Ontario
K1A 0H2
E-mail: oca-bac@osfi-bsif.gc.ca
Web site: www.osfi-bsif.gc.ca
© His Majesty the King in Right of Canada, 2022
Cat. No. IN3-16/2E PDF
ISSN 2292-6631
27 June 2023
The Honourable Kamal Khera, P.C., M.P.
Minister of Seniors
House of Commons
Ottawa, Canada
K1A 0A6
Dear Minister:
In accordance with section 3 of the Public Pensions Reporting Act, I am pleased to submit the Actuarial Report prepared as at 31 December 2021, on the pension plan established under the Old Age Security Act.
Yours sincerely,
Assia Billig, FCIA, FSA, PhD
Chief Actuary
Table of contents
List of tables
- Table 1 Best-estimate assumptions
- Table 2 Best-estimate assumptions for benefit recipient rates
- Table 3 Population of Canada
- Table 4 Economic assumptions
- Table 5 Recipient rates
- Table 6 Beneficiaries (historical)
- Table 7 Beneficiaries (projected)
- Table 8 Expenditures and average annual benefits (historical)
- Table 9 Expenditures and average annual benefits (projected)
- Table 10 Expenditures as percentage of GDP (historical)
- Table 11 Expenditures as percentage of GDP (projected)
- Table 12 Financial results - totals for 2019 to 2021
- Table 13 Reconciliation of expenditures as a percentage of GDP
- Table 14 Reconciliation of expenditures in billions
- Table 15 Cohort fertility rates by age and year of birth
- Table 16 Fertility rates for Canada
- Table 17 Percentage increase in mortality rates
- Table 18 Annual mortality improvement rates for Canada
- Table 19 Mortality rates for Canada
- Table 20 Life Expectancies for Canada, without improvements after the year shown
- Table 21 Life Expectancies for Canada, with improvements after the year shown
- Table 22 Population of Canada by Age
- Table 23 Analysis of population of Canada by age group
- Table 24 Births, net migrants, and deaths for Canada
- Table 25 Active population (Canada, ages 15 and over)
- Table 26 Labour force participation, employment, and unemployment rates Canada, ages 15 and over
- Table 27 Labour force participation rates (Canada)
- Table 28 Employment of males population (Canada, ages 18 to 69)
- Table 29 Employment of females population (Canada, ages 18 to 69)
- Table 30 Real wage increase and related components
- Table 31 Inflation, real AAE and AWE increases
- Table 32 Assumed deferral rates for cohorts reaching age 65 in 2022 and thereafter
- Table 33 OAS Basic pension recipient rates by age for cohort reaching age 65 in 2022 and thereafter
- Table 34 Male OAS basic pension recipient rates by age, and level of benefit
- Table 35 Female OAS basic pension recipient rates by age, and level of benefit
- Table 36 OAS Beneficiaries affected by the OAS recovery tax
- Table 37 Financial impact of OAS recovery tax
- Table 38 Male GIS recipient rates for cohorts reaching the ages 65 in 2022, 2030, and 2060, by age and level of benefit
- Table 39 Female GIS recipient rates for cohorts reaching the ages 65 in 2022, 2030, and 2060, by age and level of benefit
- Table 40 Male allowance recipient rates for cohorts reaching the ages 60 in 2022, 2030, and 2060, by age and level of benefit
- Table 41 Female allowance recipient rates for cohorts reaching the ages 60 in 2022, 2030, and 2060, by age and level of benefit
- Table 42 Projected maximum monthly benefits
- Table 43 Average benefits for male as percentage of maximum rates in year 2022 and 2060, by benefit type and level
- Table 44 Average benefits for female as percentage of maximum rates in year 2022 and 2060, by benefit type and level
- Table 45 Experience adjustment factors
- Table 46 Detailed reconciliation of expenditures as a percentage of GDP
- Table 47 Detailed reconciliation of expenditures in billions
- Table 48 Individual sensitivity test assumptions
- Table 49 Sensitivity test results (Expenditures as a percentage of GDP)
- Table 50 Higher and lower economic growth sensitivity tests
- Table 51 Climate change scenario analysis results (Expenditures as a percentage of GDP)
- Table 52 OAS Basic benefit beneficiaries
- Table 53 OAS Basic benefit expenditures
- Table 54 GIS Beneficiaries (Total)
- Table 55 GIS Expenditures (Total)
- Table 56 GIS Beneficiaries (Single)
- Table 57 GIS Expenditures (Single)
- Table 58 GIS Beneficiaries (Spouse a pensioner)
- Table 59 GIS Expenditures (Spouse a pensioner)
- Table 60 GIS Beneficiaries (Spouse not a pensioner)
- Table 61 GIS Expenditures (Spouse not a pensioner)
- Table 62 GIS Beneficiaries (Spouse with allowance)
- Table 63 GIS Expenditures (Spouse with allowance)
- Table 64 Allowance beneficiaries (Total)
- Table 65 Allowance expenditures (Total)
- Table 66 Allowance beneficiaries (Regular)
- Table 67 Allowance expenditures (Regular)
- Table 68 Allowance beneficiaries (Survivor)
- Table 69 Allowance expenditures (Survivor)
List of charts
- Chart 1 Expenditures as a proportion of GDP
- Chart 2 Historical and projected total and cohort fertility rates for Canada
- Chart 3 Life expectancies at Age 65 for Canada, without improvements after the year shown
- Chart 4 Net migration rate (Canada)
- Chart 5 Age distribution of the Canadian population
- Chart 6 Population of Canada
- Chart 7 Projected components of population growth for Canada
- Chart 8 Labour force participation rates (Canada)
- Chart 9 GIS Single recipient rates (Males)
- Chart 10 GIS Single recipient rates (Females)
- Chart 11 Allowance recipient rates (Males)
- Chart 12 Allowance recipient rates (Females)
- Chart 13 Illustrative climate scenarios – Cumulative Canadian GDP impact relative to baseline scenario
1 Highlights of the report
Main findings 18th OAS Program actuarial report
Overall OAS program
As a result of baby boomers gradually reaching age 65, the number of beneficiaries and expenditures are projected to steadily increase over the next four decades.
Expenditures are projected to increase from an estimated $77.8 billion in 2023 to $136.6 billion in 2035 and $276.5 billion by 2060.
The ratio of expenditures to the GDP is estimated to be 2.68% in 2023.
Due to the population aging, the ratio of expenditures to GDP is projected to reach a high of 3.0% by the early 2030s. Afterward, this ratio is projected to gradually decrease to a level of 2.64% by 2060, mainly due to expected slower growth in inflation compared to the growth in GDP.
| Basic pension | Guaranteed income supplement (GIS) and allowance | |
|---|---|---|
| Beneficiaries |
The number of beneficiaries of the basic pension is projected to increase at a higher pace from 2023 to 2035, growing from 7.2 million in 2023 to 9.8 million by 2035 and then reaches 12.6 million by 2060. |
The number of GIS and Allowance beneficiaries is projected to increase at a higher pace from 2023 to 2035, growing from 2.5 million in 2023 to 3.4 million by 2035 and then reaches 3.6 million by 2060. |
| Expenditures |
Basic pension annual expenditures are projected to increase from $59.8 billion in 2023 to $105.7 billion in 2035 and $223.8 billion by 2060. |
GIS and Allowance annual expenditures are projected to increase from $17.7 billion in 2023 to $30.2 billion in 2035 and $51.3 billion by 2060. |
Uncertainty 18th OAS program actuarial report
Mortality assumption
The 18th OAS Program Actuarial Report is based on the assumption that mortality will continue to improve but at a slower pace than over the last few decades. Mortality remains an important factor.
If longevity were to improve faster than assumed (cohort life expectancies at age 65 in 2060 that are about 2.5 years higher), this would result in:
- the cost ratio of OAS program expenditures to Gross Domestic Product (GDP) increasing from 2.51% to 2.79% in 2060.
Economic growth
The 18th OAS Program Actuarial Report is based on the assumption of moderate and sustained economic growth.
- the cost ratio of OAS program expenditures to GDP decreasing from 2.51% to 1.94% in 2060.
Illustrating downside risk 18th actuarial report on the OAS
The 18th OAS Program Actuarial Report includes a new section that focuses on understanding and assessing downside risks due to two potential or emerging trends. Given the purpose of the section, only adverse scenarios are presented. It is not meant to represent forecasts or predictions and should be interpreted with caution.
Stagflation scenario
The 18th OAS Program Actuarial Report is based on the assumption that the current environment of high inflation is temporary and that the Bank of Canada will be successful in reaching its current mid-point inflation target of 2.0% by 2026.
Elevated inflation over a long period of time can lead to stagflation, which is characterized by simultaneous economic stagnation and an increase in inflation. A hypothetical stagflation scenario was developed in which inflation and unemployment rates are higher than under the best-estimate assumptions, while real-wage growth is lower. This hypothetical stagflation scenario would result in:
- the cost ratio of OAS program expenditures to GDP increasing from 2.64% to 3.32% in 2060.
Climate scenarios
Climate change can affect the OAS program through various channels. The demographic and economic environments can all be affected by climate change in the future. However, there is a lot of uncertainty on the direction and magnitude of these potential impacts, and the risk is evolving constantly.
In order to illustrate the potential downside risk, three intentionally adverse hypothetical climate change scenarios were developed based on publicly available information. The scenarios focus on differences in GDP growth rates from different transition pathways. Based on the three hypothetical scenarios:
- The cost ratio of OAS program expenditures to GDP could vary between 2.96% and 3.22% in 2060 depending on the assumed pace and timing of the transition.
2 Introduction
2.1 Purpose of the report
This is the 18th Actuarial Report on the Old Age Security (OAS) program since the implementation of the Old Age Security Act in 1952. The valuation date is 31 December 2021. This report has been prepared in compliance with the timing and information requirements of the Public Pensions Reporting Act, which provides that the Chief Actuary shall prepare a triennial actuarial report on the benefits under the various Parts of the Old Age Security Act, being as follows:
- Part I: OAS Basic Pension
- Part II: Guaranteed Income Supplement (GIS)
- Part III: Allowance
Another important purpose of the report is to inform the general public of the current and projected costs of the OAS program. The report provides information to evaluate the program's financial situation over a long period (until 2060), provided the program remains unchanged. Such information should facilitate a better understanding of the program and the factors that influence its costs, and thus contribute to an informed public discussion of issues related to it.
The previous triennial actuarial report was the 16th Actuarial Report on the Old Age Security Program as at 31 December 2018, which was tabled in the House of Commons on 20 October 2020. The 17th Actuarial Report supplementing the Actuarial Report on the Old Age Security Program as at 31 December 2018 which as tabled in the House of Commons on 4 February 2022 covered the impacts of the increase in the OAS pension for beneficiaries aged 75 and older. The next triennial report is scheduled as at 31 December 2024.
This 18th OAS Program Actuarial Report takes into account all amendments to date regarding the OAS program statute, with the most recent listed in the following section. This OAS Program Actuarial Report also takes into account: recent demographic and economic data as described in section B.2 of Appendix B of this report; various forecasts by demographic and economic experts; the continuing and evolving impacts of the COVID-19 pandemic; and the impacts of the escalation of the conflict in Ukraine, which was considered a subsequent event for the purpose of this OAS Program Actuarial Report, as described in section 2.3.
This report presents projections of OAS program expenditures until the year 2060. Given the length of the projection period and the number of assumptions required, it is unlikely that actual future experience will develop precisely in accordance with the best-estimate projections.
2.2 Recent amendments
The Old Age Security Act was subject to amendments after 31 December 2018 as follows:
- Under the Budget Implementation Act, 2019, No. 1, which received Royal Assent on 21 June 2019, the income exemption for the GIS and Allowance benefits was enhanced, effective 1 July 2020, by:
- Extending eligibility for the income exemption to self-employment income;
- Increasing the amount of the full income exemption from the first $3,500 of annual employment income to $5,000 of annual employment and self-employment income for each GIS or Allowance recipient and their spouse or common-law partner; and
- Introducing a partial income exemption of 50 per cent to apply to annual employment and self-employment income greater than the new full income exemption amount of $5,000 but not exceeding $15,000 for each GIS or Allowance recipient and their spouse or common-law partner, for a maximum partial income exemption of $5,000. In combination, the full and partial income exemption can result in a maximum total income exemption of $10,000.
The impacts of enhancing the income exemption were initially evaluated in the 15th Actuarial Report supplementing the Actuarial Report on the Old Age Security Program as at 31 December 2015.
- Under the Budget Implementation Act, 2021, No. 1, which received Royal Assent on 29 June 2021:
- The OAS pension payable to individuals aged 75 or older was increased by 10%, effective 1 July 2022. The increase applies to all such pensions payable, including voluntarily deferred pensions, and is indexed to inflation; and
- A one-time payment of $500 in August 2021 was made to OAS pensioners who were aged 75 or older as of June 2022. The one-time payment was exempt from the definition of income for the GIS and was funded through a statutory appropriation instead of being part of the Old Age Security Act, and as such, is not reflected in the cost figures of OAS Program Actuarial Reports.
The impacts of the increase in the OAS pension for beneficiaries aged 75 and older were initially evaluated in the 17th Actuarial Report supplementing the Actuarial Report on the Old Age Security Program as at 31 December 2018.
All of the above amendments that affect the OAS program are taken into account for this 18th OAS Program Actuarial Report.
2.3 Subsequent events
The continuing and evolving impacts of the COVID-19 pandemic were exacerbated by the conflict in Ukraine, notably its escalation as of 24 February 2022. This escalation is considered to be a subsequent event for the purpose of this 18th OAS Program Actuarial Report since it started subsequent to the valuation date but before the date of this report. There is much uncertainty surrounding the evolving conflict and potential impacts on the projected expenditures of the OAS program, in particular resulting from changing levels of inflation. This uncertainty was taken into account for the purpose of this 18th OAS Program Actuarial Report.
There were no other events determined by the Chief Actuary to be subsequent events with material effects on the expenditures of the OAS program as projected under this 18th OAS Program Actuarial Report.
2.4 Scope of the report
Section 3 presents a general overview of the methodology used in preparing the actuarial estimates included in this report, which are based on the best-estimate assumptions described in section 4. The results are presented in section 5 and include information on key demographic and financial indicators and on the projection of beneficiaries, expenditures, and cost ratios. Section 6 provides the reconciliation of the results with those of the 16th OAS Program Actuarial Report, and section 7 provides the actuarial opinion.
The various appendices provide a summary of the OAS program provisions, a description of the data, assumptions and methodology employed, detailed reconciliations of the results with the previous triennial report, the uncertainty of results, detailed projections of beneficiaries and expenditures, and acknowledgements of the data providers and staff who contributed to this report.
3 Methodology
The actuarial examination of the OAS program involves projections of its expenditures and cost measurement bases over a long period of time, so that the future impact of historical and projected trends in demographic and economic factors can be properly assessed. The actuarial estimates in this report are based on the provisions of the Old Age Security Act as at 31 December 2021, data regarding the starting point for the projections, and best‑estimate assumptions regarding future demographic and economic experience.
Since the OAS program is financed from general tax revenues on a pay‑as‑you‑go basis, there is no need to project either contributions or investment earnings. However, projected GDP is used as a basis for measuring the relative costs over the projection period.
The costing begins with a projection of the general population of Canada. This requires assumptions regarding demographic factors such as fertility, migration, and mortality.
Expenditures are made up of the benefits paid out and administrative expenses. Benefits are projected by applying assumptions regarding recipient rates for various types and levels of benefits to the projected population at the relevant ages, along with assumptions regarding increases in the maximum benefit rates. Administrative expenses are projected by considering the historical relationship between expenses and total benefit expenditures.
The GDP is projected based on the historical relationship between the GDP and total employment earnings. To project the GDP, the total CPP employment earnings used in the 31st Canada Pension Plan Actuarial Report as at 31 December 2021 (the 31st CPP actuarial report) have been used as a proxy for annual increases in GDP. This requires assumptions about various factors such as wage increases, an earnings distribution and unemployment rates. By applying these increases to the last known GDP value in 2022, a projection for GDP has been derived.
The assumptions and results presented in the following sections make it possible to measure the costs of the OAS program over the projection period. A wide variety of factors influence both the current and projected costs of the program. Accordingly, the results shown in this report differ from those shown in previous reports. Likewise, future actuarial examinations will reveal results that differ from the projections included in this report.
4 Best-estimate assumptions
4.1 Introduction
The information required by statute, which is presented in section 5 of this report, requires making several assumptions regarding future demographic and economic trends. The projections included in this report cover a long period of time (up to the year 2060) and the assumptions are determined by examining historical long-term and short-term trends, and by applying judgement as to the extent these trends will continue in the future. These assumptions reflect the Chief Actuary's best judgment and are referred to in this report as the best-estimate assumptions. The assumptions were chosen to be, independently reasonable and appropriate in the aggregate, taking into account certain interrelationships between them. To the extent applicable, the assumptions are consistent with the best-estimate assumptions used in the 31st CPP Actuarial report.
This actuarial report on the Old Age Security program presents projections of its expenditures over a long period of time. Both the length of the projection period and the number of assumptions required ensure that actual future experience will not develop precisely in accordance with the best-estimate projections. To measure the sensitivity of the long-term projections to future changes in demographic and economic environments, a variety of sensitivity tests were performed. The tests and results are presented in Appendix D of this report.
The continuing and evolving impacts of the COVID-19 pandemic were exacerbated by the conflict in Ukraine, notably its escalation as of 24 February 2022. This escalation is considered to be a subsequent event for the purpose of this 18th OAS Program Actuarial Report. The following assumptions were therefore reviewed in light of this subsequent event: inflation as well as real wage increases. These assumptions were revised to reflect updated data and forecasts available up to the end of June 2022, as well as continued short-term uncertainty.
Table 1 and Table 2 presents a summary of the most important assumptions used in this report compared with those used in the previous (16th) triennial report. The assumptions are described in more detail in Appendix B of this report.
| Version | OAS 18th reportTable 1 Footnote 1 | OAS 16th reportTable 1 Footnote 2 |
|---|---|---|
| Total fertility rateTable 1 Footnote 3 | 1.54 (2029+) | 1.62 (2027+) |
| Mortality | Statistics Canada Life Table (CLT 1-year table: 2019) with assumed future improvements | Statistics Canada Life Table (CLT 3-year average table: 2014 – 2016) with assumed future improvements |
| Canadian life expectancy for male at birth in 2022 | 86.7 years | 87.1 years |
| Canadian life expectancy for female at birth in 2022 | 90.0 years | 90.1 years |
| Canadian life expectancy for male at age 65 in 2022 | 21.3 years | 21.6 years |
| Canadian life expectancy for female at age 65 in 2022 | 23.8 years | 24.0 years |
| Net migration rate | 0.64% of population (for 2031+) | 0.62% of population (for 2021+) |
| Participation rate (age group 18-69) |
80% (2035) | 79.2% (2035) |
| Employment rate (age group 18-69) |
75.3% (2035) | 74.4% (2035) |
| Unemployment rate (age group 18-69) |
5.9% (2027+) | 6.0% (2030+) |
| Rate of increase in prices | 2.0% (2026+) | 2.0% (2019+) |
| Real wage increase | 0.9% (2026+) | 1.0% (2025+) |
|
Table 1 footnotes
|
||
| Benefits | OAS 18th ReportTable 2 Footnote 2 | OAS 16th ReportTable 2 Footnote 3 | ||||
|---|---|---|---|---|---|---|
| 2022 | 2030 | 2060 | 2022 | 2030 | 2060 | |
| OAS | 94.6% | 95.2% | 95.5% | 96.6% | 97.0% | 97.5% |
| GIS | 30.9% | 32.5% | 26.8% | 32.6% | 33.4% | 26.3% |
| Allowance | 2.7% | 3.2% | 2.3% | 3.7% | 4.3% | 3.1% |
|
Table 2 footnotes
|
||||||
4.2 Demographic assumptions
The population projections start with the population of Canada on 1 July 2021, to which are applied fertility, migration, and mortality assumptions. The population projections are essential to determine the future number of OAS program beneficiaries.
The distribution of the population by age changed considerably since 1966. The proportion of Canadian population aged 65 and above has increased from 7.6% in 1966 to 18.5% in 2021. It is assumed that the population aging will continue in the future, albeit to a more modest extent. The causes of this aging are examined in the following subsections.
4.2.1 Fertility
The first cause of the aging of the Canadian population is the decline in the total fertility rate that occurred during the last 60 years. The total fertility rate in Canada decreased rapidly from a level of about 4.0 children per woman in the late 1950s to 1.6 by the mid-1980s. The total fertility rate rose slightly in the early 1990s, but then declined to a level of 1.5 by the late 1990s. Canada is one of many industrialized countries that saw their fertility rates increase starting in the 2000s. By 2008, the total fertility rate for Canada reached 1.68. However, in some industrialized countries, including Canada, the total fertility rate has decreased since 2008, which could be attributable to the most recent economic downturn experienced. The total fertility rate for Canada stood at 1.47 in 2019 and decreased further to 1.40 in 2020. The significant decrease in 2020 could be due to the high level of uncertainty and much lower immigration caused by the COVID-19 pandemic.
The overall decrease in the total fertility rate since the 1950s occurred as a result of changes in a variety of social, medical, and economic factors. Although there have been periods of growth in the total fertility rates in recent decades, it is unlikely that the rates will return to historical levels in the absence of significant societal changes.
In 2021, the Government of Canada announced that it would work with provinces and territories to establish a Canada-Wide Early Learning and Child Care PlanFootnote 1. Consistent with what was experienced in Québec with the introduction of Childcare Centres, the proposed plan is assumed to result in increases in fertility rates for certain age groups following the adoption of the Early Learning and Child Care Plan.
Given the uncertainty surrounding the effect of the COVID-19 pandemic on fertility rates for the year 2020 (the last year of available data at the time this report was prepared), the data for 2020 were excluded from the analysis for purposes of setting the fertility rates for years 2021 and beyond. A 15-year period ending in 2019 of data is used to establish a linear trending model which is also adjusted for the upcoming Canada-Wide Early Learning and Child Care Plan. The assumed age-specific fertility rates lead to an assumed total fertility rate for Canada that will increase from its 2019 level of 1.47 children per woman to an ultimate level of 1.54 in 2029.
4.2.2 Mortality
Another element that has contributed to the aging of the population is the significant reduction in the age-specific mortality rates. This can be measured by the increase in life expectancy at age 65, which directly affects how long retirement benefits will be paid to beneficiaries. Male life expectancy (without future mortality improvements, i.e., reductions in mortality) at age 65 increased by 44% between 1966 and 2019, rising from 13.6 to 19.6 years. For women, life expectancy at age 65 (without future improvements) increased by 31%, from 16.9 to 22.1 years over the same period. Although the overall gains in life expectancy at age 65 since 1966 are similar for males and females (between 5 and 6 years), about 70% of the increase occurred after 1990 for males, while for females, only about 50% of the increase occurred in that period.
Future mortality rates are determined by applying assumed mortality improvement rates to Statistics Canada's 2019 life tables.
Statistics Canada's 2020 life tables published in January 2022 were used to derive the annual mortality improvement rates for 2020. These tables reflect significant mortality rate increases related to COVID-19 deaths. In 2020, life expectancy at birth (without future mortality improvements) stood at 79.5 for males and 84.0 for females, a decrease from 2019 of 0.7 and 0.4 for males and females respectively.
The 15-year average mortality improvement rates by age and sex for the period ending in 2019 are the starting point for the projected annual mortality improvement rates from 2021 onward. These projections disregard the impact of the COVID-19 pandemic. Mortality improvements are expected to continue in the future, but at a slower pace than most recently observed over the 15-year period ending in 2019. Further, it is assumed that ultimately, mortality improvement rates will be the same for males and females. The assumed mortality improvement rates are based on the analysis of the Canadian experience over the period 1921 to 2019 and of the possible drivers of future mortality improvements.
The projected mortality improvement rates are assumed to gradually reduce to their ultimate levels in 2039, which are for both sexes 0.8% per year for ages below 90, 0.5% for ages 90 to 94, and 0.2% for ages 95 and above.
In the short term, mortality rates were also adjusted to reflect assumed additional increases in mortality rates due to the COVID-19 pandemic. These assumed increases are related to two factors: i) direct increases in mortality due to COVID-19 deaths, affecting older age groups more and ii) indirect increases in mortality due to the impact of the pandemic on the opioids crisis, affecting mostly men in the age group 25 to 49 Footnote 2.
For the direct increases in mortality due to COVID-19 deaths in 2021, mortality rates were adjusted using data on the number of COVID-19 deaths from both Health Canada and Statistics Canada. The pandemic is assumed to have a residual effect on mortality in 2022, followed by an assumed full recovery and reversion to the projected unadjusted mortality rates for years 2023 and onward. For the indirect increases related to the opioid crisis, projected mortality rates for affected age groups are assumed to revert back to normal levels, leading to a period of high growth in mortality improvement rates.
The resulting adjustments lead to mortality rates for the full population that are 5.5% higher on average in 2021 and 2.0% higher on average in 2022 than the rates developed using the information up to and including 2019.
Considering the above, life expectancy (with future improvements) at age 65 in 2022 is projected to be 21.3 years for males, and 23.8 years for females.
4.2.3 Net migration
Net migration corresponds to the number of immigrants less the net number of emigrants, plus the net increase in the number of non-permanent residents.
The components of net migration were analyzed separately by looking at trends in the historical data in order to select the assumptions regarding the short-term and ultimate rates. Over the past two years, net migration for Canada decreased significantly due to various COVID-19 safety measures such as border closures and flight cancellations. As such, data for the years 2020 and 2021 were excluded from the analysis. Consideration was given to the federal government's short-term immigration targets and to long-term perspectives of various experts regarding future immigration levels, net increases in the number of non-permanent residents, and the impacts of the COVID-19 pandemic.
The net migration rate for Canada is projected to increase from its current (year ending June 2021) level of 0.41% of the population to 1.04% in 2022, 1.05% in 2023, 0.93% in 2024 and gradually reach an ultimate level of 0.64% of the population for the year 2031 and thereafter. The ultimate net migration rate of 0.64% corresponds to the average experience observed over the 10 years ending in 2019, excluding the net increase in non-permanent residents during that period. The assumed short-term net migration rate is higher than the ultimate rate of 0.64% due to the federal government's short-term targets and the assumed gradual decrease to zero for the net increase in the number of non-permanent residents from 2022 through 2026.
4.2.4 Population projections
Table 3 shows the population of Canada for three age groups (0-19, 20-64 and 65 and over) throughout the projection period. The ratio of the number of people aged 20-64 to those aged 65 and over is a measure that approximates the ratio of the number of working-age people to retirees. Because of the aging population, this ratio is projected to drop from 3.2 in 2022 to 2.1 in 2060.
The number of people reaching age 65 in any given year is a good indicator of the number of new basic pension beneficiaries coming into pay each year, which is expected to increase from 495,000 in 2022 to 525,000 by 2030.
| Year | Total | Age 0-19 | Age 20-64 | Age 65 and Over | Ratio of 20-64 to 65 and Over | Reaching Age 65 |
|---|---|---|---|---|---|---|
| 2022 | 38,735 | 8,115 | 23,274 | 7,347 | 3.2 | 495 |
| 2023 | 39,247 | 8,226 | 23,400 | 7,621 | 3.1 | 507 |
| 2024 | 39,716 | 8,319 | 23,504 | 7,893 | 3.0 | 513 |
| 2025 | 40,160 | 8,399 | 23,592 | 8,169 | 2.9 | 525 |
| 2026 | 40,579 | 8,467 | 23,667 | 8,445 | 2.8 | 533 |
| 2027 | 40,987 | 8,528 | 23,748 | 8,711 | 2.7 | 530 |
| 2028 | 41,382 | 8,580 | 23,821 | 8,981 | 2.7 | 543 |
| 2030 | 42,124 | 8,678 | 23,973 | 9,474 | 2.5 | 525 |
| 2035 | 43,758 | 8,886 | 24,608 | 10,264 | 2.4 | 478 |
| 2040 | 45,173 | 9,100 | 25,290 | 10,784 | 2.3 | 476 |
| 2045 | 46,412 | 9,246 | 25,947 | 11,219 | 2.3 | 521 |
| 2050 | 47,543 | 9,271 | 26,516 | 11,755 | 2.3 | 569 |
| 2055 | 48,640 | 9,335 | 26,911 | 12,394 | 2.2 | 625 |
| 2060 | 49,790 | 9,498 | 27,088 | 13,204 | 2.1 | 652 |
4.3 Economic assumptions
The OAS program expenditures are presented as cost ratios using the GDP measurement base. This cost base is projected using economic assumptions for indicators such as labour force participation rates, job creation rates, unemployment rates, and nominal increases in average employment earnings. For benefit projection purposes, assumptions regarding the rate of increase in prices and recipient rates for the various benefits are also required.
All economic assumptions are consistent with the 31st CPP Actuarial Report.
One of the key elements underlying the best estimate economic assumptions relates to the continued trend toward longer working lives. Older workers are expected to exit the workforce at a later age, which could alleviate the impact of the aging of the population on future labour force growth. However, despite the expected later exit ages, labour force growth is projected to weaken as the working-age population expands at a slower pace and baby boomers exit the labour force.
4.3.1 Labour force
Employment levels vary with the rate of unemployment, and reflect trends in increased workforce participation by women, longer periods of formal education among young adults, changes in the age structure of the working-age population, as well as changing retirement patterns of older workers.
As the population ages, older age groups with lower labour force participation increase in size. As a result, the labour force participation rate for Canadians aged 15 and over is expected to decline from an estimated value of 65.1% in 2022 to 64.1% in 2035. A more useful measure of the working-age population is the participation rate of those aged 18 to 69, which is expected to increase from an estimated 76.7% in 2022 to 80.0% in 2035. The increase in the participation rate for those aged 18 to 69 reflects several trends.
For example, it is assumed that female participation rates will continue to grow at a faster pace than male participation rates thereby continuing to reduce the gap in participation rates between males and females, albeit at a slower pace than in the past. A part of this reduction comes from the expected impact on the female labour force participation due to the Early Learning and Child Care Plan initiative announced by the federal Government in 2021.
It is also assumed that participation rates for age groups 55 and over for both genders will increase as a result of an expected continued trend toward longer working lives.
Despite the assumed future increase in participation rates of women and older workers, it is still expected that there will be continued labour shortages in the future as the working-age population expands at a slower pace and as baby boomers continue to retire and exit the labour force. The participation rates for all age groups are therefore expected to increase due to the attractive employment opportunities resulting from labour shortages.
Overall, the male participation rate of those aged 18 to 69 is expected to be 80.8% in 2022 and to increase to 83.2% in 2035, while the female participation rate for the same age group is expected to be 72.6% in 2022 and to increase to 76.8% in 2035. As such, the difference between male and female participation rates for the age group 18 to 69 is projected to be 8.2 percentage points in 2022 and decrease to 6.4 percentage points by 2035. Thereafter, the gap between males and females in the age group 18 to 69 is projected to vary between 6.3 and 6.4 percentage points.
The job creation rate (i.e., the change in the number of persons employed) in Canada was on average 1.5% from 1976 to 2021 based on available employment data, and it is assumed that the rate will be 2.9% in 2022 as the labour market recovers from the COVID-19 pandemic. The job creation rate assumption is determined on the basis of expected moderate economic growth and an unemployment rate for Canada, ages 15 and over, that is expected to decrease from 7.5% in 2021 to 6.0% in 2022, 5.7% in 2023 and then increase to reach an ultimate level of 6.1% by 2027. The assumed job creation rate for Canada, ages 15 and over, is on average about 0.8% from 2024 to 2027, which is slightly lower than the labour force growth rate. It is assumed that, starting in 2027, the job creation rate will follow the labour force growth rate, with both averaging 0.8% per year between 2027 and 2035, and 0.4% per year thereafter. The aging of the population is the main reason behind the expected slower long-term growth in the labour force and job creation rate.
4.3.2 Price increases
On December 13, 2021, the Bank of Canada and the federal Government renewed their commitment to keep inflation between 1% and 3% with a target at the mid-point of 2% until the end of 2026. They further noted that the Bank of Canada will use the flexibility of the 1% to 3% range to actively seek the maximum sustainable level of employment to an extent that is consistent with keeping medium-term inflation expectations at 2%.
Despite the mid-point target of 2%, price increases (inflation), as measured by changes in the Consumer Price Index (CPI), tend to fluctuate from year to year. The COVID-19 pandemic had an impact on the CPI. In 2020, the CPI rose by only 0.7% as a result of a decline in consumer spending stemming from various pandemic-related measures and restrictions. However, as the pandemic evolved and restrictions were lifted, consumer demand increased, and supply issues arose. As a result, the increase in CPI was 3.4% in 2021, the fastest pace since 1991. The uncertainty surrounding high inflation due to the demand and supply shocks caused by the pandemic has been exacerbated by the escalation of the conflict in Ukraine.
This report considers the escalation of the conflict in Ukraine as a subsequent event. It is therefore assumed that inflation will be higher than the 2% target up until 2025. Increases in prices are assumed to be 6.9% in 2022, 3.0% in 2023, 2.5% in 2024, 2.25% in 2025, and 2.0% for 2026 and thereafter. These assumed price increases are based on short-term forecasts from various economists as well as on the expectation that the Bank of Canada and federal Government will continue to renew the inflation target at 2.0% and that the Bank of Canada will be successful in keeping inflation at its mid-point target in the long term.
4.3.3 Real wage increases
Wage increases affect the financial balance of the OAS program in two ways. In the short term, an increase in the average wage translates into higher GDP, with little immediate impact on benefits. Therefore, costs in relation to this measurement will decrease. Over the longer term, higher average wages in relation to the level of prices could be expected to produce lower payouts for income-tested benefits such as the GIS and Allowance.
Two wage measures are used in this report: the average annual earnings (AAE) and the average weekly earnings (AWE). The assumed increase in AAE is used to project the total employment earnings of CPP contributors, while the assumed increase in the AWE is used to project the increase in the YMPE from one year to the next. The average difference between both measures has been relatively small over the period 1966 to 2019, and the two measures are assumed to grow at the same pace over the long term. However, they tend to grow at different paces in times of economic expansions and slowdowns.
Based on information up to the end of June 2022, the real AAE is projected to decrease by 2.4% in 2022 and by 0.1% in 2023. Real AAE are then projected to increase, with an ultimate real increase of 0.9% reached in 2026. The negative real AAE growth in the early years of the projection is a result of assumed wage dynamics in periods of high inflation stemming from the COVID-19 pandemic and exacerbated by the escalation of the conflict in Ukraine, which is considered a subsequent event. The ultimate real AAE increase assumption is developed taking into account historical trends, labour productivity, labour shortages, and other contributing factors. The ultimate real AAE increase assumption combined with the ultimate price increase assumption results in an assumed nominal annual increase of 2.9% in 2026 and thereafter.
Real AWE are projected to decrease by 3.3% in 2022 and by 0.1% in 2023. In the following years, and consistent with the historical long-term relationship between the real change in the AWE and AAE, AWE is projected to increase, with an ultimate real increase of 0.9% reached in 2026, equal to the same ultimate real increase in AAE that year. Table 4 summarizes the main economic assumptions over the projection period.
| Year | Real increase average annual earnings | Real increase average weekly earnings | Price increase | Labour force (Canada) | |||
|---|---|---|---|---|---|---|---|
| Participation rate (Ages 15+) | Job creation rate | Unemployment rate | Labour force annual increase | ||||
| 2022 | (2.4) | (3.3) | 6.9 | 65.1 | 2.9 | 6.0 | 1.3 |
| 2023 | (0.1) | (0.1) | 3.0 | 65.0 | 1.5 | 5.7 | 1.1 |
| 2024 | 0.4 | 0.4 | 2.5 | 64.8 | 0.9 | 5.8 | 1.0 |
| 2025 | 0.6 | 0.6 | 2.3 | 64.6 | 0.8 | 5.9 | 0.9 |
| 2026 | 0.9 | 0.9 | 2.0 | 64.5 | 0.8 | 6.0 | 0.9 |
| 2027 | 0.9 | 0.9 | 2.0 | 64.4 | 0.8 | 6.1 | 0.9 |
| 2028 | 0.9 | 0.9 | 2.0 | 64.3 | 0.8 | 6.1 | 0.8 |
| 2030 | 0.9 | 0.9 | 2.0 | 64.1 | 0.7 | 6.1 | 0.7 |
| 2035 | 0.9 | 0.9 | 2.0 | 64.1 | 0.7 | 6.1 | 0.7 |
| 2040 | 0.9 | 0.9 | 2.0 | 63.7 | 0.5 | 6.1 | 0.5 |
| 2045 | 0.9 | 0.9 | 2.0 | 63.2 | 0.5 | 6.1 | 0.5 |
| 2050 | 0.9 | 0.9 | 2.0 | 62.8 | 0.4 | 6.1 | 0.4 |
| 2055 | 0.9 | 0.9 | 2.0 | 62.2 | 0.2 | 6.1 | 0.2 |
| 2060 | 0.9 | 0.9 | 2.0 | 61.5 | 0.2 | 6.1 | 0.2 |
4.3.4 Recipient rates
OAS recipient rates represent the proportion of the Canadian population that has received (historically), receives, or is projected to receive OAS program benefits. Recipient rates are different than coverage or eligibility rates for benefits, which are higher, since individuals upon becoming eligible for benefits don't necessarily apply for them immediately, but may rather defer application and commencement of their benefits (for reasons such as to receive actuarially-adjusted higher benefits for voluntary deferrals or to increase benefits from partial to full amounts by accruing more years of residence).
The recipient rate for a given benefit is derived as the ratio of the number of beneficiaries receiving that benefit to the population. It is worth noting that recipient rates for the OAS basic pension presented in this report exclude the impact of the OAS Recovery Tax. The impact of the OAS Recovery Tax on the basic pension recipient rates is discussed in section 5 of Appendix B of this report.
Since the last OAS report, the major trend observed is an increase in beneficiaries deferring their basic OAS pension. As shown in Table 5, the overall basic pension recipient rate for males and female are projected to slightly increase from 94.1% in 2022 to 94.9% in 2060 for male and from 95.1% to 96.0% for female. The rates for both sexes increase over time primarily due to the aging of the population.
While the GIS and Allowance recipient rates by age, sex, type and level of benefit were available for 2022, the starting point for determining the corresponding best-estimate assumptions was 2019. Recipient rates from 2020 to 2022 were excluded from the projection analysis, given the uncertainty surrounding the effect of the COVID-19 pandemic.
GIS and Allowance recipient rates are projected under the assumption that initial retirement income increases in line with the rate of wage growth, where such retirement income mainly comprises Canada Pension Plan (CPP) and Quebec Pension Plan (QPP) benefits (including additional CPP and QPP benefits). At the same time, it is assumed that the income limits for the GIS and Allowance will have increased in line with inflation prior to retirement. Together, this would normally result in a lower proportion of new retirees becoming eligible for these benefits over the projection period. However, the effect of TFSA income being excluded for GIS and Allowance benefits is projected to partially offset the expected decline in recipient rates for these benefits.
Furthermore, for the GIS and Allowance, experience adjustment factors are used to adjust the projected recipient rates so that characteristics and trends of historical recipient rates by age, sex, type and level of benefit over the period 2015 to 2019 would be reproduced more closely. Recipient rates from 2020 to 2022 were excluded from the adjustment factor analysis, given the uncertainty surrounding the effect of the COVID-19 pandemic. These experience adjustment factors are used for the first five years of the projection period, so that there is a gradual change in the assumed recipient rates by level of benefit that reflects a transition from the historical experience to the longer term projections.
Table 5 presents a summary of the projected recipient rates by type of benefit.
| Benefit | Males | Females | ||||
|---|---|---|---|---|---|---|
| 2022 | 2030 | 2060 | 2022 | 2030 | 2060 | |
| OAS | 94.1 | 94.6 | 94.9 | 95.1 | 95.7 | 96.0 |
| GIS-Single | 12.2 | 13.1 | 11.3 | 23.4 | 24.6 | 21.7 |
| GIS-Spouse a pensioner | 11.0 | 11.7 | 8.7 | 9.4 | 10.2 | 7.7 |
| GIS-Spouse not a pensioner | 3.0 | 2.9 | 2.0 | 0.9 | 0.9 | 0.7 |
| GIS-Spouse with allowance | 1.3 | 1.2 | 1.0 | 0.2 | 0.2 | 0.1 |
| GIS-All Table 5 Footnote 3 | 27.5 | 28.8 | 22.9 | 33.9 | 35.8 | 30.2 |
| Allowance-Regular | 0.6 | 0.8 | 0.6 | 3.4 | 4.4 | 3.6 |
| Allowance-Survivor | 0.2 | 0.2 | 0.1 | 1.3 | 1.0 | 0.3 |
| Allowance-All Table 5 Footnote 3 | 0.8 | 1.0 | 0.7 | 4.6 | 5.3 | 3.9 |
|
Table 5 footnotes
|
||||||
5 Results
5.1 Overview
The key observations and findings of this report are described below.
-
Demographic changes, notably the aging of the Canadian population, will have a major impact on the ratio of the number of people aged 20 to 64 to those aged 65 and over. This ratio is projected to fall from about 3.1 in 2023 to 2.1 in 2060.
-
The number of beneficiaries of the OAS basic pension is projected to increase at a higher pace from 2023 to 2035, growing from an estimated 7.2 million in 2023 to 9.8 million by 2035, mainly due to the continuing retirement of the baby boom generation reaching age 65 over that period. Thereafter, the growth in the number of beneficiaries is projected to be lower. By 2060, the number of OAS basic pension beneficiaries is projected to reach 12.6 million.
-
OAS basic pension annual expenditures are projected to increase from an estimated $59.8 billion in 2023 to $105.7 billion in 2035 and $223.8 billion by 2060.
-
The number of GIS and Allowance beneficiaries is projected to increase at a higher pace from 2023 to 2035, growing from an estimated 2.5 million in 2023 to 3.4 million by 2035. The GIS recipient rate (i.e., the proportion of the Canadian population that has received, receives, or is projected to receive the GIS) is projected to slowly increase from 31.5% in 2023 to 32.5% in 2035 and to then slowly decrease to 26.8% by 2060.
-
GIS and Allowance annual expenditures are projected to increase from an estimated $17.7 billion in 2023 to $30.2 billion in 2035 and $51.3 billion by 2060.
-
Total annual OAS program expenditures are projected to increase from an estimated $77.8 billion in 2023 to $136.6 billion in 2035 and $276.5 billion by 2060.
-
The ratio of program expenditures to the GDP is projected to be 2.51% in 2022 and 2.68% in 2023. This substantial year-over-year increase is mainly due to the 10% increase in the OAS pension in July 2022 for beneficiaries aged 75 and older. Thereafter, as shown in Chart 1, this ratio is projected to reach a high of 3% between 2031 and 2036 due to the retirement of the baby boomers. After 2036, even with the 10% increase to OAS pension payable to individuals aged 75 or older, the ratio of expenditures to GDP is projected to gradually decrease to a level of 2.64% by the late 2050s which is comparable to the historical levels of the early 1990s. This reduction is mainly attributable to expected slower growth in inflation compared to growth in wages and GDP and increases in additional CPP and QPP benefits.
Over time, price indexation of benefits that increases more slowly than the rate of growth in average employment earnings means that benefits will replace a decreasing share of an individual's pre-retirement earnings. One of the sensitivity tests shown in Appendix D of this report provides an indication of the impact on projected results if benefit rates were increased to partially reflect the growth in real wages.
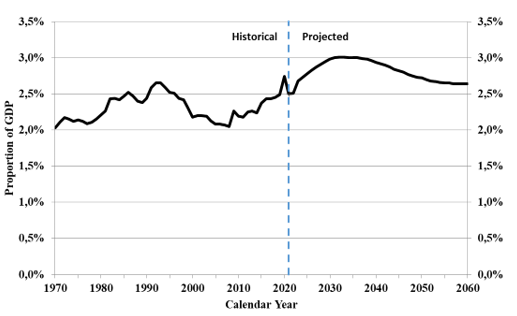
Chart 1 Text version
Total OAS program expenditures are 2.03% of GDP in 1970, increase to reach 2.65% in 1992, then decrease to 2.05% in 2008, and increase again to 2.74% in 2020. It drop to 2.50 in 2020 and 2.51 in 2021. After 2021, the proportion is projected to increase to 3.01% in 2030, and then decrease to 2.64% in 2060.
| Calendar Year | Proportion of GDP |
|---|---|
| 1970 | 2.03% |
| 1971 | 2.11% |
| 1972 | 2.17% |
| 1973 | 2.15% |
| 1974 | 2.12% |
| 1975 | 2.14% |
| 1976 | 2.12% |
| 1977 | 2.09% |
| 1978 | 2.11% |
| 1979 | 2.15% |
| 1980 | 2.21% |
| 1981 | 2.26% |
| 1982 | 2.43% |
| 1983 | 2.44% |
| 1984 | 2.42% |
| 1985 | 2.47% |
| 1986 | 2.52% |
| 1987 | 2.47% |
| 1988 | 2.40% |
| 1989 | 2.38% |
| 1990 | 2.44% |
| 1991 | 2.59% |
| 1992 | 2.65% |
| 1993 | 2.65% |
| 1994 | 2.59% |
| 1995 | 2.52% |
| 1996 | 2.51% |
| 1997 | 2.44% |
| 1998 | 2.42% |
| 1999 | 2.31% |
| 2000 | 2.18% |
| 2001 | 2.20% |
| 2002 | 2.20% |
| 2003 | 2.19% |
| 2004 | 2.13% |
| 2005 | 2.08% |
| 2006 | 2.08% |
| 2007 | 2.07% |
| 2008 | 2.05% |
| 2009 | 2.26% |
| 2010 | 2.19% |
| 2011 | 2.18% |
| 2012 | 2.25% |
| 2013 | 2.26% |
| 2014 | 2.24% |
| 2015 | 2.37% |
| 2016 | 2.43% |
| 2017 | 2.43% |
| 2018 | 2.45% |
| 2019 | 2.49% |
| 2020 | 2.74% |
| 2021 | 2.50% |
| Calendar Year | Proportion of GDP |
|---|---|
| 2022 | 2.51% |
| 2023 | 2.68% |
| 2024 | 2.73% |
| 2025 | 2.78% |
| 2026 | 2.83% |
| 2027 | 2.87% |
| 2028 | 2.91% |
| 2029 | 2.95% |
| 2030 | 2.98% |
| 2031 | 3.00% |
| 2032 | 3.01% |
| 2033 | 3.01% |
| 2034 | 3.00% |
| 2035 | 3.00% |
| 2036 | 3.00% |
| 2037 | 2.99% |
| 2038 | 2.98% |
| 2039 | 2.96% |
| 2040 | 2.94% |
| 2041 | 2.92% |
| 2042 | 2.90% |
| 2043 | 2.87% |
| 2044 | 2.84% |
| 2045 | 2.82% |
| 2046 | 2.80% |
| 2047 | 2.77% |
| 2048 | 2.75% |
| 2049 | 2.73% |
| 2050 | 2.72% |
| 2051 | 2.70% |
| 2052 | 2.68% |
| 2053 | 2.67% |
| 2054 | 2.66% |
| 2055 | 2.65% |
| 2056 | 2.65% |
| 2057 | 2.64% |
| 2058 | 2.64% |
| 2059 | 2.64% |
| 2060 | 2.64% |
5.2 Number of beneficiaries
Table 6 and Table 7 present the historical and projected number of beneficiaries along with the respective overall recipient rates. The number of beneficiaries is the product of the population and the relevant recipient rates, which vary by year, age, sex, and type and level of benefit. Beneficiaries include those who receive benefits outside of Canada. In 2021, about 2.3% of the population aged 65 and older was receiving a basic pension outside of Canada under international social security agreements.
The recipient rates shown in Table 7 reflect the eligible ages for program benefits, that is age 65 and over for the OAS basic pension and GIS, and ages 60 to 64 for the Allowance benefit. The OAS recipient rates also account for voluntary deferrals, which became effective 1 July 2013. The OAS basic pension recipient rates and number of beneficiaries shown in Table 6 and Table 7 are on a gross basis; that is, they have not been adjusted to account for the application of the OAS Recovery Tax, which is a provision of the Income Tax Act.
The OAS Recovery Tax, which applies to high-income pensioners, effectively reduces recipient rates, since very high-income pensioners may have their benefit completely reduced. It is projected that 7.9% (or 575,000) of all OAS pensioners in 2023 will be affected by the Recovery Tax. Of this group, an estimated 189,000 or 2.6% of all OAS pensioners that year will have their pensions completely reduced. In 2060, those affected by the Recovery Tax are projected to represent 10.2% (1.29 million) of all OAS pensioners, while those fully affected are projected to represent 3.5% (442,000) of pensioners. Section 5 of Appendix B presents more detailed information on the projected impact of the OAS Recovery Tax on the number of OAS basic pension beneficiaries and total amounts payable.
As shown in Table 7, the number of beneficiaries for the basic pension is expected to increase at a higher pace from 2023 to 2035, growing from 7.2 million in 2023 to 9.8 million by the end of 2035. After 2035, due to the relative stability in the growth of the population aged 65 and over and in the basic pension recipient rates, the number of beneficiaries is expected to continue to increase but at a slower pace to reach 12.6 million by 2060.
The number of GIS beneficiaries is projected to increase at a higher pace from 2023 to 2035, growing from 2.4 million in 2023 to 3.3 million by 2035. Over that period, the increase in the number of basic pension and GIS beneficiaries is mainly a result of the aging of the population and the retirement of the baby boomers.
It is assumed that, for each cohort of individuals who may become eligible for the GIS or Allowance, the retirement income will consist mainly of base and additional CPP, QPP benefits and TFSA. However, the effect of TFSA is excluded for GIS and Allowance benefits calculation. Both base and additional CPP and QPP benefits increase in line with wage growth prior to retirement and additional benefits further increase as the additional Plans mature. At the same time, it is assumed that the income limits for the GIS and Allowance will have increased in line with inflation prior to retirement. Over the projection period, this combined effect would have the overall effect of reducing the number of individuals who might have otherwise been eligible for the GIS or Allowance benefits.
The number of Allowance beneficiaries is projected to increase over the period 2023 to 2029, going from an estimated 74,000 in 2023 to 77,000 by 2029, with the recipient rates slightly increasing from 2.7% to 3.1% over the same period. After 2029, the Allowance recipient rate increases slightly to 3.2% in the early 2030s before then slowly decreasing. In 2060, the Allowance recipient rate is expected to be 2.3%.
| Year | Population age 65+ (thousands) | Number of beneficiaries (thousands) | Recipient rates (percentages) | ||||
|---|---|---|---|---|---|---|---|
| OAS | GIS | Allowance | OAS | GIS | Allowance | ||
| 1966 | 1,222 | 1,199 | no data - | no data - | 98.1 | no data - | no data - |
| 1970 | 1,716 | 1,689 | 816 | no data - | 98.4 | 47.6 | no data - |
| 1975 | 1,957 | 1,925 | 1,069 | 74 | 98.4 | 54.6 | 8.3 |
| 1980 | 2,306 | 2,259 | 1,191 | 80 | 98.0 | 51.7 | 8.4 |
| 1985 | 2,648 | 2,595 | 1,290 | 119 | 98.0 | 48.7 | 10.5 |
| 1990 | 3,124 | 3,036 | 1,325 | 121 | 97.2 | 42.4 | 10.3 |
| 1995 | 3,506 | 3,447 | 1,338 | 108 | 98.3 | 38.2 | 8.9 |
| 2000 | 3,851 | 3,781 | 1,363 | 95 | 98.2 | 35.4 | 7.6 |
| 2005 | 4,214 | 4,163 | 1,515 | 94 | 98.8 | 35.9 | 6.2 |
| 2010 | 4,804 | 4,732 | 1,614 | 92 | 98.5 | 33.6 | 4.6 |
| 2015 | 5,722 | 5,597 | 1,798 | 77 | 97.8 | 31.4 | 3.4 |
| 2016 | 5,921 | 5,761 | 1,860 | 73 | 97.3 | 31.4 | 3.2 |
| 2017 | 6,135 | 5,944 | 1,927 | 72 | 96.9 | 31.4 | 3.0 |
| 2018 | 6,356 | 6,154 | 1,985 | 73 | 96.8 | 31.2 | 3.0 |
| 2019 | 6,600 | 6,362 | 2,052 | 73 | 96.4 | 31.1 | 2.9 |
| 2020 | 6,846 | 6,581 | 2,095 | 74 | 96.1 | 30.6 | 2.9 |
| 2021 | 7,082 | 6,773 | 2,193 | 76 | 95.6 | 31.0 | 2.9 |
|
Table 6 footnotes
|
|||||||
| Year | Population age 65+ (thousands) | Number of beneficiaries (thousands) | Recipient rates (percentages) | |||||
|---|---|---|---|---|---|---|---|---|
| OAS | GIS | Allowance | OAS | GIS | Allowance | |||
| 2022 | 7,347 | 6,953 | 2,272 | 72 | 94.6 | 30.9 | 2.7 | |
| 2023 | 7,621 | 7,247 | 2,400 | 74 | 95.1 | 31.5 | 2.7 | |
| 2024 | 7,893 | 7,505 | 2,507 | 75 | 95.1 | 31.8 | 2.8 | |
| 2025 | 8,169 | 7,768 | 2,607 | 76 | 95.1 | 31.9 | 2.8 | |
| 2026 | 8,445 | 8,032 | 2,707 | 76 | 95.1 | 32.0 | 2.9 | |
| 2027 | 8,711 | 8,287 | 2,805 | 77 | 95.1 | 32.2 | 3.0 | |
| 2028 | 8,981 | 8,545 | 2,906 | 77 | 95.1 | 32.4 | 3.1 | |
| 2029 | 9,239 | 8,793 | 3,007 | 77 | 95.2 | 32.5 | 3.1 | |
| 2030 | 9,474 | 9,021 | 3,082 | 77 | 95.2 | 32.5 | 3.2 | |
| 2031 | 9,668 | 9,217 | 3,144 | 76 | 95.3 | 32.5 | 3.2 | |
| 2032 | 9,830 | 9,382 | 3,197 | 74 | 95.4 | 32.5 | 3.1 | |
| 2033 | 9,979 | 9,535 | 3,245 | 73 | 95.5 | 32.5 | 3.1 | |
| 2034 | 10,123 | 9,679 | 3,291 | 72 | 95.6 | 32.5 | 3.0 | |
| 2035 | 10,264 | 9,819 | 3,333 | 71 | 95.7 | 32.5 | 3.0 | |
| 2040 | 10,784 | 10,336 | 3,471 | 67 | 95.8 | 32.2 | 2.7 | |
| 2045 | 11,219 | 10,747 | 3,505 | 66 | 95.8 | 31.2 | 2.4 | |
| 2050 | 11,755 | 11,241 | 3,515 | 70 | 95.6 | 29.9 | 2.3 | |
| 2055 | 12,394 | 11,839 | 3,512 | 71 | 95.5 | 28.3 | 2.2 | |
| 2060 | 13,204 | 12,609 | 3,534 | 75 | 95.5 | 26.8 | 2.3 | |
|
Table 7 footnotes
|
||||||||
5.3 Expenditures and average annual benefits
The historical and projected expenditures and average annual benefits by type are presented in Table 8 and Table 9. The amounts of OAS basic pension benefits presented in Table 8 and Table 9 do not account for the OAS Recovery Tax in the determination of benefits. The OAS Recovery Tax reduces the OAS basic pension by 15 cents for each dollar of income above a minimum threshold. It is estimated that, in 2023, approximately 7.9% (or 575,000) of all OAS pensioners will be affected by the Recovery Tax, resulting in the repayment of about $2.6 billion or 4.4% of the total amount of basic pensions payable. Section 5 of Appendix B presents more detailed information on the projected impact of the OAS Recovery Tax on the basic pensions payable.
Total basic pension expenditures are projected to increase from $59.8 billion in 2023 to $105.7 billion by 2035 and $223.8 billion by 2060. The projected average annual basic pension for beneficiaries aged 65 to 74 of $8,003 in 2023 is equal to about 95.9% of the projected maximum annual OAS pension at age 65 for 2023. The projected average annual basic pension for beneficiaries aged 75 and older of $8,538 in 2023 is equal to about 93% of the projection maximum annual OAS pension at age 75 for 2023. The OAS basic pension expenditures and average benefits account for voluntary deferrals, which became effective 1 July 2013, and the 10% increase in the pension payable to beneficiaries aged 75 and older, effective 1 July 2022.
The amounts of GIS and Allowance expenditures presented in Table 9 account for additional CPP and QPP benefits. For each benefit, total expenditures are the product of the number of beneficiaries and respective average benefit by age, sex, and type and level of benefit.
Total GIS expenditures are projected to increase from $17.1 billion in 2023 to $29.6 billion by 2035 and $50.4 billion by 2060. The projected average annual GIS benefit is $7,120 in 2023 which is about 57% of the projected maximum annual GIS single rate for 2023. In the long term, the interaction of TFSAs and additional CPP and QPP benefits results in the average GIS benefit slightly decreasing to about 55% of the maximum GIS single rate by the end of the projection period.
Total Allowance expenditures are projected to increase from $575 million in 2023 to $649 million by 2035 and $966 million by 2060. The projected overall average annual Allowance benefit is $7,820 in 2023, which is about 50% of the projected maximum regular annual benefit for 2023. In the long term, the interaction of TFSAs and additional CPP and QPP benefits results in the average Allowance benefit decreasing to about 39% of the maximum Allowance regular rate by the end of the projection period.
Projected total annual OAS program expenditures for all benefits and administrative expenses are $77.8 billion in 2023, rising to $136.6 billion in 2035 and $276.5 billion by 2060. OAS basic pension benefits are projected to be 77% of total expenditures in 2023, and this proportion is expected to increase to 81% by 2060.
| Year | Expenditures ($ million) | Average annual benefit ($) | ||||||
|---|---|---|---|---|---|---|---|---|
| OAS | GIS | Allowance | Administrative expenses | Total | OAS | GIS | Allowance | |
| 1966 | 1,007 | no data - | no data - | 5 | 1,012 | 840 | no data - | no data - |
| 1970 | 1,611 | 274 | no data - | 9 | 1,894 | 954 | 336 | no data - |
| 1975 | 2,883 | 896 | 13 | 10 | 3,802 | 1,498 | 838 | 179 |
| 1980 | 5,147 | 1,772 | 169 | 34 | 7,122 | 2,279 | 1,488 | 2,119 |
| 1985 | 8,696 | 3,278 | 295 | 60 | 12,329 | 3,351 | 2,542 | 2,478 |
| 1990 | 12,484 | 3,954 | 452 | 67 | 16,957 | 4,112 | 2,985 | 3,732 |
| 1995 | 15,832 | 4,601 | 411 | 106 | 20,950 | 4,593 | 3,439 | 3,802 |
| 2000 | 18,669 | 5,019 | 389 | 89 | 24,166 | 4,937 | 3,682 | 4,087 |
| 2005 | 22,701 | 6,334 | 469 | 104 | 29,608 | 5,453 | 4,182 | 4,978 |
| 2010 | 27,984 | 7,807 | 550 | 126 | 36,467 | 5,913 | 4,837 | 5,999 |
| 2015 | 36,167 | 10,240 | 512 | 159 | 47,078 | 6,462 | 5,695 | 6,692 |
| 2016 | 37,780 | 10,657 | 534 | 173 | 49,144 | 6,558 | 5,728 | 7,279 |
| 2017 | 39,693 | 11,528 | 536 | 209 | 51,966 | 6,678 | 5,983 | 7,408 |
| 2018 | 41,784 | 12,174 | 560 | 226 | 54,744 | 6,790 | 6,132 | 7,659 |
| 2019 | 43,945 | 12,901 | 558 | 263 | 57,667 | 6,907 | 6,287 | 7,678 |
| 2020 | 46,110 | 13,573 | 566 | 310 | 60,559 | 7,007 | 6,479 | 7,646 |
| 2021 | 48,035 | 13,862 | 550 | 340 | 62,787 | 7,093 | 6,320 | 7,230 |
|
Table 8 footnotes
|
||||||||
| Year | Expenditures ($ million) | Average annual benefit ($) | ||||||
|---|---|---|---|---|---|---|---|---|
| OAS | GIS | Allowance | Administrative expenses | Total | OAS | GIS | Allowance | |
| 2022 | 53,497 | 15,499 | 543 | 348 | 69,887 | 7,694 | 6,823 | 7,514 |
| 2023 | 59,764 | 17,092 | 575 | 387 | 77,818 | 8,247 | 7,120 | 7,820 |
| 2024 | 63,668 | 18,265 | 596 | 413 | 82,942 | 8,483 | 7,286 | 7,992 |
| 2025 | 67,554 | 19,381 | 615 | 438 | 87,988 | 8,696 | 7,433 | 8,122 |
| 2026 | 71,411 | 20,473 | 629 | 463 | 92,976 | 8,891 | 7,564 | 8,229 |
| 2027 | 75,255 | 21,571 | 641 | 487 | 97,954 | 9,081 | 7,690 | 8,328 |
| 2028 | 79,257 | 22,718 | 651 | 513 | 103,139 | 9,275 | 7,816 | 8,421 |
| 2029 | 83,304 | 23,891 | 659 | 539 | 108,393 | 9,474 | 7,944 | 8,515 |
| 2030 | 87,308 | 24,952 | 663 | 565 | 113,488 | 9,678 | 8,096 | 8,610 |
| 2031 | 91,124 | 25,920 | 662 | 589 | 118,295 | 9,886 | 8,246 | 8,750 |
| 2032 | 94,761 | 26,845 | 659 | 611 | 122,876 | 10,100 | 8,398 | 8,852 |
| 2033 | 98,384 | 27,755 | 655 | 634 | 127,428 | 10,319 | 8,552 | 8,958 |
| 2034 | 102,027 | 28,662 | 651 | 657 | 131,997 | 10,541 | 8,710 | 9,061 |
| 2035 | 105,731 | 29,575 | 649 | 680 | 136,635 | 10,768 | 8,873 | 9,160 |
| 2040 | 123,622 | 33,849 | 650 | 791 | 158,912 | 11,961 | 9,753 | 9,694 |
| 2045 | 142,055 | 37,515 | 693 | 901 | 181,164 | 13,219 | 10,703 | 10,474 |
| 2050 | 163,878 | 41,260 | 770 | 1,030 | 206,938 | 14,578 | 11,738 | 11,049 |
| 2055 | 190,362 | 45,317 | 866 | 1,183 | 237,728 | 16,079 | 12,903 | 12,117 |
| 2060 | 223,808 | 50,370 | 966 | 1,376 | 276,520 | 17,750 | 14,251 | 12,840 |
|
Table 9 footnotes
|
||||||||
5.4 Cost ratios
Since the program is financed from general revenues on a pay-as-you-go basis, it is useful to express its annual expenditures in relative terms rather than in absolute dollar terms. For this reason, the expenditures are presented as cost ratios using GDP as a measurement basis.
The GDP is projected by assuming that it will increase at the same rate as CPP total earnings as projected under the 31st CPP Actuarial Report as at 31 December 2021. Table 10 and Table 11 present the historical and projected annual expenditures as a percentage of GDP. The projection of the GDP also reflects adjustments made under the 31st CPP Actuarial Report to account for the subsequent event in that report reflecting the escalation of the conflict in Ukraine. The same subsequent event is taken into account for this 18th OAS Program Actuarial Report, as described in section 2.3.
The cost ratio of program expenditures to the GDP is projected to be 2.51% in 2022 and 2.68% in 2023. This substantial year-over-year increase is mainly due to the 10% increase in the OAS pension in July 2022 for beneficiaries aged 75 and older. The retirement of the baby boomers is projected to increase the expenditures of the program, and the ratio is projected to reach a high of 3% during the 2030s. Thereafter, although the impacts of TFSAs reduce the amount of income for benefit calculation purposes and tend to increase this ratio over the long term, the growth in additional CPP and QPP benefits and the fact that OAS benefits are indexed to inflation as opposed to wages drive down the cost of the OAS program relative to the GDP over the long term. As a result, annual expenditures are expected to gradually fall to 2.64% of GDP by the late 2050s which is comparable to the historical levels of the early 1990s.
The projected expenditures shown in Table 11 reflect the eligible ages for program benefits, that is, age 65 and over for the OAS basic pension and GIS, and ages 60 to 64 for the Allowance benefit. The OAS basic pension expenditures also account for voluntary deferrals, which became effective 1 July 2013, and the 10% increase in the OAS pension in July 2022 for beneficiaries aged 75 and older.
| Year | Gross domestic product | Expenditures as % of gross domestic productTable 10 Footnote 1 | ||||
|---|---|---|---|---|---|---|
| OAS | GIS | Allowance | Administrative expenses | Total | ||
| 1966 | 67 | 1.51 | no data - | no data - | 0.01 | 1.52 |
| 1970 | 93 | 1.73 | 0.29 | no data - | 0.01 | 2.03 |
| 1975 | 178 | 1.62 | 0.50 | 0.01 | 0.01 | 2.14 |
| 1980 | 323 | 1.59 | 0.55 | 0.05 | 0.01 | 2.21 |
| 1985 | 500 | 1.74 | 0.66 | 0.06 | 0.01 | 2.47 |
| 1990 | 696 | 1.79 | 0.57 | 0.06 | 0.01 | 2.44 |
| 1995 | 832 | 1.90 | 0.55 | 0.05 | 0.01 | 2.52 |
| 2000 | 1,106 | 1.69 | 0.45 | 0.04 | 0.01 | 2.18 |
| 2005 | 1,422 | 1.60 | 0.45 | 0.03 | 0.01 | 2.08 |
| 2010 | 1,666 | 1.68 | 0.47 | 0.03 | 0.01 | 2.19 |
| 2015 | 1,990 | 1.82 | 0.51 | 0.03 | 0.01 | 2.37 |
| 2016 | 2,026 | 1.87 | 0.53 | 0.03 | 0.01 | 2.43 |
| 2017 | 2,141 | 1.85 | 0.54 | 0.03 | 0.01 | 2.43 |
| 2018 | 2,236 | 1.87 | 0.54 | 0.03 | 0.01 | 2.45 |
| 2019 | 2,314 | 1.90 | 0.56 | 0.02 | 0.01 | 2.49 |
| 2020 | 2,210 | 2.09 | 0.61 | 0.03 | 0.01 | 2.74 |
| 2021 | 2,510 | 1.91 | 0.55 | 0.02 | 0.01 | 2.50 |
|
Table 10 footnotes
|
||||||
| Year | Gross domestic product | Expenditures as % of gross domestic product Table 11 Footnote 1 | ||||
|---|---|---|---|---|---|---|
| OAS | GIS | Allowance | Administrative expenses | Total | ||
| 2022 | 2,785 | 1.92 | 0.56 | 0.02 | 0.01 | 2.51 |
| 2023 | 2,907 | 2.06 | 0.59 | 0.02 | 0.01 | 2.68 |
| 2024 | 3,043 | 2.09 | 0.60 | 0.02 | 0.01 | 2.73 |
| 2025 | 3,169 | 2.13 | 0.61 | 0.02 | 0.01 | 2.78 |
| 2026 | 3,289 | 2.17 | 0.62 | 0.02 | 0.01 | 2.83 |
| 2027 | 3,413 | 2.20 | 0.63 | 0.02 | 0.01 | 2.87 |
| 2028 | 3,541 | 2.24 | 0.64 | 0.02 | 0.01 | 2.91 |
| 2029 | 3,672 | 2.27 | 0.65 | 0.02 | 0.01 | 2.95 |
| 2030 | 3,806 | 2.29 | 0.66 | 0.02 | 0.01 | 2.98 |
| 2031 | 3,944 | 2.31 | 0.66 | 0.02 | 0.01 | 3.00 |
| 2032 | 4,088 | 2.32 | 0.66 | 0.02 | 0.01 | 3.01 |
| 2033 | 4,238 | 2.32 | 0.65 | 0.02 | 0.01 | 3.01 |
| 2034 | 4,393 | 2.32 | 0.65 | 0.01 | 0.01 | 3.00 |
| 2035 | 4,553 | 2.32 | 0.65 | 0.01 | 0.01 | 3.00 |
| 2040 | 5,401 | 2.29 | 0.63 | 0.01 | 0.01 | 2.94 |
| 2045 | 6,423 | 2.21 | 0.58 | 0.01 | 0.01 | 2.82 |
| 2050 | 7,620 | 2.15 | 0.54 | 0.01 | 0.01 | 2.72 |
| 2055 | 8,965 | 2.12 | 0.51 | 0.01 | 0.01 | 2.65 |
| 2060 | 10,481 | 2.14 | 0.48 | 0.01 | 0.01 | 2.64 |
|
Table 11 footnotes
|
||||||
6 Reconciliation with previous triennial report
6.1 Introduction
The results presented in this report differ from those presented in the previous triennial report, the 16th Actuarial Report on the OAS program as at 31 December 2018, for a variety of reasons. Differences between the actual experience from 2019 through 2021 and that projected in the 16th Actuarial Report on the OAS program are addressed in subsection 6.2 below. Since historical results provide the starting point for the projections shown in this report, these historical differences between actual and projected experience have an effect on the projections. Detailed reconciliations of the projected expenditures are presented in Appendix C.
6.2 Experience update – 2019 to 2021
The components of change in the program expenditures from 31 December 2018 to 31 December 2021 are summarized in Table 12.
| Expenditures | Actual | Expected Table 12 Footnote 2 | Difference actual less expected |
|---|---|---|---|
| Expenditures for the OAS | 138,090 | 139,057 | (967) |
| Expenditures for the GIS | 40,336 | 41,268 | (932) |
| Expenditures for the allowance | 1,674 | 1,887 | (213) |
| Administrative expenses | 913 | 729 | 184 |
| Total expenditures | 181,014 | 182,941 | (1,927) |
| Gross domestic product | 7,033,000 | 6,854,000 | 179,000 |
| Expenditures as % of GDP | 2.57 | 2.67 | (0.10) |
|
Table 12 footnotes
|
|||
OAS basic pension expenditures during the period were $967 million lower than projected. For the most part, this is because there were about 0.9% fewer beneficiaries due to higher deferrals than expected. GIS expenditures were $932 million lower than projected and Allowance expenditures were $213 million lower than projected due to the impact of the recent increase in the earnings exemption for GIS and Allowances, which took effect 1 July 2020. This is mainly due to fewer GIS and Allowance beneficiaries resulting from the new exemption, about 1.8% and 16.1% fewer, respectively compared to the projected number. Administrative expenses were $184 million higher than expected over the period.
Total GDP over the period was 2.6% higher than projected. As a result, overall expenditures relative to the GDP were about 3.7% lower than projected, being 2.57% of GDP instead of 2.67%.
6.3 Changes in expenditures as a percentage of the GDP
Table 13 presents the main elements of all changes in the expenditures expressed as a percentage of the GDP since the 16th Actuarial Report on the OAS program, including the changes that have arisen over the period 2019 to 2021 from amendments to the program, which were reflected in the 17th Actuarial Report on the OAS program.
The amendments which increase, starting 1 July 2022, the OAS pension payable to individuals aged 75 or older by 10% are projected to increase expenditures as a percentage of GDP by 0.13 percentage points by 2060. The combined changes in economic assumptions result in the increase of the projected GDP, and therefore the drop in the cost ratio. However, over the long term, the cost ratio increases due to lower real wage growth which reduces the growth of the projected GDP. The update in experience and changes in all assumptions lead to lower cost ratios for most of the projection period compared to the previous 16th Actuarial Report on the OAS program, with the difference between the ratios under this actuarial report and the previous one decreasing over time. In 2030, the cost ratio is 2.98% compared to 3.12% under the previous actuarial report. By 2060, the cost ratio increases to 2.64%, which is slightly higher compared to 2.63% under the previous actuarial report.
| Reconciliation of expenditures | 2022 | 2030 | 2060 |
|---|---|---|---|
| 16th Actuarial report on the OAS program | 2.75 | 3.12 | 2.63 |
Legislated amendments:
|
0.05 | 0.12 | 0.13 |
| Total amendments | 0.05 | 0.12 | 0.13 |
| Improvements in methodology | 0.00 | 0.00 | 0.00 |
| Experience Update (2019 to 2021) | (0.03) | (0.04) | (0.09) |
| Changes in demographic assumptions | (0.02) | (0.10) | (0.01) |
| Changes in economic assumptions | (0.16) | (0.06) | 0.04 |
| Changes in benefit assumptions | (0.08) | (0.06) | (0.06) |
| 18th Actuarial report on the OAS program | 2.51 | 2.98 | 2.64 |
6.4 Changes in expenditures
Table 14 presents the main elements of all changes in the expenditures since the 16th Actuarial Report on the OAS program, including the changes that have arisen over the period 2019 to 2021 from amendments to the program, which were reflected in the 17th Actuarial Report on the OAS program.
The amendments which increase, starting 1 July 2022, the OAS pension payable to individuals aged 75 or older by 10% are projected to increase expenditures by about $4 billion in 2030 and $12 billion by 2060. Changes to the economic assumptions (especially higher price inflation) also lead to an increase in expenditures due to benefit indexation. These increases are offset to a small extent by changes in demographic assumptions in the short term and to a greater extent by changes in benefit assumptions over the entire projection period. The net result is expenditures that are about 10% higher in 2030 and 14% higher in 2060 compared to projected expenditures in the 16th Actuarial Report on the OAS program.
| Reconciliation of expenditures | 2022 | 2030 | 2060 |
|---|---|---|---|
| 16th Actuarial report on the OAS program | 68.28 | 103.20 | 243.43 |
Legislated amendments:
|
1.21 | 4.03 | 11.59 |
| Total amendments | 1.21 | 4.03 | 11.59 |
| Improvements in methodology | 0.00 | 0.00 | 0.00 |
| Experience update (2019 to 2021) | (0.04) | 0.75 | 2.13 |
| Changes in demographic assumptions | (0.07) | (0.46) | 3.28 |
| Changes in economic assumptions | 2.81 | 8.32 | 22.20 |
| Changes in benefit assumptions | (2.31) | (2.35) | (6.11) |
| 18th Actuarial report on the OAS program | 69.89 | 113.49 | 276.52 |
7 Actuarial opinion
In our opinion, considering that this 18th Actuarial Report on the Old Age Security program as at 31 December 2021 was prepared pursuant to the Public Pensions Reporting Act:
- the data on which this report is based are sufficient and reliable for the purposes of this report;
- the assumptions used are, individually and in aggregate, reasonable and appropriate for the purposes of this report; and
- the methods employed are appropriate for the purposes of this report.
This report has been prepared, and our opinions given, in accordance with accepted actuarial practice in Canada, in particular, the General Standards and the Practice-Specific Standards for Social Security Programs of the Standards of Practice of the Canadian Institute of Actuaries.
As of the date of the signing of this report, we have not learned of any events, other than the events already accounted for in section 2.3 of this report, that would have a material impact on the actuarial review of the OAS program as at 31 December 2021.
Assia Billig, FCIA, FSA, PhD
Chief Actuary
Laurence Frappier, FCIA, FSA
Senior Actuary
François Boulé, FCIA, FSA
Senior Actuary
Michel Montambeault, FCIA, FSA
Senior Actuary
Ottawa, Canada
27 June 2023
Appendix A — Summary of program provisions
A.1 Introduction
The Old Age Security Act came into force on 1 January 1952. Benefits provided under the Old Age Security Act include the basic pension, the Guaranteed Income Supplement, and the Allowance, which started being paid in 1952, 1967, and 1975, respectively. The Allowance for the survivor benefit started in 1985.
Since the inception of the Old Age Security program, the Old Age Security Act has been amended several times. The Old Age Security Act was most recently amended by the Budget Implementation Act, 2021, No. 1 (Bill C-30), which received Royal Assent on 21 June 2021.
Division 31 of Part 4 of Bill C-30 amended the Old Age Security Act to increase, effective
1 July 2022, the OAS pension payable to individuals aged 75 and older by 10%. The increase applies to all basic pension amounts, including voluntarily deferred pensions. The additional benefits are indexed to inflation going forward.
Bill C-30 also provided for a one-time payment of $500 in August 2021 to OAS pensioners who were age 75 or older as of June 2022. This one-time payment was exempt from the definition of income for the GIS and was funded through a statutory appropriation as opposed to being part of the Old Age Security Act and, as such, is not reflected in the cost estimates presented in this report.
The 17th Actuarial Report Supplementing the Actuarial Report on the Old Age Security program as at 31 December 2018 was prepared in accordance with the Public Pensions Reporting Act to show the effect of these amendments on the OAS program. The 17th Actuarial Report on the OAS program was tabled in the House of Commons on 4 February 2022.
This Appendix A is meant only to provide a summary of the provisions of the OAS program. The legislation shall prevail if there is a discrepancy between it and this summary.
A.2 Financing
All benefits provided under the Old Age Security Act are financed from federal general tax revenues.
A.3 Basic pension
The OAS basic pension is a monthly benefit available, on application, to anyone age 65 or over who meets the residence and legal status requirements specified in the Old Age Security Act.
A.3.1 Eligibility conditions
To qualify for an OAS basic pension, a person must be 65 years of age or older, and
- must be a Canadian citizen or a legal resident of Canada on the day preceding the approval of his or her application; or
- if the person no longer lives in Canada, must have been a Canadian citizen or a legal resident of Canada on the day preceding the day he or she stopped living in Canada.
A minimum of 10 years of residence in Canada after reaching age 18 is required to receive an OAS basic pension in Canada. To receive the OAS pension outside the country, a person must have lived in Canada for a minimum of 20 years after reaching age 18. An international social security agreement may assist a person to meet the 10‑ and 20‑year requirements. As of 1 January 2011, the OAS basic pension is not payable to incarcerated individuals in accordance with the provisions of the Eliminating Entitlements for Prisoners Act.
A.3.2 Amount of benefits
The amount of a person's pension is determined by the individual age and by how long he or she has lived in Canada, according to the following rules:
- The OAS pension payable to a person aged 75 or older is increased by 10%.
- A person who has lived in Canada, after reaching age 18, for periods that total at least 40 years may qualify for a full OAS pension.
- A person who has not lived in Canada for 40 years after reaching age 18 may still qualify for a full pension if, on 1 July 1977, he or she was 25 years of age or over, and
- lived in Canada on that date, or
- had lived in Canada before that date and after reaching age 18, or
- possessed a valid immigration visa on that date.
In such cases, the individual must have lived in Canada for the 10 years immediately prior to the approval of the application for the pension. Absences during this 10-year period may be offset if, after reaching age 18, the applicant was present in Canada before those 10 years for a total period that was at least three times the length of absence. In this instance, however, the applicant must also have lived in Canada for at least one year immediately prior to the date of the approval of the application. For example, an absence of two years between the ages of 60 and 62 could be offset by six years of presence in Canada after age 18 and before reaching age 55.
- A person who cannot meet the requirements for the full OAS pension may qualify for a partial pension. A partial pension is earned at the rate of 1/40th of the full monthly pension for each complete year of residence in Canada after reaching age 18. Once a partial pension has been approved, it may not be increased as a result of additional years of residence in Canada. As an example, an individual with 20 complete years of residence in Canada at the time of application for the OAS pension would be entitled to 50% (or 20/40) of the maximum monthly OAS pension for the remainder of his/her lifetime.
Effective 1 July 2013, individuals may opt to defer receiving the OAS basic pension by up to five years after the eligible age (i.e., age 65 or older for those meeting the minimum residency requirement after age 65) in exchange for a higher pension. The deferred pensions are actuarially adjusted upward by 0.6% per month for each month after the eligible age until the month in which the application for the pension is approved (the deferral period) but in no case later than age 70. For those eligible for a basic pension at age 65, the maximum pension adjustment is 36% at age 70. In the case where an individual, who is entitled to a partial pension, chooses to defer receipt of the pension, the pension amount paid is the greater of the actuarially adjusted pension over the individual's deferral period and the higher pension resulting from accruing additional years of residency over that period.
The OAS basic pension is subject to income tax. The maximum monthly pension payable from age 65 to 74 was $691.00 and from age 75 was $760.10 during the second quarter of 2023 The OAS basic pension is adjusted quarterly in line with changes in the CPI, as described in subsection 6.
The amount of the pension paid to persons with high incomes is reduced through a provision of the Income Tax Act often referred to as the "OAS Recovery Tax". For benefits payable in 2023, the reduction applies to individuals whose total net annual income exceeds $86,912 in that calendar year. For this purpose, an individual's total net annual income is after pension income splitting, if that option is elected by OAS beneficiaries who are married or common-law partners.
OAS Recovery Tax deductions are withheld at source. The deductions are estimates of the tax owed and are recalculated in July of each year based on the OAS recipient's previous year's net income. The Recovery Tax actually owed for a given year is determined the following year and compared to the deductions made, with the given year's tax liability adjusted accordingly.
The income threshold for the Recovery Tax is indexed upward in accordance with increases in the CPI. For every dollar of income above this limit, the amount of the basic pension is reduced by 15 cents. Income earned within a TFSA or withdrawals made from a TFSA are excluded from total net annual income for the purpose of determining the amount of the OAS Recovery Tax, which could then result in a higher basic pension payable.
As an example, an OAS recipient with a net annual income of $96,912 in 2023 would incur a Recovery Tax of $1,500 in 2023. The full 2023 annual OAS basic pension is thus eliminated when a pensioner's net annual income is $142,192 or above in 2023, for individuals aged 65-75 and is $147,720 for those aged 75 and over. (Estimated as of the second quarter of 2023 based on annualized OAS benefits of $8,292.00 for individuals aged 65-74 and $9,121.20 for those aged 75 and over).
A.4 Guaranteed income supplement
The GIS is a monthly benefit paid to residents of Canada who receive an OAS basic pension (either the full amount or a partial amount) and who have little or no other income.
Payment of the GIS may begin in the same month as payment of the basic pension. The amount of the benefit varies according to income (see below). Most individuals receiving the GIS can continue to do so by filing their income tax returns, rather than making a new application each year. The amount of monthly payments may increase or decrease according to reported changes in a person's yearly income. Any income earned within a TFSA or withdrawals made from a TFSA are not considered as income for the purpose of determining the level of GIS benefit entitlement.
Unlike the OAS basic pension, the GIS is not subject to income tax. The GIS is not payable outside Canada beyond a period of six months following the month of departure from Canada, regardless of how long the person previously lived in Canada.
A.4.1 Eligibility conditions
To receive the GIS, a person must be receiving an OAS basic pension. Eligibility for the GIS is determined every year based on the previous year's income. Income (as defined for purposes of the GIS and Allowance benefits under the Old Age Security Act) received in the previous year is used to calculate the amount of benefits paid during the period starting on 1 July of a calendar year and ending on 30 June of the following calendar year. However, if an individual or an individual's spouse or common-law partner has retired or has suffered a loss of income, an estimate of income may be substituted for the income of the preceding year.
In general, income as defined under the Income Tax Act is included subject to certain exemptions. Exemptions from income include any payments received under the OAS program (basic pension, GIS, and Allowance benefits), the first $5,000 of employment or self-employment income and 50% of employment or self-employment income between $5,000 and $15,000. In combination, the full and partial employment income exemption can result in a maximum total employment income exemption of $10,000.
The resulting estimated income of an individual (or, the combined income of the individual and his or her spouse or common-law partner) cannot exceed certain limits as described later.
Persons admitted to Canada as sponsored immigrants after 6 March 1996 and qualifying for benefits after January 2001 are not eligible, generally speaking, to receive the GIS for the duration of a sponsorship, up to a maximum of ten years. Exceptions are made, however, if an immigrant's sponsor dies, is incarcerated for a period of more than six months, is convicted of a criminal offence relating to the sponsored individual, or undergoes personal bankruptcy. A spouse or common-law partner who becomes involuntarily separated due to, for example, incarceration or institutionalization of his or her spouse or partner, is considered to be single in regard to applying for the GIS benefit.
Since a person may only receive the GIS if also in receipt of the OAS basic pension, the GIS is not payable to incarcerated individuals as per the provisions of the Eliminating Entitlements for Prisoners Act.
A.4.2 Amount of benefits
The amount of the GIS to which a person is entitled depends on his or her length of residence in Canada, marital status, and income. If the person is married or living in a common‑law relationship, the combined income of the person and his or her spouse or common-law partner is taken into consideration when the amount of the GIS benefit is calculated.
To be entitled to a full GIS benefit, applicants must have resided in Canada for at least 10 years after reaching age 18. For applicants who are admitted to Canada after 6 March 1996 and qualify for OAS benefits after January 2001, and who have less than 10 years of residence in Canada after age 18, a partial benefit is payable provided, as noted in the previous section, that the person is not a sponsored immigrant who is still in the period of sponsorship. The partial benefit is calculated at the rate of 1/10th of the amount of the full benefit for each complete year of residence in Canada after age 18. The proportion payable is recalculated each year, taking into account additional residence in Canada during the previous year, building gradually to a full benefit after 10 years.
There are two rates of payment for a GIS benefit. The single rate applies to single individuals – including widowed, divorced or separated persons as well as individuals who have never married and to persons for whom their spouses or common-law partners do not receive either the OAS pension or the Allowance. The single rate also applies to spouses or common-law partners who become involuntarily separated from their spouses or partners as mentioned above. During the second quarter of 2023 the maximum monthly GIS single benefit (including the top-up, discussed below) is $1,032.10.
The married rate applies both to married couples and to couples living in common‑law relationships, where either both spouses are OAS pensioners or where one spouse is eligible for the Allowance benefit. During the second quarter of 2023, the maximum monthly GIS married benefit (including the top-up, discussed below) is $621.25.
The single rate is higher than the married rate, reflecting the higher cost of living alone. However, each member of a married or common-law couple is entitled to his or her own benefit, so the combined benefits for a couple are higher than those for a single person.
As of 1 July 2011, top-up benefits are payable to GIS recipients who receive benefits at the single rate, as described above, and to couples that include a GIS recipient. For the second quarter of 2023, the top-up benefits are $159.87 and $45.29 per month for single-rate recipients and each spouse or common-law partner of a couple, respectively, and are adjusted quarterly in line with changes in the CPI, as described in subsection 6.
The top-ups are reduced by 25 cents for every dollar of income in excess of $2,000 for GIS single recipients and $4,000 of combined income for couples. In the second quarter of 2023, the income limits for the top-ups are $9,680 for GIS single recipients, $19,360 for couples where the GIS recipient's spouse or common law partner does not receive a basic pension or Allowance, and $8,416 for couples where the GIS recipient's spouse or common law partner is either an OAS pensioner or Allowance recipient.
A special provision applies to persons who receive a partial OAS pension. In this case, the supplement is increased by the difference between the maximum OAS pension and the partial OAS pension in order to provide the same combined monthly pension and supplement to beneficiaries with the same level of income. The additional amount may result in the supplement exceeding the maximum GIS payable.
As an example, during the second quarter of 2023, a single person aged 66 years old with no income who is entitled to a partial pension of $172.75 (25% of the maximum monthly OAS pension of $691.00) would be entitled to an additional supplement of $518.25 for a total supplement of $1,550.35 (i.e., $1,032.10 plus $518.25, including the top-up).
For a single, widowed, divorced or separated person, the maximum monthly GIS benefit is reduced by 50 cents for every dollar of monthly income (i.e., annual income divided by 12). This reduction is in addition to any reduction to the top-up. For example, in the second quarter of 2023, a monthly income of $800 would reduce the maximum monthly GIS payable by $558.00 to $474.10. In this case, the maximum allowable annual income before GIS stops being paid is $20,952 in the second quarter of 2023.
If both spouses or common-law partners are receiving the OAS basic pension, the maximum monthly GIS of each person is reduced by 25 cents for every dollar of other combined monthly income (i.e. annual income divided by 12), which is in addition to any reduction applied to the top-up. For example, a combined monthly income of $1,400 for a couple would reduce the maximum monthly GIS benefit payable to each spouse or common-law partner by $395.29 to $225.96 in the second quarter of 2023. In this case, the maximum allowable annual income before the GIS stops being paid is $27,648 in the second quarter of 2023.
A special provision applies in the case of a couple in which only one spouse or common-law partner is a pensioner and the other is not eligible for either the OAS pension or the Allowance. In this instance, the pensioner can receive the GIS at the higher rate paid to those who are single. Moreover, the maximum monthly GIS is reduced by 25 cents for every dollar of the couple's combined monthly income (i.e. annual income divided by 12), and the reduction of 25 cents is applied only when the combined monthly income of the couple exceeds the maximum monthly OAS pension, where that amount, if not a multiple of $4, is rounded to the next higher multiple of $4 (i.e. $694 in the second quarter of 2023). This reduction is in addition to any reduction applied to the top-up benefit. As an example, a couple with a combined monthly income of $2,000 would see their maximum monthly GIS benefit reduced by $486.87 to $545.23 in the second quarter of 2023. In this case, the maximum allowable annual income before GIS stops being paid is $50,208 in the second quarter of 2023.
In the case of a couple in which one spouse or common-law partner receives the GIS and the other receives the Allowance, the GIS is paid at the rate paid to those who are married, and the maximum monthly GIS is reduced by 25 cents for every dollar of the couple's combined monthly income (i.e. annual income divided by 12). The reduction of 25 cents is applied only when the combined monthly income of the couple exceeds four-thirds times the maximum monthly OAS pension, where that pension, if not a multiple of $3, is rounded to the next higher multiple of $3 (i.e., income above $924, in the second quarter of 2023). This reduction is in addition to any reduction applied to the top-up. As an example, a couple with a combined monthly income of $1,400 would see the pensioner's maximum monthly GIS benefit at the married rate reduced by $164.29 to $ 456.96 in the second quarter of 2023. In this case, for the second quarter of 2023, the maximum allowable annual income before the GIS stops being paid is $ 50,208.
GIS recipients whose spouse or common-law partner is incarcerated are considered to be single recipients for the purpose of determining the amount of the GIS benefit.
All GIS benefits including top-ups are adjusted quarterly in line with changes in the CPI, as described in subsection 6. No actuarial adjustment is applied to GIS benefits payable to OAS pensioners who defer receiving their basic pensions in exchange for actuarially-adjusted higher pensions.
A.5 Allowance
The Allowance monthly benefit is designed to recognize the difficult circumstances faced by couples living on the pension of only one spouse as well as by many widowed persons. Since 1999, most of those receiving the Allowance can continue to do so by filing their income tax returns, rather than making a new application each year. Effective 1 July 1999, income (as defined for purposes of the GIS and the Allowance benefits under the Old Age Security Act) received in the previous calendar year is used to calculate the amount of benefits paid during the period starting on 1 July of a calendar year and ending on 30 June of the following calendar year.
Like the GIS, Allowance benefits are not subject to income tax. In addition, also like the GIS benefit, Allowance benefits are not payable outside Canada beyond a period of six months following the month of departure from Canada, regardless of how long the person previously lived in Canada.
A.5.1 Eligibility conditions
The Allowance may be paid to the spouse or common-law partner of a senior receiving OAS and GIS benefits, or to a survivor, who, in each case, is between the ages of 60 and 64 and who has lived in Canada for at least 10 years after reaching age 18. An applicant must also be a Canadian citizen or a legal resident of Canada on the day preceding the approval of the application. The same income exclusions and deductions that apply to the GIS also apply to the Allowance benefit.
The Allowance stops being paid when the person becomes eligible for a basic pension at age 65, leaves Canada for more than six months, or dies. For a couple, the Allowance stops being paid if the older spouse or common-law partner ceases to be eligible for the GIS, or if the spouses separate, divorce, or dissolve their common-law partnership. In addition, in the case of survivors, the Allowance ceases if the person remarries. Sponsored immigrants are subject to the same conditions regarding eligibility as are described in the preceding section regarding the GIS. As of 1 January 2011, the Allowance is not payable to any individual incarcerated in an institution in accordance with the provisions of the Eliminating Entitlements for Prisoners Act. However, Allowance benefits to spouses or common-law partners of incarcerated individuals remain payable.
A.5.2 Amount of benefits
The Allowance is an income tested benefit. Like the GIS, if the recipient is married or living in a common law relationship, the combined income of the recipient and his or her spouse or common-law partner is taken into account in determining the amount of the Allowance. In addition, to be entitled to the full or partial Allowance benefits, the same rules apply as for GIS benefits regarding admittance to and years of residence in Canada and the recalculation of benefits, described above in section A.4.2.
As of 1 July 2011, top-up benefits are payable to Allowance recipients for both the regular benefit (i.e., Allowance spouses and common-law partners of GIS recipients) and the survivor benefit. In the second quarter of 2023, the top-up benefits are $45.29 and $159.87 for the regular and survivor Allowance benefits, respectively, and are adjusted quarterly in line with changes in the CPI, as described in subsection 6. The top-ups are reduced by 25 cents for every dollar of income in excess of $2,000 for Allowance (survivor) recipients and $4,000 of combined income for couples. In the second quarter of 2023, the income limits for the top-ups are $8,416 for the regular Allowance benefit and $9,680 for the survivor Allowance benefit.
The maximum amount payable to the spouse of a pensioner under the regular Allowance benefit is equal to the combination of a full OAS pension and the maximum GIS at the married rate. This amount is $1,312.25 (including the top-up) during the second quarter of 2023. The maximum amount payable for the survivor Allowance benefit is higher than the regular Allowance benefit, recognizing the higher cost of living alone. The maximum monthly survivor Allowance amount is $1,564.30 during the second quarter of 2023.
The OAS‑equivalent portion of the maximum monthly Allowance benefit (regular and survivor) is reduced at a rate of 75 cents for every dollar of the person's or couple's monthly income (i.e., annual income divided by 12) until this portion is reduced to zero, which in the second quarter of 2023 corresponds to monthly income reaching $924. Up to this level of income the GIS portion remains payable at the maximum. For the regular Allowance benefit, both the GIS‑equivalent portion of the Allowance and the pensioner's GIS are then reduced by 25 cents for every additional dollar of the couple's combined monthly income, i.e., in this case no regular Allowance benefit becomes payable if the annual income exceeds $38,736 in the second quarter of 2023. For the survivor Allowance benefit, the GIS‑equivalent portion is reduced by 50 cents for every additional dollar of monthly income, i.e., in this case, for the second quarter of 2023, no survivor Allowance benefit becomes payable if annual income exceeds $28,224. The reductions to the Allowance benefits are in addition to any applied to the top-ups.
As examples, for a couple including a GIS recipient and Allowance recipient, with a combined monthly income of $1,400, the maximum monthly Allowance benefit would be reduced by $855.29 to $456.96 in the second quarter of 2023. For a survivor Allowance recipient with a monthly income of $800, the maximum benefit would be reduced by $758 to $806.30 in the second quarter of 2023.
In the case where a pensioner of a spouse of common-law partner is incarcerated, the couple's monthly income for the purpose of determining the spousal Allowance benefit is the monthly income of the spouse or common-law partner only.
All Allowance benefits including top-ups are adjusted quarterly in line with changes in the CPI, as described in subsection 6. No actuarial adjustment is applied to Allowance benefits payable to spouses or common-law partners of OAS pensioners who defer receiving their basic pensions in exchange for actuarially-adjusted higher pensions.
A.6 Inflation adjustments
All benefit amounts under the Old Age Security Act are adjusted at the beginning of each calendar quarter in line with changes in the CPI. However, if the CPI decreases, benefit amounts do not decrease, but are held constant until the CPI exceeds its previous peak.
Appendix B — Data, assumptions and methodology
B.1 Introduction and context
This Appendix describes the data, assumptions, and methods that underlie the financial projections in the Results section 5 of this report.
Future expenditures and cost ratios are projected over a long period of time, i.e., up to the year 2060, and depend on assumptions such as those regarding fertility, mortality, migration, labour force participation, job creation, unemployment, inflation, and employment earnings. These assumptions form the basis for the projections of future expenditures of the program and cost measurement base.
Although the demographic and economic assumptions represent the Chief Actuary's best estimates, the resulting estimates should be interpreted with caution. These estimates are not intended to be predictions, but rather projections of the costs of the program. These assumptions are generally consistent with the best-estimate assumptions used in the 31st CPP Actuarial Report as at 31 December 2021.
The future expenditures of the OAS depend on many economic factors. It is important to define the individual economic assumptions in the context of a long‑term overall economic perspective. For this report, it is assumed that, despite the current uncertain outlook for major economies, a moderate and sustainable growth in the Canadian economy will persist throughout the projection period.
The actuarial examination of the OAS involves the projection of its expenditures over a long period of time. Although best judgment is used regarding future economic trends, it is nonetheless difficult to anticipate all economic changes that may occur during the projection period. There will always be some degree of uncertainty.
The COVID-19 pandemic affected the labour markets deeply during 2020 and 2021 because of sanitary measures and lockdowns. Significant job losses and elevated unemployment rates were also observed. However, by the end 2021, main labour market measures had rebounded to pre-pandemic levels in most sectors of the economy. Short-term uncertainty due to the pandemic exists with other variables such as mortality, migration and wages.
The uncertainty surrounding high inflation due to the demand and supply shocks caused by the pandemic, has been exacerbated by the conflict in Ukraine. Given the significant effects on the financial projections for the OAS, the escalation of the conflict in Ukraine is considered a subsequent event that was taken into account for the purpose of this 18th Actuarial Report on the OAS.
Furthermore, the projected aging of the population combined with the continued retirement of the baby boom generation over the next few decades will certainly create significant social and economic changes. It is possible that the evolution of the working-age population, especially the active population, will be quite different from what has been historically observed and what has been assumed for the purpose of this report.
Other factors that add to the uncertainty include the timing and pace of transition to a green economy, the pace of technological advances and innovation as well as worldwide policies on protectionism vs. globalization.
As all these events evolve, the economic and demographic environments continue to be subject to sustained volatility and unpredictability. The OCA will continue to monitor current and emerging trends and will adjust assumptions as needed in future reports.
B.2 Data
The data used for this report is the same as for the 31st CPP Actuarial Report (see Table 37 of that report). In addition, historical data on OAS program beneficiaries were obtained from Employment and Social Development Canada (ESDC) and the Canada Revenue Agency (CRA) provided income tax return information.
B.3 Demographic assumptions
The historical and projected populations of Canada are required for the calculation of future benefits. The population of Canada as at 1 July 2021 is used as a starting point. The population is then projected by age and sex from one year to the next by adding births and net migrants and subtracting deaths. Applying the fertility, migration, and mortality assumptions to the starting population develops the annual numbers of births, net migrants, and deaths.
B.3.1 Initial population as at 1 July 2021
The starting point for the demographic projections is based on the most recent Statistics Canada population estimates as at 1 July 2021 for Canada, by age and sex. The estimates are based on the 2016 Census. The estimates are adjusted by ungrouping ages 100 and older into individual ages using the observed distribution of OAS program beneficiaries by age for ages 100 and older.
B.3.2 Fertility rates
There are two definitions for the fertility rate: the total fertility rate and the cohort fertility rate. The total fertility rate corresponds to the average number of children born in a given calendar year. Specifically, it is the sum of the fertility rates by age group for women aged 15 to 49 in a given calendar year. In comparison, the cohort fertility rate is the average number of children born to a woman in her lifetime, for women born in a specific year. It gives an idea of trends and variations between different generations over time.
The total fertility rate in Canada has declined significantly since the baby boom period, when the rate peaked at nearly 4.0 per woman in the late 1950s. The baby bust period that followed in the mid-1960s initiated a decline in total fertility rates, resulting in a record low of 1.6 children per woman by the mid-1980s. The total fertility rate rose slightly in the early 1990s, but then generally declined to a level of 1.5 by the late 1990s. Starting in the 2000s, Canada was one of many industrialized countries that saw their total fertility rates increase. By 2008, the total fertility rate for Canada had reached 1.68. However, in some industrialized countries, including Canada, the total fertility rate has decreased since 2008, which could be attributable to the 2008 economic downturn, continued economic uncertainty, as well as other factors.
The total fertility rate for Canada was 1.47 in 2019 and 1.40 in 2020. The significant decrease in 2020 could be due to the high level of uncertainty and much lower immigration caused by the COVID-19 pandemic.
Fertility rates are affected by many factors, including social attitudes, reproductive technologies, as well as economic and environmental conditions. Although there have been periods of growth in the total fertility rates in recent decades, it is unlikely that the rates will return to historical levels in the absence of significant societal changes. It is assumed for this report that the continued economic uncertainty and the COVID-19 pandemic have caused a temporary downward effect on total fertility rates, with couples choosing to postpone having any or more children until conditions improve. These effects were taken into consideration along with historical trends in age-specific fertility rates over the last 15 years. Given the uncertainty surrounding the effect of the COVID-19 pandemic on fertility rates in the year 2020, the data for that year were excluded from the analysis for purposes of setting the fertility rates for years 2021 and beyond. The historical data considered are therefore from the 15-year period ending in 2019.
In 2021, the Government of Canada announced that it would work with provinces and territories to establish a Canada-Wide Early Learning and Child Care PlanFootnote 1. The fertility rate assumptions for this 18th Actuarial Report on the OAS take into account the proposed plan. Consistent with what was experienced in Québec with the introduction of the QPIP, the plan could lead to an increase in fertility rates for certain age groups and hence was considered in setting the assumptions for this report. The effect on the fertility rates is assumed to occur over the first several years following the adoption of the system before leveling out.
To determine the ultimate total fertility rate for Canada, the historical fertility rate of each age group was studied and projected independently. Based on historical analysis and the factors mentioned above, it is assumed that the total fertility rate from 2029 onward for Canada will be 1.54 children per woman, which is lower than the ultimate rate of 1.62 assumed for the 16th Actuarial Report on the OAS.
Although the historical total fertility rates, based on age-group rates, are used to set the assumption for the future, it is nonetheless useful and informative to consider the historical progression of the cohort fertility rates. Over time, the assumed age-group rates lead to cohort fertility rates which converge to the total fertility rate assumption, as shown for Canada in Table 15.
The cohort fertility rates in Canada have declined over time. For females born in 1940, who reached the end of their childbearing years (turned age 49) in 1989, the cohort rates was 2.69. However, for females reaching the end of their childbearing years in 2019 (born in 1970), the fertility rates was 1.78.
Finally, in accordance with the average experience over the last 10, 20, and 30 years, the assumed ratio of male to female newborns is 1.053, which is essentially the same as for the 16th Actuarial Report on the OAS.
| Year of birth of woman Table 15 Footnote 1 | Annual fertility rates by age froup (per 1,000 women) | Cohort fertility rates per woman Table 15 Footnote 2 | ||||||
|---|---|---|---|---|---|---|---|---|
| 15-19 | 20-24 | 25-29 | 30-34 | 35-39 | 40-44 | 45-49 | ||
| 1940 | 59.7 | 231.6 | 152.6 | 70.5 | 20.3 | 3.1 | 0.1 | 2.69 |
| 1945 | 54.7 | 161.4 | 130.4 | 65.7 | 19.9 | 3.3 | 0.1 | 2.18 |
| 1950 | 45.0 | 118.9 | 126.2 | 67.6 | 23.3 | 4.2 | 0.2 | 1.93 |
| 1955 | 37.4 | 103.7 | 121.1 | 73.6 | 29.0 | 5.2 | 0.2 | 1.85 |
| 1960 | 31.3 | 91.3 | 117.5 | 86.1 | 32.6 | 6.2 | 0.4 | 1.83 |
| 1965 | 26.0 | 76.8 | 121.2 | 84.9 | 36.4 | 7.9 | 0.5 | 1.77 |
| 1970 | 22.7 | 76.5 | 104.7 | 91.3 | 48.5 | 10.6 | 0.8 | 1.78 |
| 1975 | 25.6 | 64.6 | 97.9 | 106.1 | 53.4 | 11.7 | 0.9* | 1.80* |
| 1980 | 20.0 | 54.2 | 101.9 | 107.7 | 57.1 | 13.6* | 1.0* | 1.78* |
| 1985 | 14.9 | 52.6 | 96.3 | 108.0 | 61.0* | 15.6* | 1.0* | 1.75* |
| 1990 | 13.9 | 44.6 | 87.2 | 108.0* | 69.7* | 16.5* | 1.0* | 1.70* |
| 1995 | 12.1 | 37.1 | 78.7* | 115.4* | 73.2* | 16.5* | 1.0* | 1.67* |
| 2000 | 7.8 | 28.5* | 75.6* | 118.3* | 73.2* | 16.5* | 1.0* | 1.60* |
| 2005 | 5.7* | 23.1* | 74.5* | 118.3* | 73.2* | 16.5* | 1.0* | 1.56* |
| 2006 | 5.5* | 22.0* | 74.5* | 118.3* | 73.2* | 16.5* | 1.0* | 1.55* |
| 2007 | 5.3* | 20.9* | 74.5* | 118.3* | 73.2* | 16.5* | 1.0* | 1.55* |
| 2008 | 5.2* | 20.9* | 74.5* | 118.3* | 73.2* | 16.5* | 1.0* | 1.55* |
| 2009 | 5.0* | 20.9* | 74.5* | 118.3* | 73.2* | 16.5* | 1.0* | 1.55* |
| 2010 | 4.8* | 20.9* | 74.5* | 118.3* | 73.2* | 16.5* | 1.0* | 1.55* |
| 2011 | 4.7* | 20.9* | 74.5* | 118.3* | 73.2* | 16.5* | 1.0* | 1.54* |
| 2012+ | 4.5* | 20.9* | 74.5* | 118.3* | 73.2* | 16.5* | 1.0* | 1.54* |
|
Table 15 footnotes
|
||||||||
Table 16 shows the projected age-specific and total fertility rates by calendar year for Canada.
| Year | Annual fertility rates by age group (per 1,000 women) | Total | ||||||
|---|---|---|---|---|---|---|---|---|
| 15-19 | 20-24 | 25-29 | 30-34 | 35-39 | 40-44 | 45-49 | ||
| 2022 | 5.7 | 28.5 | 78.7 | 108.0 | 61.0 | 13.6 | 0.9 | 1.48 |
| 2023 | 5.5 | 27.4 | 78.0 | 109.5 | 62.8 | 14.0 | 0.9 | 1.49 |
| 2024 | 5.3 | 26.3 | 77.4 | 110.9 | 64.5 | 14.4 | 0.9 | 1.50 |
| 2025 | 5.2 | 25.3 | 76.8 | 112.4 | 66.3 | 14.8 | 0.9 | 1.51 |
| 2026 | 5.0 | 24.2 | 76.2 | 113.9 | 68.0 | 15.2 | 0.9 | 1.52 |
| 2027 | 4.8 | 23.1 | 75.6 | 115.4 | 69.7 | 15.6 | 1.0 | 1.53 |
| 2028 | 4.7 | 22.0 | 75.0 | 116.8 | 71.4 | 16.1 | 1.0 | 1.53 |
| 2029+ | 4.5 | 20.9 | 74.5 | 118.3 | 73.2 | 16.5 | 1.0 | 1.54 |
Chart 2 shows the historical and projected total and cohort fertility rates for Canada.
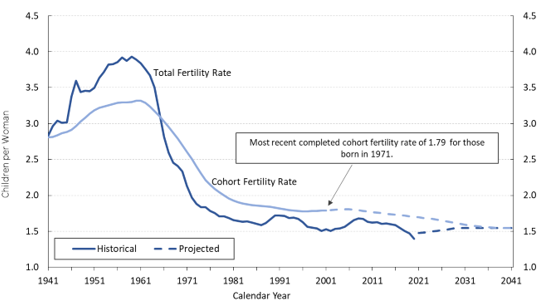
Chart 2 Text version
The Total Fertility Rate is 2.8 children per woman in 1941, increases overall to reach its highest point of 3.9 in 1959, and then decreases significantly to 1.6 by the mid-1980s. From the mid-1980s until 2020, the Total Fertility Rate has periods of growth and decline, fluctuating between 1.5 and 1.7, with a value of 1.40 in 2020. After 2020, the rate is projected to gradually increase to reach 1.54 in 2029 and remain at that level thereafter.
The cohort fertility rate is 2.8 children per woman in 1941, increases to its highest point of 3.3 in 1960, then decreases thereafter, reaching a projected value of 1.54 by 2041.
The most recent completed cohort fertility rate of 1.78 in 2020 is for those born in 1970.
| Calendar Year | Cohort Fertility Rates Historical | Total Fertility Rates Historical |
|---|---|---|
| 1941 | 2.8 | 2.8 |
| 1942 | 2.8 | 3.0 |
| 1943 | 2.8 | 3.0 |
| 1944 | 2.9 | 3.0 |
| 1945 | 2.9 | 3.0 |
| 1946 | 2.9 | 3.4 |
| 1947 | 3.0 | 3.6 |
| 1948 | 3.0 | 3.4 |
| 1949 | 3.1 | 3.5 |
| 1950 | 3.1 | 3.5 |
| 1951 | 3.2 | 3.5 |
| 1952 | 3.2 | 3.6 |
| 1953 | 3.2 | 3.7 |
| 1954 | 3.3 | 3.8 |
| 1955 | 3.3 | 3.8 |
| 1956 | 3.3 | 3.9 |
| 1957 | 3.3 | 3.9 |
| 1958 | 3.3 | 3.9 |
| 1959 | 3.3 | 3.9 |
| 1960 | 3.3 | 3.9 |
| 1961 | 3.3 | 3.8 |
| 1962 | 3.3 | 3.8 |
| 1963 | 3.2 | 3.7 |
| 1964 | 3.2 | 3.5 |
| 1965 | 3.1 | 3.1 |
| 1966 | 3.0 | 2.8 |
| 1967 | 3.0 | 2.6 |
| 1968 | 2.9 | 2.5 |
| 1969 | 2.8 | 2.4 |
| 1970 | 2.7 | 2.3 |
| 1971 | 2.6 | 2.1 |
| 1972 | 2.5 | 2.0 |
| 1973 | 2.4 | 1.9 |
| 1974 | 2.3 | 1.8 |
| 1975 | 2.2 | 1.8 |
| 1976 | 2.1 | 1.8 |
| 1977 | 2.1 | 1.8 |
| 1978 | 2.0 | 1.7 |
| 1979 | 2.0 | 1.7 |
| 1980 | 2.0 | 1.7 |
| 1981 | 1.9 | 1.7 |
| 1982 | 1.9 | 1.6 |
| 1983 | 1.9 | 1.6 |
| 1984 | 1.9 | 1.6 |
| 1985 | 1.9 | 1.6 |
| 1986 | 1.9 | 1.6 |
| 1987 | 1.9 | 1.6 |
| 1988 | 1.8 | 1.6 |
| 1989 | 1.8 | 1.7 |
| 1990 | 1.8 | 1.7 |
| 1991 | 1.8 | 1.7 |
| 1992 | 1.8 | 1.7 |
| 1993 | 1.8 | 1.7 |
| 1994 | 1.8 | 1.7 |
| 1995 | 1.8 | 1.7 |
| 1996 | 1.8 | 1.6 |
| 1997 | 1.8 | 1.6 |
| 1998 | 1.8 | 1.6 |
| 1999 | 1.8 | 1.5 |
| 2000 | 1.8 | 1.5 |
| 2001 | 1.8 | 1.5 |
| 2002 | nil - | 1.5 |
| 2003 | nil - | 1.5 |
| 2004 | nil - | 1.5 |
| 2005 | nil - | 1.6 |
| 2006 | nil - | 1.6 |
| 2007 | nil - | 1.7 |
| 2008 | nil - | 1.7 |
| 2009 | nil - | 1.7 |
| 2010 | nil - | 1.6 |
| 2011 | nil - | 1.6 |
| 2012 | nil - | 1.6 |
| 2013 | nil - | 1.6 |
| 2014 | nil - | 1.6 |
| 2015 | nil - | 1.6 |
| 2016 | nil - | 1.6 |
| 2017 | nil - | 1.5 |
| 2018 | nil - | 1.5 |
| 2019 | nil - | 1.5 |
| 2020 | nil - | 1.4 |
| Calendar Year | Cohort Fertility Rates Projected | Total Fertility Rates Projected |
|---|---|---|
| 2002 | 1.8 | nil - |
| 2003 | 1.8 | nil - |
| 2004 | 1.8 | nil - |
| 2005 | 1.8 | nil - |
| 2006 | 1.8 | nil - |
| 2007 | 1.8 | nil - |
| 2008 | 1.8 | nil - |
| 2009 | 1.8 | nil - |
| 2010 | 1.8 | nil - |
| 2011 | 1.8 | nil - |
| 2012 | 1.8 | nil - |
| 2013 | 1.8 | nil - |
| 2014 | 1.7 | nil - |
| 2015 | 1.7 | nil - |
| 2016 | 1.7 | nil - |
| 2017 | 1.7 | nil - |
| 2018 | 1.7 | nil - |
| 2019 | 1.7 | nil - |
| 2020 | 1.7 | nil - |
| 2021 | 1.7 | 1.5 |
| 2022 | 1.7 | 1.5 |
| 2023 | 1.7 | 1.5 |
| 2024 | 1.7 | 1.5 |
| 2025 | 1.7 | 1.5 |
| 2026 | 1.7 | 1.5 |
| 2027 | 1.6 | 1.5 |
| 2028 | 1.6 | 1.5 |
| 2029 | 1.6 | 1.5 |
| 2030 | 1.6 | 1.5 |
| 2031 | 1.6 | 1.5 |
| 2032 | 1.6 | 1.5 |
| 2033 | 1.6 | 1.5 |
| 2034 | 1.6 | 1.5 |
| 2035 | 1.6 | 1.5 |
| 2036 | 1.6 | 1.5 |
| 2037 | 1.6 | 1.5 |
| 2038 | 1.5 | 1.5 |
| 2039 | 1.5 | 1.5 |
| 2040 | 1.5 | 1.5 |
| 2041 | 1.5 | 1.5 |
Chart 2 footnotes
- Chart 2 footnote 1
-
Cohort fertility rates are based on the age of a woman being 30 in a given calendar year. For instance, the cohort fertility rate for the year 2016 pertains to women born in 1986.
B.3.3 Mortality
For this report, the mortality rate projections start from the year 2019 mortality rates of Statistics Canada (2019 Canada Life Tables or 2019 CLT). According to Statistics Canada, life expectancies at birth in 2019 without any assumed future improvements in mortality (i.e., reductions in mortality) for males and females in Canada were 80.3 and 84.4 years, respectively, compared to 80.8 and 84.6 years projected under the 16th Actuarial Report on the OAS. At age 65 in 2019, life expectancies were 19.6 and 22.4 years according to Statistics Canada, compared to 20.0 and 22.6 years projected under the 16th Actuarial Report on the OAS for males and females, respectively.
Although Statistics Canada's 2020 CLT were published in January 2022, they were not used as the starting point for mortality rates nor for developing mortality improvement rates beyond 2020 given that they reflect significant increases related to COVID-19 deaths. However, 2020 mortality rates and mortality improvement rates reflect Statistics Canada's 2020 CLT. In 2020, life expectancy at birth (without future mortality improvements) stood at 79.5 for males and 84.0 for females, a decrease from 2019 of 0.7 and 0.4 for males and females respectively.
The average annual mortality improvement rates experienced in Canada over the 15-year period from 2004 to 2019 by age and sex were used as the basis for projecting annual mortality improvement rates from 2021 onward. Improvement rates by age and sex for years 2021 to 2039 were determined by cubic interpolation between:
- the improvement rates of year 2019 and
- the assumed ultimate improvement rates described below in respect of the period 2039 and thereafter.
For the year 2039 and thereafter for Canada, the assumed ultimate annual rates of mortality improvement vary by age only and not by sex or calendar year. The assumed ultimate mortality improvement rates are derived using a combination of backward- and forward-looking approaches. The analysis of the Canadian experience over the period from 1921 to 2019 was combined with an analysis of the possible drivers of future mortality improvements. Mortality improvement rates for males at most ages are currently higher than those for females but are assumed to decrease to the same level as female rates from 2039 onward.
The ultimate rate for both sexes for ages 0 to 89 is set at 0.8% per year from 2039 onward for Canada. For ages above 89, the ultimate improvement rate is set to reduce from 0.5% for the 90 to 94 age group to 0.2% for those aged 95 and older.
Once the projected mortality rates were calculated using the assumed mortality improvement rates, additional factors were then applied to the mortality rates in order to reflect the additional increase in mortality rates due to the COVID-19 pandemic as well as the impact of the opioid crisis.
For 2021, COVID-19 mortality adjustment factors by age group were determined using data on the number of COVID-19 deaths from both Health Canada and Statistics Canada. Due to the uncertainty of the effects of COVID-19 on mortality, these adjustment factors were phased out over the two year period 2022-2023. The pandemic is therefore assumed to have a residual effect on mortality in 2022, followed by an assumed full recovery and reversion to the projected unadjusted mortality rates for years 2023 and onward.
Over the last decade, Canada has been faced with an important increase in accidental drug poisoning deaths and the COVID-19 pandemic has exacerbated the issue. Opioid overdose is a relatively new cause of death, and it is a subset of accidental drug poisoning deaths. It is more prevalent in the 25 to 49 age group and among men. In order to reflect the impact of the pandemic on the opioid-related deaths, opioid-related mortality adjustment factors were derived using data from both Health Canada and Statistics Canada. These mortality adjustment factors apply only to the year 2021 (they are assumed to be 0 for years 2022 and beyond). It is further assumed that, over the next decade, the opioid crisis in Canada will subside, due to several government initiatives to increase awareness and reduce opioid supply. Projected mortality rates of those age groups affected by the opioid crisis are assumed to revert back to normal levels, leading to a period of high growth in mortality improvement rates.
Table 17 shows the total adjustment factors, i.e., taking into account the assumed increase in COVID-19 deaths and in opioid-related deaths resulting from the pandemic, that were applied to the mortality rates for the period 2021-2022. For reference purpose, the table also shows the actual increases in mortality rates for 2020. Table 17 shows the total adjustments by age, which amount to increases in mortality rates of 6.0% in 2020, 5.5% in 2021, and 2.0% in 2022.
| Age group | 2020 | 2021 | 2022 |
|---|---|---|---|
| 0-19 | 1.0 | 1.0 | 0.0 |
| 20-29 | 12.0 | 12.0 | 0.0 |
| 30-39 | 13.0 | 13.0 | 1.0 |
| 40-49 | 8.0 | 8.0 | 1.0 |
| 50-59 | 5.0 | 5.0 | 1.0 |
| 60-69 | 5.0 | 3.0 | 1.0 |
| 70-79 | 4.0 | 4.0 | 2.0 |
| 80+ | 7.0 | 6.0 | 2.0 |
| Total | 6.0 | 5.5 | 2.0 |
Table 18 shows historical (2019 and 2020), the resulting initial adjusted (2021-2022), intermediate (2023-2038) and ultimate (2039+) assumed annual mortality improvement rates for Canada.
| Age | Males | Females | |||||||||||
|---|---|---|---|---|---|---|---|---|---|---|---|---|---|
| 2019 | 2020 | 2021 | 2022 | 2023-2038 Table 18 Footnote 1 | 2039+ | 2019 | 2020 | 2021 | 2022 | 2023-2038 Table 18 Footnote 1 | 2039+ | ||
| 0 | 1.2 | 4.3 | (3.1) | 2.1 | 1.0 | 0.8 | 1.2 | (2.6) | 3.9 | 2.2 | 1.0 | 0.8 | |
| 1-19 | 2.4 | (1.4) | 4.9 | 3.3 | 1.5 | 0.8 | 0.9 | 7.3 | (7.8) | 1.8 | 0.8 | 0.8 | |
| 20-39 | (0.6) | (21.5) | 6.7 | 10.7 | 1.3 | 0.8 | (1.0) | (18.3) | 3.8 | 10.5 | 1.2 | 0.8 | |
| 40-64 | 1.3 | (13.4) | 9.1 | 5.7 | 1.1 | 0.8 | 1.4 | (5.8) | 2.7 | 5.8 | 1.1 | 0.8 | |
| 65-74 | 1.8 | (3.3) | 3.3 | 3.6 | 1.3 | 0.8 | 1.3 | (2.9) | 2.0 | 3.2 | 1.1 | 0.8 | |
| 75-84 | 1.8 | (2.0) | 0.6 | 4.5 | 1.3 | 0.8 | 1.1 | (2.9) | 0.3 | 3.9 | 1.1 | 0.8 | |
| 85-89 | 1.9 | (2.9) | 0.9 | 5.5 | 1.4 | 0.8 | 1.6 | (3.5) | 0.7 | 5.2 | 1.2 | 0.8 | |
| 90-94 | 1.4 | (4.3) | 1.3 | 5.2 | 1.1 | 0.5 | 1.3 | (4.0) | 0.7 | 5.0 | 1.0 | 0.5 | |
| 95+ | 0.6 | (1.6) | (2.8) | 4.1 | 0.5 | 0.2 | 0.6 | (2.8) | (1.4) | 4.2 | 0.5 | 0.2 | |
|
Table 18 footnotes
|
|||||||||||||
The resulting projected mortality rates in Table 19 indicate a continuous decrease in mortality rates over the long term. For example, the mortality rate at age 65 for males is expected to decrease from about 10 deaths per thousand people in 2022 to 7 deaths per thousand people by 2060. The gap in mortality rates between males and females at each age is also expected to decrease over the projection period.
| Age | Males | Females | ||||
|---|---|---|---|---|---|---|
| 2022 | 2030 | 2060 | 2022 | 2030 | 2060 | |
| 0 | 4.71 | 4.33 | 3.39 | 3.74 | 3.43 | 2.68 |
| 10 | 0.07 | 0.06 | 0.05 | 0.07 | 0.07 | 0.05 |
| 20 | 0.60 | 0.52 | 0.40 | 0.29 | 0.27 | 0.21 |
| 30 | 1.05 | 0.96 | 0.71 | 0.49 | 0.46 | 0.34 |
| 40 | 1.40 | 1.32 | 1.04 | 0.79 | 0.73 | 0.58 |
| 50 | 2.77 | 2.48 | 1.93 | 1.76 | 1.59 | 1.24 |
| 60 | 6.54 | 5.72 | 4.43 | 4.15 | 3.67 | 2.86 |
| 65 | 10.43 | 9.20 | 7.15 | 6.68 | 5.99 | 4.67 |
| 70 | 16.96 | 14.74 | 11.44 | 11.12 | 9.91 | 7.74 |
| 75 | 27.85 | 24.34 | 18.91 | 18.86 | 17.02 | 13.32 |
| 80 | 46.45 | 40.68 | 31.63 | 32.71 | 29.60 | 23.18 |
| 85 | 77.88 | 67.02 | 51.90 | 57.47 | 50.93 | 39.69 |
| 90 | 135.60 | 119.46 | 97.82 | 104.95 | 93.32 | 76.58 |
| 100 | 336.40 | 314.17 | 287.22 | 292.54 | 271.89 | 248.28 |
Chart 3 show the historical and projected life expectancies at age 65, since 1966, based on each given year's mortality rates (i.e., without future mortality improvements).
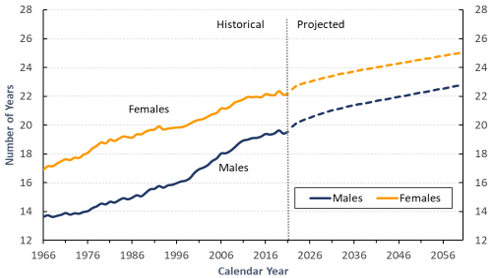
Chart 3 Text version
Life expectancy at age 65 for males is 13.6 years in 1966, increases to 19.5 in 2021, and is projected to increase to 22.8 years in 2060.
Life expectancy at age 65 for females is 16.9 years in 1966, increases to 22.2 in 2021, and is projected to increase to 25.0 years in 2060.
| Year | Males-historical | Females-historical |
|---|---|---|
| 1966 | 68.8 | 75.4 |
| 1967 | 68.9 | 75.7 |
| 1968 | 69.1 | 75.8 |
| 1969 | 69.2 | 76 |
| 1970 | 69.3 | 76.3 |
| 1971 | 69.6 | 76.6 |
| 1972 | 69.5 | 76.6 |
| 1973 | 69.7 | 76.8 |
| 1974 | 69.7 | 76.9 |
| 1975 | 70 | 77.2 |
| 1976 | 70.4 | 77.7 |
| 1977 | 70.6 | 78 |
| 1978 | 70.9 | 78.3 |
| 1979 | 71.3 | 78.6 |
| 1980 | 71.6 | 78.7 |
| 1981 | 72 | 79.1 |
| 1982 | 72.3 | 79.2 |
| 1983 | 72.7 | 79.5 |
| 1984 | 73 | 79.8 |
| 1985 | 73 | 79.7 |
| 1986 | 73.2 | 79.8 |
| 1987 | 73.5 | 80.1 |
| 1988 | 73.6 | 80.2 |
| 1989 | 73.9 | 80.4 |
| 1990 | 74.2 | 80.6 |
| 1991 | 74.4 | 80.7 |
| 1992 | 74.7 | 81 |
| 1993 | 74.6 | 80.8 |
| 1994 | 74.9 | 80.9 |
| 1995 | 75 | 81 |
| 1996 | 75.4 | 81.1 |
| 1997 | 75.7 | 81.2 |
| 1998 | 75.9 | 81.4 |
| 1999 | 76.1 | 81.6 |
| 2000 | 76.6 | 81.8 |
| 2001 | 76.9 | 81.9 |
| 2002 | 77.1 | 82 |
| 2003 | 77.2 | 82.2 |
| 2004 | 77.6 | 82.4 |
| 2005 | 77.8 | 82.5 |
| 2006 | 78.2 | 82.8 |
| 2007 | 78.2 | 82.8 |
| 2008 | 78.5 | 83 |
| 2009 | 78.9 | 83.3 |
| 2010 | 79.2 | 83.5 |
| 2011 | 79.5 | 83.7 |
| 2012 | 79.6 | 83.8 |
| 2013 | 79.7 | 83.9 |
| 2014 | 79.8 | 83.9 |
| 2015 | 79.8 | 83.9 |
| 2016 | 79.9 | 84 |
| 2017 | 79.8 | 84 |
| 2018 | 79.8 | 84 |
| 2019 | 80.2 | 84.4 |
| 2020 | 79.5 | 84 |
| 2021 | 79.9 | 84.1 |
| Year | Males-projected | Females-projected |
|---|---|---|
| 2022 | 80.5 | 84.6 |
| 2023 | 80.8 | 84.9 |
| 2024 | 81 | 85 |
| 2025 | 81.2 | 85.1 |
| 2026 | 81.3 | 85.2 |
| 2027 | 81.5 | 85.3 |
| 2028 | 81.6 | 85.4 |
| 2029 | 81.7 | 85.5 |
| 2030 | 81.9 | 85.6 |
| 2031 | 82 | 85.7 |
| 2032 | 82.1 | 85.8 |
| 2033 | 82.2 | 85.9 |
| 2034 | 82.3 | 86 |
| 2035 | 82.4 | 86.1 |
| 2036 | 82.5 | 86.2 |
| 2037 | 82.6 | 86.2 |
| 2038 | 82.7 | 86.3 |
| 2039 | 82.8 | 86.4 |
| 2040 | 82.9 | 86.4 |
| 2041 | 82.9 | 86.5 |
| 2042 | 83 | 86.6 |
| 2043 | 83.1 | 86.7 |
| 2044 | 83.2 | 86.7 |
| 2045 | 83.3 | 86.8 |
| 2046 | 83.3 | 86.9 |
| 2047 | 83.4 | 86.9 |
| 2048 | 83.5 | 87 |
| 2049 | 83.6 | 87.1 |
| 2050 | 83.7 | 87.1 |
| 2051 | 83.7 | 87.2 |
| 2052 | 83.8 | 87.3 |
| 2053 | 83.9 | 87.3 |
| 2054 | 84 | 87.4 |
| 2055 | 84.1 | 87.5 |
| 2056 | 84.1 | 87.6 |
Chart 3 footnotes
- Chart 3 footnote 1
-
Actuarial Report (18th) on the Old Age Security Program, as at 31 December 2021
Table 20 shows projected Canadian life expectancies at various ages for the specified calendar years, also based on each given year's mortality rates (without future improvements). Table 21 is similar to Table 20, the only difference being that it takes into account the assumed mortality improvements after the specified calendar years (with future improvements).
Given the continuing trend in increased longevity, Table 21 is considered to be more realistic than Table 20, especially for the older ages. At the same time, the extended length of the projection period increases the uncertainty of the results presented in Table 21 for younger ages.
From 2022 to 2060, Canadian life expectancy at age 65 (with assumed future mortality improvements) is projected to grow from 21.3 to 23.6 years for males and from 23.8 to 25.9 years for females, as shown in Table 21.
| Age | Males | Females | ||||
|---|---|---|---|---|---|---|
| 2022 | 2030 | 2060 | 2022 | 2030 | 2060 | |
| 0 | 80.5 | 81.9 | 84.4 | 84.6 | 85.6 | 87.8 |
| 10 | 71.0 | 72.3 | 74.8 | 75.0 | 76.0 | 78.1 |
| 20 | 61.1 | 62.4 | 64.9 | 65.1 | 66.1 | 68.2 |
| 30 | 51.6 | 52.9 | 55.2 | 55.3 | 56.3 | 58.4 |
| 40 | 42.2 | 43.4 | 45.6 | 45.6 | 46.6 | 48.6 |
| 50 | 32.9 | 34.1 | 36.2 | 36.1 | 37.0 | 38.9 |
| 60 | 24.0 | 25.1 | 27.1 | 26.9 | 27.8 | 29.6 |
| 65 | 19.9 | 20.9 | 22.8 | 22.5 | 23.3 | 25.0 |
| 70 | 16.0 | 17.0 | 18.7 | 18.3 | 19.1 | 20.7 |
| 75 | 12.5 | 13.4 | 14.8 | 14.5 | 15.2 | 16.6 |
| 80 | 9.4 | 10.1 | 11.4 | 11.0 | 11.6 | 12.8 |
| 85 | 6.8 | 7.4 | 8.3 | 8.0 | 8.5 | 9.4 |
| 90 | 4.6 | 5.0 | 5.6 | 5.5 | 5.9 | 6.5 |
| 100 | 2.2 | 2.3 | 2.5 | 2.5 | 2.7 | 2.9 |
|
Table 20 footnotes
|
||||||
| Age | Males | Females | ||||
|---|---|---|---|---|---|---|
| 2022 | 2030 | 2060 | 2022 | 2030 | 2060 | |
| 0 | 86.7 | 87.3 | 89.4 | 90.0 | 90.5 | 92.3 |
| 10 | 76.4 | 77.0 | 79.1 | 79.8 | 80.3 | 82.0 |
| 20 | 65.8 | 66.4 | 68.6 | 69.2 | 69.8 | 71.6 |
| 30 | 55.5 | 56.1 | 58.2 | 58.8 | 59.3 | 61.2 |
| 40 | 45.3 | 45.9 | 48.0 | 48.5 | 49.0 | 50.8 |
| 50 | 35.3 | 35.9 | 37.9 | 38.3 | 38.8 | 40.6 |
| 60 | 25.8 | 26.4 | 28.2 | 28.5 | 29.0 | 30.7 |
| 65 | 21.3 | 21.9 | 23.6 | 23.8 | 24.3 | 25.9 |
| 70 | 17.2 | 17.7 | 19.3 | 19.4 | 19.8 | 21.3 |
| 75 | 13.4 | 13.9 | 15.3 | 15.3 | 15.7 | 17.0 |
| 80 | 10.0 | 10.4 | 11.6 | 11.6 | 11.9 | 13.1 |
| 85 | 7.1 | 7.5 | 8.4 | 8.3 | 8.7 | 9.6 |
| 90 | 4.8 | 5.1 | 5.7 | 5.7 | 6.0 | 6.6 |
| 100 | 2.2 | 2.4 | 2.5 | 2.6 | 2.7 | 2.9 |
|
Table 21 footnotes
|
||||||
B.3.4 Net migration
The net migration rate refers to the net effect relative to the population of the number of immigrants less the number of total (net) emigrants, plus the net increase in the number of non-permanent residents.
Immigration and emigration are generally recognized as being volatile parameters of future population growth since they are subject to a variety of demographic, economic, social, and political factors. During the period from 1972 to 2021, annual immigration to Canada varied between 84,000 and 323,000, annual emigration from Canada fluctuated between 35,000 and 95,000, and the annual number of returning Canadians fluctuated between 8,000 and 55,000. The 2020 and 2021 data are especially volatile compared to historical experience due to the COVID-19 pandemic, and they were thus excluded from our analysis in setting the net migration rate assumption. The net migration rate for year ending June 2021 stands at 0.41% of the population, well below pre-pandemic levels. In the 2020 Annual Report to Parliament, the Government of Canada released details on its Immigration Levels Plan for 2021-2023. The target numbers of new permanent residents are set at 401,000 in 2021, 411,000 in 2023 and 421,000 in 2023.
Over the same period, the annual net increase in the number of non-permanent residents fluctuated between -71,000 and 169,000. In the most recent years, the number of international students and temporary workers with permits under the International Mobility Program have grown substantially. They represent the two largest groups of non-permanent residents, accounting for more than half of non-permanent residents.
The number of temporary workers is assumed to stabilize in future as the aging of the labour force and related labour shortages subside. It is also expected that the number of foreign students will stabilize over the next five years. Therefore, the annual net increase in the number of non-permanent residents is projected to fall gradually to reach zero in 2026 and to remain at that level thereafter.
The actual 2021 net migration rate of 0.41% is assumed to increase to 1.04% of the Canadian population in 2022, 1.05% in 2023, and 0.93% in 2024. From 2025 to 2031, the net migration rate is assumed to decrease gradually to reach an ultimate level of 0.64%, which corresponds to the average rate experienced over the ten-year period 2010-2019, excluding the net increase in non-permanent residents during that period. The assumed short-term net migration rate is higher than the ultimate rate of 0.64% due to the federal government's short-term targets and the assumed gradual decrease to zero for the net increase in the number of non-permanent residents from 2022 through 2026.
Chart 4 shows the net migration experience since 1972 and the projected rates.
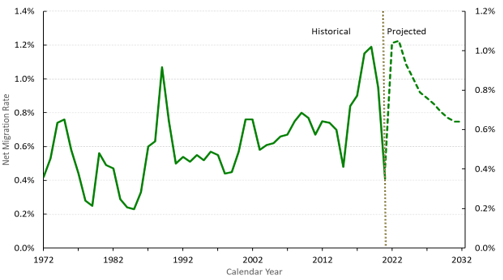
Chart 4 Text version
The actual 2021 net migration rate of 0.41% is assumed to increase to 1.04% of the Canadian population in 2022, 1.05% in 2023, and 0.93% in 2024. From 2025 to 2031, the net migration rate is assumed to decrease gradually to reach an ultimate level of 0.64%.
| Year | Migration rate |
|---|---|
| 1972 | 0.42% |
| 1973 | 0.53% |
| 1974 | 0.74% |
| 1975 | 0.76% |
| 1976 | 0.58% |
| 1977 | 0.44% |
| 1978 | 0.28% |
| 1979 | 0.25% |
| 1980 | 0.56% |
| 1981 | 0.49% |
| 1982 | 0.47% |
| 1983 | 0.29% |
| 1984 | 0.24% |
| 1985 | 0.23% |
| 1986 | 0.33% |
| 1987 | 0.60% |
| 1988 | 0.63% |
| 1989 | 1.07% |
| 1990 | 0.75% |
| 1991 | 0.50% |
| 1992 | 0.54% |
| 1993 | 0.51% |
| 1994 | 0.55% |
| 1995 | 0.52% |
| 1996 | 0.57% |
| 1997 | 0.55% |
| 1998 | 0.44% |
| 1999 | 0.45% |
| 2000 | 0.57% |
| 2001 | 0.76% |
| 2002 | 0.76% |
| 2003 | 0.58% |
| 2004 | 0.61% |
| 2005 | 0.62% |
| 2006 | 0.66% |
| 2007 | 0.67% |
| 2008 | 0.75% |
| 2009 | 0.80% |
| 2010 | 0.77% |
| 2011 | 0.67% |
| 2012 | 0.75% |
| 2013 | 0.74% |
| 2014 | 0.70% |
| 2015 | 0.48% |
| 2016 | 0.84% |
| 2017 | 0.90% |
| 2018 | 1.15% |
| 2019 | 1.19% |
| 2020 | 0.95% |
| 2021 | 0.41% |
| Year | Migration rate |
|---|---|
| 2022 | 1.04% |
| 2023 | 1.05% |
| 2024 | 0.93% |
| 2025 | 0.86% |
| 2026 | 0.79% |
| 2027 | 0.76% |
| 2028 | 0.73% |
| 2029 | 0.69% |
| 2030 | 0.66% |
| 2031 | 0.64% |
| 2032 | 0.64% |
B.3.5 Projected population and its characteristics
The historical and projected evolution of the Canada population age distribution since 1966 is shown in Chart 5. One can easily observe that the triangular shape of the 1960s has become more rectangular over time. This is projected to continue and indicates an aging population. The chart also reveals that the number of people aged 85 and over is expected to increase dramatically over the coming decades.
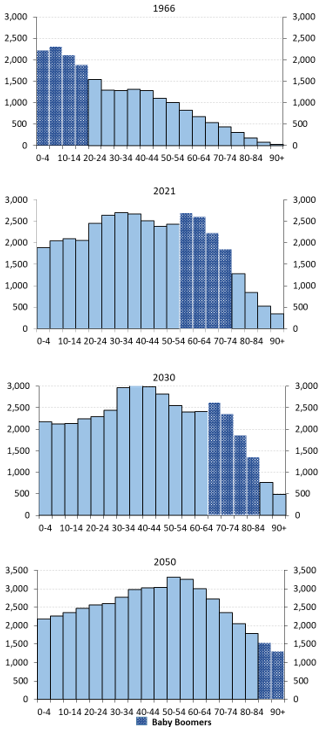
Chart 5 Text version
The first bar chart represents the age distribution of the population in 1966. For age groups below age 20, the baby-boom generation, the population of each group is between 1.8 and 2.4 million, with the age group 5 to 9 years being the largest. For age groups above age 19, the population gradually decreases from about 1.6 million to almost zero for the age group 90 and older.
The second bar chart represents the age distribution of the population in 2021. For age groups 55 to 59 up to 70 to 74, the baby boomers, the population of each group is between 1.9 and 2.7 million, with the age group 55 to 59 being the largest. For ages below 55, the effects of the baby bust and echo generation are seen. The population increases from 1.9 to 2.7 million for groups 0 to 4 up to 30 to 34, remains at 2.7 million for group 35 to 39, and then decreases somewhat before rising again for the baby boomers. For age groups above 75 (older than the baby boomers), the population gradually decreases from 1.3 million to about 346,000 for the age group 90 and older.
The third bar chart represents the age distribution of the population in 2030. For age groups 65 to 84, the baby boomers, the population decreases from 2.6 to 1.4 million. For age groups below age 65, the effects of the baby bust and echo generation are seen. The population increases from about 2.2 to 3.1 million for groups 0 to 4 up to 35 to 39 and then decreases to 2.4 million before rising again for the baby boomers. For age groups above age 84 (older than the boomers), the population gradually decreases from about 762,000 to 491,000 for the age group 90 and older.
Lastly, the fourth bar chart represents the age distribution of the population in 2050. For age groups 85 and over, the baby boomers, the population decreases from 762,000 and 491,000. The population increases from 2.2 to 3.3 million for age groups 0 to 4 up to 50 to 54, and then decreases to 1.8 million for the age group 80 to 84.
| Age Group | Population (thousands) | Baby boomers |
|---|---|---|
| 0-4 | 2,227 | Yes |
| 5-9 | 2,319 | Yes |
| 10-14 | 2,113 | Yes |
| 15-19 | 1,888 | Yes |
| 20-24 | 1,540 | No |
| 25-29 | 1,294 | No |
| 30-34 | 1,282 | No |
| 35-39 | 1,313 | No |
| 40-44 | 1,282 | No |
| 45-49 | 1,104 | No |
| 50-54 | 1,002 | No |
| 55-59 | 827 | No |
| 60-64 | 672 | No |
| 65-69 | 538 | No |
| 70-74 | 432 | No |
| 75-79 | 304 | No |
| 80-84 | 179 | No |
| 85-90 | 78 | No |
| 90+ | 27 | No |
| Age Group | Population (thousands) | Baby boomers |
|---|---|---|
| 0-4 | 1,883 | No |
| 5-9 | 2,044 | No |
| 10-14 | 2,091 | No |
| 15-19 | 2,057 | No |
| 20-24 | 2,453 | No |
| 25-29 | 2,640 | No |
| 30-34 | 2,698 | No |
| 35-39 | 2,667 | No |
| 40-44 | 2,510 | No |
| 45-49 | 2,384 | No |
| 50-54 | 2,430 | No |
| 55-59 | 2,700 | Yes |
| 60-64 | 2,607 | Yes |
| 65-69 | 2,234 | Yes |
| 70-74 | 1,854 | Yes |
| 75-79 | 1,281 | No |
| 80-84 | 842 | No |
| 85-90 | 525 | No |
| 90+ | 346 | No |
| Age Group | Population (thousands) | Baby boomers |
|---|---|---|
| 0-4 | 2,175 | No |
| 5-9 | 2,122 | No |
| 10-14 | 2,134 | No |
| 15-19 | 2,246 | No |
| 20-24 | 2,292 | No |
| 25-29 | 2,444 | No |
| 30-34 | 2,963 | No |
| 35-39 | 3,115 | No |
| 40-44 | 2,983 | No |
| 45-49 | 2,814 | No |
| 50-54 | 2,548 | No |
| 55-59 | 2,402 | No |
| 60-64 | 2,411 | No |
| 65-69 | 2,633 | Yes |
| 70-74 | 2,359 | Yes |
| 75-79 | 1,865 | Yes |
| 80-84 | 1,364 | Yes |
| 85-90 | 762 | No |
| 90+ | 491 | No |
| Age Group | Population (thousands) | Baby boomers |
|---|---|---|
| 0-4 | 2,182 | No |
| 5-9 | 2,263 | No |
| 10-14 | 2,354 | No |
| 15-19 | 2,473 | No |
| 20-24 | 2,558 | No |
| 25-29 | 2,595 | No |
| 30-34 | 2,771 | No |
| 35-39 | 2,974 | No |
| 40-44 | 3,024 | No |
| 45-49 | 3,034 | No |
| 50-54 | 3,307 | No |
| 55-59 | 3,259 | No |
| 60-64 | 2,995 | No |
| 65-69 | 2,720 | No |
| 70-74 | 2,351 | No |
| 75-79 | 2,047 | No |
| 80-84 | 1,786 | No |
| 85-90 | 1,540 | Yes |
| 90+ | 1,312 | Yes |
The population of Canada as at 1 July 2021 is 38.2 million. Table 22 presents the projected population of Canada as at 1 July for selected age groups and years. The number of people reaching age 65 is a good indicator of the number of new OAS basic pension beneficiaries coming into pay each year. This population is expected to increase from 507,000 in 2023 to 525,000 by 2030.
| Year | 0-17 | 18-69 | 70+ | 0-19 | 20-64 | 65+ | Total | Reaching age 65 |
|---|---|---|---|---|---|---|---|---|
| 2022 | 7,297 | 26,401 | 5,037 | 8,115 | 23,274 | 7,347 | 38,735 | 495 |
| 2023 | 7,391 | 26,616 | 5,240 | 8,226 | 23,400 | 7,621 | 39,247 | 507 |
| 2024 | 7,469 | 26,791 | 5,456 | 8,319 | 23,504 | 7,893 | 39,716 | 513 |
| 2025 | 7,531 | 26,947 | 5,682 | 8,399 | 23,592 | 8,169 | 40,160 | 525 |
| 2026 | 7,578 | 27,093 | 5,908 | 8,467 | 23,667 | 8,445 | 40,579 | 533 |
| 2027 | 7,626 | 27,222 | 6,139 | 8,528 | 23,748 | 8,711 | 40,987 | 530 |
| 2028 | 7,674 | 27,334 | 6,374 | 8,580 | 23,821 | 8,981 | 41,382 | 543 |
| 2030 | 7,775 | 27,508 | 6,841 | 8,678 | 23,973 | 9,474 | 42,124 | 525 |
| 2035 | 7,976 | 27,870 | 7,913 | 8,886 | 24,608 | 10,264 | 43,758 | 478 |
| 2040 | 8,204 | 28,505 | 8,465 | 9,100 | 25,290 | 10,784 | 45,173 | 476 |
| 2045 | 8,263 | 29,383 | 8,766 | 9,246 | 25,947 | 11,219 | 46,412 | 521 |
| 2050 | 8,268 | 30,240 | 9,035 | 9,271 | 26,516 | 11,755 | 47,543 | 569 |
| 2055 | 8,343 | 30,837 | 9,460 | 9,335 | 26,911 | 12,394 | 48,640 | 625 |
| 2060 | 8,505 | 31,243 | 10,043 | 9,498 | 27,088 | 13,204 | 49,790 | 652 |
Chart 6 shows the evolution of the total population of Canada and of the age groups below 20, 20 to 64, and 65 and older from 1970 to 2060. The proportion of people aged 65 and over is expected to increase significantly from 19.0% of the total population in 2022 to 26.5% by 2060. The number of people aged 65 and older as a proportion of the number of people aged 20 to 64 increases by nearly 55% over the same period, from 31.6% in 2022 to 48.7% by 2060. This proportion significantly affects the ratio of OAS program benefit expenditures to GDP.
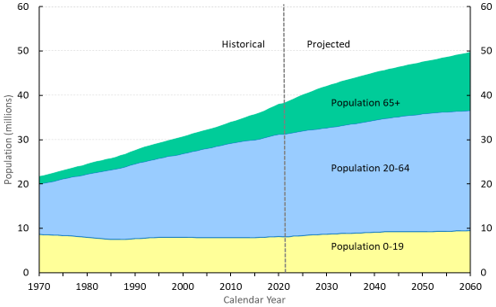
Chart 6 Text version
This chart shows the evolution of the total population of Canada and of the age groups below 20, 20 to 64, and 65 and older from 1970 to 2060. The proportion of people aged 65 and over is expected to increase significantly from 19.0% of the total population in 2022 to 26.5% by 2060.
| Year | Population 0-19 | Population 20-64 | Population 65+ |
|---|---|---|---|
| 1970 | 8.6 | 11.4 | 1.7 |
| 1971 | 8.6 | 11.6 | 1.8 |
| 1972 | 8.6 | 11.9 | 1.8 |
| 1973 | 8.5 | 12.1 | 1.9 |
| 1974 | 8.5 | 12.4 | 1.9 |
| 1975 | 8.4 | 12.8 | 2.0 |
| 1976 | 8.3 | 13.1 | 2.0 |
| 1977 | 8.3 | 13.4 | 2.1 |
| 1978 | 8.2 | 13.6 | 2.2 |
| 1979 | 8.1 | 13.9 | 2.2 |
| 1980 | 8.0 | 14.2 | 2.3 |
| 1981 | 7.9 | 14.5 | 2.4 |
| 1982 | 7.8 | 14.9 | 2.4 |
| 1983 | 7.7 | 15.2 | 2.5 |
| 1984 | 7.6 | 15.4 | 2.6 |
| 1985 | 7.5 | 15.7 | 2.6 |
| 1986 | 7.5 | 15.9 | 2.7 |
| 1987 | 7.5 | 16.1 | 2.8 |
| 1988 | 7.5 | 16.3 | 2.9 |
| 1989 | 7.6 | 16.7 | 3.0 |
| 1990 | 7.7 | 16.9 | 3.1 |
| 1991 | 7.7 | 17.1 | 3.2 |
| 1992 | 7.8 | 17.3 | 3.3 |
| 1993 | 7.9 | 17.5 | 3.4 |
| 1994 | 7.9 | 17.6 | 3.4 |
| 1995 | 8.0 | 17.8 | 3.5 |
| 1996 | 8.0 | 18.0 | 3.6 |
| 1997 | 8.0 | 18.2 | 3.7 |
| 1998 | 8.0 | 18.4 | 3.7 |
| 1999 | 8.0 | 18.6 | 3.8 |
| 2000 | 8.0 | 18.9 | 3.9 |
| 2001 | 8.0 | 19.1 | 3.9 |
| 2002 | 8.0 | 19.4 | 4.0 |
| 2003 | 7.9 | 19.7 | 4.1 |
| 2004 | 7.9 | 19.9 | 4.1 |
| 2005 | 7.9 | 20.2 | 4.2 |
| 2006 | 7.9 | 20.4 | 4.3 |
| 2007 | 7.9 | 20.6 | 4.4 |
| 2008 | 7.9 | 20.8 | 4.5 |
| 2009 | 7.9 | 21.1 | 4.7 |
| 2010 | 7.9 | 21.3 | 4.8 |
| 2011 | 7.9 | 21.5 | 5.0 |
| 2012 | 7.9 | 21.7 | 5.2 |
| 2013 | 7.9 | 21.9 | 5.4 |
| 2014 | 7.9 | 22.0 | 5.5 |
| 2015 | 7.9 | 22.1 | 5.7 |
| 2016 | 7.9 | 22.2 | 5.9 |
| 2017 | 8.0 | 22.4 | 6.1 |
| 2018 | 8.1 | 22.6 | 6.4 |
| 2019 | 8.1 | 22.9 | 6.6 |
| 2020 | 8.1 | 23.0 | 6.8 |
| 2021 | 8.1 | 23.1 | 7.1 |
| Year | Population 0-19 | Population 20-64 | Population 65+ |
|---|---|---|---|
| 2022 | 8.1 | 23.3 | 7.3 |
| 2023 | 8.2 | 23.4 | 7.6 |
| 2024 | 8.3 | 23.5 | 7.9 |
| 2025 | 8.4 | 23.6 | 8.2 |
| 2026 | 8.5 | 23.7 | 8.4 |
| 2027 | 8.5 | 23.7 | 8.7 |
| 2028 | 8.6 | 23.8 | 9.0 |
| 2029 | 8.6 | 23.9 | 9.2 |
| 2030 | 8.7 | 24.0 | 9.5 |
| 2031 | 8.7 | 24.1 | 9.7 |
| 2032 | 8.8 | 24.2 | 9.8 |
| 2033 | 8.8 | 24.3 | 10.0 |
| 2034 | 8.8 | 24.5 | 10.1 |
| 2035 | 8.9 | 24.6 | 10.3 |
| 2036 | 8.9 | 24.7 | 10.4 |
| 2037 | 9.0 | 24.9 | 10.5 |
| 2038 | 9.0 | 25.0 | 10.6 |
| 2039 | 9.0 | 25.2 | 10.7 |
| 2040 | 9.1 | 25.3 | 10.8 |
| 2041 | 9.2 | 25.4 | 10.9 |
| 2042 | 9.2 | 25.5 | 11.0 |
| 2043 | 9.2 | 25.7 | 11.0 |
| 2044 | 9.2 | 25.8 | 11.1 |
| 2045 | 9.2 | 25.9 | 11.2 |
| 2046 | 9.3 | 26.1 | 11.3 |
| 2047 | 9.3 | 26.2 | 11.4 |
| 2048 | 9.3 | 26.3 | 11.5 |
| 2049 | 9.3 | 26.4 | 11.6 |
| 2050 | 9.3 | 26.5 | 11.8 |
| 2051 | 9.3 | 26.6 | 11.9 |
| 2052 | 9.3 | 26.7 | 12.0 |
| 2053 | 9.3 | 26.8 | 12.1 |
| 2054 | 9.3 | 26.9 | 12.2 |
| 2055 | 9.3 | 26.9 | 12.4 |
| 2056 | 9.4 | 27.0 | 12.6 |
| 2057 | 9.4 | 27.0 | 12.7 |
| 2058 | 9.4 | 27.0 | 12.9 |
| 2059 | 9.5 | 27.1 | 13.0 |
| 2060 | 9.5 | 27.1 | 13.2 |
Table 23 shows the variations in the relative proportions of various age groups for Canada throughout the projection period.
| Year | % of Total populationTable 23 footnote 1 | Age 65+ As % of age 20-64 | ||
|---|---|---|---|---|
| 0-19 | 20-64 | 65+ | ||
| 2022 | 20.9 | 60.1 | 19.0 | 31.6 |
| 2023 | 21.0 | 59.6 | 19.4 | 32.6 |
| 2024 | 20.9 | 59.2 | 19.9 | 33.6 |
| 2025 | 20.9 | 58.7 | 20.3 | 34.6 |
| 2026 | 20.9 | 58.3 | 20.8 | 35.7 |
| 2027 | 20.8 | 57.9 | 21.3 | 36.7 |
| 2028 | 20.7 | 57.6 | 21.7 | 37.7 |
| 2030 | 20.6 | 56.9 | 22.5 | 39.5 |
| 2035 | 20.3 | 56.2 | 23.5 | 41.7 |
| 2040 | 20.1 | 56.0 | 23.9 | 42.6 |
| 2045 | 19.9 | 55.9 | 24.2 | 43.2 |
| 2050 | 19.5 | 55.8 | 24.7 | 44.3 |
| 2055 | 19.2 | 55.3 | 25.5 | 46.1 |
| 2060 | 19.1 | 54.4 | 26.5 | 48.7 |
|
Table 23 footnotes
|
||||
Table 24 shows the components of population growth, which is defined as the projected number of births plus net migrants less the projected number of deaths from 2022 to 2060, and Chart 7 presents these figures graphically. The number of births is projected to exceed deaths until 2039. Thereafter, all population growth is projected to come from migration.
In 2022, the population of Canada is projected to grow by about 1.5%. The annual growth slows to about 0.9% by 2030, 0.6% by 2040 and to 0.5% thereafter. The population of Canada is expected to reach 49.8 million by 2060.
| Year | Population 1st July | Births | Net migrants | Deaths | Change in population | Annual percentage change (%) | ||
|---|---|---|---|---|---|---|---|---|
| 20-64 | 65+ | Total | ||||||
| 2022 | 38,735 | 386 | 403 | 299 | 489 | 0.8 | 3.7 | 1.3 |
| 2023 | 39,247 | 398 | 413 | 300 | 511 | 0.5 | 3.7 | 1.3 |
| 2024 | 39,716 | 405 | 370 | 306 | 469 | 0.4 | 3.6 | 1.2 |
| 2025 | 40,160 | 412 | 345 | 312 | 444 | 0.4 | 3.5 | 1.1 |
| 2026 | 40,579 | 418 | 320 | 319 | 419 | 0.3 | 3.4 | 1.0 |
| 2027 | 40,987 | 423 | 310 | 326 | 408 | 0.3 | 3.1 | 1.0 |
| 2028 | 41,382 | 428 | 300 | 333 | 395 | 0.3 | 3.1 | 1.0 |
| 2030 | 42,124 | 432 | 279 | 349 | 362 | 0.3 | 2.5 | 0.9 |
| 2035 | 43,758 | 424 | 278 | 393 | 309 | 0.5 | 1.4 | 0.7 |
| 2040 | 45,173 | 421 | 287 | 441 | 267 | 0.5 | 0.9 | 0.6 |
| 2045 | 46,412 | 424 | 295 | 482 | 237 | 0.5 | 0.9 | 0.5 |
| 2050 | 47,543 | 430 | 303 | 512 | 221 | 0.4 | 1.0 | 0.5 |
| 2055 | 48,640 | 441 | 310 | 529 | 221 | 0.2 | 1.3 | 0.5 |
| 2060 | 49,790 | 455 | 317 | 536 | 237 | 0.1 | 1.3 | 0.5 |
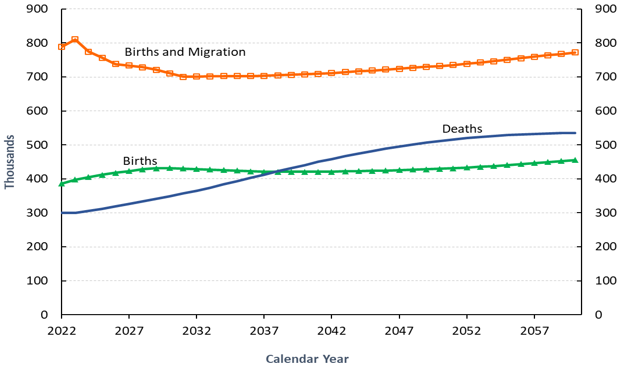
Chart 7 Text version
This graph shows the components of population growth, which is defined as the projected number of births, projected number of death and projected number of births and migration from 2022 to 2057.
The number of births is projected to exceed deaths until 2039.
| Year | Births | Deaths | Births and Migration |
|---|---|---|---|
| 2022 | 386 | 299 | 789 |
| 2023 | 398 | 300 | 811 |
| 2024 | 405 | 306 | 775 |
| 2025 | 412 | 312 | 757 |
| 2026 | 418 | 319 | 738 |
| 2027 | 423 | 326 | 734 |
| 2028 | 428 | 333 | 728 |
| 2029 | 431 | 341 | 721 |
| 2030 | 432 | 349 | 711 |
| 2031 | 431 | 357 | 700 |
| 2032 | 429 | 366 | 701 |
| 2033 | 428 | 375 | 702 |
| 2034 | 426 | 384 | 703 |
| 2035 | 424 | 393 | 703 |
| 2036 | 422 | 403 | 703 |
| 2037 | 421 | 413 | 703 |
| 2038 | 421 | 422 | 705 |
| 2039 | 421 | 432 | 707 |
| 2040 | 421 | 441 | 708 |
| 2041 | 421 | 450 | 710 |
| 2042 | 421 | 459 | 712 |
| 2043 | 422 | 467 | 714 |
| 2044 | 423 | 475 | 717 |
| 2045 | 424 | 482 | 719 |
| 2046 | 425 | 489 | 722 |
| 2047 | 426 | 496 | 724 |
| 2048 | 427 | 501 | 727 |
| 2049 | 429 | 507 | 730 |
| 2050 | 430 | 512 | 733 |
| 2051 | 431 | 516 | 735 |
| 2052 | 433 | 520 | 739 |
| 2053 | 436 | 524 | 742 |
| 2054 | 438 | 527 | 746 |
| 2055 | 441 | 529 | 751 |
| 2056 | 444 | 531 | 755 |
| 2057 | 447 | 533 | 759 |
B.4 Economic assumptions
The list of assumptions required to project the various economic indices, benefit expenditures, and cost measurement bases is quite extensive. The following subsections cover the more important assumptions.
The economic outlook rests on the assumed evolution of the labour market, that is, labour force participation, employment, unemployment, inflation, and the increase in average employment earnings, as well as the increase in GDP. All of these factors must be considered together and form part of an overall economic perspective.
The projected expenditures presented in this report are also expressed as cost ratios relative to the GDP. The GDP is simply projected using the assumed growth in CPP total employment earnings as determined in the 31st CPP Actuarial Report as at 31 December 2021.
B.4.1 Labour market
Below are the main components of the labour market that are used to determine the number of earners to calculate the total earnings.
Total population is divised between:
- Population aged 0 to 14 years old;
- Population aged 15 years old is divised between
- Active population (labour force)Footnote *
- Employed;
- unemployed and looking for employment.
- Inactive populationFootnote *
- Active population (labour force)Footnote *
The number of earners is defined as the number of persons who had earnings during a given calendar year. The proportion of earners assumption relies on the projected active population given in this report.
B.4.1.1 Active population
Table 25 to Table 27 provide projections of the active and employed populations and associated participation, employment, and unemployment rates as determined in the 31st CPP Actuarial Report as at 31 December 2021.
| Year | PopulationTable 25 footnote 1 | Active population | Employed | ||||||
|---|---|---|---|---|---|---|---|---|---|
| Males | Females | Total | Males | Females | Total | Males | Females | Total | |
| 2022 | 15,661 | 16,048 | 31,709 | 10,908 | 9,741 | 20,649 | 10,211 | 9,199 | 19,410 |
| 2023 | 15,879 | 16,274 | 32,153 | 11,025 | 9,860 | 20,885 | 10,356 | 9,339 | 19,695 |
| 2024 | 16,079 | 16,482 | 32,561 | 11,129 | 9,967 | 21,096 | 10,443 | 9,431 | 19,873 |
| 2025 | 16,265 | 16,679 | 32,944 | 11,225 | 10,069 | 21,294 | 10,521 | 9,517 | 20,038 |
| 2026 | 16,435 | 16,862 | 33,297 | 11,313 | 10,166 | 21,479 | 10,592 | 9,598 | 20,190 |
| 2027 | 16,601 | 17,039 | 33,640 | 11,400 | 10,264 | 21,663 | 10,661 | 9,681 | 20,342 |
| 2028 | 16,761 | 17,210 | 33,971 | 11,481 | 10,358 | 21,839 | 10,738 | 9,770 | 20,507 |
| 2030 | 17,059 | 17,529 | 34,588 | 11,636 | 10,538 | 22,174 | 10,883 | 9,938 | 20,821 |
| 2035 | 17,695 | 18,219 | 35,914 | 12,031 | 11,002 | 23,033 | 11,252 | 10,376 | 21,628 |
| 2040 | 18,287 | 18,860 | 37,147 | 12,356 | 11,291 | 23,647 | 11,556 | 10,649 | 22,205 |
| 2045 | 18,873 | 19,484 | 38,358 | 12,681 | 11,575 | 24,256 | 11,859 | 10,918 | 22,776 |
| 2050 | 19,401 | 20,046 | 39,447 | 12,952 | 11,815 | 24,767 | 12,111 | 11,145 | 23,256 |
| 2055 | 19,875 | 20,539 | 40,414 | 13,139 | 11,993 | 25,132 | 12,286 | 11,313 | 23,599 |
| 2060 | 20,348 | 21,019 | 41,367 | 13,286 | 12,142 | 25,428 | 12,424 | 11,453 | 23,877 |
|
Table 25 footnotes
|
|||||||||
| Year | Labour force participation rate | Employment rate | Unemployment rate | ||||||
|---|---|---|---|---|---|---|---|---|---|
| Males | Females | Total | Males | Females | Total | Males | Females | Total | |
| 2022 | 69.7 | 60.7 | 65.1 | 65.2 | 57.3 | 61.2 | 6.4 | 5.6 | 6.0 |
| 2023 | 69.4 | 60.6 | 65.0 | 65.2 | 57.4 | 61.3 | 6.1 | 5.3 | 5.7 |
| 2024 | 69.2 | 60.5 | 64.8 | 64.9 | 57.2 | 61.0 | 6.2 | 5.4 | 5.8 |
| 2025 | 69.0 | 60.4 | 64.6 | 64.7 | 57.1 | 60.8 | 6.3 | 5.5 | 5.9 |
| 2026 | 68.8 | 60.3 | 64.5 | 64.4 | 56.9 | 60.6 | 6.4 | 5.6 | 6.0 |
| 2027 | 68.7 | 60.2 | 64.4 | 64.2 | 56.8 | 60.5 | 6.5 | 5.7 | 6.1 |
| 2028 | 68.5 | 60.2 | 64.3 | 64.1 | 56.8 | 60.4 | 6.5 | 5.7 | 6.1 |
| 2030 | 68.2 | 60.1 | 64.1 | 63.8 | 56.7 | 60.2 | 6.5 | 5.7 | 6.1 |
| 2035 | 68.0 | 60.4 | 64.1 | 63.6 | 57.0 | 60.2 | 6.5 | 5.7 | 6.1 |
| 2040 | 67.6 | 59.9 | 63.7 | 63.2 | 56.5 | 59.8 | 6.5 | 5.7 | 6.1 |
| 2045 | 67.2 | 59.4 | 63.2 | 62.8 | 56.0 | 59.4 | 6.5 | 5.7 | 6.1 |
| 2050 | 66.8 | 58.9 | 62.8 | 62.4 | 55.6 | 59.0 | 6.5 | 5.7 | 6.1 |
| 2055 | 66.1 | 58.4 | 62.2 | 61.8 | 55.1 | 58.4 | 6.5 | 5.7 | 6.1 |
| 2060 | 65.3 | 57.8 | 61.5 | 61.1 | 54.5 | 57.7 | 6.5 | 5.7 | 6.1 |
| Age group | Males | Females | ||||||
|---|---|---|---|---|---|---|---|---|
| 2022 | 2025 | 2035 | 2050 | 2022 | 2025 | 2035 | 2050 | |
| 15-19 | 48.7 | 49.4 | 52.0 | 52.0 | 51.2 | 51.8 | 54.0 | 54.0 |
| 20-24 | 77.1 | 77.8 | 80.0 | 80.0 | 75.2 | 75.9 | 78.0 | 78.0 |
| 25-29 | 88.8 | 89.6 | 92.0 | 92.0 | 84.4 | 85.5 | 89.0 | 89.0 |
| 30-34 | 92.4 | 92.8 | 94.0 | 94.0 | 84.1 | 84.8 | 87.0 | 87.0 |
| 35-39 | 93.4 | 93.6 | 94.0 | 94.0 | 83.3 | 84.4 | 88.0 | 88.0 |
| 40-44 | 92.8 | 93.1 | 94.0 | 94.0 | 85.0 | 85.9 | 89.0 | 89.0 |
| 45-49 | 92.3 | 92.5 | 93.0 | 93.0 | 85.0 | 86.0 | 89.0 | 89.0 |
| 50-54 | 90.0 | 90.3 | 91.0 | 91.0 | 83.3 | 84.2 | 87.0 | 87.0 |
| 55-59 | 82.3 | 82.7 | 84.0 | 84.0 | 72.3 | 73.1 | 76.0 | 76.0 |
| 60-64 | 64.8 | 65.1 | 66.0 | 66.0 | 51.3 | 51.7 | 53.0 | 53.0 |
| 65-69 | 34.0 | 34.4 | 36.0 | 36.0 | 21.7 | 22.3 | 24.0 | 24.0 |
| 70 and over | 11.4 | 11.7 | 13.0 | 13.0 | 4.5 | 4.7 | 5.5 | 5.5 |
| 55-69 | 61.7 | 60.9 | 62.6 | 63.7 | 49.4 | 48.8 | 51.5 | 52.3 |
| 55 and over | 43.0 | 41.2 | 37.9 | 39.7 | 31.4 | 30.0 | 27.7 | 28.7 |
| 18-69 | 80.8 | 81.1 | 83.2 | 82.2 | 72.6 | 73.2 | 76.8 | 75.9 |
| 15 and over | 69.7 | 69.0 | 68.0 | 66.8 | 60.7 | 60.4 | 60.4 | 58.9 |
Several trends are taken into account in developing the above assumptions. Some of these trends are discussed below.
B.4.1.2 Male-female labour force participation gap
The overall labour force participation rates in Canada (the active population expressed as a proportion of the population aged 15 and over) from 1976 to 2021 clearly show a narrowing of the gap between male and female rates. Although the increase in participation rates of females aged 18 to 69 has slowed down since the mid-2000s, the increase was significant over the previous decades. Furthermore, participation rates for those aged 55 and older have increased significantly over the last decade for both men and women.
In 1976, overall male participation (ages 15 and over) was about 78% compared to only 46% for females, which represents a gap of 32%. This gap has narrowed to 9.0% in 2021 (participation rates of 69.6% for males, 60.6% for females), slightly higher than its pre-pandemic level of 8.8% in 2018 and 2019. It is assumed that females will continue to narrow the gap in participation rates but at a slower pace, with the gap gradually reducing to about 7.6% by 2035 (68.0% for males vs. 60.4% for females). A part of this reduction comes from the expected impact on the female labour force due to the Early Learning and Child Care Plan initiative announced by the federal Government in 2021. This is in line with the observed historical impact on the province of Quebec's female labour force following the implementation of their childcare system in 1997.
B.4.1.3 Population aging
Given that participation rates start to decline mostly after age 50, the aging of the population will exert downward pressure on the overall labour force participation rate in Canada. If current participation rates by age and sex were to apply throughout the projection period, the effect of population aging alone would cause the overall participation rate from Table 26 to fall from 65.1% in 2021 to 60.3% in 2050, instead of 62.8% as projected under the best-estimate assumptions.
An assumption underlying the future overall participation rate is an increase in participation rates for age groups 55 and over as a result of an expected continued trend toward longer working lives. Continued trends in making work more accessible to older workers (such as wage subsidies for hiring older workers and flexible work arrangements), the removal of the work cessation test to receive the CPP retirement pension prior to age 65, the projected continued increases in life expectancy, and possible insufficient retirement savings are assumed to encourage older workers to delay their retirement and exit the labour force at a later age.
The participation rates for those aged 55 to 59 are assumed to increase from 82.4% to 84.0% for males and from 72.3% to 76.0% for females over the period 2021 to 2050. Over the same period, the participation rates for those aged 60 to 64 are assumed to increase from 64.8% to 66.0% and from 51.3% to 53.0% for males and females, respectively, and the participation rates for those aged 65 to 69 are assumed to increase from 34.0% to 36.0% and from 21.7% to 24.0% for males and females, respectively.
Chart 8 shows the historical and projected participation rates by sex for the three age groups 55 to 59, 60 to 64, and 65 to 69.
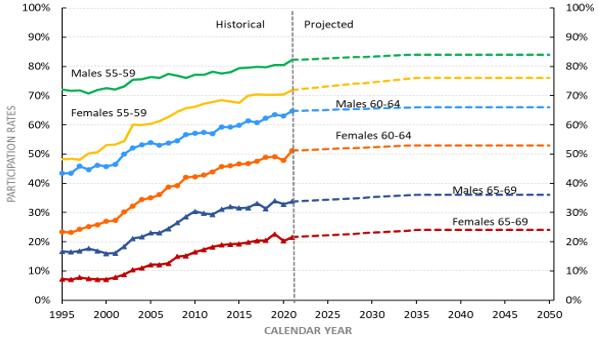
Chart 8 Text version
Over the period 2021 to 2050, the labour force participation rates for those aged 55 to 59 are assumed to increase from 82.4% to 84.0% for males and from 72.3% to 76.0% for females.
Over the period 2021 to 2050, the labour force participation rates for those aged 60 to 64 are assumed to increase from 64.8% to 66.0% and from 51.3% to 53.0% for males and females.
Over the period 2021 to 2050, the labour force participation rates for those aged 65 to 69 are assumed to increase from 34.0% to 36.0% and from 21.7% to 24.0% for males and females.
| Year | Males (55-59) | Males (60-64) | Males (65-69) | Females (55-59) | Females (60-64) | Females (65-69) |
|---|---|---|---|---|---|---|
| 1995 | 72.1% | 43.4% | 16.7% | 48.3% | 23.4% | 7.3% |
| 1996 | 71.6% | 43.5% | 16.5% | 48.4% | 23.2% | 7.1% |
| 1997 | 71.8% | 45.8% | 16.9% | 48.1% | 24.3% | 7.8% |
| 1998 | 70.7% | 44.7% | 17.7% | 50.2% | 25.3% | 7.4% |
| 1999 | 71.9% | 46.2% | 16.9% | 50.6% | 25.8% | 7.1% |
| 2000 | 72.6% | 45.8% | 16.0% | 53.1% | 27.0% | 7.2% |
| 2001 | 72.2% | 46.5% | 16.1% | 53.2% | 27.3% | 7.8% |
| 2002 | 73.1% | 50.0% | 18.4% | 54.5% | 30.2% | 8.8% |
| 2003 | 75.4% | 52.1% | 21.1% | 60.1% | 32.3% | 10.4% |
| 2004 | 75.6% | 53.1% | 21.7% | 60.0% | 34.4% | 11.0% |
| 2005 | 76.3% | 53.9% | 23.1% | 60.4% | 35.1% | 12.1% |
| 2006 | 76.0% | 53.1% | 23.0% | 61.4% | 36.1% | 12.2% |
| 2007 | 77.4% | 53.7% | 24.5% | 62.6% | 38.8% | 12.6% |
| 2008 | 76.8% | 54.6% | 26.6% | 64.5% | 39.2% | 15.0% |
| 2009 | 76.1% | 56.6% | 28.6% | 65.7% | 42.0% | 15.2% |
| 2010 | 77.2% | 57.1% | 30.4% | 66.1% | 42.3% | 16.5% |
| 2011 | 77.1% | 57.4% | 29.7% | 67.2% | 42.8% | 17.3% |
| 2012 | 78.1% | 57.0% | 29.4% | 67.9% | 44.0% | 18.3% |
| 2013 | 77.6% | 59.3% | 31.1% | 68.5% | 45.7% | 18.9% |
| 2014 | 78.0% | 59.2% | 32.0% | 68.0% | 46.0% | 19.1% |
| 2015 | 79.5% | 59.8% | 31.5% | 67.6% | 46.6% | 19.3% |
| 2016 | 79.6% | 61.4% | 31.6% | 70.1% | 46.7% | 19.9% |
| 2017 | 79.9% | 60.7% | 33.2% | 70.5% | 47.6% | 20.3% |
| 2018 | 79.7% | 62.3% | 31.3% | 70.2% | 48.9% | 20.4% |
| 2019 | 80.5% | 63.5% | 34.0% | 70.3% | 49.1% | 22.7% |
| 2020 | 80.4% | 63.1% | 32.9% | 70.4% | 47.9% | 20.3% |
| 2021 | 82.2% | 64.8% | 33.8% | 72.0% | 51.2% | 21.6% |
| Year | Males (55-59) | Males (60-64) | Males (65-69) | Females (55-59) | Females (60-64) | Females (65-69) |
|---|---|---|---|---|---|---|
| 2022 | 82.4% | 64.8% | 34.0% | 72.3% | 51.3% | 21.7% |
| 2023 | 82.5% | 64.9% | 34.1% | 72.6% | 51.5% | 21.9% |
| 2024 | 82.6% | 65.0% | 34.3% | 72.9% | 51.6% | 22.1% |
| 2025 | 82.7% | 65.1% | 34.4% | 73.1% | 51.7% | 22.3% |
| 2026 | 82.9% | 65.2% | 34.6% | 73.4% | 51.9% | 22.4% |
| 2027 | 83.0% | 65.3% | 34.8% | 73.7% | 52.0% | 22.6% |
| 2028 | 83.1% | 65.4% | 34.9% | 74.0% | 52.1% | 22.8% |
| 2029 | 83.3% | 65.5% | 35.1% | 74.3% | 52.2% | 22.9% |
| 2030 | 83.4% | 65.6% | 35.2% | 74.6% | 52.4% | 23.1% |
| 2031 | 83.5% | 65.7% | 35.4% | 74.9% | 52.5% | 23.3% |
| 2032 | 83.7% | 65.7% | 35.6% | 75.2% | 52.6% | 23.4% |
| 2033 | 83.8% | 65.8% | 35.7% | 75.5% | 52.8% | 23.6% |
| 2034 | 83.9% | 65.9% | 35.9% | 75.8% | 52.9% | 23.8% |
| 2035 | 84.0% | 66.0% | 36.0% | 76.0% | 53.0% | 24.0% |
| 2036 | 84.0% | 66.0% | 36.0% | 76.0% | 53.0% | 24.0% |
| 2037 | 84.0% | 66.0% | 36.0% | 76.0% | 53.0% | 24.0% |
| 2038 | 84.0% | 66.0% | 36.0% | 76.0% | 53.0% | 24.0% |
| 2039 | 84.0% | 66.0% | 36.0% | 76.0% | 53.0% | 24.0% |
| 2040 | 84.0% | 66.0% | 36.0% | 76.0% | 53.0% | 24.0% |
| 2041 | 84.0% | 66.0% | 36.0% | 76.0% | 53.0% | 24.0% |
| 2042 | 84.0% | 66.0% | 36.0% | 76.0% | 53.0% | 24.0% |
| 2043 | 84.0% | 66.0% | 36.0% | 76.0% | 53.0% | 24.0% |
| 2044 | 84.0% | 66.0% | 36.0% | 76.0% | 53.0% | 24.0% |
| 2045 | 84.0% | 66.0% | 36.0% | 76.0% | 53.0% | 24.0% |
| 2046 | 84.0% | 66.0% | 36.0% | 76.0% | 53.0% | 24.0% |
| 2047 | 84.0% | 66.0% | 36.0% | 76.0% | 53.0% | 24.0% |
| 2048 | 84.0% | 66.0% | 36.0% | 76.0% | 53.0% | 24.0% |
| 2049 | 84.0% | 66.0% | 36.0% | 76.0% | 53.0% | 24.0% |
| 2050 | 84.0% | 66.0% | 36.0% | 76.0% | 53.0% | 24.0% |
B.4.1.4 Labour shortages
Despite the assumed future increase in participation rates of women and older workers, as well as an assumed continued reliance on skilled immigrant workers, it is still expected that there will be continued labour shortages in the future as the working-age population expands at a slower pace and as baby boomers continue to retire and exit the labour force. The participation rates for all age groups are expected to increase due to the attractive employment opportunities resulting from labour shortages.
Based on the foregoing, the participation rates of both men and women are expected to increase over the projection period from their 2021 levels for all age groups. Nonetheless, these increases in participation rates are not sufficient to offset the decrease in the overall participation rate (ages 15 and over) due to the demographic shift from population aging.
For the purpose of projecting the participation rates, the projection period has been divided into two periods: 2022 to 2035 and from 2035 onward. From 2022 to 2035, the projected participation rates are based on the expected impact of the above-mentioned factors through time for each age group and sex. From 2035 onward, the participation rates are held constant. This long-term assumption combined with a slow growth in the working-age population, results in a rate of growth of approximately 0.4% for the Canadian active population (that is, the labour force) after 2035.
B.4.1.5 Employment
In Canada, the annual job creation rate (i.e., the change in the number of persons employed) has been on average about 1.5% since 1976. However, this rate has varied over the years. It is assumed that the job creation rate will be 2.9% in 2022 and 1.5% in 2023, corresponding to an assumed decrease in unemployment rate from 7.5% in 2021 (actual) to 6.0% in 2022 and 5.7% in 2023. These rates are based on the recent experience and various economic forecasts, and reflect the expected labour market recovery from the COVID-19 pandemic. It is further assumed that over the 2024-2027 period, the job creation rate will be slightly lower than the labour force growth rate, so that the unemployment rate will slowly increase from 5.7% in 2023 to 6.1% by 2027.
Over the long term, the job creation rate is projected to be the same as the labour force growth of 0.4%. This reflects the ultimate assumption for the unemployment rate of 6.1% for years 2027 and thereafter.
Table 28 and Table 29 shows the projected number of employed persons and the employment rate for those aged 18 to 69, in Canada.
| Year | Population (thousands) | Employed (thousands) | Employment rate (%) |
|---|---|---|---|
| 2022 | 13,241 | 9,768 | 73.8 |
| 2023 | 13,347 | 9,890 | 74.1 |
| 2024 | 13,433 | 9,957 | 74.1 |
| 2025 | 13,508 | 10,017 | 74.2 |
| 2026 | 13,578 | 10,071 | 74.2 |
| 2027 | 13,640 | 10,123 | 74.2 |
| 2028 | 13,692 | 10,182 | 74.4 |
| 2030 | 13,776 | 10,293 | 74.7 |
| 2035 | 13,950 | 10,579 | 75.8 |
| 2040 | 14,264 | 10,843 | 76.0 |
| 2045 | 14,711 | 11,115 | 75.6 |
| 2050 | 15,144 | 11,353 | 75.0 |
| 2055 | 15,433 | 11,506 | 74.6 |
| 2060 | 15,616 | 11,605 | 74.3 |
| Year | Population (thousands) | Employed (thousands) | Employment rate (%) |
|---|---|---|---|
| 2022 | 13,161 | 8,874 | 67.4 |
| 2023 | 13,269 | 8,998 | 67.8 |
| 2024 | 13,358 | 9,077 | 68.0 |
| 2025 | 13,439 | 9,152 | 68.1 |
| 2026 | 13,516 | 9,224 | 68.2 |
| 2027 | 13,583 | 9,298 | 68.5 |
| 2028 | 13,642 | 9,378 | 68.7 |
| 2030 | 13,733 | 9,528 | 69.4 |
| 2035 | 13,919 | 9,923 | 71.3 |
| 2040 | 14,241 | 10,174 | 71.4 |
| 2045 | 14,672 | 10,416 | 71.0 |
| 2050 | 15,096 | 10,633 | 70.4 |
| 2055 | 15,404 | 10,793 | 70.1 |
| 2060 | 15,627 | 10,918 | 69.9 |
B.4.1.6 Number of earners
The number of earners for any given year, namely anyone who had employment earnings during the year, is always more than the employed population and sometimes even close to the labour force because it includes all individuals who had earnings at any time during the year, whereas the employed population only indicates the average number of employed in any given year. The projected number of earners is obtained by a regression based on a highly correlated historical relationship between the number of employed persons and the number of earners over the period 1976 to 2019.
B.4.2 Annual increase in prices (Inflation rate)
The increase in prices (inflation rate) assumption is needed to determine the indexation of benefits for any given calendar year. It is also used in the determination of the annual nominal increase in average employment earnings.
Price increases, as measured by changes in the CPI, tend to fluctuate from year to year. Since the mid-1950s, the trend was generally upward through the early 1980s and then generally downward until the introduction of the inflation-control targets in the early 1990s, at which point inflation began to stabilize. The average annual increases in the CPI over the 50, 20 and 10-year periods ending in 2021 were 3.9%, 1.9% and 1.7%, respectively.
On December 13, 2021, the Bank of Canada and the Government renewed their commitment to keep inflation between 1% and 3% with a target at the mid-point of 2% until the end of 2026Footnote 3. They further noted that the Bank will use the flexibility of the 1% to 3% control range to actively seek the maximum sustainable level of employment to an extent that is consistent with keeping medium-term inflation expectations at 2%.
Despite the mid-point target of 2%, the CPI tends to fluctuate from year to year. The COVID-19 pandemic had an impact on the CPI. In 2020, the CPI rose by only 0.7% as a result of a decline in consumer spending stemming from various pandemic-related measures and restrictions. However, as the pandemic evolved and restrictions were lifted, consumer demand increased and supply issues arose. As a result, the increase in CPI was 3.4% in 2021, the fastest pace since 1991. The uncertainty surrounding high inflation due to the demand and supply shocks caused by the pandemic has been exacerbated by the escalation of the conflict in Ukraine. This report considers the escalation of the conflict in Ukraine a subsequent event.
Due to the economic instability caused by the COVID-19 pandemic, the global impacts of the war in Ukraine, and related supply chain issues, inflation is expected to be higher than the 2% target up until 2025. Increase in prices are assumed to be 6.9% in 2022, 3.0% in 2023, 2.5% in 2024, 2.25% in 2025 and 2.0% for 2026 and thereafter. These assumed price increases are based on short-term forecasts from various economists as well as on the expectation that the Bank of Canada and federal Government will continue to renew the inflation target at 2.0% and that the Bank of Canada will be successful in keeping inflation at its mid-point target in the long term.
B.4.3 Real wage increases
Two wage measure are used in this report: the average annual earnings (AAE) and the average weekly earnings (AWE). The assumed increase in AAE is used to project the total employment earnings of CPP contributors, while the assumed increase in the AWE is used to project the increase in the YMPE from one year to the next. The average difference between both measures has been relatively small over the period 1966 to 2019. However, they tend to grow at different paces in times of economic expansions and slowdowns.
B.4.3.1 Long-term real wage increases
Over the long term, increases in the real AAE and real AWE are assumed to be the same and are referred to as real wage increases in this report. The real wage increase can be measured using the difference between the increases in the nominal average wage and the CPI. In this case, the nominal average wage is defined as the ratio of the total nominal earnings to total civilian employment in the Canadian economy as a whole.
The relationship between real wages and the labour markets and overall economy is complex. In general, real wages are subject to downward pressure as the demand for workers decreases. On the other hand, one could expect upward pressure on wages if the size of the labour force fails to keep pace with a growing economy.
The real wage increase is related to the growth in total labour productivity plus the growth of various factors, as shown in Table 30. Data for year 2020 were not taken into account due to variability in data related to the pandemic.
| Components | 1961-2019 Average | 1992-2019 Average | 2002-2019 Average | Ultimate assumption |
|---|---|---|---|---|
| Labour productivity growth | 1.61% | 1.19% | 0.93% | 1.05% |
| Add compensation ratio growth | (0.08%) | (0.15%) | 0.01% | 0.00% |
| Add earnings ratio growth | (0.17%) | (0.16%) | (0.11%) | (0.05%) |
| Add average hours worked growth | (0.33%) | (0.17%) | (0.29%) | (0.10%) |
| Add price differential growth | 0.05% | (0.06%) | 0.04% | 0.00% |
| Real wage increase | 1.07% | 0.65% | 0.57% | 0.90% |
|
Table 30 footnotes
|
||||
Labour productivity in the above table is defined as the ratio of the real Gross Domestic Product (GDP) to total hours worked in the Canadian economy. As shown in Table 30, growth in labour productivity has decreased since the 1960s. However, long-term productivity is expected to increase as a result of labour shortages and continued technological advancements. At the same time, increasing labour force participation rates of older workers and a reliance on immigration for future labour force growth are expected to moderate labour shortages and the associated impact on productivity.
In addition, labour productivity could be affected by the timing and pace of Canada's transition to a green economy. There is a substantial uncertainty surrounding the effect of this transition on the composition of Canada's economy as it potentially moves away from carbon-intensive sectors over the next decades.
Based on the foregoing, a labour productivity growth of 1.05% is assumed for the long term.
The compensation ratio is the ratio of the total compensation received by workers to the nominal GDP, thereby reflecting the extent to which changes in productivity are shared between capital and labour. This ratio decreased on average by 0.08% per year over the 58-year period ending in 2019. It is assumed that there will be no change in the compensation ratio over the long term.
The earnings ratio is the ratio of total workers' earnings to total compensation. Changes in the earnings ratio reflect changes in the compensation structure offered to employees. The historical decline in the earnings ratio of 0.17% per year from 1961 to 2019 has been primarily due to the faster growth in supplementary labour income, such as employer contributions to pension plans, health benefit plans, the CPP, and the Employment Insurance program, compared to earnings. Given that a significant portion of the historical decrease in the earnings ratio can be explained by the increase in CPP contributions resulting from the increase in the contribution rate from 3.6% in 1986 to 9.9% in 2003, the earnings ratio is not expected to decline as fast as it has in the past. However, as a result of the aging of the population, it is expected that the cost of pension plans and health programs will continue to increase in the future and exert downward pressure on the earnings ratio. Based on the foregoing, it is assumed that the long-term earnings ratio will decline by 0.05% per year.
The average hours worked is defined as the ratio of total hours worked to total employment in the Canadian economy. There was a decrease in the average hours worked between 1961 and 2019. In the future, the assumed steady increases in productivity and the higher participation rates of older workers, who generally work fewer hours, could continue to apply negative pressure on the average hours worked. It is assumed that in the long term, the average hours worked will decline by 0.10% per year.
Finally, the price differential or "labour's terms of trade" is the ratio of the GDP deflator (defined as the ratio of nominal to real GDP) to the CPI. Including this ratio is necessary because labour productivity is expressed in real terms by using real GDP, while current dollar earnings are converted to real earnings using the CPI. The average annual growth in the price differential was 0.05% between 1961 and 2019. it is assumed that the price differential will remain stable without change over the long term.
The result of the foregoing discussion is that the real wage is assumed to increase by 0.9% per year over the long term.
B.4.3.2 Short-term real wage increases
Although the real AAE and real AWE are assumed to grow at the same pace in the long term, they tend to grow at different paces in times of economic expansions and slowdowns.
In times of economic slowdown, the AWE increases at a faster pace than the AAE and the reverse occurs in times of economic expansion. This is because during economic slowdowns, individuals with lower earnings lose their jobs, which tends to increase the AWE (proportionally higher earners remain in the labour force and people work less weeks during the year). The reverse holds true in times of economic expansion, i.e., low earners get rehired and people work more weeks during the year.
Based on information up to the end of June 2022, the real AAE is projected to decrease by 2.4% in 2022 and by 0.1% in 2023. Real AAE are then projected to increase, with an ultimate real increase of 0.9% reached in 2026. The negative real AAE growth in the early years of the projection is a result of assumed wage dynamics in periods of high inflation stemming from the COVID-19 pandemic and exacerbated by the escalation of the conflict in Ukraine, which is considered a subsequent event. The ultimate real AAE increase assumption is developed taking into account historical trends, labour productivity, labour shortages, and other contributing factors. The ultimate real AAE increase assumption combined with the ultimate price increase assumption results in an assumed nominal annual increase of 2.9% in 2026 and thereafter.
Real AWE are projected to decrease by 3.3% in 2022 and by 0.1% in 2023. In the following years, and consistent with the historical long-term relationship between the real change in the AWE and AAE, AWE increase, with an ultimate real increase of 0.9% reached in 2026, equal to the same ultimate real increase in AAE that year.
B.4.3.3 Summary
Table 31 shows the assumptions regarding the annual increases in prices, real AAE, and real AWE.
| Year | Price increases | Real increases Average Annual Earnings (AAE) | Average Weekly Earnings (AWE), (YMPE) |
|---|---|---|---|
| 2022 | 6.90 | -2.40 | -3.30 |
| 2023 | 3.00 | -0.10 | -0.10 |
| 2024 | 2.50 | 0.40 | 0.40 |
| 2025 | 2.25 | 0.65 | 0.65 |
| 2026+ | 2.00 | 0.90 | 0.90 |
B.4.4 Total earnings
Total earnings were obtained from the 31st CPP Actuarial Report. For this purpose, the proportion of earners from the 31st CPP Actuarial Report were adjusted to reflect the impacts of the COVID-19 pandemic on the labour force, whereas the average employment earnings are as determined in the 31st CPP Actuarial Report. The adjustments to the labour force assumptions from the 31st CPP Actuarial Report are consistent with those made in the context of the best-estimate assumptions of this report (i.e., higher unemployment rates from 2020 to 2023 inclusively).
B.4.5 Gross domestic product
The GDP is a suitable basis for a comparison of costs since benefits are financed through general revenues and not on the basis of employment earnings.
The GDP is projected using the assumed growth in total CPP employment earnings as determined in the 31st CPP actuarial report
It is noteworthy that the Consumer Price Index (CPI), employed to express total earnings in nominal terms, and the GDP deflator, used to express GDP in nominal terms, are assumed to be the same for the purpose of this report.
B.5 Recipient rates and distribution by level of benefit
The recipient rate for an OAS program benefit refers to the proportion of the Canadian population that has received, receives, or is projected to receive that benefit. Since benefits are computed for age-sex cohorts as opposed to individuals, recipient rates by age, sex, type and level of benefit are required. Beneficiary data from ESDC for years 2010-2022 was used to create a table, for each benefit type, consisting of the number of beneficiaries by sex, age, and six levels of benefit as a percentage of the maximum benefit (0-19%, 20-39%, 40-59%, 60-79%, 80‑99%, and 100% and over). Historical statistics provided by ESDC on a similar basis were used for the years 1983 to 2009. The highest level of benefit (100% of the maximum and over) includes those GIS beneficiaries with partial OAS pensions, who consequently see their supplement increased by the difference between the maximum OAS pension payable and the partial pension. The additional amount may result in the supplement exceeding the maximum GIS payable.
The actual recipient rates in each of the cells described above are obtained by dividing the number of beneficiaries in each cell by the relevant population of Canada. The data include benefits paid outside Canada.
B.5.1 OAS basic pension
The historical recipient rates of sex-distinct cohorts for the basic pension were studied to determine the best-estimate assumptions. The ultimate OAS basic pension recipient rates are set equal to the projected recipient rates for the cohort reaching age 65 in 2022.
As the assumed recipient rates are based on historical experience that already includes voluntary deferrals (effective 1 July 2013), no adjustment is applied to the recipient rates for deferrals. However, voluntary deferrals are assumed in order to develop assumed distributions of the ages of pension take-up for each attained age. These distributions are used in turn to determine the assumed increase in pension applicable at an attained age from the greater effect of actuarial adjustment or the accumulation of additional years of residence (for partial pensions).
The assumed deferral rates are based on historical and assumed recipient rates. Table 32 presents the deferral assumptions applied to the distributions of ages at take-up by attained age, for cohorts reaching age 65 in 2022 and thereafter, for males and females. The assumptions represent the percentages of the cohorts who defer pension take-up to a given age. This report assumes a greater percentage of the population will defer their take-up than in the previous report.
As we can see in Table 32, deferrals past the age of 70 occur, for various reasons, including waiting to accumulate more years of residence for those with partial pensions or not applying for the pension due to unawareness of the benefit.
For the cohort age 65 in 2022 and thereafter, 2.10% of males and 2.35% of females are assumed to start to receive basic OAS pension midyear at age 65.5.
| Age (mid-year) | Males | Females |
|---|---|---|
| 65 | 2.10 | 2.35 |
| 66 | 4.40 | 4.40 |
| 67 | 3.80 | 3.20 |
| 68 | 2.15 | 1.70 |
| 69 | 1.85 | 1.40 |
| 70Table 32 footnote 1 | 1.70 | 1.15 |
| 71Table 32 footnote 1 | 0.90 | 0.60 |
| 72Table 32 footnote 1 | 0.75 | 0.60 |
| 73Table 32 footnote 1 | 0.60 | 0.55 |
| 74Table 32 footnote 1 | 0.40 | 0.40 |
| 75+Table 32 footnote 1 | 0.15 | 0.15 |
| Total | 18.80 | 16.50 |
|
Table 32 footnotes
|
||
The basic pension recipient rates for cohorts reaching age 65 in 2022 and thereafter are assumed to increase from 78.5% at age 65 to 99.5% at ages 90 and over for males and from 81.1% at age 65 to 99.0% at ages 90 and over for females. It is worth noting that basic pension recipient rates include benefits paid outside Canada under international social security agreements, and as such, can exceed 100%. Table 33 presents the projected OAS basic pension recipient rates by age and sex for cohorts reaching age 65 in 2022 and thereafter.
| Age | Males | Females |
|---|---|---|
| 65 | 78.5 | 81.1 |
| 66 | 83.0 | 86.2 |
| 67 | 87.6 | 90.3 |
| 68 | 90.6 | 92.6 |
| 69 | 91.9 | 93.7 |
| 70 | 94.3 | 95.4 |
| 75 | 97.6 | 98.0 |
| 80 | 98.6 | 98.5 |
| 85 | 99.1 | 99.0 |
| 90+ | 99.5 | 99.0 |
|
Table 33 footnotes
|
||
The basic pension recipient rates by age and sex are further broken down by level of benefit using distributions of recipient rates by level of benefit, expressed as a percentage of the maximum benefit (based on the number of years of residence in Canada). The historical distributions by level of benefit were derived from OAS beneficiary data as at 31 December of each year over the period 2013 to 2021. The age 65 distribution in 2021 is assumed to apply for all years thereafter, and the corresponding cohort distributions for ages 66 and above are assumed to apply for years 2022 and thereafter.
For any given cohort reaching age 65 in 2022 or after, the distributions by level of benefit for ages 66 and over are projected based on historical data that reveal that, for any given cohort, there is a large proportion of beneficiaries coming into pay who have a small number of years of residence and thus receive partial benefits. Recent experience confirms that the proportion of recipients receiving a partial pension continues to grow, although at a lesser rate than previously projected. As such, it is assumed that as a cohort progresses in age, the proportion of beneficiaries receiving a full pension will decrease while the proportion of beneficiaries receiving a partial benefit will increase, but to a somewhat lesser extent than in the previous report.
Table 34 and Table 35 shows the evolution of male and female basic pension recipient rates by age, calendar year and level of benefit.
| Age | Level of benefit in calendar year 2022 | Level of benefit in calendar year 2030 | Level of benefit in calendar year 2060 | ||||||
|---|---|---|---|---|---|---|---|---|---|
| Partial | Full | Total | Partial | Full | Total | Partial | Full | Total | |
| 65 | 9.3 | 69.2 | 78.5 | 9.3 | 69.5 | 78.8 | 9.3 | 69.5 | 78.8 |
| 66 | 11.6 | 71.1 | 82.7 | 11.6 | 71.4 | 83.0 | 11.6 | 71.4 | 83.0 |
| 67 | 12.9 | 74.3 | 87.2 | 12.9 | 74.7 | 87.6 | 12.9 | 74.7 | 87.6 |
| 68 | 13.6 | 76.6 | 90.2 | 13.9 | 76.7 | 90.6 | 13.9 | 76.7 | 90.6 |
| 69 | 13.8 | 77.7 | 91.5 | 14.5 | 77.4 | 91.9 | 14.5 | 77.4 | 91.9 |
| 70 | 13.5 | 80.3 | 93.8 | 15.3 | 79.0 | 94.3 | 15.3 | 79.0 | 94.3 |
| 75 | 12.3 | 86.3 | 98.6 | 16.6 | 81.3 | 97.9 | 17.1 | 80.5 | 97.6 |
| 80 | 11.7 | 87.8 | 99.5 | 15.7 | 83.6 | 99.3 | 18.5 | 80.1 | 98.6 |
| 85 | 12.4 | 87.7 | 100.1 | 15.6 | 84.4 | 100.0 | 19.9 | 79.3 | 99.1 |
| 90+ | 13.0 | 87.5 | 100.5 | 16.1 | 84.5 | 100.6 | 21.9 | 77.6 | 99.5 |
| All ages | 12.4 | 81.7 | 94.1 | 14.9 | 79.7 | 94.6 | 16.8 | 78.1 | 94.9 |
|
Table 34 footnotes
|
|||||||||
| Age | Level of benefit in calendar year 2022 | Level of benefit in calendar year 2030 | Level of benefit in calendar year 2060 | ||||||
|---|---|---|---|---|---|---|---|---|---|
| Partial | Full | Total | Partial | Full | Total | Partial | Full | Total | |
| 65 | 10.3 | 70.8 | 81.1 | 10.3 | 71.2 | 81.5 | 10.3 | 71.2 | 81.5 |
| 66 | 10.9 | 74.9 | 85.8 | 10.9 | 75.3 | 86.2 | 10.9 | 75.3 | 86.2 |
| 67 | 13.4 | 76.5 | 89.9 | 13.4 | 76.9 | 90.3 | 13.4 | 76.9 | 90.3 |
| 68 | 14.1 | 78.1 | 92.2 | 14.3 | 78.3 | 92.6 | 14.3 | 78.3 | 92.6 |
| 69 | 14.1 | 79.2 | 93.3 | 15.0 | 78.7 | 93.7 | 15.0 | 78.7 | 93.7 |
| 70 | 13.6 | 81.3 | 94.9 | 15.6 | 79.8 | 95.4 | 15.6 | 79.8 | 95.4 |
| 75 | 12.3 | 86.2 | 98.5 | 16.9 | 81.3 | 98.2 | 17.5 | 80.5 | 98.0 |
| 80 | 11.6 | 87.3 | 98.9 | 15.8 | 83.2 | 99.0 | 18.8 | 79.7 | 98.5 |
| 85 | 12.0 | 87.5 | 99.5 | 15.4 | 84.2 | 99.6 | 19.9 | 79.1 | 99.0 |
| 90+ | 10.8 | 88.7 | 99.5 | 14.1 | 85.7 | 99.8 | 20.7 | 78.3 | 99.0 |
| All ages | 12.3 | 82.8 | 95.1 | 15.1 | 80.6 | 95.7 | 17.3 | 78.7 | 96.0 |
|
Table 35 footnotes
|
|||||||||
The OAS Recovery Tax reduces the amount of the basic pension payable for high-income pensioners (see section 3 of Appendix A) through a repayment amount. The projected Recovery Tax amounts and number of beneficiaries affected by it presented in this report reflect that various factors may have an impact. These include pension income splitting, TFSA utilization, and future sources of additional income.
Statistics on the proportion of beneficiaries affected (fully or partially) by the OAS Recovery Tax were estimated for tax years 2013 to 2021 using data from ESDC and CRA. The estimated statistics for tax year 2021 were determined to be outliers, possibly related to the effects of the COVID-19 pandemic. Therefore, tax year 2021 was excluded from the analysis.
The proportions of beneficiaries affected by the Recovery Tax in 2022 and thereafter is projected from the historical proportions by assuming that initial retirement income will increase in line with wage growth, while the Recovery Tax income limits increase in line with inflation. To simulate this, a formula was developed as a function of each cohort's average career employment earnings (over the ages of 18 to 65) and inflation rate. The link with inflation is required since the income limit above which the Recovery Tax applies has moved in line with inflation since 2001.
Projections from the 31st CPP Actuarial Report as well as data from ESDC and CRA were used to make adjustments to the Recovery Tax projections in respect of the estimated impacts of TFSAs and the additional CPP and QPP benefits. Given the absence of experience data for the additional CPP and QPP and limited data regarding the TFSAs (introduced in 2009), the results presented in Table 36 and Table 37 should be interpreted with caution.
Table 36 presents the projected number and percentage of OAS beneficiaries affected by the Recovery Tax. The percentage of beneficiaries affected by the OAS Recovery Tax is projected to increase from 7.9% in 2023 (2.6% full and 5.3% partial) to 10.2% (3.5% full and 6.7% partial) by 2060.
| Year | Full repayment of OAS pension | Partial repayment of OAS pension | Total | ||||
|---|---|---|---|---|---|---|---|
| Number (thousands) | % All OAS beneficiaries | Number (thousands) | % All OAS beneficiaries | Number (thousands)Table 36 footnote 1 | % All OAS beneficiaries | All OAS beneficiaries (thousands) | |
| 2022 | 182 | 2.6 | 373 | 5.4 | 555 | 8.0 | 6,953 |
| 2023 | 189 | 2.6 | 386 | 5.3 | 575 | 7.9 | 7,247 |
| 2024 | 194 | 2.6 | 397 | 5.3 | 591 | 7.9 | 7,505 |
| 2025 | 200 | 2.6 | 408 | 5.3 | 608 | 7.8 | 7,768 |
| 2026 | 205 | 2.6 | 419 | 5.2 | 624 | 7.8 | 8,032 |
| 2027 | 211 | 2.5 | 429 | 5.2 | 639 | 7.7 | 8,287 |
| 2028 | 216 | 2.5 | 439 | 5.1 | 655 | 7.7 | 8,545 |
| 2030 | 225 | 2.5 | 456 | 5.1 | 681 | 7.6 | 9,021 |
| 2035 | 262 | 2.7 | 518 | 5.3 | 780 | 7.9 | 9,819 |
| 2040 | 297 | 2.9 | 569 | 5.5 | 866 | 8.4 | 10,336 |
| 2045 | 326 | 3.0 | 614 | 5.7 | 940 | 8.8 | 10,747 |
| 2050 | 357 | 3.2 | 672 | 6.0 | 1,029 | 9.2 | 11,241 |
| 2055 | 394 | 3.3 | 741 | 6.3 | 1,135 | 9.6 | 11,839 |
| 2060 | 442 | 3.5 | 844 | 6.7 | 1,286 | 10.2 | 12,609 |
|
Table 36 footnotes
|
|||||||
The impact of the OAS Recovery Tax on total benefits payable is obtained using the projected number of beneficiaries who are affected and the assumed reduction in their average benefit (100% reduction for those with a full repayment and a 30.6% reduction in benefit for those with a partial repayment). It is estimated that, in 2023, the Recovery Tax will have the effect of reducing the total amount of basic pensions payable by about $2.6 billion or 4.4%. Table 37 presents the projected repayment amounts.
| Year | Repayment for those subject to full repayments | Repayment for those subject to partial repayments | Total repayment | |||
|---|---|---|---|---|---|---|
| Amount ($ million) | % of Total OAS pensions | Amount ($ million) | % of Total OAS pensions | Amount ($ million)Table 37 footnote 1 | % of Total OAS pensions | |
| 2022 | 1,455 | 2.7 | 924 | 1.7 | 2,379 | 4.4 |
| 2023 | 1,616 | 2.7 | 1,025 | 1.7 | 2,642 | 4.4 |
| 2024 | 1,712 | 2.7 | 1,085 | 1.7 | 2,797 | 4.4 |
| 2025 | 1,806 | 2.7 | 1,144 | 1.7 | 2,950 | 4.4 |
| 2026 | 1,899 | 2.7 | 1,201 | 1.7 | 3,100 | 4.3 |
| 2027 | 1,990 | 2.6 | 1,257 | 1.7 | 3,246 | 4.3 |
| 2028 | 2,087 | 2.6 | 1,313 | 1.7 | 3,400 | 4.3 |
| 2030 | 2,272 | 2.6 | 1,425 | 1.6 | 3,698 | 4.2 |
| 2035 | 2,956 | 2.8 | 1,815 | 1.7 | 4,771 | 4.5 |
| 2040 | 3,721 | 3.0 | 2,228 | 1.8 | 5,949 | 4.8 |
| 2045 | 4,512 | 3.2 | 2,664 | 1.9 | 7,176 | 5.1 |
| 2050 | 5,445 | 3.3 | 3,218 | 2.0 | 8,662 | 5.3 |
| 2055 | 6,583 | 3.5 | 3,933 | 2.1 | 10,516 | 5.5 |
| 2060 | 8,099 | 3.6 | 4,970 | 2.2 | 13,069 | 5.8 |
|
Table 37 footnotes
|
||||||
B.5.2 GIS and allowance
The actual recipient rates as at July 2019 for the GIS and Allowance benefits for each age, sex, type and level of benefit are used as the starting point for determining the best-estimate assumptions. Recipient rates from 2020 to 2022 were excluded from the projection analysis, given the uncertainty surrounding the effect of the COVID-19 pandemic.
The formulas used in the projection of the GIS and Allowance recipient rates take into account the assumption that, for each cohort of individuals who may become eligible for these benefits, the initial retirement income will consist mainly of CPP and QPP benefit (including the additional benefits) that reflect increases in line with wage growth prior to retirement. At the same time, it is assumed that the income limits for the GIS and Allowance will have increased in line with inflation prior to retirement. Together this would lead to a smaller percentage of individuals expected to become GIS or Allowance beneficiaries over the projection period. However, this decline in eligibility is slightly offset by the projected effect of TFSAs over time; that is, the projections also take into account that TFSA-related income is excluded from the determination of GIS and Allowance benefits, which leads to an increase in both the number of GIS and Allowance beneficiaries and amount of benefits.
For this report, experience adjustment factors were developed to adjust the projection formula so that characteristics and trends of historical recipient rates by age, sex, type and level of benefit observed over the period 2015 to 2019 would be reproduced more closely, while simultaneously incorporating the assumed future impacts of additional CPP and QPP benefits and TFSAs. Given the uncertainty surrounding the effect of the COVID-19 pandemic on recipient rates data for year 2020 to 2022 were excluded from the analysis for purposes of setting the recipient rates.
The rates were adjusted for year 2020 and thereafter to account for the amendments of Bill C-97 that, effective 1 July 2020, increases the income exemption.
Table 38 to Table 41 presents the projected GIS and Allowance recipient rates for cohorts reaching the ages 60 and 65 by age, sex, type and level of benefit.
| Age | 2022 | 2030 | 2060 | ||||||
|---|---|---|---|---|---|---|---|---|---|
| Partial | Full | Total | Partial | Full | Total | Partial | Full | Total | |
| 65 | 16.1 | 4.3 | 20.4 | 17.1 | 4.4 | 21.5 | 13.1 | 3.7 | 16.8 |
| 70 | 20.9 | 5.0 | 25.9 | 20.1 | 4.8 | 24.9 | 16.2 | 3.9 | 20.1 |
| 75 | 24.1 | 5.0 | 29.1 | 22.6 | 4.8 | 27.4 | 17.7 | 3.8 | 21.4 |
| 80 | 25.7 | 5.6 | 31.3 | 24.1 | 5.2 | 29.3 | 17.9 | 4.2 | 22.0 |
| 85 | 26.7 | 5.7 | 32.4 | 25.0 | 5.3 | 30.3 | 18.0 | 4.2 | 22.1 |
| 90+ | 21.8 | 4.8 | 26.5 | 20.2 | 4.4 | 24.6 | 13.5 | 3.4 | 16.9 |
| All ages | 23.1 | 5.1 | 28.3 | 22.0 | 4.9 | 26.9 | 16.5 | 3.9 | 20.4 |
|
Table 38 footnotes
|
|||||||||
| Age | 2022 | 2030 | 2060 | ||||||
|---|---|---|---|---|---|---|---|---|---|
| Partial | Full | Total | Partial | Full | Total | Partial | Full | Total | |
| 65 | 16.2 | 4.6 | 20.8 | 17.7 | 4.9 | 22.5 | 13.8 | 4.0 | 17.9 |
| 70 | 24.4 | 5.8 | 30.2 | 24.4 | 5.8 | 30.2 | 19.5 | 4.8 | 24.3 |
| 75 | 28.9 | 6.1 | 34.9 | 28.2 | 6.1 | 34.3 | 21.7 | 5.0 | 26.7 |
| 80 | 32.3 | 7.4 | 39.7 | 31.1 | 7.3 | 38.4 | 22.6 | 6.0 | 28.7 |
| 85 | 34.6 | 7.5 | 42.1 | 32.7 | 7.2 | 39.9 | 22.7 | 6.0 | 28.7 |
| 90+ | 39.2 | 8.0 | 47.2 | 35.5 | 7.6 | 43.1 | 24.1 | 6.2 | 30.3 |
| All ages | 29.8 | 6.6 | 36.4 | 28.7 | 6.5 | 35.3 | 21.3 | 5.4 | 26.8 |
|
Table 39 footnotes
|
|||||||||
| Age | 2022 | 2030 | 2060 | ||||||
|---|---|---|---|---|---|---|---|---|---|
| Partial | Full | Total | Partial | Full | Total | Partial | Full | Total | |
| 60 | 0.4 | - no data | 0.4 | 0.5 | - no data | 0.5 | 0.4 | - no data | 0.4 |
| 61 | 0.6 | - no data | 0.6 | 0.6 | - no data | 0.7 | 0.4 | - no data | 0.5 |
| 62 | 0.8 | - no data | 0.8 | 0.8 | - no data | 0.9 | 0.6 | - no data | 0.6 |
| 63 | 1.0 | 0.1 | 1.1 | 1.1 | - no data | 1.1 | 0.8 | - no data | 0.8 |
| 64 | 1.3 | 0.1 | 1.4 | 1.4 | 0.1 | 1.5 | 1.0 | 0.1 | 1.1 |
| All ages | 0.8 | - no data | 0.9 | 0.9 | 0.1 | 0.9 | 0.6 | - no data | 0.7 |
|
Table 40 footnotes
|
|||||||||
| Age | 2022 | 2030 | 2060 | ||||||
|---|---|---|---|---|---|---|---|---|---|
| Partial | Full | Total | Partial | Full | Total | Partial | Full | Total | |
| 60 | 2.3 | 0.1 | 2.5 | 2.8 | 0.2 | 3.0 | 2.2 | 0.1 | 2.3 |
| 61 | 3.3 | 0.2 | 3.5 | 3.8 | 0.2 | 4.0 | 2.8 | 0.2 | 2.9 |
| 62 | 4.3 | 0.3 | 4.6 | 4.8 | 0.3 | 5.0 | 3.5 | 0.2 | 3.7 |
| 63 | 5.5 | 0.3 | 5.8 | 5.9 | 0.3 | 6.2 | 4.4 | 0.2 | 4.6 |
| 64 | 6.6 | 0.4 | 7.0 | 7.0 | 0.4 | 7.3 | 5.2 | 0.3 | 5.5 |
| All ages | 4.4 | 0.3 | 4.7 | 4.8 | 0.3 | 5.1 | 3.6 | 0.2 | 3.8 |
|
Table 41 footnotes
|
|||||||||
Charts 9 through 12 present the recipient rates by year of birth for GIS singles and Allowances.
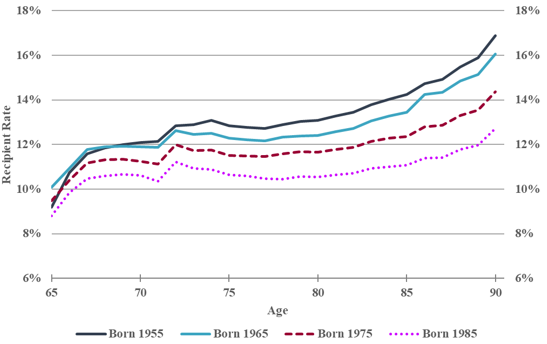
Chart 9 Text version
The GIS Single recipient rate of males born in 1955 is 9.5% at age 65, is 11.9% at age 70, is 13.1% at age 80 and is 16.9% at age 90.
The GIS Single recipient rate of males born in 1965 is 10.1% at age 65, is 11.9% at age 70, is 12.4% at age 80 and is 16.1% at age 90.
The GIS Single recipient rate of males born in 1975 is 9.5% at age 65, is 11.3% at age 70, is 11.7% at age 80 and is 14.3% at age 90.
The GIS Single recipient rate of males born in 1985 is 8.8% at age 65, is 10.6% at age 70, is 10.5% at age 80 and is 12.7% at age 90.
| Age | Recipient Rate, born in 1955 | Recipient Rate, born in 1965 | Recipient Rate, born in 1975 | Recipient Rate, born in 1985 |
|---|---|---|---|---|
| 65 | 9% | 10% | 9% | 9% |
| 66 | 11% | 11% | 10% | 10% |
| 67 | 12% | 12% | 11% | 10% |
| 68 | 12% | 12% | 11% | 11% |
| 69 | 12% | 12% | 11% | 11% |
| 70 | 12% | 12% | 11% | 11% |
| 71 | 12% | 12% | 11% | 10% |
| 72 | 13% | 13% | 12% | 11% |
| 73 | 13% | 12% | 12% | 11% |
| 74 | 13% | 13% | 12% | 11% |
| 75 | 13% | 12% | 12% | 11% |
| 76 | 13% | 12% | 11% | 11% |
| 77 | 13% | 12% | 11% | 10% |
| 78 | 13% | 12% | 12% | 10% |
| 79 | 13% | 12% | 12% | 11% |
| 80 | 13% | 12% | 12% | 11% |
| 81 | 13% | 13% | 12% | 11% |
| 82 | 13% | 13% | 12% | 11% |
| 83 | 14% | 13% | 12% | 11% |
| 84 | 14% | 13% | 12% | 11% |
| 85 | 14% | 13% | 12% | 11% |
| 86 | 15% | 14% | 13% | 11% |
| 87 | 15% | 14% | 13% | 11% |
| 88 | 15% | 15% | 13% | 12% |
| 89 | 16% | 15% | 14% | 12% |
| 90 | 17% | 16% | 14% | 13% |
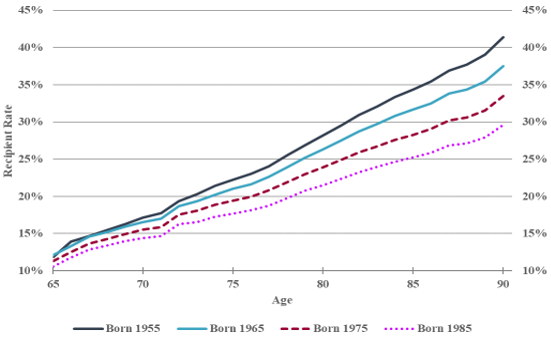
Chart 10 Text version
The GIS Single recipient rate of females born in 1955 is 12.1% at age 65, is 17.1% at age 70, is 28.2% at age 80 and is 41.4% at age 90.
The GIS Single recipient rate of females born in 1965 is 12.1% at age 65, is 16.5% at age 70, is 26.3% at age 80 and is 37.5% at age 90.
The GIS Single recipient rate of females born in 1975 is 11.3% at age 65, is 16.5% at age 70, is 23.9% at age 80 and is 33.5% at age 90.
The GIS Single recipient rate of females born in 1985 is 10.6% at age 65, is 14.4% at age 70, is 21.5% at age 80 and is 29.6% at age 90.
| Age | Recipient Rate, born in 1955 | Recipient Rate, born in 1965 | Recipient Rate, born in 1975 | Recipient Rate, born in 1985 |
|---|---|---|---|---|
| 65 | 12% | 12% | 11% | 11% |
| 66 | 14% | 13% | 13% | 12% |
| 67 | 15% | 15% | 14% | 13% |
| 68 | 15% | 15% | 14% | 13% |
| 69 | 16% | 16% | 15% | 14% |
| 70 | 17% | 17% | 16% | 14% |
| 71 | 18% | 17% | 16% | 15% |
| 72 | 19% | 19% | 18% | 16% |
| 73 | 20% | 19% | 18% | 17% |
| 74 | 21% | 20% | 19% | 17% |
| 75 | 22% | 21% | 19% | 18% |
| 76 | 23% | 22% | 20% | 18% |
| 77 | 24% | 23% | 21% | 19% |
| 78 | 25% | 24% | 22% | 20% |
| 79 | 27% | 25% | 23% | 21% |
| 80 | 28% | 26% | 24% | 21% |
| 81 | 30% | 28% | 25% | 22% |
| 82 | 31% | 29% | 26% | 23% |
| 83 | 32% | 30% | 27% | 24% |
| 84 | 33% | 31% | 28% | 25% |
| 85 | 34% | 32% | 28% | 25% |
| 86 | 35% | 33% | 29% | 26% |
| 87 | 37% | 34% | 30% | 27% |
| 88 | 38% | 34% | 31% | 27% |
| 89 | 39% | 35% | 32% | 28% |
| 90 | 41% | 37% | 33% | 30% |
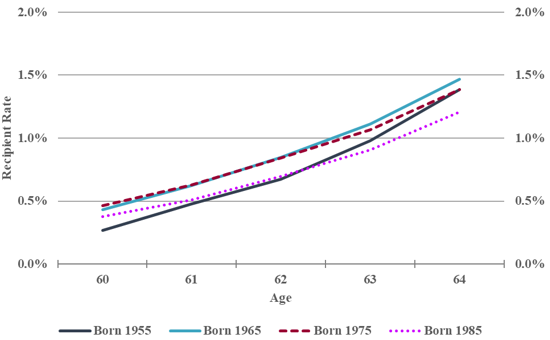
Chart 11 Text version
The Allowance recipient rate of males born in 1955 is 0.3% at age 60 and is 1.5% at age 64.
The Allowance recipient rate of males born in 1965 is 0.5% at age 60 and is 1.5% at age 64.
The Allowance recipient rate of males born in 1975 is 0.5% at age 60 and is 1.4% at age 64.
The Allowance recipient rate of males born in 1985 is 0.5% at age 60 and is 1.2% at age 64.
| Age | Recipient Rate, born in 1955 | Recipient Rate, born in 1965 | Recipient Rate, born in 1975 | Recipient Rate, born in 1985 |
|---|---|---|---|---|
| 60 | 0.27% | 0.43% | 0.46% | 0.38% |
| 61 | 0.48% | 0.62% | 0.63% | 0.51% |
| 62 | 0.68% | 0.85% | 0.84% | 0.69% |
| 63 | 0.98% | 1.11% | 1.07% | 0.91% |
| 64 | 1.39% | 1.47% | 1.39% | 1.21% |
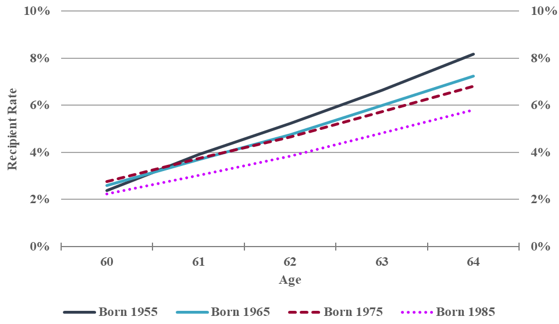
Chart 12 Text version
The Allowance recipient rate of females born in 1955 is 2.5% at age 60 and is 8.2% at age 64.
The Allowance recipient rate of females born in 1965 is 2.6% at age 60 and is 7.2% at age 64.
The Allowance recipient rate of females born in 1975 is 2.8% at age 60 and is 6.8% at age 64.
The Allowance recipient rate of females born in 1985 is 2.2% at age 60 and is 5.8% at age 64.
| Age | Recipient Rate, born in 1955 | Recipient Rate, born in 1965 | Recipient Rate, born in 1975 | Recipient Rate, born in 1985 |
|---|---|---|---|---|
| 60 | 2.4% | 2.6% | 2.8% | 2.2% |
| 61 | 3.9% | 3.7% | 3.7% | 3.0% |
| 62 | 5.2% | 4.8% | 4.7% | 3.8% |
| 63 | 6.6% | 6.0% | 5.7% | 4.8% |
| 64 | 8.2% | 7.2% | 6.8% | 5.8% |
B.5.3 Maximum benefits
Table 42 show the projected maximum monthly amount of benefits applicable for July of the given year. The amounts presented include the GIS and Allowance top-up amounts.
| 1 July of year | OASTable 42 footnote 1 | GISTable 42 footnote 2 | AllowanceTable 42 footnote 2 | |||
|---|---|---|---|---|---|---|
| before age 75 | after age 74 | Single | Married | Regular | Survivor | |
| 2022 | 667 | 734 | 996 | 600 | 1,266 | 1,510 |
| 2023 | 695 | 765 | 1,039 | 625 | 1,320 | 1,574 |
| 2024 | 714 | 785 | 1,066 | 642 | 1,356 | 1,616 |
| 2025 | 730 | 804 | 1,091 | 657 | 1,387 | 1,654 |
| 2026 | 746 | 820 | 1,114 | 670 | 1,416 | 1,688 |
| 2027 | 761 | 837 | 1,136 | 684 | 1,444 | 1,722 |
| 2028 | 776 | 853 | 1,159 | 698 | 1,473 | 1,756 |
| 2030 | 807 | 888 | 1,206 | 726 | 1,533 | 1,827 |
| 2035 | 891 | 980 | 1,331 | 801 | 1,692 | 2,017 |
| 2040 | 984 | 1,082 | 1,470 | 885 | 1,869 | 2,227 |
| 2045 | 1,086 | 1,195 | 1,623 | 977 | 2,063 | 2,459 |
| 2050 | 1,199 | 1,319 | 1,791 | 1,078 | 2,278 | 2,715 |
| 2055 | 1,324 | 1,457 | 1,978 | 1,191 | 2,515 | 2,998 |
| 2060 | 1,462 | 1,608 | 2,184 | 1,315 | 2,777 | 3,310 |
|
Table 42 footnotes
|
||||||
B.5.4 Average benefits in relation to maximum benefits
The average benefits in relation to maximum benefits are the results of a two steps process. In the first step, for each cell, determined by age, sex, type and level of benefit, the average benefit paid was compared to the maximum benefit rate for each of the past five years ending in 2022. The average levels over those five years are then assumed to remain constant over the projection period.
In the second step, the assumed effects of TFSAs, additional CPP and QPP and voluntary deferrals are introduced, and this results in individuals moving to different benefit levels. This has the effect of changing the distribution of beneficiaries by level and of increasing the aforementioned averages for the combined partial levels over time. The resulting assumed average benefits as a percentage of their maximum amounts by level (partial, full, and overall average level of benefit) and type are presented in Table 43 and Table 44.
For the OAS and the GIS, it is possible for a beneficiary to receive more than 100% of the maximum benefit. For the OAS, this situation can happen for cases where there is a voluntary deferral, and an actuarial adjustment factor is applied making the benefit higher than the maximum. For GIS, the situation happens if the person is receiving a partial OAS basic pension. In these cases, the maximum GIS benefit is increased by the difference between the full and partial basic pension.
| Benefit | 2022 | 2060 | ||||
|---|---|---|---|---|---|---|
| Partial | FullTable 43 footnote 1 | All | Partial | FullTable 43 footnote 1 | All | |
| OAS before age 75 | 60.6 | 101.3 | 95.6 | 65.0 | 102.5 | 96.6 |
| OAS after age 74 | 39.7Table 43 footnote 2 | 100.0 | 92.5 | 61.1 | 104.1 | 95.7 |
| GIS-Single | 56.6 | 123.4 | 65.7 | 46.7 | 125.6 | 57.8 |
| GIS-Spouse a pensioner | 42.6 | 162.8 | 67.8 | 38.4 | 166.7 | 65.9 |
| GIS-Spouse not a pensioner | 38.3 | 110.6 | 53.2 | 38.0 | 113.9 | 53.2 |
| GIS-Spouse with allowance | 55.6 | 123.4 | 85.9 | 51.8 | 124.9 | 84.3 |
| Allowance-Regular | 37.8 | 100.0 | 39.7 | 29.3 | 100.0 | 31.0 |
| Allowance-Survivor | 51.5 | 100.0 | 57.7 | 45.5 | 100.0 | 58.9 |
|
Table 43 footnotes
|
||||||
| Benefit | 2022 | 2060 | ||||
|---|---|---|---|---|---|---|
| Partial | FullTable 44 footnote 1 | All | Partial | FullTable 44 footnote 1 | All | |
| OAS before age 75 | 60.0 | 100.8 | 95.1 | 64.7 | 102.0 | 96.2 |
| OAS after age 74 | 38.2Table 44 footnote 2 | 100.0 | 92.5 | 60.7 | 103.3 | 95.0 |
| GIS-Single | 52.9 | 133.3 | 67.1 | 47.3 | 135.8 | 63.4 |
| GIS-Spouse a pensioner | 42.6 | 157.1 | 66.7 | 39.5 | 158.6 | 65.0 |
| GIS-Spouse not a pensioner | 50.7 | 114.5 | 62.8 | 53.2 | 116.6 | 65.3 |
| GIS-Spouse with allowance | 54.5 | 110.6 | 76.0 | 50.6 | 111.2 | 73.0 |
| Allowance-Regular | 41.4 | 100.0 | 43.0 | 35.1 | 100.0 | 36.7 |
| Allowance-Survivor | 49.0 | 100.0 | 55.0 | 42.0 | 100.0 | 54.2 |
|
Table 44 footnotes
|
||||||
B.6 Expenditures
B.6.1 Benefits
The expenditure for each year for a given type of benefit was computed as the sum, over all relevant population cells, of the product of:
- the population as at 1 July (by age and sex);
- the recipient rates (that vary by type of benefit, level of benefit, age, sex, and calendar year);
- the average benefit of those in the level-of-benefit cell as a percentage of the maximum benefit (varies by type of benefit, age, sex, and calendar year); and
- 12 times the maximum benefit as at 1 July.
As part of the methodology validation process, the number of beneficiaries and amounts of total annual benefits computed as above were compared to the actual results for 1983 through 2021 by type of benefit. Based on these comparisons, adjustments were made to the projected results, as described below.
The numbers of beneficiaries projected as described above were multiplied by experience adjustment factors. Furthermore, after adjusting the projected numbers of beneficiaries, the calculated total annual benefits tended to be lower than the actual benefits. Therefore, the projected amounts of benefits were also multiplied by experience adjustment factors.
The resulting experience adjustment factors by type of benefit are presented in Table 45 and correspond to the ratio required to reflect as closely as possible actual results for 2022. Detailed tables for the projected number of beneficiaries and total expenditures by sex, type and level of benefit are presented in Appendix E.
| Adjustment factors | OAS | GIS | Allowance | ||||
|---|---|---|---|---|---|---|---|
| Single | Spouse a pensioner | Spouse not a pensioner | Spouse has allowance | Regular | Survivor | ||
| Beneficiaries | 1.000 | 0.989 | 0.980 | 1.054 | 0.930 | 0.930 | 0.923 |
| Benefits | 1.000 | 1.040 | 1.059 | 0.900 | 1.066 | 1.037 | 1.064 |
B.6.2 Administrative expenses
Based on experience over the last five years, annual administrative expenses have averaged about 0.5% of total annual benefit payments. This has been assumed to continue throughout the projection period.
Appendix C — Detailed reconciliations with previous triennial report
The cost ratio of expenditures to GDP in a given year is an important measure of the cost of the program. One way of understanding the differences between the best-estimate projections in this report and those presented in the 16th Actuarial Report on the OAS program as at 31 December 2018 is by looking at the effects of various factors on this cost ratio. The most significant effects are identified in the reconciliation presented in Table 46 and the discussion below.
The results presented in this report differ from those previously projected for a variety of reasons. Differences between the actual experience from 2019 through 2021 and that projected in the 16th Actuarial Report on the OAS program for the same period were addressed in the section 6.2 of this report. Since historical results provide the starting point for the projections shown in this report, these historical differences between actual and projected experience have an effect on the projections. The impact of the experience update and changes in the assumptions and methodology that have significantly changed the projected results are addressed in this Appendix.
The recent amendments made to the Old Age Security Act, namely the 10% increase of the OAS pension payable to individuals aged 75 or older (effective 1 July 2022) lead to an increase in the cost ratio over the long term. The amendments lead to an absolute increase in the ratio of 0.12% in 2030 and 0.13% by 2060.
Overall, the experience update had the effect of reducing the cost ratio by 0.04 percentage points in 2030 and ultimately 0.09 percentage points in 2060. This was mainly due to higher than expected GDP at the end of 2021.
Key assumptions and changes made from the previous triennial report are outlined in Table 1 and Table 2 of this report. The effects of these changes are also shown in Table 46 and Table 47 and are summarized below:
-
The assumed total fertility rate, which is lower than in the previous triennial report, leads to a decrease in both expenditures and the GDP, and has a net effect of slightly increasing the cost ratio in the long term.
-
The assumed level of net migration is higher than in the previous triennial report, which increases the GDP immediately and increases benefits later on. This lowers the cost ratio immediately, but with an eventual diminishing effect as benefits increase over time.
-
The changes in mortality assumptions slightly decrease the cost ratio, because mortality rates are assumed to be higher, resulting in reduced benefit expenditures compared to the previous report.
-
The changes in the assumed labour force participation and employment rates decrease the cost ratio since the changed assumptions result in projected higher GDP relative to projected expenditures.
-
The lower real wage increase assumption causes the cost ratio to rise due to the resulting projected higher GIS and Allowance benefit expenditures and lower GDP compared to the previous triennial report.
-
The assumed inflation rate has a significant impact on the benefit expenditures, which grows over time. However, it has a small effect on the cost ratio over the long term. The reason is that although benefit expenditures are affected by inflation indexation, the growth in GDP is also affected by inflation.
-
In the short term, the combined effect of the assumed labour force participation rates, employment rates, real wage growth, and inflation rate result in a significant drop in the cost ratio due to much higher projected GDP. However, over the long term, the cost ratio increases due to lower real wage growth.
-
The revised lower OAS recipient rates assumptions decrease the expenditures and cost ratio due to higher deferrals of the OAS basic pension. The revised lower GIS and Allowances recipient rates assumptions also decrease the expenditures and cost ratio due to lower than expected impacts of the recent increase in the earnings exemption.
Some other assumptions, which are described in Appendix B, were also changed. For example, the experience adjustment factors used in the projection of benefits were revised to reflect more recent experience. Overall, the changes in these other assumptions had a minimal impact on the cost ratio over the long term.
| Reconciliation of expenditures | 2022 | 2030 | 2060 |
|---|---|---|---|
| 16th Actuarial report on the OAS program | 2.75 | 3.12 | 2.63 |
| I. Legislated amendments: 17th OAS program actuarial report on the OAS program |
|||
| Increase the OAS pension payable to individuals aged 75 or older by 10%, effective 1 July 2022. | 0.05 | 0.12 | 0.13 |
| Total amendments | 0.05 | 0.12 | 0.13 |
| II. Improvements in methodology | 0.00 | 0.00 | 0.00 |
| III. Experience update (2019 to 2021) | |||
| Demographic | (0.02) | (0.01) | 0.02 |
| Economic | 0.02 | (0.01) | (0.09) |
| Benefits | (0.03) | (0.02) | (0.02) |
| Subtotal: | (0.03) | (0.04) | (0.09) |
| IV. Changes in assumptions | |||
| Fertility | 0.00 | 0.00 | 0.05 |
| Net migration | (0.01) | (0.07) | (0.04) |
| Mortality | (0.01) | (0.03) | (0.02) |
| Economic assumptions | (0.16) | (0.06) | 0.04 |
| Benefits | (0.07) | (0.07) | (0.06) |
| Other assumptions | (0.01) | 0.01 | 0.00 |
| Subtotal: | (0.26) | (0.22) | (0.03) |
| Total of I to IV | (0.24) | (0.14) | 0.01 |
| 18th Actuarial report on the OAS program | 2.51 | 2.98 | 2.64 |
Another way of understanding the differences between the best-estimate projections in this report and those presented in the 16th Actuarial Report on the OAS program as at 31 December 2018 is by looking at the effects of various factors on the amount of expenditure. The most significant factors are identified in the reconciliation presented in Table 47 below and are the same as those presented in Table 46.
| Reconciliation of expenditures | 2022 | 2030 | 2060 |
|---|---|---|---|
| 16th Actuarial report on the OAS program | 68.28 | 103.20 | 243.43 |
| I. Legislated amendments: 17th OAS Program actuarial report on the OAS program |
|||
| Increase the OAS pension payable to individuals aged 75 or older by 10%, effective 1 July 2022. | 1.21 | 4.03 | 11.59 |
| Total amendments | 1.21 | 4.03 | 11.59 |
| II. Improvements in methodology | 0.00 | 0.00 | 0.00 |
| III. Experience update (2019 to 2021) | |||
| Demographic | (0.38) | (0.26) | 0.47 |
| Economic | 0.73 | 0.96 | 1.49 |
| Benefits | (0.38) | 0.04 | 0.17 |
| Subtotal: | (0.04) | 0.75 | 2.13 |
| IV. Changes in assumptions | |||
| Fertility | 0.00 | 0.00 | (0.17) |
| Net migration | 0.07 | 0.50 | 6.20 |
| Mortality | (0.14) | (0.96) | (2.75) |
| Economic assumptions | 2.81 | 8.32 | 22.20 |
| Benefits | (1.94) | (2.60) | (6.50) |
| Other assumptions | (0.37) | 0.25 | 0.39 |
| Subtotal: | 0.43 | 5.51 | 19.37 |
| Total of I to IV | 1.60 | 10.28 | 33.09 |
| 18th Actuarial report on the OAS program | 69.89 | 113.49 | 276.51 |
Appendix D — Uncertainty of results
D.1 Introduction
This actuarial report on the Old Age Security program is based on the projection of its expenditures over a long period of time. The information required by statute, which is presented in the Results section 5 of this report, has been derived using best-estimate assumptions regarding future demographic and economic trends. The key best-estimate assumptions, i.e., those for which changes within a reasonable range have the most significant impact on the long-term financial results, are described in Appendix B. Both the length of the projection period and the number of assumptions required ensure that actual future experience will not develop precisely in accordance with the best-estimate assumptions. The objective of this Appendix of the report is to illustrate the sensitivity of the long-term projections of the OAS program to changes in the future demographic and economic outlooks.
The future expenditures of the OAS program depend on many demographic and economic factors, including fertility, mortality, migration, the labour force, average earnings, inflation, recipient rates, and indexation of benefits. The expenditures will depend on how these factors affect the size and composition of the beneficiary population and the general level of benefits.
Expenditures are measured relative to the GDP. This measurement base will depend on how the aforementioned factors affect the size and composition of the working-age population, and the level and distribution of earnings.
D.2 Individual sensitivity tests
The key best-estimate assumptions used for the projections in this report are described in Table 1. Individual sensitivity tests have been performed using alternative assumptions to illustrate a reasonable range of how experience could vary from the best-estimate projections. All tests use purely deterministic models and are based on judgment. The ranges analyzed for each assumption are described below.
The sensitivity tests were performed by varying most of the key assumptions individually and by keeping the remaining assumptions at their best-estimate levels. Each sensitivity test was categorized as either a lower-cost scenario or a higher-cost scenario. In the lower-cost scenarios, the alternative assumptions have the effect of reducing the cost ratios expressed as a percentage of GDP. Conversely, the assumptions for the higher-cost scenarios increase the cost ratios expressed as a percentage of GDP. The alternative assumptions selected are intended to represent a wide range of potential long-term experience. However, the individual results cannot simply be combined, because a change in any one particular assumption may have an impact on other assumptions to various degrees.
Table 48 summarizes the alternative assumptions used in the individual sensitivity tests. It is followed by a brief discussion of these tests.
| Sensitivity test | Lower-cost | Best-estimate | Higher-cost |
|---|---|---|---|
| Total fertility rate | 1.84 | 1.54 | 1.24 |
| Male mortality: Canadian life expectancy at age 65 in 2050 with future improvements | 20.9 years | 23.1 years | 25.2 years |
| Female mortality: Canadian life expectancy at age 65 in 2050 with future improvements | 23.3 years | 25.4 years | 27.4 years |
| Net migration rate | 0.84% | 0.64% | 0.44% |
| GIS Recipient rates in 2050 | 24.7% | 29.9% | 35.1% |
| Allowance recipient rates in 2050 | 1.9% | 2.3% | 2.8% |
| Benefit indexation | CPI less 1% | CPI | CPI plus 60% of the real wage increase |
The following provides some observations on the selection of assumptions for lower- and higher-cost scenarios and their impacts on the OAS.
-
Fertility Rates: This test will only have an impact on the long term, when working life starts and impact the GDP. Experience of Group of 7 (G7) countries (Canada, France, Germany, Italy, Japan, the United Kingdom, and the United States) was used to generate the lower- and higher-cost scenarios over the projection period.
-
Mortality Rates: Under the lower‑cost scenario, mortality is assumed to improve at a slower rate than under the best‑estimate scenario, with ultimate values of the mortality improvement rates gradually reduced to 0% for all ages in 2039. Under the higher-cost scenario, mortality is assumed to improve at a faster pace than under the best-estimate scenario with the ultimate mortality improvement rates being doubled compared to their best‑estimate values.
-
Net Migration Rate: The lower-cost and higher-cost assumptions were selected by analyzing historical data and trends.
-
GIS and Allowance Recipient Rates: Under the lower-cost scenario, the best-estimates recipient rates for the GIS and Allowance are reduced by 20%. Under the higher-cost scenario, the recipient rates for GIS and Allowance benefits are increased by 20%. The adjustments are phased in over five years (2023 to 2027) and are maintained thereafter.
-
Benefit Indexation: Under the lower-cost scenario, the benefit indexation is assumed at CPI minus 1%. Under the higher-cost scenario, the benefit rates are partially increased to reflect the growth in real wages. The assumption made for this test is that benefit rates would be indexed at rates equal to the assumed rate of growth in prices plus 60% of the assumed real wage increase.
D.2.1 Results
Table 49 summarizes the projected impact on the expenditures-to-GDP cost ratio under each of the alternative sets of assumptions.
| Assumption | Scenario | 2022 | 2030 | 2060 |
|---|---|---|---|---|
| Best-estimate | N/A | 2.51 | 2.98 | 2.64 |
| Total fertility rate | Lower-cost | 2.51 | 2.98 | 2.48 |
| Higher-cost | 2.51 | 2.98 | 2.81 | |
| Mortality rates | Lower-cost | 2.51 | 2.98 | 2.48 |
| Higher-cost | 2.51 | 2.99 | 2.79 | |
| Net migration rate | Lower-cost | 2.51 | 2.95 | 2.43 |
| Higher-cost | 2.51 | 3.00 | 2.86 | |
| GIS and allowance recipient rates | Lower-cost | 2.51 | 2.85 | 2.54 |
| Higher-cost | 2.51 | 3.11 | 2.74 | |
| Benefit indexation | Lower-cost | 2.51 | 2.73 | 1.74 |
| Higher-cost | 2.51 | 3.07 | 3.25 |
D.3 Higher and lower economic growth
While the best-estimate assumptions in this report reflect moderate sustained economic growth in the future, there is significant uncertainty and volatility surrounding the economic environment. Many factors could lead to long-term economic growth in Canada being different than assumed under the best-estimate scenario. These factors could stem from both domestic and global forces, and include geopolitical conflicts such as the current conflict in Ukraine, health crisis such as the COVID-19 pandemic, extreme weather events due to climate change, the timing and pace of transition to a green economy, the pace of technological advances and innovation, worldwide policies on protectionism vs. globalisation as well as demographic pressures from an aging population.
Given the high level of uncertainty, scenarios of higher and lower economic growth were considered in this report. These alternative economic growth scenarios comprise combinations of individual assumptions, alternative changes to the labour market and alternative assumption for the real wage increase.
In respect of the labour market, employment levels are reflected in the actuarial projection model through the assumptions made regarding the level of labour force participation and job creation rates by year, age and sex. These rates vary not only with the rate of unemployment, but also reflect trends in increased workforce participation by women, and longer periods of formal education among young adults, and trends in the retirement patterns of older workers.
Under the best-estimate scenario, the job creation rate assumption is determined on the basis of expected moderate economic growth and an unemployment rate that is expected to decrease from 7.5% in 2021 to 6.0% in 2022, 5.7% in 2023 and then increase to reach an ultimate level of 6.1% by 2027. Furthermore, the participation rates for all age groups are expected to increase due to the projected increase in labour force participation rates of women, continuing trends toward longer working lives, and the attractive employment opportunities resulting from labour shortages. Under the best-estimate scenario, the participation rate of those aged 18 to 69 for Canada is expected to increase from 76.7% in 2022 to 80.0% in 2035.
The best-estimate assumption for the real wage increase is that it reaches an ultimate level of 0.9% by the year 2026. The ultimate real wage increase assumption together with the price increase assumption of 2.0% leads to an ultimate nominal wage increase of 2.9% for 2026 and thereafter.
D.3.1 Higher economic growth
Under the higher economic growth scenario, for the labour market, the job creation rate is robust resulting in a lower unemployment level and higher labour force participation rates. In addition to the assumed labour market changes, the real wage increase is assumed to be higher than the best estimate.
For this higher economic growth scenario, the job creation rate is assumed to increase at a faster pace than under the best-estimate scenario, resulting in an unemployment rate of 4.1% in 2030 and thereafter. In addition, the assumed ultimate participation rates in 2035 are set to increase to higher levels than the best estimates, and the assumed ultimate gap between male and female participation rates in 2035 for those aged 18 to 69 is set equal to 3.6% as opposed to 6.3% under the best-estimate scenario. This results in an overall participation rate of 85.1% for those aged 18 to 69 in 2035. Finally, in addition to the assumed changes in the labour market, the real wage increase is assumed to be 1.5% as opposed to 0.9% under the best-estimate scenario in 2026 and thereafter. The higher economic growth scenario results in total employment earnings in 2035 being 15% higher compared to the best estimate.
D.3.2 Lower economic growth
Under the lower economic growth scenario, for the labour market, the job creation rate increases at a slower pace, resulting in a higher unemployment level and lower labour force participation rates. In addition to the assumed labour market changes, the real wage increase is assumed to be lower than the best estimate.
For this lower economic growth scenario, the job creation rate is assumed to increase at a slower pace than the best estimate, resulting in an unemployment rate of 8.1% in 2030 and thereafter. In addition, male and female participation rates are assumed to remain constant at their 2021 levels. This results in an overall participation rate of 77.3% for those aged 18 to 69 in 2035. Finally, in addition to the assumed changes in the labour market, the real wage increase assumption is assumed to be 0.3% compared to 0.9% under the best-estimate scenario in 2026 and thereafter. The lower economic growth scenario results in total employment earnings in 2035 being 11% lower compared to the best estimate.
D.3.3 Results
Table 50 present a summary of the assumptions used in the sensitivity analysis of economic growth and the resulting cost of the program expressed as a percentage of GDP in 2060.
| Changes to labour market and real wage increase | Higher economic growth | Best-estimate | Lower economic growth |
|---|---|---|---|
| Participation rate (age group 18-69) (2035) | 85.1% | 80.0% | 77.3% |
| Unemployment rate (2030) | 4.1% | 6.1% | 8.1% |
| Real wage increase | 1.5 % (2026+) | 0.9 % (2026+) | 0.3 % (2026+) |
| Expenditures as % of GDP in 2060 | 1.94% | 2.64% | 3.52% |
D.4 Stagflation
Stagflation is characterized by a simultaneous economic stagnation and increase in inflation. During the 1970s and 1980s, the Canadian economy went through a period of stagflation that was partly caused by oil price increases as a result of supply shocks. This led to rising consumer prices and wages. The stagflation period ended when the Bank of Canada increased interest rates in the early 1980s, which led the economy to a recession.
The COVID-19 pandemic caused supply chain disruptions, shortages of labour and products, higher energy prices and led to higher consumer prices in 2021. Moreover, the escalation of the conflict in Ukraine exerts an additional pressure on the global economy and adds to the price pressures. This concurrence of events could lead to unanchored inflation, and actions aimed at containing inflation could lead to increases in unemployment rates.
While under the best-estimate assumptions, it is assumed that a stagflation scenario will not occur, this subsection presents the impact of a hypothetical stagflation scenario on program expenditures, the GDP, and the cost ratios of expenditures as percentage of GDP.
Under the assumed stagflation scenario, inflation is projected to be high and above the Bank of Canada's target for ten years, which is consistent with the length of period of higher inflation that followed the first oil price shock in the 1970s. The inflation is projected to increase from 6.9% in 2022 to 10.0% in 2023 and stay at that level in 2024. It is then projected to decrease gradually to reach an ultimate value of 2.0% in 2032.
Under this scenario, firms are expected to raise their prices to offset the increase in expenses. Higher prices will eventually slow household spending and result in an economic slowdown. As such, it is assumed that unemployment rates will be higher than under the best-estimate assumptions for a period of 10 years from 2024. The unemployment rate is assumed to reach 8.0% in 2024 and increase to 10.0% by 2026. Afterward, it is assumed to decrease gradually to an ultimate value of 6.1% in 2034.
It is assumed that 50% of the inflation is integrated in nominal wage increases from 2023 to 2025. That percentage is assumed to increase gradually to an ultimate of 100% in 2030. The real-wage increases over the period 2023-2029 are therefore lower than under the best-estimate assumption.
Under the stagflation scenario, OAS program expenditures increase by about 22% in 2025 and 50% after 2030 due to inflation. On the other hand, the GDP increases under the scenario by about 3% in 2025 and by about 20% by 2030 due to lower nominal wages and a tougher labour market (higher unemployment). The combined impact on expenditures as percentage of the GDP is an increase of 0.49 percentage points (from 2.78% to 3.27%) in 2025 and about 0.83 percentage points (from 2.98% to 3.81%) by 2030. After 2030, the increase in the cost ratio declines somewhat to about 0.7 percentage points. By 2060, the cost ratio is 3.32% under the stagnation scenario compared to 2.64% under the best-estimate scenario.
D.5 Climate change
Context
Based on the World Economic Forum's Global Risk Report 2022Footnote 4, five of the top ten most severe global risks over the next ten years are related to climate change. Climate change risks are generally classified into two categories: physical risks, which are linked to the increase in the frequency and severity of climate events and transition risks, which are linked to efforts undertaken for a transition towards a lower carbon economy.
Physical and transition risks are strongly interconnected. Transitioning to a green economy may create short- and medium-term economic and financial disruptions while reducing physical risks in the longer term. On the other hand, if insufficient actions are taken to transition to a lower carbon economy, physical risks may compound and increase significantly.
It is also important to note that regardless of the transition path, full elimination of physical risks is not realisticFootnote 5 at this point given that a certain level of physical risk is already embedded from past global warming. However, physical risks may be reduced or mitigated if new technologies are developed that reduce and/or capture carbon emissions.
Since such technologies are not readily available yet, there is general consensus that climate change will have an overall negative impact on society and the economy worldwide. Given the magnitude of the potential socio-economic impacts, climate change may also have an impact on social programs such as the OAS.
Climate change can affect the OAS through various channels. The demographic and economic environments can all be affected by climate change in the future. However, there is a lot of uncertainty on the direction and magnitude of these potential impacts, and the risk is evolving constantly. In addition, research and data to quantify the full impact of climate change on the demographic and economic environments are incomplete and, in certain cases, somewhat conflicting.
In view of the high level of uncertainty, the current best practice is to conduct scenario analysis rather than incorporate future climate policy and the potential impact of technology into best-estimate assumptions. Given the potential implications of climate change on the OAS, this section uses information from publicly available sources to illustrate a range of potential impacts on the expenditures-to-GDP cost ratio.
It important to note that this section focuses on assessing downside risk only, and that the analysis is based on scenarios that are intentionally adverse. New technologies and business opportunities related to a transition to a lower carbon economy may also create positive outcomes that are outside the scope of this section. The section is therefore not meant to represent forecasts or predictions.
Illustrative Scenarios
Over the last few years, many global organizations and regulators have been conducting climate scenario analysis in order to assess risk, and they have been publishing the results of their findings. The risk assessments focus on a range of variables under various climate path scenarios. The climate path scenarios are normally broadly based on the Representative Concentration Pathways or Shared Socio-Economic Pathways used in the Intergovernmental Panel on Climate Change's Fifth and Sixth Assessment Reports.Footnote 6, Footnote 7
One important variable that is often analysed in these publications is the gross domestic product (GDP). It has the advantage of being a well understood and broadly used measure. Conceptually, it is also an overarching macro-economic variable that can be used to adjust the future economic and investment environment.
After reviewing various published articles and research papers on climate change scenario analysis, three scenarios with different pathways of Canadian GDP growth rates relative to a baseline scenarioFootnote 8 are selected to assess the impact on the expenditures-to-GDP cost ratio.
Scenario 1 can be generally classified in the 'orderly transition' category of scenarios. It therefore assumes that successful climate policies are introduced early and gradually in order to limit global warming. Canadian GDP growth rates are lower relative to the baseline scenario starting in 2020, mainly caused by disruption in the economy from implementation of climate change policies. The cumulative difference in GDP projections relative to the baseline scenario grows to -10% by 2050, then stay constant until 2100.
Scenario 2 can be generally classified in the 'disorderly/delayed transition' category of scenarios. It assumes that climate change policies only start in 2030. There is therefore no impact on GDP relative to the baseline scenario until 2030. However, late action leads to a stronger impact than scenario 1 after 2030. The cumulative difference relative to the baseline scenario is 0% by 2030, -15% by 2050 and -20% by 2100.
Scenario 3 can be generally classified in the 'failed transition' category of scenarios. It assumes that no further climate change policies are implemented. Although the difference relative to the baseline scenario is lower than the other scenarios through 2050, the compound physical risks resulting from no further climate action creates severe impacts between 2050 and 2100. The cumulative difference relative to the baseline scenario is 0% by 2030, -8% by 2050 and -30% by 2100.
Chart 13 shows the difference in Canadian GDP growth rates relative to the baseline scenario for each scenario.
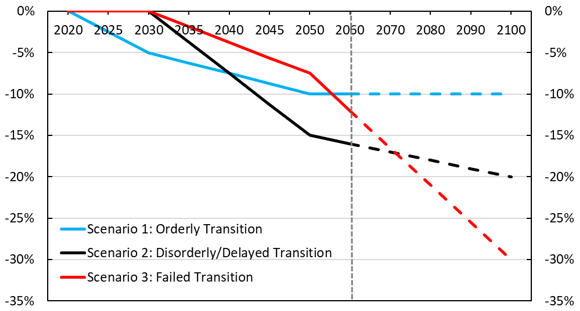
Chart 13 Text version
The resulting impact of climate change under the Orderly Transition is a growing loss up to 10% by 2050, then it stays constant at that level.
The Disorderly/Delayed Transition, no impact on GDP relative to the baseline scenario until 2030. After 2030, the cumulative difference relative to the baseline scenario is 0% in 2030, -15% by 2050 and -20% by 2100.
For the failed transition, the cumulative difference relative to the baseline scenario is 0% by 2030, -8% by 2050 and -30% by 2100.
| Scenarios | 2020 | 2025 | 2030 | 2035 | 2040 | 2045 | 2050 | 2060 | 2070 | 2080 | 2090 | 2100 |
|---|---|---|---|---|---|---|---|---|---|---|---|---|
| Scenario 1: Orderly Transition | 0.0% | -2.5% | -5.0% | -6.3% | -7.5% | -8.8% | -10.0% | -10.0% | -10.0% | -10.0% | -10.0% | -10.0% |
| Scenario 2: Disorderly/Delayed Transition | 0.0% | 0.0% | 0.0% | -3.8% | -7.5% | -11.3% | -15.0% | -16.0% | -17.0% | -18.0% | -19.0% | -20.0% |
| Scenario 3: Failed Transition | 0.0% | 0.0% | 0.0% | -1.9% | -3.8% | -5.6% | -8.0% | -12.0% | -17.0% | -21.0% | -26.0% | -30.0% |
Methodology
The scenarios above are translated into potential impacts on the expenditures-to-GDP cost ratio, by translating the changes in Canadian GDP growth into changes in total employment earnings growth through the real wage assumption.
This simplified model allows for an initial assessment of climate change risk on the OAS. The OCA will conduct further research in the future and collaborate with other professionals on the topic with the objective of refining the model as well as incorporating more relevant variables and their dynamics.
Results
The impact on the expenditures-to-GDP cost ratio for each scenario is shown in Table 51. It is important to note that these hypothetical scenarios are intentionally adverse. They are meant to illustrate downside risks only and are not meant to be forecasts or predictions.
| Scenario | 2022 | 2030 | 2060 |
|---|---|---|---|
| Best-estimate | 2.51 | 2.98 | 2.64 |
| Scenario 1: Orderly transition | 2.51 | 3.14 | 2.96 |
| Scenario 2: Disorderly/Delayed transition | 2.51 | 2.98 | 3.22 |
| Scenario 3: Failed transition | 2.51 | 2.98 | 3.08 |
For the purpose of this report, impacts on the expenditures-to-GDP cost ratio are shown up to 2060, where impacts are higher under Scenario 2 than Scenario 3. As shown in Chart 17 above, the cumulative GDP impact in 2060 is higher under Scenario 2 (Disorderly/Delayed Transition) than under Scenario 3 (Failed Transition), this is due to the climate change policies that are assumed to start in 2030 under Scenario 2. However, over a longer period of time, the cumulative GDP impact under Scenario 3 will be larger due to the compound physical risks arising from the lack of further climate change policies. This will result in higher impacts on the expenditures-to-GDP cost ratio under Scenario 3 than Scenario 2.
Appendix E - Detailed projections of beneficiaries and expenditures
The following tables present detailed projections of the number of beneficiaries and amounts of expenditures for the OAS basic pension, GIS, and Allowance benefits. All figures shown include benefits paid outside of Canada.
The tables providing OAS basic pension projections account for voluntary deferrals, effective 1 July 2013. The tables providing GIS projections account for the increase in the supplement paid to individuals receiving partial OAS pensions. For these individuals, the GIS is increased by the difference between the full and partial OAS pension.
| Year | Males | Females | Both sexes | ||||||
|---|---|---|---|---|---|---|---|---|---|
| Level of benefit | Level of benefit | Level of benefit | |||||||
| Partial | Full | TotalTable 52 Footnote 2 | Partial | Full | TotalTable 52 Footnote 2 | Partial | Full | TotalTable 52 Footnote 2 | |
| 2022 | 421 | 2,770 | 3,191 | 487 | 3,275 | 3,762 | 907 | 6,046 | 6,953 |
| 2023 | 451 | 2,880 | 3,331 | 522 | 3,394 | 3,915 | 973 | 6,274 | 7,247 |
| 2024 | 480 | 2,975 | 3,456 | 556 | 3,494 | 4,050 | 1,036 | 6,469 | 7,505 |
| 2025 | 511 | 3,071 | 3,581 | 591 | 3,596 | 4,187 | 1,101 | 6,667 | 7,768 |
| 2026 | 541 | 3,166 | 3,708 | 627 | 3,698 | 4,324 | 1,168 | 6,864 | 8,032 |
| 2027 | 572 | 3,258 | 3,830 | 662 | 3,796 | 4,457 | 1,233 | 7,053 | 8,287 |
| 2028 | 602 | 3,351 | 3,953 | 697 | 3,895 | 4,592 | 1,299 | 7,246 | 8,545 |
| 2030 | 659 | 3,520 | 4,180 | 764 | 4,078 | 4,842 | 1,423 | 7,598 | 9,021 |
| 2035 | 766 | 3,781 | 4,547 | 892 | 4,381 | 5,272 | 1,658 | 8,162 | 9,819 |
| 2040 | 835 | 3,936 | 4,771 | 982 | 4,584 | 5,565 | 1,816 | 8,519 | 10,336 |
| 2045 | 883 | 4,062 | 4,944 | 1,047 | 4,755 | 5,802 | 1,930 | 8,816 | 10,747 |
| 2050 | 927 | 4,250 | 5,177 | 1,101 | 4,963 | 6,064 | 2,028 | 9,213 | 11,241 |
| 2055 | 976 | 4,505 | 5,482 | 1,149 | 5,209 | 6,358 | 2,125 | 9,714 | 11,839 |
| 2060 | 1,044 | 4,842 | 5,886 | 1,210 | 5,513 | 6,723 | 2,254 | 10,355 | 12,609 |
|
Table 52 footnotes
|
|||||||||
| Year | Males | Females | Both sexes | ||||||
|---|---|---|---|---|---|---|---|---|---|
| Level of benefit | Level of benefit | Level of benefit | |||||||
| Partial | Full | TotalTable 53 Footnote 2 | Partial | Full | TotalTable 53 Footnote 2 | Partial | Full | TotalTable 53 Footnote 2 | |
| 2022 | 1,786 | 22,793 | 24,580 | 2,003 | 26,914 | 28,917 | 3,790 | 49,707 | 53,497 |
| 2023 | 2,088 | 25,396 | 27,484 | 2,355 | 29,925 | 32,279 | 4,443 | 55,321 | 59,764 |
| 2024 | 2,336 | 26,999 | 29,334 | 2,642 | 31,692 | 34,334 | 4,978 | 58,690 | 63,668 |
| 2025 | 2,592 | 28,583 | 31,175 | 2,941 | 33,438 | 36,379 | 5,533 | 62,021 | 67,554 |
| 2026 | 2,855 | 30,150 | 33,005 | 3,247 | 35,160 | 38,406 | 6,102 | 65,309 | 71,411 |
| 2027 | 3,123 | 31,703 | 34,827 | 3,557 | 36,871 | 40,429 | 6,681 | 68,574 | 75,255 |
| 2028 | 3,401 | 33,320 | 36,722 | 3,880 | 38,655 | 42,535 | 7,281 | 71,976 | 79,257 |
| 2030 | 3,967 | 36,557 | 40,523 | 4,536 | 42,249 | 46,784 | 8,502 | 78,805 | 87,308 |
| 2035 | 5,279 | 43,799 | 49,079 | 6,089 | 50,563 | 56,652 | 11,369 | 94,362 | 105,731 |
| 2040 | 6,488 | 50,730 | 57,218 | 7,564 | 58,840 | 66,404 | 14,052 | 109,570 | 123,622 |
| 2045 | 7,637 | 57,896 | 65,533 | 9,001 | 67,521 | 76,522 | 16,637 | 125,418 | 142,055 |
| 2050 | 8,865 | 66,784 | 75,648 | 10,474 | 77,756 | 88,230 | 19,338 | 144,540 | 163,878 |
| 2055 | 10,290 | 78,013 | 88,303 | 12,055 | 90,005 | 102,059 | 22,345 | 168,017 | 190,362 |
| 2060 | 12,150 | 92,519 | 104,668 | 14,013 | 105,127 | 119,139 | 26,162 | 197,645 | 223,808 |
|
Table 53 footnotes
|
|||||||||
| Year | Males | Females | Both sexes | ||||||
|---|---|---|---|---|---|---|---|---|---|
| Level of benefit | Level of benefit | Level of benefit | |||||||
| Partial | Full | TotalTable 54 Footnote 1 | Partial | Full | TotalTable 54 Footnote 1 | Partial | Full | TotalTable 54 Footnote 1 | |
| 2022 | 756 | 176 | 932 | 1,089 | 251 | 1,340 | 1,845 | 427 | 2,272 |
| 2023 | 804 | 186 | 990 | 1,147 | 264 | 1,411 | 1,950 | 450 | 2,400 |
| 2024 | 842 | 194 | 1,037 | 1,196 | 274 | 1,470 | 2,038 | 469 | 2,507 |
| 2025 | 878 | 201 | 1,079 | 1,244 | 285 | 1,529 | 2,122 | 486 | 2,607 |
| 2026 | 912 | 208 | 1,120 | 1,292 | 295 | 1,586 | 2,204 | 502 | 2,707 |
| 2027 | 946 | 215 | 1,161 | 1,340 | 304 | 1,644 | 2,286 | 519 | 2,805 |
| 2028 | 982 | 221 | 1,203 | 1,389 | 314 | 1,704 | 2,371 | 535 | 2,906 |
| 2030 | 1,040 | 232 | 1,272 | 1,477 | 332 | 1,810 | 2,517 | 565 | 3,082 |
| 2035 | 1,104 | 246 | 1,350 | 1,619 | 364 | 1,983 | 2,723 | 610 | 3,333 |
| 2040 | 1,127 | 251 | 1,379 | 1,707 | 385 | 2,092 | 2,835 | 636 | 3,471 |
| 2045 | 1,126 | 251 | 1,378 | 1,735 | 393 | 2,128 | 2,861 | 645 | 3,505 |
| 2050 | 1,128 | 253 | 1,381 | 1,739 | 396 | 2,134 | 2,866 | 648 | 3,515 |
| 2055 | 1,142 | 256 | 1,398 | 1,718 | 397 | 2,114 | 2,859 | 653 | 3,512 |
| 2060 | 1,156 | 265 | 1,421 | 1,709 | 404 | 2,113 | 2,866 | 669 | 3,534 |
|
Table 54 footnotes
|
|||||||||
| Year | Males | Females | Both sexes | ||||||
|---|---|---|---|---|---|---|---|---|---|
| Level of benefit | Level of benefit | Level of benefit | |||||||
| Partial | Full | TotalTable 55 Footnote 1 | Partial | Full | TotalTable 55 Footnote 1 | Partial | Full | TotalTable 55 Footnote 1 | |
| 2022 | 3,784 | 2,207 | 5,990 | 5,913 | 3,595 | 9,508 | 9,697 | 5,802 | 15,499 |
| 2023 | 4,198 | 2,445 | 6,642 | 6,501 | 3,948 | 10,450 | 10,699 | 6,393 | 17,092 |
| 2024 | 4,499 | 2,618 | 7,117 | 6,936 | 4,212 | 11,148 | 11,435 | 6,830 | 18,265 |
| 2025 | 4,775 | 2,778 | 7,553 | 7,359 | 4,469 | 11,828 | 12,134 | 7,247 | 19,381 |
| 2026 | 5,043 | 2,934 | 7,977 | 7,775 | 4,721 | 12,496 | 12,818 | 7,655 | 20,473 |
| 2027 | 5,308 | 3,090 | 8,398 | 8,195 | 4,977 | 13,172 | 13,503 | 8,067 | 21,571 |
| 2028 | 5,585 | 3,253 | 8,838 | 8,635 | 5,246 | 13,880 | 14,219 | 8,499 | 22,718 |
| 2033 | 6,661 | 3,955 | 10,616 | 10,604 | 6,534 | 17,139 | 17,265 | 10,490 | 27,755 |
| 2038 | 7,457 | 4,570 | 12,027 | 12,377 | 7,796 | 20,173 | 19,834 | 12,366 | 32,200 |
| 2040 | 7,732 | 4,797 | 12,528 | 13,041 | 8,280 | 21,321 | 20,773 | 13,077 | 33,849 |
| 2045 | 8,350 | 5,336 | 13,686 | 14,407 | 9,422 | 23,829 | 22,757 | 14,758 | 37,515 |
| 2050 | 9,120 | 5,920 | 15,040 | 15,736 | 10,484 | 26,220 | 24,856 | 16,404 | 41,260 |
| 2055 | 10,018 | 6,622 | 16,639 | 17,051 | 11,626 | 28,678 | 27,069 | 18,248 | 45,317 |
| 2060 | 11,176 | 7,524 | 18,700 | 18,622 | 13,048 | 31,670 | 29,798 | 20,572 | 50,370 |
|
Table 55 Footnotes
|
|||||||||
| Year | Males | Females | Both sexes | ||||||
|---|---|---|---|---|---|---|---|---|---|
| Level of benefit | Level of benefit | Level of benefit | |||||||
| Partial | Full | TotalTable 56 Footnote 1 | Partial | Full | TotalTable 56 Footnote 1 | Partial | Full | TotalTable 56 Footnote 1 | |
| 2022 | 358 | 57 | 415 | 762 | 163 | 926 | 1,121 | 220 | 1,341 |
| 2023 | 380 | 61 | 441 | 798 | 171 | 969 | 1,179 | 231 | 1,410 |
| 2024 | 399 | 64 | 463 | 831 | 177 | 1,008 | 1,230 | 241 | 1,471 |
| 2025 | 417 | 66 | 483 | 864 | 184 | 1,048 | 1,281 | 250 | 1,531 |
| 2026 | 435 | 69 | 503 | 897 | 190 | 1,087 | 1,331 | 259 | 1,590 |
| 2027 | 452 | 71 | 523 | 930 | 197 | 1,127 | 1,382 | 268 | 1,650 |
| 2028 | 470 | 74 | 544 | 964 | 203 | 1,168 | 1,434 | 277 | 1,711 |
| 2030 | 500 | 78 | 578 | 1,026 | 215 | 1,241 | 1,526 | 293 | 1,819 |
| 2035 | 537 | 83 | 620 | 1,134 | 237 | 1,371 | 1,671 | 320 | 1,991 |
| 2040 | 557 | 87 | 644 | 1,214 | 254 | 1,467 | 1,770 | 340 | 2,111 |
| 2045 | 567 | 89 | 656 | 1,251 | 264 | 1,515 | 1,818 | 353 | 2,171 |
| 2050 | 578 | 92 | 670 | 1,269 | 269 | 1,538 | 1,848 | 361 | 2,208 |
| 2055 | 594 | 95 | 689 | 1,253 | 272 | 1,524 | 1,847 | 366 | 2,213 |
| 2060 | 602 | 98 | 700 | 1,241 | 276 | 1,517 | 1,843 | 374 | 2,217 |
|
Table 56 footnotes
|
|||||||||
| Year | Males | Females | Both sexes | ||||||
|---|---|---|---|---|---|---|---|---|---|
| Level of benefit | Level of benefit | Level of benefit | |||||||
| Partial | Full | TotalTable 57 Footnote 1 | Partial | Full | TotalTable 57 Footnote 1 | Partial | Full | TotalTable 57 Footnote 1 | |
| 2022 | 2,422 | 841 | 3,264 | 4,823 | 2,599 | 7,423 | 7,246 | 3,441 | 10,687 |
| 2023 | 2,677 | 933 | 3,610 | 5,280 | 2,841 | 8,122 | 7,957 | 3,775 | 11,732 |
| 2024 | 2,867 | 1,004 | 3,871 | 5,621 | 3,029 | 8,650 | 8,488 | 4,032 | 12,520 |
| 2025 | 3,041 | 1,069 | 4,110 | 5,959 | 3,214 | 9,173 | 8,999 | 4,283 | 13,283 |
| 2026 | 3,209 | 1,134 | 4,343 | 6,290 | 3,398 | 9,688 | 9,499 | 4,531 | 14,031 |
| 2027 | 3,376 | 1,198 | 4,574 | 6,625 | 3,584 | 10,208 | 10,001 | 4,782 | 14,783 |
| 2028 | 3,549 | 1,267 | 4,815 | 6,975 | 3,779 | 10,754 | 10,523 | 5,045 | 15,569 |
| 2030 | 3,878 | 1,395 | 5,273 | 7,666 | 4,170 | 11,837 | 11,545 | 5,565 | 17,110 |
| 2035 | 4,453 | 1,666 | 6,118 | 9,167 | 5,108 | 14,275 | 13,619 | 6,774 | 20,393 |
| 2040 | 4,939 | 1,939 | 6,878 | 10,623 | 6,079 | 16,702 | 15,562 | 8,018 | 23,580 |
| 2045 | 5,369 | 2,210 | 7,579 | 11,821 | 7,006 | 18,828 | 17,190 | 9,216 | 26,406 |
| 2050 | 5,930 | 2,510 | 8,440 | 13,000 | 7,880 | 20,881 | 18,930 | 10,391 | 29,321 |
| 2055 | 6,572 | 2,847 | 9,419 | 14,123 | 8,773 | 22,896 | 20,695 | 11,620 | 32,315 |
| 2060 | 7,366 | 3,233 | 10,599 | 15,393 | 9,816 | 25,209 | 22,759 | 13,049 | 35,808 |
|
Table 57 Footnotes
|
|||||||||
| Year | Males | Females | Both sexes | ||||||
|---|---|---|---|---|---|---|---|---|---|
| Level of benefit | Level of benefit | Level of benefit | |||||||
| Partial | Full | TotalTable 58 Footnote 1 | Partial | Full | TotalTable 58 Footnote 1 | Partial | Full | TotalTable 58 Footnote 1 | |
| 2022 | 293 | 78 | 372 | 293 | 78 | 372 | 587 | 156 | 743 |
| 2023 | 313 | 83 | 397 | 313 | 83 | 397 | 627 | 166 | 793 |
| 2024 | 329 | 87 | 416 | 329 | 87 | 416 | 659 | 174 | 832 |
| 2025 | 343 | 90 | 433 | 343 | 90 | 433 | 686 | 180 | 866 |
| 2026 | 357 | 93 | 450 | 357 | 93 | 450 | 714 | 186 | 900 |
| 2027 | 371 | 96 | 467 | 371 | 96 | 467 | 741 | 193 | 934 |
| 2028 | 385 | 100 | 484 | 385 | 100 | 484 | 769 | 199 | 968 |
| 2030 | 409 | 105 | 515 | 409 | 105 | 515 | 819 | 211 | 1,030 |
| 2035 | 443 | 116 | 559 | 443 | 116 | 559 | 886 | 231 | 1,117 |
| 2040 | 451 | 120 | 570 | 451 | 120 | 570 | 901 | 239 | 1,141 |
| 2045 | 440 | 118 | 558 | 440 | 118 | 558 | 880 | 235 | 1,116 |
| 2050 | 425 | 115 | 540 | 425 | 115 | 540 | 851 | 229 | 1,080 |
| 2055 | 421 | 113 | 534 | 421 | 113 | 534 | 842 | 225 | 1,067 |
| 2060 | 424 | 115 | 539 | 424 | 115 | 539 | 847 | 231 | 1,078 |
|
Table 58 footnotes
|
|||||||||
| Year | Males | Females | Both sexes | ||||||
|---|---|---|---|---|---|---|---|---|---|
| Level of benefit | Level of benefit | Level of benefit | |||||||
| Partial | Full | TotalTable 59 Footnote 1 | Partial | Full | TotalTable 59 Footnote 1 | Partial | Full | TotalTable 59 Footnote 1 | |
| 2022 | 899 | 914 | 1,813 | 900 | 882 | 1,782 | 1,799 | 1,796 | 3,595 |
| 2023 | 1,012 | 1,019 | 2,031 | 1,014 | 982 | 1,996 | 2,025 | 2,001 | 4,027 |
| 2024 | 1,091 | 1,092 | 2,183 | 1,094 | 1,051 | 2,145 | 2,185 | 2,144 | 4,328 |
| 2025 | 1,162 | 1,159 | 2,322 | 1,166 | 1,115 | 2,282 | 2,328 | 2,275 | 4,603 |
| 2026 | 1,232 | 1,225 | 2,458 | 1,238 | 1,178 | 2,415 | 2,470 | 2,403 | 4,873 |
| 2027 | 1,304 | 1,293 | 2,597 | 1,311 | 1,241 | 2,552 | 2,615 | 2,535 | 5,150 |
| 2028 | 1,379 | 1,364 | 2,743 | 1,388 | 1,308 | 2,695 | 2,767 | 2,671 | 5,438 |
| 2030 | 1,524 | 1,506 | 3,030 | 1,535 | 1,441 | 2,977 | 3,059 | 2,947 | 6,006 |
| 2035 | 1,795 | 1,836 | 3,631 | 1,818 | 1,745 | 3,563 | 3,613 | 3,581 | 7,194 |
| 2040 | 1,992 | 2,107 | 4,099 | 2,027 | 1,989 | 4,016 | 4,019 | 4,097 | 8,115 |
| 2045 | 2,105 | 2,303 | 4,408 | 2,147 | 2,178 | 4,326 | 4,252 | 4,482 | 8,734 |
| 2050 | 2,200 | 2,466 | 4,666 | 2,252 | 2,336 | 4,588 | 4,452 | 4,802 | 9,254 |
| 2055 | 2,336 | 2,687 | 5,023 | 2,399 | 2,552 | 4,951 | 4,735 | 5,239 | 9,974 |
| 2060 | 2,565 | 3,037 | 5,602 | 2,642 | 2,889 | 5,532 | 5,208 | 5,926 | 11,134 |
|
Table 59 footnotes
|
|||||||||
| Year | Males | Females | Both sexes | ||||||
|---|---|---|---|---|---|---|---|---|---|
| Level of benefit | Level of benefit | Level of benefit | |||||||
| Partial | Full | TotalTable 60 Footnote 1 | Partial | Full | TotalTable 60 Footnote 1 | Partial | Full | TotalTable 60 Footnote 1 | |
| 2022 | 79 | 21 | 100 | 28 | 7 | 35 | 107 | 27 | 135 |
| 2023 | 84 | 22 | 106 | 30 | 7 | 36 | 114 | 29 | 143 |
| 2024 | 88 | 23 | 110 | 31 | 7 | 38 | 119 | 30 | 148 |
| 2025 | 91 | 23 | 114 | 32 | 7 | 39 | 123 | 30 | 153 |
| 2026 | 94 | 24 | 117 | 33 | 8 | 40 | 126 | 31 | 157 |
| 2027 | 96 | 24 | 120 | 34 | 8 | 41 | 129 | 32 | 161 |
| 2028 | 98 | 25 | 123 | 34 | 8 | 42 | 133 | 33 | 165 |
| 2030 | 101 | 25 | 126 | 36 | 8 | 44 | 137 | 33 | 170 |
| 2035 | 96 | 24 | 120 | 36 | 8 | 45 | 133 | 32 | 165 |
| 2040 | 93 | 23 | 116 | 37 | 8 | 46 | 130 | 32 | 162 |
| 2045 | 92 | 23 | 115 | 38 | 9 | 46 | 130 | 32 | 161 |
| 2050 | 94 | 23 | 118 | 38 | 9 | 47 | 132 | 32 | 165 |
| 2055 | 96 | 24 | 120 | 38 | 9 | 47 | 134 | 33 | 167 |
| 2060 | 98 | 25 | 123 | 38 | 9 | 48 | 137 | 34 | 171 |
|
Table 60 footnotes
|
|||||||||
| Year | Males | Females | Both sexes | ||||||
|---|---|---|---|---|---|---|---|---|---|
| Level of benefit | Level of benefit | Level of benefit | |||||||
| Partial | Full | TotalTable 61 Footnote 1 | Partial | Full | TotalTable 61 Footnote 1 | Partial | Full | TotalTable 61 Footnote 1 | |
| 2022 | 363 | 273 | 636 | 170 | 90 | 260 | 533 | 362 | 896 |
| 2023 | 403 | 300 | 704 | 187 | 98 | 285 | 590 | 398 | 989 |
| 2024 | 431 | 319 | 750 | 199 | 104 | 303 | 630 | 424 | 1,053 |
| 2025 | 455 | 336 | 791 | 211 | 110 | 321 | 666 | 446 | 1,112 |
| 2026 | 478 | 352 | 829 | 223 | 115 | 338 | 700 | 467 | 1,168 |
| 2027 | 499 | 366 | 865 | 234 | 121 | 355 | 733 | 487 | 1,220 |
| 2028 | 522 | 381 | 903 | 246 | 126 | 372 | 768 | 507 | 1,275 |
| 2030 | 559 | 406 | 965 | 269 | 136 | 405 | 827 | 543 | 1,370 |
| 2035 | 598 | 433 | 1,031 | 314 | 155 | 469 | 912 | 589 | 1,501 |
| 2040 | 642 | 464 | 1,106 | 361 | 175 | 536 | 1,004 | 638 | 1,642 |
| 2045 | 703 | 508 | 1,211 | 405 | 196 | 601 | 1,108 | 704 | 1,811 |
| 2050 | 788 | 574 | 1,363 | 444 | 220 | 664 | 1,233 | 794 | 2,027 |
| 2055 | 878 | 652 | 1,530 | 484 | 245 | 729 | 1,361 | 898 | 2,259 |
| 2060 | 977 | 739 | 1,716 | 536 | 277 | 813 | 1,513 | 1,016 | 2,529 |
|
Table 61 footnotes
|
|||||||||
| Year | Males | Females | Both sexes | ||||||
|---|---|---|---|---|---|---|---|---|---|
| Level of benefit | Level of benefit | Level of benefit | |||||||
| Partial | Full | TotalTable 62 Footnote 1 | Partial | Full | TotalTable 62 Footnote 1 | Partial | Full | TotalTable 62 Footnote 1 | |
| 2022 | 25 | 20 | 45 | 5 | 3 | 8 | 30 | 23 | 53 |
| 2023 | 25 | 21 | 46 | 5 | 3 | 8 | 30 | 24 | 54 |
| 2024 | 26 | 21 | 47 | 5 | 3 | 9 | 31 | 25 | 56 |
| 2025 | 27 | 22 | 48 | 5 | 3 | 9 | 32 | 25 | 57 |
| 2026 | 27 | 22 | 50 | 6 | 3 | 9 | 33 | 26 | 59 |
| 2027 | 28 | 23 | 51 | 6 | 3 | 9 | 34 | 26 | 60 |
| 2028 | 29 | 23 | 52 | 6 | 4 | 9 | 35 | 27 | 61 |
| 2030 | 30 | 24 | 54 | 6 | 4 | 9 | 35 | 28 | 63 |
| 2035 | 28 | 23 | 51 | 6 | 3 | 9 | 34 | 26 | 60 |
| 2040 | 27 | 22 | 49 | 5 | 3 | 8 | 33 | 25 | 57 |
| 2045 | 27 | 22 | 49 | 5 | 3 | 9 | 33 | 25 | 57 |
| 2050 | 30 | 23 | 52 | 6 | 3 | 9 | 36 | 26 | 62 |
| 2055 | 30 | 25 | 55 | 6 | 4 | 10 | 36 | 28 | 64 |
| 2060 | 33 | 26 | 59 | 6 | 4 | 10 | 39 | 30 | 69 |
|
Table 62 footnotes
|
|||||||||
| Year | Males | Females | Both sexes | ||||||
|---|---|---|---|---|---|---|---|---|---|
| Level of benefit | Level of benefit | Level of benefit | |||||||
| Partial | Full | TotalTable 63 Footnote 1 | Partial | Full | TotalTable 63 Footnote 1 | Partial | Full | TotalTable 63 Footnote 1 | |
| 2022 | 99 | 178 | 278 | 19 | 24 | 44 | 119 | 203 | 321 |
| 2023 | 106 | 192 | 298 | 21 | 26 | 47 | 127 | 218 | 345 |
| 2024 | 111 | 202 | 313 | 22 | 28 | 50 | 133 | 230 | 363 |
| 2025 | 117 | 213 | 330 | 23 | 29 | 53 | 141 | 242 | 383 |
| 2026 | 123 | 223 | 346 | 24 | 31 | 55 | 148 | 254 | 401 |
| 2027 | 129 | 233 | 362 | 25 | 32 | 57 | 155 | 264 | 419 |
| 2028 | 135 | 242 | 377 | 27 | 33 | 59 | 162 | 275 | 437 |
| 2030 | 145 | 259 | 404 | 28 | 35 | 63 | 173 | 293 | 466 |
| 2035 | 151 | 272 | 423 | 29 | 35 | 64 | 179 | 307 | 487 |
| 2040 | 158 | 287 | 445 | 30 | 37 | 67 | 188 | 323 | 512 |
| 2045 | 173 | 315 | 489 | 34 | 41 | 75 | 207 | 356 | 564 |
| 2050 | 201 | 369 | 571 | 40 | 48 | 88 | 241 | 417 | 658 |
| 2055 | 232 | 436 | 668 | 45 | 56 | 101 | 277 | 492 | 769 |
| 2060 | 267 | 516 | 783 | 51 | 65 | 116 | 318 | 581 | 899 |
|
Table 63 footnotes
|
|||||||||
| Year | Males | Females | Both sexes | ||||||
|---|---|---|---|---|---|---|---|---|---|
| Level of benefit | Level of benefit | Level of benefit | |||||||
| Partial | Full | TotalTable 64 Footnote 1 | Partial | Full | TotalTable 64 Footnote 1 | Partial | Full | TotalTable 64 Footnote 1 | |
| 2022 | 10 | 1 | 11 | 58 | 3 | 62 | 68 | 4 | 72 |
| 2023 | 10 | 1 | 11 | 59 | 3 | 63 | 69 | 4 | 74 |
| 2024 | 11 | 1 | 11 | 60 | 3 | 63 | 70 | 4 | 75 |
| 2025 | 11 | 1 | 11 | 61 | 4 | 64 | 71 | 4 | 76 |
| 2026 | 11 | 1 | 12 | 61 | 4 | 65 | 72 | 4 | 76 |
| 2027 | 11 | 1 | 12 | 62 | 4 | 65 | 73 | 4 | 77 |
| 2028 | 11 | 1 | 12 | 62 | 4 | 66 | 73 | 4 | 77 |
| 2030 | 11 | 1 | 12 | 62 | 3 | 65 | 73 | 4 | 77 |
| 2035 | 10 | 1 | 11 | 57 | 3 | 60 | 67 | 4 | 71 |
| 2040 | 10 | 1 | 10 | 54 | 3 | 57 | 64 | 4 | 67 |
| 2045 | 10 | 1 | 10 | 53 | 3 | 56 | 63 | 4 | 66 |
| 2050 | 10 | 1 | 11 | 56 | 3 | 59 | 66 | 4 | 70 |
| 2055 | 10 | 1 | 11 | 57 | 3 | 60 | 68 | 4 | 71 |
| 2060 | 11 | 1 | 11 | 61 | 3 | 64 | 71 | 4 | 75 |
|
Table 64 footnotes
|
|||||||||
| Year | Males | Females | Both sexes | ||||||
|---|---|---|---|---|---|---|---|---|---|
| Level of benefit | Level of benefit | Level of benefit | |||||||
| Partial | Full | TotalTable 65 Footnote 1 | Partial | Full | TotalTable 65 Footnote 1 | Partial | Full | TotalTable 65 Footnote 1 | |
| 2022 | 67 | 10 | 77 | 410 | 56 | 466 | 477 | 66 | 543 |
| 2023 | 72 | 11 | 83 | 433 | 59 | 493 | 505 | 70 | 575 |
| 2024 | 75 | 11 | 86 | 449 | 61 | 510 | 524 | 72 | 596 |
| 2025 | 78 | 11 | 89 | 463 | 62 | 526 | 541 | 74 | 615 |
| 2026 | 79 | 12 | 91 | 475 | 63 | 538 | 555 | 75 | 629 |
| 2027 | 81 | 12 | 93 | 485 | 63 | 549 | 566 | 75 | 641 |
| 2028 | 82 | 12 | 94 | 494 | 63 | 557 | 576 | 75 | 651 |
| 2030 | 83 | 12 | 95 | 505 | 62 | 568 | 589 | 74 | 663 |
| 2035 | 80 | 12 | 92 | 494 | 63 | 556 | 574 | 75 | 649 |
| 2040 | 80 | 13 | 93 | 491 | 65 | 557 | 572 | 78 | 650 |
| 2045 | 86 | 15 | 101 | 521 | 71 | 592 | 607 | 86 | 693 |
| 2050 | 95 | 17 | 112 | 581 | 78 | 659 | 676 | 95 | 770 |
| 2055 | 105 | 20 | 125 | 653 | 87 | 741 | 759 | 107 | 866 |
| 2060 | 115 | 22 | 137 | 733 | 96 | 829 | 848 | 118 | 966 |
|
Table 65 footnotes
|
|||||||||
| Year | Males | Females | Both sexes | ||||||
|---|---|---|---|---|---|---|---|---|---|
| Level of benefit | Level of benefit | Level of benefit | |||||||
| Partial | Full | TotalTable 66 Footnote 1 | Partial | Full | TotalTable 66 Footnote 1 | Partial | Full | TotalTable 66 Footnote 1 | |
| 2022 | 8 | - no data | 8 | 43 | 2 | 45 | 51 | 2 | 53 |
| 2023 | 8 | - no data | 8 | 44 | 2 | 46 | 52 | 2 | 54 |
| 2024 | 8 | - no data | 9 | 45 | 2 | 47 | 54 | 2 | 56 |
| 2025 | 8 | - no data | 9 | 47 | 2 | 49 | 55 | 2 | 57 |
| 2026 | 9 | - no data | 9 | 48 | 2 | 50 | 57 | 2 | 59 |
| 2027 | 9 | - no data | 9 | 49 | 2 | 51 | 58 | 2 | 60 |
| 2028 | 9 | - no data | 9 | 50 | 2 | 52 | 59 | 2 | 61 |
| 2030 | 9 | - no data | 10 | 52 | 2 | 54 | 61 | 2 | 63 |
| 2035 | 9 | - no data | 9 | 49 | 2 | 51 | 57 | 2 | 60 |
| 2040 | 8 | - no data | 9 | 47 | 2 | 49 | 55 | 2 | 57 |
| 2045 | 8 | - no data | 9 | 47 | 2 | 49 | 55 | 2 | 57 |
| 2050 | 9 | - no data | 9 | 51 | 2 | 53 | 60 | 2 | 62 |
| 2055 | 9 | - no data | 10 | 53 | 2 | 55 | 62 | 2 | 64 |
| 2060 | 10 | - no data | 10 | 57 | 2 | 59 | 66 | 3 | 69 |
|
Table 66 footnotes
|
|||||||||
| Year | Males | Females | Both sexes | ||||||
|---|---|---|---|---|---|---|---|---|---|
| Level of benefit | Level of benefit | Level of benefit | |||||||
| Partial | Full | TotalTable 67 Footnote 1 | Partial | Full | TotalTable 67 Footnote 1 | Partial | Full | TotalTable 67 Footnote 1 | |
| 2022 | 44 | 4 | 48 | 272 | 22 | 294 | 316 | 26 | 342 |
| 2023 | 48 | 4 | 52 | 291 | 23 | 314 | 339 | 27 | 366 |
| 2024 | 50 | 4 | 55 | 306 | 24 | 330 | 356 | 28 | 385 |
| 2025 | 53 | 5 | 57 | 322 | 25 | 347 | 375 | 29 | 404 |
| 2026 | 55 | 5 | 60 | 337 | 25 | 363 | 392 | 30 | 422 |
| 2027 | 57 | 5 | 62 | 352 | 26 | 378 | 409 | 31 | 439 |
| 2028 | 59 | 5 | 64 | 366 | 27 | 393 | 425 | 31 | 457 |
| 2030 | 62 | 5 | 67 | 390 | 28 | 418 | 452 | 33 | 485 |
| 2035 | 61 | 5 | 66 | 396 | 30 | 426 | 458 | 35 | 493 |
| 2040 | 62 | 5 | 67 | 404 | 32 | 436 | 466 | 37 | 503 |
| 2045 | 67 | 6 | 73 | 437 | 35 | 472 | 504 | 41 | 545 |
| 2050 | 76 | 7 | 83 | 502 | 40 | 543 | 578 | 47 | 625 |
| 2055 | 85 | 8 | 93 | 577 | 48 | 625 | 662 | 56 | 718 |
| 2060 | 95 | 9 | 104 | 663 | 56 | 719 | 758 | 65 | 823 |
|
Table 67 footnotes
|
|||||||||
| Year | Males | Females | Both sexes | ||||||
|---|---|---|---|---|---|---|---|---|---|
| Level of benefit | Level of benefit | Level of benefit | |||||||
| Partial | Full | TotalTable 68 Footnote 1 | Partial | Full | TotalTable 68 Footnote 1 | Partial | Full | TotalTable 68 Footnote 1 | |
| 2022 | 2 | - no data | 3 | 15 | 2 | 17 | 17 | 2 | 19 |
| 2023 | 2 | - no data | 3 | 15 | 2 | 17 | 17 | 2 | 19 |
| 2024 | 2 | - no data | 3 | 15 | 2 | 16 | 17 | 2 | 19 |
| 2025 | 2 | - no data | 3 | 14 | 2 | 16 | 16 | 2 | 18 |
| 2026 | 2 | - no data | 3 | 13 | 2 | 15 | 16 | 2 | 18 |
| 2027 | 2 | - no data | 3 | 13 | 2 | 14 | 15 | 2 | 17 |
| 2028 | 2 | - no data | 2 | 12 | 2 | 14 | 14 | 2 | 16 |
| 2030 | 2 | - no data | 2 | 10 | 1 | 12 | 12 | 2 | 14 |
| 2035 | 2 | - no data | 2 | 8 | 1 | 9 | 10 | 2 | 11 |
| 2040 | 1 | - no data | 2 | 7 | 1 | 8 | 8 | 1 | 10 |
| 2045 | 1 | - no data | 2 | 6 | 1 | 7 | 7 | 1 | 9 |
| 2050 | 1 | - no data | 2 | 5 | 1 | 6 | 7 | 1 | 8 |
| 2055 | 1 | - no data | 2 | 5 | 1 | 6 | 6 | 1 | 7 |
| 2060 | 1 | - no data | 1 | 4 | 1 | 5 | 5 | 1 | 6 |
|
Table 68 footnotes
|
|||||||||
| Year | Males | Females | Both sexes | ||||||
|---|---|---|---|---|---|---|---|---|---|
| Level of benefit | Level of benefit | Level of benefit | |||||||
| Partial | Full | TotalTable 69 Footnote 1 | Partial | Full | TotalTable 69 Footnote 1 | Partial | Full | TotalTable 69 Footnote 1 | |
| 2022 | 23 | 6 | 29 | 138 | 34 | 172 | 161 | 40 | 201 |
| 2023 | 24 | 6 | 31 | 142 | 36 | 179 | 166 | 43 | 209 |
| 2024 | 25 | 7 | 31 | 143 | 37 | 180 | 167 | 44 | 211 |
| 2025 | 25 | 7 | 32 | 141 | 38 | 179 | 166 | 45 | 210 |
| 2026 | 25 | 7 | 32 | 138 | 38 | 175 | 162 | 45 | 207 |
| 2027 | 24 | 7 | 31 | 134 | 37 | 171 | 158 | 44 | 202 |
| 2028 | 23 | 7 | 30 | 128 | 37 | 164 | 151 | 44 | 195 |
| 2030 | 21 | 7 | 28 | 115 | 34 | 149 | 136 | 41 | 177 |
| 2035 | 19 | 7 | 26 | 97 | 33 | 130 | 116 | 40 | 156 |
| 2040 | 18 | 8 | 26 | 88 | 33 | 121 | 106 | 41 | 147 |
| 2045 | 19 | 9 | 28 | 84 | 36 | 120 | 103 | 45 | 148 |
| 2050 | 19 | 10 | 29 | 79 | 37 | 116 | 98 | 47 | 145 |
| 2055 | 20 | 12 | 32 | 76 | 39 | 116 | 96 | 51 | 148 |
| 2060 | 20 | 13 | 33 | 70 | 40 | 110 | 90 | 53 | 143 |
|
Table 69 footnotes
|
|||||||||
Appendix F ― Acknowledgements
Employment and Social Development Canada provided statistics on the Old Age Security program and the Canada Pension Plan.
Statistics Canada provided information on Canadian demographic and economic variables.
The Canadian Human Mortality Database (CHMD) created by the Department of Demography, Université de Montréal was used for the historical mortality data for years up to 2011.
The Canada Life Tables (CLT) created by Statistics Canada were used for the historical mortality data for years 2011 to 2020.
The Canada Revenue Agency provided income tax return information.
The co-operation and able assistance received from the above-mentioned data providers deserve to be acknowledged.
The following people assisted in the preparation of this report:
- Shayne Barrow, ACIA, ASA
- Yu Cheng, ASA
- Christopher Dieterle, FCIA, FSA
- Patrick Dontigny, ASA
- Julie Fortier
- Sari Harrel, FCIA, FSA
- Louis-Marie Pommainville, FCIA, FSA
- Alexandre Régnier, FCIA, FSA
- Jackie Ruan, FCIA, FCAS
Footnotes
- Footnote 1
-
All provinces and territories have subsequently signed a Canada-Wide Early Learning and Child Care Plan (CWELCC) agreement with the federal Government.
- Footnote 2
-
Over the last decade, Canada has been faced with an important increase in accidental drug poisoning deaths and the COVID-19 pandemic has exacerbated the issue.
- Footnote 3
- Footnote 4
-
World Economic Forum, The Global Risks Report 2022, 17th Edition, Insight report (weforum.org) (PDF,5.6 MB)
- Footnote 5
-
Summary for Policymakers (ipcc.ch) (Section 8B.5) (PDF, 3.2 MB)
- Footnote 6
-
AR5 Synthesis Report - Climate Change 2014 (ipcc.ch) (PDF, 13.9 MB)
- Footnote 7
-
IPCC Climate Change 2022, Mitigation of Climate Change(PDF, 65.6 MB)
- Footnote 8
-
The baseline scenarios in publicly available reports can vary and are not defined; therefore, they can't be assessed against the best-estimate assumptions of this report. For illustration purposes only, the differences relative to the baseline scenarios were applied to the best-estimate assumptions of this report.
- Footnote *
-
An active person is one who is in the labour force, meaning the person is either employed or is looking for employment (unemployed). A person is said to be inactive in all other cases.