

Actuarial Report on the Canada Student Financial Assistance Program as at 31 July 2025
ISSN 2564-1026
31 August 2026
Jonathan Wallace
Director General, Canada Student Financial Assistance Program
Employment and Social Development Canada
200 Montcalm, Tower II
Gatineau, Québec
J8Y 3B5
Dear Jonathan Wallace:
As per the business plan for 2026-2027 to 2028-2029, I am pleased to submit the Actuarial Report on the Canada Student Financial Assistance Program (CSFA Program), prepared as at 31 July 2025. This report is prepared for the CSFA Program to support internal accounting requirements as well as your partners’ needs between statutory reports.
Yours sincerely,
Laurence Frappier, FCIA, FSA
Senior Director
Office of the Chief Actuary
Table of contents
- 1 Highlights of the report
- 2 Introduction
- 3 Main assumptions
- 4 Projections
- 5 Actuarial opinion
- Appendix - A Summary of program provisions
- Appendix - B Data
- Appendix - C Assumptions and methodology
- Appendix - D New loans and grants by institution type
- Appendix - E Number of borrowers in the Repayment Assistance Plan
- Appendix - F Defaulted loans portfolio projection
- Appendix - G Sensitivity tests
Index of tables
- Table 1 Demographic assumptions
- Table 2 Economic assumptions
- Table 3 Prepayments and net default rate assumptions
- Table 4 Provision rates
- Table 5 New grants issued
- Table 6 New loans issued
- Table 7 Population and post-secondary enrolment of participating provinces
- Table 8 Loan and/or grant recipients
- Table 9 Student need
- Table 10 Average loan size
- Table 11 Direct loan portfolio
- Table 12 Defaulted loans
- Table 13 Interest on defaulted loans
- Table 14 Guaranteed and risk-shared regimes portfolio
- Table 15 Estimated peak of the aggregate amount of the outstanding loans
- Table 16 Allowance for RAP – principal
- Table 17 Allowance for bad debt – principal
- Table 18 Allowance for bad debt – interest
- Table 19 Summary of expenses
- Table 20 Student related expenses
- Table 21 Government liabilities on outstanding loans
- Table 22 Total revenues
- Table 23 Net annual cost of the program
- Table 24 Direct loans issued and number of students
- Table 25 Direct loans consolidated
- Table 26 Direct loans default portfolio - principal
- Table 27 RAP - principal payments
- Table 28 RAP - interest payments
- Table 29 Demographic assumptions
- Table 30 Labour force participation rates by age group
- Table 31 Full-time post-secondary enrolment rate by labour force status
- Table 32 Inflation assumption
- Table 33 Real wage increase assumption
- Table 34 Borrowing cost
- Table 35 Increase of tuition expenses by province
- Table 36 Administrative expense
- Table 37 RAP-Stage 1 utilization rates
- Table 38 RAP-Stage 2 utilization rates
- Table 39 RAP-D utilization rates
- Table 40 Other RAP assumptions
- Table 41 Short-term adjustments to the default assumptions
- Table 42 Provision rates for bad debt – interest
- Table 43 Number of students receiving a grant by institution type
- Table 44 Grants disbursed by institution type
- Table 45 Number of students receiving a loan by institution type
- Table 46 Loans issued by institution type
- Table 47 Average number of borrowers by RAP category
- Table 48 University defaulted loans
- Table 49 Public college defaulted loans
- Table 50 Private college defaulted loans
- Table 51 Interest on university defaulted loans
- Table 52 Interest on public college defaulted loans
- Table 53 Interest on private college defaulted loans
- Table 54 New loans issued
- Table 55 Estimated peak of the aggregate amount of outstanding loans under scenarios
Index of charts
- Chart 1 Formula for grants issued
- Chart 2 Formula for loans issued
- Chart 3 Evolution of CSFA loans issued through the program
- Chart 4 Distribution of consolidation amounts over 15 years
- Chart 5 Normal payments over 16 years
- Chart 6 Write-off distribution over 30 years
- Chart 7 Default distribution over 14 years
- Chart 8 Recalls and rehabilitations distribution over 14 years
- Chart 9 Recovery distribution over 30 years
1 Highlights of the report
| Current report as at 31 July 2025 | Previous reportTable A Footnote a as at 31 July 2024 | ||
|---|---|---|---|
| Grants issued | Recipients in 2025‑2026 | 650,000 | 602,000 |
| Disbursement in 2025‑2026 | $2,839M | $2,562M | |
| Disbursement as at the end of the projection periodTable A Footnote b | $1,662M | $1,669M | |
| Loans issued | Recipients in 2025‑2026 | 765,000 | 703,000 |
| Disbursement in 2025‑2026 | $6,176M | $5,264M | |
| Disbursement as at the end of the projection period | $5,862M | $5,859M | |
| Direct loan portfolio | Balance as at 31 July 2026 | $32.1B | $30.6B |
| Balance as at the end of the projection period | $48.2B | $41.9B | |
| Academic year in which the limit of $40B is expected to be reached | 2029-2030Table A Footnote c | 2028-2029Table A Footnote d | |
| Repayment Assistance Plan | Number of borrowers in 2025‑2026 | 228,000 | 247,000 |
| Allowance – principal as at 31 July 2026 | $2,090M | $2,168M | |
| Defaults (bad debt) | Long-term net default rate | 7.1% | 6.7% |
| Allowance – principal as at 31 July 2026 | $3,541M | $3,163M | |
| Allowance – interest as at 31 July 2026 | $86M | $76M | |
| Net cost | In 2025‑2026 | $6.0B | $5.4B |
| End of the projection period | $5.5B | $5.3B | |
| Proportion of grants in 2025‑2026 | 47% | 47% | |
Table A Footnotes
| |||
Glossary
- Academic year
The period commencing on August 1 in any year and ending on July 31 in the following year (referred to as loan year in legislation).
- Allowance
The amount that is set aside in the expectation of a cost that will be incurred at a future date. In this report, there is an allowance to cover the future cost of students benefiting from the Repayment Assistance Plan, and two allowances (principal and interest) to cover the risk of future default, net of recoveries, recalls and rehabilitations. Each allowance is determined as at 31 July.
- Provision rates
Allowance divided by the related outstanding portfolio. It represents the portion of the related outstanding portfolio at risk of incurring a future cost.
2 Introduction
Since 1 August 2000, the Canada Student Financial Assistance Program (CSFA Program) is directly financed by the Government. The Office of the Chief Actuary has the mandate to conduct actuarial reviews of the program.
2.1 Purpose
Section 19.1 of the Canada Student Financial Assistance Act defines the mandate given to the Chief Actuary, that is, to prepare a report on the financial assistance provided under this Act no later than three years apart. Such an actuarial report was prepared as at 31 July 2023 and tabled before Parliament on 23 September 2024. The next triennial statutory report will be prepared as at 31 July 2026 and is scheduled to be tabled before Parliament in 2027.
This actuarial report, prepared as at 31 July 2025, is provided to support Employment and Social Development Canada (ESDC) accounting and policy analysis requirements. It also supports ESDC’s partners, the Office of the Auditor General, the Treasury Board Secretariat and the Department of Finance.
The document is intended solely for the above purposes. It was prepared to meet those specific objectives and may not be suitable for any other purposes prior to obtaining approval from the Office of the Chief Actuary.
Please contact us for any questions regarding the proper use of this document.
2.2 Scope
The report includes a forecast of the CSFA Program’s costs and revenues for 25 years (through the academic year 2049‑2050), and shows estimates of:
- the number of students receiving grants or loans under the CSFA Program;
- the amount of new grants or loans issued;
- the portfolio of loans in-study, loans in repayment and loans in default;
- the allowances under the direct loan regime in effect since August 2000; and
- the revenues, the expenses and the net resulting cost.
This valuation report is based on the program provisions as described in Appendix A.
Appendices B and C provide information on data, assumptions and methodologies. Appendix D illustrates the new loans and grants issued by institution type, Appendix E illustrates the number of borrowers in the Repayment Assistance Plan (RAP), and Appendix F illustrates the projection of the defaulted loans portfolios (principal and interest) by institution type. Finally, Appendix G shows sensitivity tests on the amount of new loans issued and its impact on the aggregate amount of outstanding loans in the CSFA Program in comparison to the current outstanding loans limit of $40 billion.
2.3 Recent program changes
This section summarizes recent changes, impacting the projections, that were implemented since the previous report or will be implemented in future years. Unless stated otherwise, these measures have been reflected in the projections presented in this report.
| Implementation date | Description | Source |
|---|---|---|
| August 2024 | Waiving the requirement for mature students, aged 22 years or older, to undergo credit screening in order to qualify for federal student grants and loans for the first time. | Budget 2024 / Approved |
| November 2024 | Expand the reach of the Canada Student Loan forgiveness for doctors and qualifying nurses to more rural communities. | Budget 2023 / Approved |
| 2024-2025 | Modernize the living allowances used when determining financial need, to reflect the recent rental housing costs. | Budget 2024 / Approved |
| December 2025 | Expand the list of professionals eligible for loan forgiveness while working in under-served rural or remote communities. | Budget 2024 / Approved |
| August 2026 | Limit access to the Canada Student Grants for Full-Time Students to students attending public educational institutions and not-for-profit private institutions within Canada. | Budget 2025 / Approved |
| August 2026 | For students studying internationally, limit access to Canada Student Loans and Grants to those enrolled in public or not-for-profit private educational institutions. | Budget 2025 / Approved |
| Start/End date | Description | Source |
|---|---|---|
| 40% increase (compared with the academic year 2019-2020) to the amount for the following Canada Student Grants:
Increase the weekly student loan limit, from $210 to $300. |
|
3 Main assumptions
Several assumptions are needed to determine the future long-term costs of the CSFA Program. All assumptions used in this report are best-estimate assumptions and do not include any margin for adverse deviations. Assumptions used in the previous report were revised to incorporate new experience and recent program changes.
Table 1, Table 2 and Table 3 show a summary of the main assumptions used in this report for the academic year following the report’s valuation date and the last academic year of the projection period, compared with those used in the previous report. A complete description of the assumptions is provided in Appendix C.
| Demographic assumptions | Current report | Previous report | ||
|---|---|---|---|---|
| 2025-2026 | 2049-2050 | 2024-2025 | 2048-2049 | |
| Base population | CPP32ndTable 1 Footnote a | CPP32nd | CPP31stTable 1 Footnote b | CPP31st |
| Enrolment rate (15 to 64) | 7.4 | 6.7 | 7.3 | 7.0 |
| Loan uptake rate | 53.4 | 52.9 | 51.5 | 50.8 |
Table 1 Footnotes
| ||||
| Economic assumption | Current report | Previous report | ||
|---|---|---|---|---|
| 2025-2026 | 2049-2050 | 2024-2025 | 2048-2049 | |
| Inflation | 2.1 | 2.0 | 2.3 | 2.0 |
| Real wage increase | 0.8 | 0.8 | 0.5 | 0.9 |
| Cost of borrowing (government) | 3.4 | 3.7 | 3.1 | 3.7 |
| Tuition increase | 2.7 | 2.2 | 2.9 | 3.8 |
| Prepayments and net default rate assumptions | Current report | Previous report | ||
|---|---|---|---|---|
| 2025-2026 | 2049-2050 | 2024-2025 | 2048-2049 | |
| Prepayments | 7.7 | 10.0 | 8.4 | 13.0 |
| Net default rateTable 3 Footnote a | 7.6 | 7.1 | 6.4 | 6.7 |
Table 3 Footnotes
| ||||
Table 4 shows a summary of the provision rates as at 31 July of the year following the report’s valuation date and the ultimate provision rates used in this report compared with those used in the previous report. A complete description of the provision rates is provided in Appendix C.
| Provision rates | Current report | Previous report | ||
|---|---|---|---|---|
| As at 31 July 2026 | Ultimate | As at 31 July 2025 | Ultimate | |
| RAP - principal | ||||
| In-study | 5.5 | 5.4 | 5.8 | 5.5 |
| In repayment (net of RAP) | 1.5 | 1.2 | 1.7 | 1.8 |
| In RAP (all stages combined) | 30.1 | 31.7 | 31.3 | 30.0 |
| Bad debt – principal | ||||
| In-study | 6.6 | 6.4 | 6.0 | 5.8 |
| In repayment | 4.5 | 3.8 | 3.9 | 4.3 |
| In default | 70.9 | 69.6 | 69.2 | 69.0 |
| Bad debt – interest | ||||
| In default | 68.1 | N/ANot applicable | 66.2 | N/ANot applicable |
4 Projections
This section presents projections of the CSFA Program’s various components required to determine the forecasts of the total net cost. First, the amounts of new loans and grants issued are projected. Then, the portfolios for the three types of regimes (guaranteed, risk-shared and direct loan regimes) are projected and the sub-portfolios for the direct loan regime are used to determine the projection of allowances under the same regime. Finally, total expenses and total revenues are projected separately to determine the resulting total net costs. All steps involved in these forecasts are shown in this section.
4.1 Total new grants and loans
The projection of the total amount of new grants issued under the CSFA Program depends on many factors as illustrated by the following formula:
Chart 1 Formula for grants issued
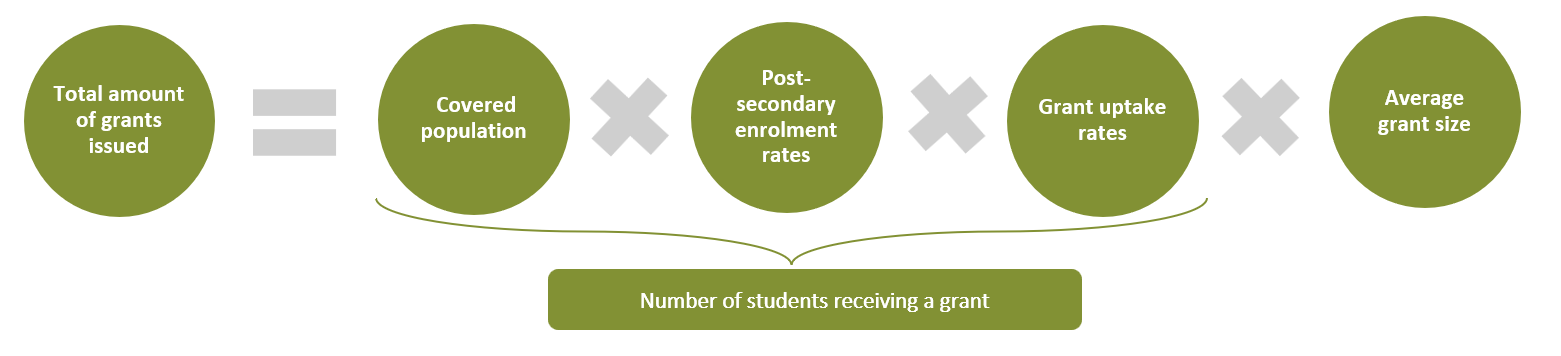
Chart 1 - Text version
The “Total amount of grants issued” is equal to the “Number of students receiving a grant” times the “Average grant size”. The “Number of students receiving a grant” is equal to the product of the “Covered population”, the “Post-secondary enrolment rates” and the “Grant uptake rates”.
Table 5 presents the projection of new grants issued. This projection of the amount of new grants issued, along with the associated projection of students, is broken down by institution type in Appendix D.
| Academic year | Covered population (ages 15 to 64) (thousands) (1) | Enrolment rates (%) (2) | Grant uptake rate (%) (3) | Students in CSFA receiving a grant (thousands) (4) = (1) * (2) * (3) | Average grant ($) (5) | New grants issued ($ millions) (4) * (5) |
|---|---|---|---|---|---|---|
| 2024-2025 | 19,186 | 7.3 | 43.9 | 617 | 4,335 | 2,673 |
| 2025-2026 | 19,302 | 7.4 | 45.4 | 650 | 4,367 | 2,839 |
| 2026-2027 | 19,404 | 7.3 | 43.0 | 612 | 4,219 | 2,583 |
| 2027-2028 | 19,502 | 7.3 | 42.6 | 607 | 3,027 | 1,839 |
| 2028-2029 | 19,593 | 7.3 | 42.3 | 603 | 3,027 | 1,824 |
| 2029-2030 | 19,689 | 7.2 | 42.0 | 597 | 3,028 | 1,808 |
| 2030-2031 | 19,802 | 7.2 | 41.7 | 592 | 3,030 | 1,793 |
| 2031-2032 | 19,940 | 7.2 | 41.4 | 591 | 3,031 | 1,792 |
| 2032-2033 | 20,094 | 7.2 | 41.0 | 590 | 3,034 | 1,789 |
| 2033-2034 | 20,243 | 7.1 | 40.5 | 584 | 3,046 | 1,780 |
| 2034-2035 | 20,383 | 7.1 | 40.1 | 579 | 3,055 | 1,768 |
| 2035-2036 | 20,515 | 7.0 | 39.7 | 573 | 3,067 | 1,756 |
| 2036-2037 | 20,639 | 7.0 | 39.2 | 568 | 3,081 | 1,749 |
| 2037-2038 | 20,780 | 7.0 | 38.8 | 563 | 3,092 | 1,740 |
| 2038-2039 | 20,919 | 6.9 | 38.4 | 556 | 3,105 | 1,727 |
| 2039-2040 | 21,069 | 6.9 | 38.0 | 551 | 3,114 | 1,716 |
| 2040-2041 | 21,221 | 6.8 | 37.7 | 546 | 3,121 | 1,704 |
| 2041-2042 | 21,379 | 6.8 | 37.4 | 541 | 3,126 | 1,692 |
| 2042-2043 | 21,538 | 6.7 | 37.1 | 537 | 3,130 | 1,682 |
| 2043-2044 | 21,697 | 6.7 | 36.8 | 533 | 3,134 | 1,672 |
| 2044-2045 | 21,851 | 6.6 | 36.5 | 531 | 3,138 | 1,665 |
| 2045-2046 | 21,995 | 6.6 | 36.3 | 529 | 3,140 | 1,662 |
| 2046-2047 | 22,130 | 6.6 | 36.0 | 528 | 3,143 | 1,660 |
| 2047-2048 | 22,260 | 6.6 | 35.7 | 527 | 3,148 | 1,659 |
| 2048-2049 | 22,381 | 6.7 | 35.3 | 527 | 3,154 | 1,662 |
| 2049-2050 | 22,495 | 6.7 | 35.0 | 526 | 3,160 | 1,662 |
The average grant amount is higher over the first three academic years due to the temporary increase in the maximum amount of grants. For academic years 2024‑2025 to 2026‑2027, the maximum grants are increased by 40% (compared with the academic year 2019-2020). Additionally, the new limitations on grant eligibility outlined in Section 2.3 are expected to reduce the grants issued starting in academic year 2026–2027. The number of students receiving a grant is expected to decrease slightly over the projection period as less students become eligible as described in Appendix C.
The following formula is used for the projection of the total amount of new loans issued under the CSFA Program:
Chart 2 Formula for loans issued
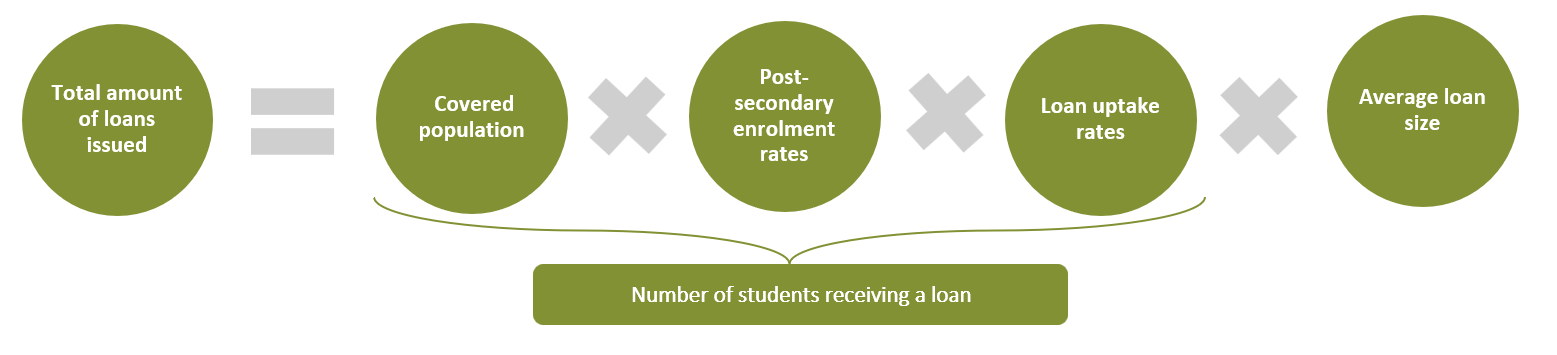
Chart 2 - Text version
The “Total amount of loans issued” is equal to the “Number of students receiving a loan” times the “Average loan size”. The “Number of students receiving a loan” is equal to the product of the “Covered population”, the “Post-secondary enrolment rates” and the “Loan uptake rates”.
Table 6 presents the projection of new loans issued. This projection of the amount of new loans issued, along with the associated projection of students, is broken down by institution type in Appendix D.
| Academic year | Covered population (ages 15 to 64) (thousands) (1) | Enrolment rates (%) (2) | Loan uptake rate (%) (3) | Students in CSFA receiving a loan (thousands) (4) = (1) * (2) * (3) | Average loan ($) (5) | New loans issued ($ millions) (4) * (5) |
|---|---|---|---|---|---|---|
| 2024-2025 | 19,186 | 7.3 | 50.6 | 710 | 7,839 | 5,567 |
| 2025-2026 | 19,302 | 7.4 | 53.4 | 765 | 8,072 | 6,176 |
| 2026-2027 | 19,404 | 7.3 | 53.7 | 765 | 8,285 | 6,334 |
| 2027-2028 | 19,502 | 7.3 | 52.5 | 748 | 6,803 | 5,089 |
| 2028-2029 | 19,593 | 7.3 | 52.6 | 748 | 6,848 | 5,126 |
| 2029-2030 | 19,689 | 7.2 | 52.6 | 748 | 6,892 | 5,156 |
| 2030-2031 | 19,802 | 7.2 | 52.7 | 748 | 6,935 | 5,190 |
| 2031-2032 | 19,940 | 7.2 | 52.7 | 754 | 6,976 | 5,259 |
| 2032-2033 | 20,094 | 7.2 | 52.7 | 758 | 7,017 | 5,318 |
| 2033-2034 | 20,243 | 7.1 | 52.7 | 760 | 7,053 | 5,359 |
| 2034-2035 | 20,383 | 7.1 | 52.7 | 761 | 7,089 | 5,392 |
| 2035-2036 | 20,515 | 7.0 | 52.7 | 761 | 7,124 | 5,421 |
| 2036-2037 | 20,639 | 7.0 | 52.7 | 763 | 7,154 | 5,462 |
| 2037-2038 | 20,780 | 7.0 | 52.8 | 765 | 7,181 | 5,495 |
| 2038-2039 | 20,919 | 6.9 | 52.8 | 765 | 7,203 | 5,510 |
| 2039-2040 | 21,069 | 6.9 | 52.8 | 765 | 7,225 | 5,529 |
| 2040-2041 | 21,221 | 6.8 | 52.8 | 765 | 7,246 | 5,546 |
| 2041-2042 | 21,379 | 6.8 | 52.9 | 766 | 7,268 | 5,564 |
| 2042-2043 | 21,538 | 6.7 | 52.9 | 766 | 7,286 | 5,582 |
| 2043-2044 | 21,697 | 6.7 | 52.9 | 767 | 7,303 | 5,601 |
| 2044-2045 | 21,851 | 6.6 | 53.0 | 769 | 7,319 | 5,631 |
| 2045-2046 | 21,995 | 6.6 | 53.0 | 773 | 7,333 | 5,668 |
| 2046-2047 | 22,130 | 6.6 | 53.0 | 778 | 7,344 | 5,713 |
| 2047-2048 | 22,260 | 6.6 | 53.0 | 783 | 7,357 | 5,758 |
| 2048-2049 | 22,381 | 6.7 | 52.9 | 789 | 7,366 | 5,813 |
| 2049-2050 | 22,495 | 6.7 | 52.9 | 795 | 7,376 | 5,862 |
The average loan amount is higher over the first three academic years due to the temporary increase in the weekly loan limit. Additionally, the grant and loan eligibility limitations described in Section 2.3 take effect in the academic year 2026-2027. Although these limitations reduce eligibility for students studying outside Canada, the impact is more than offset by students enrolled in for‑profit private institutions now receiving more loans in place of grants. In 2049‑2050, projected new loans issued total $5,862 million, which corresponds to an average annual increase of 0.7% following the end of the temporary measures, that is, from the academic year 2027-2028 to the academic year 2049‑2050. This average annual increase can be attributed to two factors: an average annual increase in the number of students in the program of 0.3% and an average annual increase in the average loan size of 0.4%.
4.1.1 Population
Any eligible student enrolled in a designated post-secondary institution (excluding students from Quebec, Nunavut and the Northwest Territories) can apply for a loan under the CSFA program. Students aged 15 to 29 represent the largest segment of the student population and are used for illustrative purposes thereafter. As shown in Table 7, the population aged 15 to 29 is expected to increase from 5,181,000 in 2024‑2025 to 5,685,000 in 2049‑2050, or 0.4% per year.
4.1.2 Post-secondary enrolment
Table 7 shows the evolution of the number of eligible students (age group 15 to 29, age group 30 to 64 and total) enrolled full‑time in a post-secondary institution for the covered population.
| Academic year | Covered population (ages 15 to 29) (thousands) | Covered population (ages 30 to 64) (thousands) | Students enrolled full-time (ages 15 to 29) (thousands) | Students enrolled full-time (ages 30 to 64) (thousands) | Students enrolled full-time (total) (thousands) | Increase (%) |
|---|---|---|---|---|---|---|
| 2024-2025 | 5,181 | 14,005 | 1,230 | 174 | 1,404 | N/ANot applicable |
| 2025-2026 | 5,183 | 14,120 | 1,239 | 193 | 1,432 | 2.0 |
| 2026-2027 | 5,182 | 14,222 | 1,232 | 194 | 1,425 | −0.5 |
| 2027-2028 | 5,194 | 14,307 | 1,234 | 191 | 1,424 | −0.1 |
| 2028-2029 | 5,218 | 14,375 | 1,236 | 187 | 1,424 | −0.1 |
| 2029-2030 | 5,253 | 14,436 | 1,237 | 184 | 1,421 | −0.2 |
| 2030-2031 | 5,298 | 14,504 | 1,238 | 181 | 1,420 | −0.1 |
| 2031-2032 | 5,361 | 14,579 | 1,249 | 181 | 1,430 | 0.7 |
| 2032-2033 | 5,422 | 14,671 | 1,256 | 182 | 1,438 | 0.5 |
| 2033-2034 | 5,471 | 14,772 | 1,259 | 182 | 1,441 | 0.2 |
| 2034-2035 | 5,507 | 14,876 | 1,260 | 183 | 1,442 | 0.1 |
| 2035-2036 | 5,537 | 14,978 | 1,260 | 183 | 1,443 | 0.0 |
| 2036-2037 | 5,556 | 15,083 | 1,263 | 184 | 1,447 | 0.3 |
| 2037-2038 | 5,569 | 15,211 | 1,264 | 186 | 1,450 | 0.2 |
| 2038-2039 | 5,562 | 15,357 | 1,261 | 188 | 1,449 | −0.1 |
| 2039-2040 | 5,562 | 15,507 | 1,259 | 190 | 1,449 | 0.0 |
| 2040-2041 | 5,569 | 15,652 | 1,257 | 192 | 1,449 | 0.0 |
| 2041-2042 | 5,581 | 15,797 | 1,254 | 194 | 1,448 | −0.1 |
| 2042-2043 | 5,591 | 15,947 | 1,252 | 196 | 1,448 | 0.0 |
| 2043-2044 | 5,602 | 16,095 | 1,251 | 198 | 1,449 | 0.0 |
| 2044-2045 | 5,615 | 16,236 | 1,253 | 200 | 1,453 | 0.3 |
| 2045-2046 | 5,624 | 16,371 | 1,257 | 202 | 1,459 | 0.5 |
| 2046-2047 | 5,633 | 16,497 | 1,265 | 204 | 1,469 | 0.6 |
| 2047-2048 | 5,646 | 16,614 | 1,272 | 206 | 1,478 | 0.6 |
| 2048-2049 | 5,663 | 16,717 | 1,284 | 207 | 1,491 | 0.9 |
| 2049-2050 | 5,685 | 16,810 | 1,293 | 209 | 1,501 | 0.7 |
The total number of enrolled students is expected to increase from its current level of 1,404,000 to 1,501,000 at the end of the projection period. The year-to-year increase fluctuates due to the movement of the covered population between the age groups (15-19, 20-24, 25-29 and 30-64) over the projection period, which impacts the calculated aggregate enrolment. Students aged 15 to 29 represent more than 85% of the total post-secondary enrolment. Overall, the aggregate enrolment rate for students aged 15 to 29 is expected to remain between 22% and 24% over the next 25 years.
4.1.3 Students receiving a loan or a grant
Enrolled students must apply to receive a loan or a grant. The ratio of loan or grant recipients to enrolled students is called the uptake rate. Table 8 shows an increase for the uptake rate between 2024-2025 and 2025-2026 that is based on data known for the partial year. The uptake rate is expected to decrease to 57.8% in 2027-2028. It then slowly increases to the ultimate rate of 58.3% in 2049-2050, which assumes that a part of the increase observed in 2025-2026 will persist in the long-term. There has been a significant increase in the uptake rate in recent years. A likely contributing factor is the permanent elimination of interest accrual as of April 2023, which has increased the attractiveness of CSFA Program loans as a financing tool for post-secondary education. Uptakes may also have been supported by the temporary increase in grants.
This, combined with the increase in students enrolled in post-secondary education, results in 31,000 more students in the program over the projection (from 845,000 students in 2025‑2026 to 876,000 in 2049‑2050).
The number of students in the CSFA receiving a loan is 710,000 for the academic year 2024-2025.
| Academic year | Students enrolled full-time (thousands) | Uptake rateTable 8 Footnote a (%) | Students in CSFA receiving a loan and/or a grant (thousands) | Increase (%) | Students in CSFA receiving a loan (thousands) | Students in CSFA receiving a grant (thousands) |
|---|---|---|---|---|---|---|
| 2024-2025 | 1,404 | 55.5 | 779 | N/ANot applicable | 710 | 617 |
| 2025-2026 | 1,432 | 59.0 | 845 | 8.4 | 765 | 650 |
| 2026-2027 | 1,425 | 59.2 | 844 | −0.1 | 765 | 612 |
| 2027-2028 | 1,424 | 57.8 | 824 | −2.4 | 748 | 607 |
| 2028-2029 | 1,424 | 57.9 | 824 | 0.1 | 748 | 603 |
| 2029-2030 | 1,421 | 58.0 | 824 | 0.0 | 748 | 597 |
| 2030-2031 | 1,420 | 58.1 | 824 | 0.0 | 748 | 592 |
| 2031-2032 | 1,430 | 58.0 | 830 | 0.7 | 754 | 591 |
| 2032-2033 | 1,438 | 58.0 | 835 | 0.6 | 758 | 590 |
| 2033-2034 | 1,441 | 58.1 | 837 | 0.3 | 760 | 584 |
| 2034-2035 | 1,442 | 58.1 | 838 | 0.1 | 761 | 579 |
| 2035-2036 | 1,443 | 58.1 | 838 | 0.1 | 761 | 573 |
| 2036-2037 | 1,447 | 58.1 | 841 | 0.3 | 763 | 568 |
| 2037-2038 | 1,450 | 58.1 | 843 | 0.2 | 765 | 563 |
| 2038-2039 | 1,449 | 58.1 | 842 | 0.0 | 765 | 556 |
| 2039-2040 | 1,449 | 58.2 | 843 | 0.0 | 765 | 551 |
| 2040-2041 | 1,449 | 58.2 | 843 | 0.0 | 765 | 546 |
| 2041-2042 | 1,448 | 58.2 | 843 | 0.0 | 766 | 541 |
| 2042-2043 | 1,448 | 58.3 | 844 | 0.1 | 766 | 537 |
| 2043-2044 | 1,449 | 58.3 | 845 | 0.1 | 767 | 533 |
| 2044-2045 | 1,453 | 58.3 | 847 | 0.3 | 769 | 531 |
| 2045-2046 | 1,459 | 58.3 | 851 | 0.5 | 773 | 529 |
| 2046-2047 | 1,469 | 58.3 | 857 | 0.6 | 778 | 528 |
| 2047-2048 | 1,478 | 58.3 | 862 | 0.6 | 783 | 527 |
| 2048-2049 | 1,491 | 58.3 | 869 | 0.8 | 789 | 527 |
| 2049-2050 | 1,501 | 58.3 | 876 | 0.7 | 795 | 526 |
Table 8 Footnotes
| ||||||
4.1.4 Average loan size
The amount of student loan depends on the expected need of the student. Table 9 summarizes the main elements of the student need calculation. All students who receive a loan or a grant are included. The student net need in Table 9 is then determined as a percentage of the student need less admissible grants.
| Academic year | Resources (1) | Tuition (2) | Other expenses (3) | Total expenses (4) = (2) + (3) | Average student need (5) = (4) − (1) | Average grant for net need calculation (6) | CSFA average student net need (7) = (5) * 60% − (6) |
|---|---|---|---|---|---|---|---|
| 2024-2025 | 3,200 | 10,500 | 18,400 | 28,900 | 25,700 | 3,500 | 12,000 |
| 2025-2026 | 3,400 | 10,800 | 20,200 | 31,000 | 27,600 | 3,400 | 13,200 |
| 2026-2027 | 3,500 | 11,100 | 20,600 | 31,700 | 28,200 | 3,200 | 13,800 |
| 2027-2028 | 3,600 | 11,300 | 21,000 | 32,300 | 28,700 | 2,200 | 15,000 |
| 2028-2029 | 3,600 | 11,600 | 21,400 | 33,000 | 29,300 | 2,200 | 15,400 |
| 2029-2030 | 3,700 | 11,800 | 21,800 | 33,600 | 29,900 | 2,200 | 15,800 |
| 2030-2031 | 3,800 | 12,100 | 22,300 | 34,300 | 30,600 | 2,200 | 16,100 |
| 2031-2032 | 3,900 | 12,400 | 22,700 | 35,100 | 31,200 | 2,200 | 16,600 |
| 2032-2033 | 3,900 | 12,700 | 23,200 | 35,900 | 31,900 | 2,200 | 17,000 |
| 2033-2034 | 4,000 | 13,000 | 23,700 | 36,700 | 32,600 | 2,200 | 17,400 |
| 2034-2035 | 4,100 | 13,300 | 24,200 | 37,500 | 33,400 | 2,100 | 17,900 |
| 2035-2036 | 4,200 | 13,700 | 24,600 | 38,300 | 34,100 | 2,100 | 18,300 |
| 2036-2037 | 4,300 | 14,000 | 25,200 | 39,200 | 34,900 | 2,100 | 18,800 |
| 2037-2038 | 4,400 | 14,400 | 25,700 | 40,100 | 35,700 | 2,100 | 19,300 |
| 2038-2039 | 4,500 | 14,700 | 26,200 | 40,900 | 36,400 | 2,100 | 19,800 |
| 2039-2040 | 4,600 | 15,100 | 26,700 | 41,900 | 37,300 | 2,100 | 20,300 |
| 2040-2041 | 4,700 | 15,500 | 27,300 | 42,800 | 38,100 | 2,100 | 20,800 |
| 2041-2042 | 4,800 | 15,900 | 27,800 | 43,700 | 39,000 | 2,100 | 21,300 |
| 2042-2043 | 4,900 | 16,300 | 28,400 | 44,700 | 39,800 | 2,000 | 21,800 |
| 2043-2044 | 5,000 | 16,700 | 29,000 | 45,700 | 40,700 | 2,000 | 22,400 |
| 2044-2045 | 5,100 | 17,200 | 29,600 | 46,800 | 41,600 | 2,000 | 23,000 |
| 2045-2046 | 5,300 | 17,600 | 30,200 | 47,800 | 42,600 | 2,000 | 23,500 |
| 2046-2047 | 5,400 | 18,100 | 30,800 | 48,900 | 43,500 | 2,000 | 24,100 |
| 2047-2048 | 5,500 | 18,500 | 31,500 | 50,000 | 44,500 | 2,000 | 24,700 |
| 2048-2049 | 5,600 | 19,000 | 32,100 | 51,100 | 45,500 | 2,000 | 25,300 |
| 2049-2050 | 5,700 | 19,500 | 32,800 | 52,300 | 46,500 | 2,000 | 26,000 |
The average grant for the need calculation is strictly used for the purpose of calculating the net need. It is derived from the need assessment data and includes some students with a grant of zero. The real average grant (paid to grant recipients only) in the academic year 2024-2025 is $4,335. The average grant for the first three academic years is higher due to the temporary increase in grants.
As shown in Table 10, the average loan size is calculated as the ratio of new loans issued over the number of students receiving a loan under the CSFA Program. The growth rate of the average loan size is moderated due to the fixed weekly student loan limit of $210, except for academic years 2024-2025 to 2026-2027 where the limit is $300.
Over time, more students have a need that exceeds the loan limit. This is shown in Table 10, where the percentage of students at the loan limit is projected to increase from 69.5% in 2027-2028 to 91.1% in 2049-2050.
| Academic year | New loans issued ($ million) (1) | Increase (%) | Students in CSFA receiving a loan (thousands) (2) | Average loan size ($) (1) / (2) | Increase (%) | % of students at limit (%) |
|---|---|---|---|---|---|---|
| 2024-2025 | 5,567 | N/ANot applicable | 710 | 7,839 | N/ANot applicable | 35.0 |
| 2025-2026 | 6,176 | 10.9 | 765 | 8,072 | 3.0 | 42.4 |
| 2026-2027 | 6,334 | 2.6 | 765 | 8,285 | 2.6 | 52.5 |
| 2027-2028 | 5,089 | −19.7 | 748 | 6,803 | −17.9 | 69.5 |
| 2028-2029 | 5,126 | 0.7 | 748 | 6,848 | 0.7 | 70.4 |
| 2029-2030 | 5,156 | 0.6 | 748 | 6,892 | 0.6 | 71.5 |
| 2030-2031 | 5,190 | 0.7 | 748 | 6,935 | 0.6 | 72.7 |
| 2031-2032 | 5,259 | 1.3 | 754 | 6,976 | 0.6 | 74.1 |
| 2032-2033 | 5,318 | 1.1 | 758 | 7,017 | 0.6 | 75.4 |
| 2033-2034 | 5,359 | 0.8 | 760 | 7,053 | 0.5 | 76.6 |
| 2034-2035 | 5,392 | 0.6 | 761 | 7,089 | 0.5 | 78.0 |
| 2035-2036 | 5,421 | 0.5 | 761 | 7,124 | 0.5 | 79.4 |
| 2036-2037 | 5,462 | 0.7 | 763 | 7,154 | 0.4 | 80.8 |
| 2037-2038 | 5,495 | 0.6 | 765 | 7,181 | 0.4 | 81.9 |
| 2038-2039 | 5,510 | 0.3 | 765 | 7,203 | 0.3 | 83.1 |
| 2039-2040 | 5,529 | 0.4 | 765 | 7,225 | 0.3 | 84.1 |
| 2040-2041 | 5,546 | 0.3 | 765 | 7,246 | 0.3 | 85.0 |
| 2041-2042 | 5,564 | 0.3 | 766 | 7,268 | 0.3 | 85.9 |
| 2042-2043 | 5,582 | 0.3 | 766 | 7,286 | 0.3 | 86.7 |
| 2043-2044 | 5,601 | 0.3 | 767 | 7,303 | 0.2 | 87.4 |
| 2044-2045 | 5,631 | 0.5 | 769 | 7,319 | 0.2 | 88.1 |
| 2045-2046 | 5,668 | 0.7 | 773 | 7,333 | 0.2 | 88.8 |
| 2046-2047 | 5,713 | 0.8 | 778 | 7,344 | 0.2 | 89.4 |
| 2047-2048 | 5,758 | 0.8 | 783 | 7,357 | 0.2 | 90.1 |
| 2048-2049 | 5,813 | 1.0 | 789 | 7,366 | 0.1 | 90.6 |
| 2049-2050 | 5,862 | 0.8 | 795 | 7,376 | 0.1 | 91.1 |
The average loan for the academic years 2024-2025 to 2026-2027 is higher than the following academic years (starting from 2027-2028), despite the temporary increase of grants. This is due to the temporary increase to the weekly student loan limit ($210 to $300). The percentage of students at the limit of 35.0%, 42.4% and 52.5% for the academic years 2024-2025, 2025-2026 and 2026-2027 is also based on a maximum weekly student loan of $300 instead of the standard $210.
4.2 Portfolios
This section presents projections of the portfolio for all three regimes described in Appendix A (guaranteed, risk-shared and direct loan regimes). The amounts for loans in‑study represent loans issued to students who are still in the post‑secondary educational system. Loans in repayment consist of outstanding loans that have already consolidated and were not sent to the Canada Revenue Agency (CRA) for collection (defaulted loans).
4.2.1 Direct loan portfolio
The projection of the direct loan portfolio includes the balance of outstanding loans (in-study and in repayment separately) and the balance of loans in default. The projection of the direct loan portfolio (principal only) is shown in Table 11.
| As at July 31 | Loans in-study | Loans in repayment (excluding RAP) | Loans in RAPTable 11 Footnote a | Defaulted loans | Total |
|---|---|---|---|---|---|
| 2025 | 11,063 | 11,445 | 3,712 | 2,592 | 28,812 |
| 2026 | 12,873 | 12,532 | 3,964 | 2,761 | 32,130 |
| 2027 | 14,458 | 13,789 | 4,237 | 2,918 | 35,402 |
| 2028 | 14,281 | 15,152 | 4,550 | 2,768 | 36,751 |
| 2029 | 14,225 | 16,098 | 4,808 | 2,963 | 38,094 |
| 2030 | 14,261 | 16,848 | 4,997 | 3,142 | 39,248 |
| 2031 | 14,317 | 17,490 | 5,147 | 3,309 | 40,263 |
| 2032 | 14,428 | 18,034 | 5,260 | 3,466 | 41,188 |
| 2033 | 14,560 | 18,503 | 5,348 | 3,601 | 42,012 |
| 2034 | 14,682 | 18,914 | 5,413 | 3,727 | 42,736 |
| 2035 | 14,789 | 19,278 | 5,457 | 3,842 | 43,366 |
| 2036 | 14,886 | 19,588 | 5,492 | 3,945 | 43,911 |
| 2037 | 14,982 | 19,852 | 5,518 | 4,043 | 44,395 |
| 2038 | 15,072 | 20,097 | 5,538 | 4,136 | 44,843 |
| 2039 | 15,142 | 20,308 | 5,556 | 4,221 | 45,227 |
| 2040 | 15,208 | 20,476 | 5,571 | 4,300 | 45,555 |
| 2041 | 15,269 | 20,599 | 5,605 | 4,370 | 45,843 |
| 2042 | 15,329 | 20,701 | 5,637 | 4,433 | 46,100 |
| 2043 | 15,386 | 20,794 | 5,666 | 4,491 | 46,337 |
| 2044 | 15,441 | 20,889 | 5,694 | 4,544 | 46,568 |
| 2045 | 15,505 | 20,983 | 5,719 | 4,594 | 46,801 |
| 2046 | 15,583 | 21,077 | 5,744 | 4,640 | 47,044 |
| 2047 | 15,677 | 21,175 | 5,769 | 4,683 | 47,304 |
| 2048 | 15,780 | 21,279 | 5,795 | 4,724 | 47,578 |
| 2049 | 15,900 | 21,390 | 5,824 | 4,762 | 47,876 |
| 2050 | 16,025 | 21,511 | 5,857 | 4,800 | 48,193 |
Table 11 Footnotes
| |||||
The outstanding direct loans in the in-study portfolio are projected to increase to $12.9 billion as at 31 July 2026 and to $14.5 billion as at 31 July 2027 due to higher loans issued (which is the result of the temporary increased weekly loan limit to $300 being extended in the academic year 2026-2027). The projection of outstanding direct loans in the repayment portfolio assumes that the repayment slowdown observed in 2023–2024 and 2024–2025 persists over the long term, leading to higher projected outstanding loans in repayment (and in total). The outstanding direct loan portfolio is projected to increase from $28.8 billion as at 31 July 2025 to $39.2 billion five years later. By the end of the academic year 2049‑2050, the portfolio is projected to reach $48.2 billion.
The outstanding direct loan portfolio as at 31 July 2025 is retrospectively derived from the experienceFootnote 1 during academic years 2000-2001 to 2024‑2025 as followsFootnote 2:
New loans issued | $67.0 billion |
|---|---|
| Plus the interest accrued during the non-repayment periodTable 11a Footnote a | $1.4 billion |
| Minus repaymentsTable 11a Footnote b | $35.6 billion |
| Minus loans forgiven and debt reductions in repaymentTable 11a Footnote c | $1.9 billion |
| Minus defaulted loans written off | $2.1 billion |
| Outstanding direct loan | $28.8 billion |
Table 11a Footnotes
| |
4.2.2 Defaulted loans portfolio – principal
Table 12 provides the calculation details for the projection of the defaulted loans portfolio (principal only) under the direct loan regime. The projection of the defaulted loans (principal) is broken down by institution type in Appendix F.
| Academic year | Opening balance 1 August (1) | New defaulted loans (2) | Collected loans (3) | Write-offs (4) | Closing balance 31 July (1+2) − (3+4) |
|---|---|---|---|---|---|
| 2024-2025 | 2,526 | 369 | 134 | 169 | 2,592 |
| 2025-2026 | 2,592 | 466 | 132 | 165 | 2,761 |
| 2026-2027 | 2,761 | 488 | 156 | 175 | 2,918 |
| 2027-2028 | 2,918 | 511 | 167 | 495 | 2,768 |
| 2028-2029 | 2,768 | 539 | 180 | 164 | 2,963 |
| 2029-2030 | 2,963 | 543 | 191 | 173 | 3,142 |
| 2030-2031 | 3,142 | 543 | 201 | 175 | 3,309 |
| 2031-2032 | 3,309 | 557 | 209 | 190 | 3,466 |
| 2032-2033 | 3,466 | 568 | 217 | 216 | 3,601 |
| 2033-2034 | 3,601 | 579 | 224 | 230 | 3,727 |
| 2034-2035 | 3,727 | 590 | 231 | 244 | 3,842 |
| 2035-2036 | 3,842 | 597 | 237 | 257 | 3,945 |
| 2036-2037 | 3,945 | 604 | 243 | 264 | 4,043 |
| 2037-2038 | 4,043 | 611 | 248 | 271 | 4,136 |
| 2038-2039 | 4,136 | 617 | 252 | 279 | 4,221 |
| 2039-2040 | 4,221 | 621 | 257 | 286 | 4,300 |
| 2040-2041 | 4,300 | 625 | 260 | 294 | 4,370 |
| 2041-2042 | 4,370 | 627 | 263 | 301 | 4,433 |
| 2042-2043 | 4,433 | 630 | 266 | 305 | 4,491 |
| 2043-2044 | 4,491 | 633 | 269 | 310 | 4,544 |
| 2044-2045 | 4,544 | 635 | 272 | 314 | 4,594 |
| 2045-2046 | 4,594 | 638 | 274 | 319 | 4,640 |
| 2046-2047 | 4,640 | 641 | 276 | 322 | 4,683 |
| 2047-2048 | 4,683 | 644 | 278 | 325 | 4,724 |
| 2048-2049 | 4,724 | 648 | 280 | 329 | 4,762 |
| 2049-2050 | 4,762 | 651 | 282 | 332 | 4,800 |
As shown in Table 12, an amount of $169 million was written off in 2024‑2025. The corresponding amount in 2025‑2026 is $165 million and includes all the non‑recoverable loans that were identified and proposed for write-off by ESDC and CRA between July 2024 and June 2025. These write-offs were approved on 26 March 2026, via Royal Assent of Bill C-23 (Appropriation Act No. 4, 2025-26). The decision to write off particular loans is part of a multi-step process inevitably resulting in some volatility in the actual amount written off from year to year.
There are ongoing initiatives to write off a portion of defaulted accounts related to bankruptcies. These initiatives are reflected in the expected write-offs for year 2027-2028. Additionally, anticipated operational efficiencies within ESDC is expected to enable the timely write-off of defaulted accounts associated with bankruptcies, leading to an increase in annual bankruptcy-related write-offs beginning in fiscal year 2028-2029Footnote 3. This change is expected to affect the timing of the write-offs and will be incorporated into future projections as experience emerges.
4.2.3 Defaulted loans portfolio – interest
The projection of the balance of interest on defaulted loans is presented in Table 13. The projection of the defaulted loans (interest) is broken down by institution type in Appendix F.
| Academic year | Opening balance 1 August (1) | Interest transferred in default (2) | Interest accrued (3) | Interest collected (4) | Write-offs (5) | Closing balance 31 July (1+2+3) − (4+5) |
|---|---|---|---|---|---|---|
| 2024-2025 | 182 | −3 | 12 | 13 | 25 | 153 |
| 2025-2026 | 153 | -no data | -no data | 10 | 17 | 126 |
| 2026-2027 | 126 | -no data | -no data | 8 | 13 | 104 |
| 2027-2028 | 104 | -no data | -no data | 6 | 12 | 86 |
| 2028-2029 | 86 | -no data | -no data | 4 | 11 | 71 |
| 2029-2030 | 71 | -no data | -no data | 4 | 6 | 61 |
| 2030-2031 | 61 | -no data | -no data | 3 | 5 | 54 |
| 2031-2032 | 54 | -no data | -no data | 3 | 4 | 46 |
| 2032-2033 | 46 | -no data | -no data | 2 | 4 | 40 |
| 2033-2034 | 40 | -no data | -no data | 2 | 4 | 34 |
| 2034-2035 | 34 | -no data | -no data | 2 | 4 | 28 |
| 2035-2036 | 28 | -no data | -no data | 1 | 3 | 24 |
| 2036-2037 | 24 | -no data | -no data | 1 | 3 | 19 |
| 2037-2038 | 19 | -no data | -no data | 1 | 3 | 15 |
| 2038-2039 | 15 | -no data | -no data | 1 | 3 | 11 |
| 2039-2040 | 11 | -no data | -no data | 1 | 2 | 8 |
| 2040-2041 | 8 | -no data | -no data | 0 | 2 | 6 |
| 2041-2042 | 6 | -no data | -no data | 0 | 2 | 4 |
| 2042-2043 | 4 | -no data | -no data | 0 | 1 | 2 |
| 2043-2044 | 2 | -no data | -no data | 0 | 1 | 1 |
| 2044-2045 | 1 | -no data | -no data | 0 | 1 | 1 |
| 2045-2046 | 1 | -no data | -no data | 0 | 0 | 0 |
| 2046-2047+ | -no data | -no data | -no data | -no data | -no data | -no data |
Interest accrual on student loans has been permanently eliminated starting on 1 April 2023. However, interest is still accruing in some special cases for certain borrowers in default that have a court judgement. The interest transferred in default can be negative due to expected rehabilitations, recalls and other adjustments that occur during the year.
Table 13 shows that an additional amount of $12 million in interest was accrued during the academic year 2024-2025 on the principal balance of the recoverable defaulted loans portfolio.
In the academic year 2024-2025, $25 million in interest was written off. As shown in Table 13, the balance of interest in default was $182 million at the beginning of the academic year 2024‑2025 and it decreased to $153 million as at 31 July 2025. The balance of interest in default is projected to be fully eliminated by the end of the projection period as interest no longer accrues on loans.
4.2.4 Guaranteed and risk‑shared regimes
Table 14 presents the projections of the guaranteed and risk-shared loans in study, in repayment and in default ownedFootnote 4 by the Government (only the principal is shown). The guaranteed and risk‑shared regimes are gradually being phased out.
| As at July 31 | Loans in study or repayment | Loans in default | Total | |
|---|---|---|---|---|
| Guaranteed and risk-shared | Guaranteed | Risk-shared | ||
| 2025 | 7 | 31 | 19 | 57 |
| 2026 | 4 | 26 | 17 | 47 |
| 2027 | -no data | 21 | 14 | 35 |
| 2028 | -no data | 17 | 11 | 28 |
| 2029 | -no data | 12 | 8 | 20 |
| 2030 | -no data | 8 | 6 | 14 |
| 2031 | -no data | 3 | 3 | 6 |
| 2032 | -no data | -no data | -no data | -no data |
At the end of the academic year 2024‑2025, the sum of all loans coming from the guaranteed and risk-shared regimes that are owned by the Government amounts to approximately $96Footnote 5 million.
4.2.5 Limit on the aggregate amount of outstanding loans
The Canada Student Financial Assistance Regulations (CSFAR) imposes a limit on the aggregate amount of outstanding loans in the program. The limit is increased from $34 billion to $40 billion in August 2026.
Table 15 presents the projection of the aggregate amount of outstanding loans. It is the sum of:
- Total principal amount of direct loans in study, in repayment and in default;
- Total principal amount of defaulted risk-shared loans returnedFootnote 6 to the Government from financial institutions.
In comparison with Table 11, which show the projection of the loan portfolio at the end of academic years, Table 15 presents the estimated peak of the portfolio during the academic year. Monthly fluctuations throughout the year cause the aggregate amount of loans to be lower both at the beginning and at the end of the academic year. The peak usually occurs in the middle of the academic year and is 2% to 4% higher than the aggregate amount at the end of the academic year.
Table 11 shows an aggregate amount of outstanding direct loans of $28.8 billion as at 31 July 2025. Table 15 shows that the aggregate amount of outstanding direct loans reached $29.2 billion in May 2025 (academic year 2024-2025) and $32.5 billion in February 2026 (academic year 2025-2026).
The projection shows that the new $40 billion limit is expected to be reached during the academic year 2029-2030 if the program’s provisions do not change and assumptions materialize.
| Academic year | Direct loans | Risk-shared loans | Total |
|---|---|---|---|
| 2024-2025 | 29,175 | 21 | 29,196 |
| 2025-2026 | 32,453 | 18 | 32,471 |
| 2026-2027 | 35,503 | 15 | 35,518 |
| 2027-2028 | 37,638 | 12 | 37,650 |
| 2028-2029 | 38,874 | 9 | 38,883 |
| 2029-2030 | 40,149 | 7 | 40,156 |
| 2030-2031 | 41,244 | 4 | 41,248 |
| 2031-2032 | 42,237 | 1 | 42,238 |
| 2032-2033 | 43,139 | 0 | 43,139 |
| 2033-2034 | 43,929 | -no data | 43,929 |
| 2034-2035 | 44,621 | -no data | 44,621 |
| 2035-2036 | 45,223 | -no data | 45,223 |
| 2036-2037 | 45,753 | -no data | 45,753 |
| 2037-2038 | 46,231 | -no data | 46,231 |
| 2038-2039 | 46,656 | -no data | 46,656 |
| 2039-2040 | 47,022 | -no data | 47,022 |
| 2040-2041 | 47,339 | -no data | 47,339 |
| 2041-2042 | 47,621 | -no data | 47,621 |
| 2042-2043 | 47,875 | -no data | 47,875 |
| 2043-2044 | 48,117 | -no data | 48,117 |
| 2044-2045 | 48,359 | -no data | 48,359 |
| 2045-2046 | 48,609 | -no data | 48,609 |
| 2046-2047 | 48,873 | -no data | 48,873 |
| 2047-2048 | 49,153 | -no data | 49,153 |
| 2048-2049 | 49,456 | -no data | 49,456 |
| 2049-2050 | 49,777 | -no data | 49,777 |
4.3 Allowances
This section presents projections of the three allowances under the direct loan regime described in Appendix A. There is an allowance for the RAP (principal) to cover the future cost of students benefiting from this program, and two allowances for bad debt (principal and interest) to cover the risk of future default, net of recoveries, recalls and rehabilitations.
The provision rates used to determine the 2025‑2026 allowance and the ultimate provision rates are presented in Appendix C. The portfolios to which those provision rates apply are presented in Table 11.
The Government sets up a separate allowance for guaranteed and risk-shared loans, which is not included in this report. Expenses related to those loans are presented in Table 20 and Table 21.
4.3.1 Allowance for the Repayment Assistance Plan (RAP)
Table 16 provides the calculation details for the projection of the allowance for the RAP – principal under the direct loan regime.
| Academic year | Allowance 1 August (1) | RAP expenses (2) | Allowance 31 July (3) | Yearly expense (3) - (1-2) |
|---|---|---|---|---|
| 2024-2025 | 2,159 | 182 | 1,999Table 16 Footnote a | 22 |
| 2025-2026 | 1,999 | 184 | 2,090 | 275 |
| 2026-2027 | 2,090 | 190 | 2,250 | 350 |
| 2027-2028 | 2,250 | 196 | 2,332 | 278 |
| 2028-2029 | 2,332 | 201 | 2,409 | 278 |
| 2029-2030 | 2,409 | 207 | 2,482 | 280 |
| 2030-2031 | 2,482 | 216 | 2,548 | 282 |
| 2031-2032 | 2,548 | 226 | 2,607 | 285 |
| 2032-2033 | 2,607 | 238 | 2,656 | 287 |
| 2033-2034 | 2,656 | 249 | 2,696 | 289 |
| 2034-2035 | 2,696 | 258 | 2,729 | 291 |
| 2035-2036 | 2,729 | 265 | 2,756 | 292 |
| 2036-2037 | 2,756 | 270 | 2,779 | 293 |
| 2037-2038 | 2,779 | 275 | 2,798 | 294 |
| 2038-2039 | 2,798 | 279 | 2,810 | 291 |
| 2039-2040 | 2,810 | 281 | 2,820 | 291 |
| 2040-2041 | 2,820 | 283 | 2,835 | 298 |
| 2041-2042 | 2,835 | 285 | 2,850 | 300 |
| 2042-2043 | 2,850 | 286 | 2,864 | 300 |
| 2043-2044 | 2,864 | 288 | 2,878 | 302 |
| 2044-2045 | 2,878 | 290 | 2,891 | 303 |
| 2045-2046 | 2,891 | 292 | 2,905 | 306 |
| 2046-2047 | 2,905 | 293 | 2,920 | 308 |
| 2047-2048 | 2,920 | 295 | 2,935 | 310 |
| 2048-2049 | 2,935 | 296 | 2,952 | 313 |
| 2049-2050 | 2,952 | 298 | 2,970 | 316 |
Table 16 Footnotes
| ||||
The allowance for the RAP – principal is estimated at $1,999 million as at 31 July 2025, which is slightly lower than the $2,051 million projected in the previous report. For the academic year 2024‑2025, the yearly expense for the allowance for RAP – principal is $22 million. The impact from the change in the assumptions is entirely reflected in the 2025-2026 expense. The updated assumptions include a downward adjustment to RAP-Stage 1 and RAP-Stage 2 utilization rates and an upward adjustment to RAP-D utilization rates to reflect the most recent experience. Assumptions for the RAP are provided in Appendix C.
4.3.2 Allowance for bad debt – principal
Table 17 provides the calculation details for the projection of the allowance for bad debt – principal under the direct loan regime.
| Academic year | Allowance 1 August (1) | Write-offs (2) | Allowance 31 July (3) | Yearly expense (3) − (1 − 2) |
|---|---|---|---|---|
| 2024-2025 | 2,743 | 169 | 3,048Table 17 Footnote a | 474 |
| 2025-2026 | 3,048 | 165 | 3,541 | 658 |
| 2026-2027 | 3,541 | 175 | 3,777 | 411 |
| 2027-2028 | 3,777 | 495 | 3,608 | 326 |
| 2028-2029 | 3,608 | 164 | 3,771 | 327 |
| 2029-2030 | 3,771 | 173 | 3,926 | 328 |
| 2030-2031 | 3,926 | 175 | 4,082 | 331 |
| 2031-2032 | 4,082 | 190 | 4,228 | 336 |
| 2032-2033 | 4,228 | 216 | 4,351 | 339 |
| 2033-2034 | 4,351 | 230 | 4,463 | 342 |
| 2034-2035 | 4,463 | 244 | 4,563 | 344 |
| 2035-2036 | 4,563 | 257 | 4,652 | 346 |
| 2036-2037 | 4,652 | 264 | 4,737 | 349 |
| 2037-2038 | 4,737 | 271 | 4,816 | 350 |
| 2038-2039 | 4,816 | 279 | 4,888 | 351 |
| 2039-2040 | 4,888 | 286 | 4,955 | 353 |
| 2040-2041 | 4,955 | 294 | 5,015 | 354 |
| 2041-2042 | 5,015 | 301 | 5,069 | 355 |
| 2042-2043 | 5,069 | 305 | 5,120 | 356 |
| 2043-2044 | 5,120 | 310 | 5,168 | 358 |
| 2044-2045 | 5,168 | 314 | 5,213 | 359 |
| 2045-2046 | 5,213 | 319 | 5,254 | 360 |
| 2046-2047 | 5,254 | 322 | 5,295 | 363 |
| 2047-2048 | 5,295 | 325 | 5,335 | 365 |
| 2048-2049 | 5,335 | 329 | 5,375 | 369 |
| 2049-2050 | 5,375 | 332 | 5,415 | 372 |
Table 17 Footnotes
| ||||
The allowance for bad debt – principal is estimated at $3,048 million as at 31 July 2025, which is slightly higher than the $3,017 million projected in the previous report. For the academic year 2024‑2025, the yearly expense for the allowance for bad debt – principal is $474 million. The allowance as at 31 July 2026 reflects updated assumptions, including an increase in the gross default rate and a decrease in recovery rates, based on the most recent experience.
4.3.3 Allowance for bad debt – interest
The projection of the allowance for bad debt – interest under the direct loan regime is presented in Table 18.
| Academic year | Allowance 1 August (1) | Write-offs (2) | Allowance 31 July (3) | Yearly expense (3) − (1−2) |
|---|---|---|---|---|
| 2024-2025 | 117 | 25 | 101Table 18 Footnote a | 9 |
| 2025-2026 | 101 | 17 | 86 | 1 |
| 2026-2027 | 86 | 13 | 72 | -no data |
| 2027-2028 | 72 | 12 | 60 | -no data |
| 2028-2029 | 60 | 11 | 49 | -no data |
| 2029-2030 | 49 | 6 | 43 | -no data |
| 2030-2031 | 43 | 5 | 39 | -no data |
| 2031-2032 | 39 | 4 | 34 | -no data |
| 2032-2033 | 34 | 4 | 30 | -no data |
| 2033-2034 | 30 | 4 | 26 | -no data |
| 2034-2035 | 26 | 4 | 23 | -no data |
| 2035-2036 | 23 | 3 | 19 | -no data |
| 2036-2037 | 19 | 3 | 16 | -no data |
| 2037-2038 | 16 | 3 | 12 | -no data |
| 2038-2039 | 12 | 3 | 9 | -no data |
| 2039-2040 | 9 | 2 | 7 | -no data |
| 2040-2041 | 7 | 2 | 5 | -no data |
| 2041-2042 | 5 | 2 | 3 | -no data |
| 2042-2043 | 3 | 1 | 2 | -no data |
| 2043-2044 | 2 | 1 | 1 | -no data |
| 2044-2045 | 1 | 1 | 1 | -no data |
| 2045-2046 | 1 | 0 | 0 | -no data |
| 2046-2047+ | -no data | -no data | -no data | -no data |
Table 18 Footnotes
| ||||
The allowance for bad debt – interest is estimated at $101 million as at 31 July 2025, which is slightly higher than the $93 million projected in the previous report. For the academic year 2024‑2025, the yearly expense for the allowance for bad debt – interest is $9 million, which mainly corresponds to the expected write-offs from the accrued interest of $12 million, as shown in Table 13.
Starting in 2026-2027, there are no more expected yearly expenses due to the removal of the interest accrual. However, there are allowances for the current outstanding interest balance, which is projected to be gradually written off over the next years. The allowance as at 31 July 2026 reflects updated assumptions.
4.4 Total expenses
As shown in Table 19, and notwithstanding impacts from temporary measures, total expenses associated with the program increase from $5.1 billion in 2028-2029Footnote 7 to $5.5 billion in 2049‑2050. On average, total expenses are projected to increase at an annual rate of 0.4%.
| Academic year | Student related expenses | Government liabilities on outstanding loans | Alternative payments | Administrative expenses | Total | |
|---|---|---|---|---|---|---|
| Fees paid to provinces | General | |||||
| 2024-2025 | 3,552.5 | 536.4 | 938.4 | 44.7 | 108.1 | 5,180.1 |
| 2025-2026 | 4,152.7 | 784.6 | 942.2 | 45.3 | 107.2 | 6,031.9 |
| 2026-2027 | 4,086.4 | 537.8 | 1,155.2 | 45.9 | 108.2 | 5,933.5 |
| 2027-2028 | 3,383.6 | 467.6 | 1,137.0 | 46.5 | 109.5 | 5,144.1 |
| 2028-2029 | 3,426.6 | 482.5 | 986.1 | 47.1 | 111.4 | 5,053.8 |
| 2029-2030 | 3,459.0 | 494.6 | 1,015.2 | 47.7 | 114.6 | 5,131.1 |
| 2030-2031 | 3,489.5 | 500.7 | 1,032.3 | 48.4 | 117.8 | 5,188.6 |
| 2031-2032 | 3,526.7 | 508.8 | 1,046.7 | 49.0 | 121.1 | 5,252.3 |
| 2032-2033 | 3,555.3 | 516.0 | 1,064.3 | 49.7 | 124.5 | 5,309.8 |
| 2033-2034 | 3,574.2 | 522.0 | 1,077.8 | 50.3 | 128.0 | 5,352.2 |
| 2034-2035 | 3,586.8 | 526.6 | 1,085.0 | 51.0 | 131.6 | 5,380.9 |
| 2035-2036 | 3,596.0 | 529.9 | 1,086.8 | 51.7 | 135.4 | 5,399.7 |
| 2036-2037 | 3,607.4 | 533.8 | 1,083.9 | 52.3 | 139.2 | 5,416.7 |
| 2037-2038 | 3,614.9 | 537.4 | 1,080.1 | 53.0 | 143.1 | 5,428.4 |
| 2038-2039 | 3,611.7 | 539.6 | 1,077.1 | 53.7 | 147.1 | 5,429.2 |
| 2039-2040 | 3,611.7 | 541.7 | 1,073.7 | 54.4 | 151.3 | 5,432.9 |
| 2040-2041 | 3,618.0 | 543.9 | 1,071.4 | 55.2 | 155.5 | 5,443.9 |
| 2041-2042 | 3,615.7 | 545.9 | 1,072.1 | 55.9 | 159.9 | 5,449.5 |
| 2042-2043 | 3,614.0 | 548.1 | 1,070.0 | 56.6 | 164.4 | 5,453.0 |
| 2043-2044 | 3,612.9 | 550.2 | 1,065.9 | 57.4 | 169.0 | 5,455.4 |
| 2044-2045 | 3,616.0 | 553.1 | 1,063.0 | 58.1 | 173.8 | 5,464.0 |
| 2045-2046 | 3,622.3 | 555.0 | 1,057.6 | 58.9 | 178.7 | 5,472.5 |
| 2046-2047 | 3,632.0 | 558.9 | 1,049.6 | 59.7 | 183.7 | 5,483.9 |
| 2047-2048 | 3,642.3 | 563.1 | 1,040.5 | 60.5 | 188.9 | 5,495.3 |
| 2048-2049 | 3,667.4 | 568.3 | 1,029.4 | 61.3 | 194.2 | 5,520.6 |
| 2049-2050 | 3,681.2 | 573.0 | 1,021.3 | 62.1 | 199.7 | 5,537.2 |
The larger student related expenses over the first three academic years and the larger alternative payments over the first four academic years are mainly due to the temporary increase of the grants.
4.4.1 Student related expenses
The primary expense of the CSFA Program is the cost of supporting students during their study and repayment periods. The student related expenses are presented in Table 20.
| Academic year | Interest subsidy - before consolidation | Interest subsidy - after consolidation | Allowance for RAP – principal | Canada Student Grants | Total |
|---|---|---|---|---|---|
| 2024-2025 | 358.2 | 498.8 | 22.7 | 2,672.8 | 3,552.5 |
| 2025-2026 | 464.7 | 573.2 | 275.4 | 2,839.3 | 4,152.7 |
| 2026-2027 | 525.8 | 628.5 | 349.0 | 2,583.0 | 4,086.4 |
| 2027-2028 | 550.6 | 716.0 | 278.1 | 1,838.9 | 3,383.6 |
| 2028-2029 | 552.8 | 770.7 | 278.9 | 1,824.2 | 3,426.6 |
| 2029-2030 | 556.0 | 815.5 | 279.9 | 1,807.6 | 3,459.0 |
| 2030-2031 | 561.7 | 853.5 | 281.1 | 1,793.1 | 3,489.5 |
| 2031-2032 | 566.7 | 883.1 | 284.4 | 1,792.5 | 3,526.7 |
| 2032-2033 | 572.0 | 907.2 | 287.2 | 1,788.8 | 3,555.3 |
| 2033-2034 | 577.2 | 927.9 | 289.2 | 1,779.9 | 3,574.2 |
| 2034-2035 | 581.9 | 946.0 | 290.8 | 1,768.1 | 3,586.8 |
| 2035-2036 | 586.0 | 961.6 | 292.2 | 1,756.1 | 3,596.0 |
| 2036-2037 | 590.2 | 975.0 | 293.4 | 1,748.8 | 3,607.4 |
| 2037-2038 | 593.9 | 986.8 | 293.9 | 1,740.2 | 3,614.9 |
| 2038-2039 | 596.9 | 997.2 | 290.5 | 1,727.2 | 3,611.7 |
| 2039-2040 | 599.5 | 1,005.8 | 290.6 | 1,715.8 | 3,611.7 |
| 2040-2041 | 601.9 | 1,013.3 | 298.6 | 1,704.2 | 3,618.0 |
| 2041-2042 | 604.3 | 1,019.7 | 299.6 | 1,692.1 | 3,615.7 |
| 2042-2043 | 606.6 | 1,025.3 | 300.6 | 1,681.6 | 3,614.0 |
| 2043-2044 | 608.7 | 1,030.7 | 301.8 | 1,671.6 | 3,612.9 |
| 2044-2045 | 611.2 | 1,036.0 | 303.5 | 1,665.3 | 3,616.0 |
| 2045-2046 | 614.2 | 1,041.1 | 305.4 | 1,661.6 | 3,622.3 |
| 2046-2047 | 617.7 | 1,046.2 | 307.7 | 1,660.3 | 3,632.0 |
| 2047-2048 | 621.7 | 1,051.4 | 310.1 | 1,659.1 | 3,642.3 |
| 2048-2049 | 626.3 | 1,066.4 | 313.1 | 1,661.6 | 3,667.4 |
| 2049-2050 | 631.2 | 1,072.3 | 315.6 | 1,662.0 | 3,681.2 |
Interest subsidies and RAP are still projected for the risk-shared and guaranteed loans. However, those results were removed from Table 20 since they are negligible. RAP-interest for direct loan is also removed as all projected values are null.
In the academic year 2024‑2025, a total of $2,673 million of Canada Student Grants were disbursed and are expected to remain relatively stable over the next two academic years. Nonetheless, there is a small decrease between 2025-2026 and 2026-2027, mostly due to the limitations on grant eligibility as outlined in Section 2.3.
Canada Student Grants are projected to decrease in 2027-2028 due to the end of the 40% temporary grant increase (compared with the academic year 2019-2020).
4.4.2 Government liabilities on outstanding loans
Another expense for the Government corresponds to the risk that loans will never be repaid. This includes the risk of loan default and the risk of loans being forgiven upon a student’s death or severe permanent disability. Loans forgiven for eligible occupations (family physicians, qualifying nurses, early childhood educators as well as additional health care and social services professionals) practicing in under-served rural or remote communities are also included in Table 21 below.
| Academic year | Direct loan | Risk-shared | Guaranteed | Loans forgiven | Total | |||
|---|---|---|---|---|---|---|---|---|
| Allowance for bad debt | Risk premium, put-backs & refunds to FIs | Claims for defaulted loans | Death of a borrower | Severe permanent disability | Eligible occupations | |||
| Principal | Interest | |||||||
| 2024-2025 | 473.7 | 8.9 | -no data | −0.8 | 14.8 | 8.9 | 30.9 | 536.4 |
| 2025-2026 | 658.3 | 1.4 | -no data | 0.2 | 15.5 | 8.3 | 100.9 | 784.6 |
| 2026-2027 | 411.0 | -no data | -no data | -no data | 17.1 | 9.2 | 100.6 | 537.8 |
| 2027-2028 | 326.5 | -no data | -no data | -no data | 18.7 | 10.1 | 112.3 | 467.6 |
| 2028-2029 | 327.3 | -no data | -no data | -no data | 20.2 | 10.9 | 124.1 | 482.5 |
| 2029-2030 | 329.0 | -no data | -no data | -no data | 21.3 | 11.5 | 132.8 | 494.6 |
| 2030-2031 | 331.2 | -no data | -no data | -no data | 22.2 | 11.9 | 135.4 | 500.7 |
| 2031-2032 | 335.5 | -no data | -no data | -no data | 23.0 | 12.4 | 138.0 | 508.8 |
| 2032-2033 | 339.3 | -no data | -no data | -no data | 23.5 | 12.6 | 140.6 | 516.0 |
| 2033-2034 | 341.9 | -no data | -no data | -no data | 23.9 | 12.9 | 143.2 | 522.0 |
| 2034-2035 | 344.0 | -no data | -no data | -no data | 24.4 | 13.1 | 145.0 | 526.6 |
| 2035-2036 | 345.9 | -no data | -no data | -no data | 24.7 | 13.3 | 146.1 | 529.9 |
| 2036-2037 | 348.5 | -no data | -no data | -no data | 24.9 | 13.4 | 147.0 | 533.8 |
| 2037-2038 | 350.6 | -no data | -no data | -no data | 25.1 | 13.5 | 148.2 | 537.4 |
| 2038-2039 | 351.5 | -no data | -no data | -no data | 25.2 | 13.6 | 149.3 | 539.6 |
| 2039-2040 | 352.8 | -no data | -no data | -no data | 25.4 | 13.7 | 149.9 | 541.7 |
| 2040-2041 | 353.9 | -no data | -no data | -no data | 25.5 | 13.7 | 150.7 | 543.9 |
| 2041-2042 | 355.0 | -no data | -no data | -no data | 25.6 | 13.8 | 151.5 | 545.9 |
| 2042-2043 | 356.2 | -no data | -no data | -no data | 25.8 | 13.9 | 152.2 | 548.1 |
| 2043-2044 | 357.3 | -no data | -no data | -no data | 26.0 | 14.0 | 153.0 | 550.2 |
| 2044-2045 | 359.3 | -no data | -no data | -no data | 26.0 | 14.0 | 153.7 | 553.1 |
| 2045-2046 | 360.1 | -no data | -no data | -no data | 26.2 | 14.1 | 154.7 | 555.0 |
| 2046-2047 | 362.6 | -no data | -no data | -no data | 26.3 | 14.1 | 155.9 | 558.9 |
| 2047-2048 | 365.3 | -no data | -no data | -no data | 26.4 | 14.2 | 157.2 | 563.1 |
| 2048-2049 | 368.9 | -no data | -no data | -no data | 26.5 | 14.3 | 158.5 | 568.3 |
| 2049-2050 | 371.9 | -no data | -no data | -no data | 26.7 | 14.4 | 160.1 | 573.0 |
The increase in loans forgiven is due to the increase in the maximum amount of forgivable loans for doctors and qualifying nurses, the expansion of the program to more rural communities and the expansion of the eligible occupations to early childhood educators as well as to more health care and social services professionals.
4.4.3 Other expenses
Other expenses are composed of alternative payments and administrative expenses (fees paid to participating province and general expenses) and are presented in Table 19. Alternative payments are made directly to Quebec, the Northwest Territories and Nunavut, as they do not participate in the CSFA Program. The calculation of alternative payments is based on expenses and revenues for a given academic year and the payment is accounted for in the following academic year.
The short-term projection of the administrative fees was provided by ESDC. All collection activities on defaulted loans are fulfilled by the CRA and a cost is included in the projected general administrative fees for this purpose.
4.5 Total revenues
With the permanent elimination of interest accrual, revenues for the direct loan regime have nearly been reduced to zero. Only a small share of loans in default still accrues interest. It is expected that these loans will also be reduced to zero in the short-term future.
Under the guaranteed and risk-shared regimes, revenues come from recoveries of principal and interest from defaulted loans owned by the Government.
As shown in Table 22, total revenues are projected to decrease to $0.
| Academic year | Direct loan | Risk-shared | Guaranteed | Total revenues |
|---|---|---|---|---|
| Interest revenues | Principal and interest from recovery | Principal and interest from recovery | ||
| 2024-2025 | 9.2 | 1.0 | 1.8 | 11.9 |
| 2025-2026 | -no data | 0.8 | 2.0 | 2.8 |
| 2026-2027 | -no data | 0.7 | 1.7 | 2.4 |
| 2027-2028 | -no data | 0.6 | 1.4 | 1.9 |
| 2028-2029 | -no data | 0.4 | 1.1 | 1.5 |
| 2029-2030 | -no data | 0.4 | 0.8 | 1.1 |
| 2030-2031 | -no data | 0.3 | 0.5 | 0.7 |
| 2031-2032 | -no data | 0.4 | 0.3 | 0.7 |
| 2032-2033+ | -no data | -no data | -no data | -no data |
4.6 Total net cost
Table 23 shows projected total expenses, total revenues and the total net cost of the program for all three regimes for the projection period. The expenses and revenues shown correspond to values presented earlier in this report.
| Academic year | Total expenses | Total revenues | Total net cost | Increase (%) | Direct loan | Risk-shared & guaranteed |
|---|---|---|---|---|---|---|
| 2024-2025 | 5,180.1 | 11.9 | 5,168.2 | N/ANot applicable | 5,169.9 | −1.8 |
| 2025-2026 | 6,031.9 | 2.8 | 6,029.1 | 16.7 | 6,031.7 | −2.8 |
| 2026-2027 | 5,933.5 | 2.4 | 5,931.1 | −1.6 | 5,933.5 | −2.6 |
| 2027-2028 | 5,144.1 | 1.9 | 5,142.2 | −13.3 | 5,144.1 | −2.2 |
| 2028-2029 | 5,053.8 | 1.5 | 5,052.3 | −1.7 | 5,053.8 | −1.7 |
| 2029-2030 | 5,131.1 | 1.1 | 5,130.0 | 1.5 | 5,131.1 | −1.2 |
| 2030-2031 | 5,188.6 | 0.7 | 5,187.9 | 1.1 | 5,188.6 | −0.7 |
| 2031-2032 | 5,252.3 | 0.7 | 5,251.6 | 1.2 | 5,252.3 | −0.7 |
| 2032-2033 | 5,309.8 | -no data | 5,309.8 | 1.1 | 5,309.8 | -no data |
| 2033-2034 | 5,352.2 | -no data | 5,352.2 | 0.8 | 5,352.2 | -no data |
| 2034-2035 | 5,380.9 | -no data | 5,380.9 | 0.5 | 5,380.9 | -no data |
| 2035-2036 | 5,399.7 | -no data | 5,399.7 | 0.3 | 5,399.7 | -no data |
| 2036-2037 | 5,416.7 | -no data | 5,416.7 | 0.3 | 5,416.7 | -no data |
| 2037-2038 | 5,428.4 | -no data | 5,428.4 | 0.2 | 5,428.4 | -no data |
| 2038-2039 | 5,429.2 | -no data | 5,429.2 | 0.0 | 5,429.2 | -no data |
| 2039-2040 | 5,432.9 | -no data | 5,432.9 | 0.1 | 5,432.9 | -no data |
| 2040-2041 | 5,443.9 | -no data | 5,443.9 | 0.2 | 5,443.9 | -no data |
| 2041-2042 | 5,449.5 | -no data | 5,449.5 | 0.1 | 5,449.5 | -no data |
| 2042-2043 | 5,453.0 | -no data | 5,453.0 | 0.1 | 5,453.0 | -no data |
| 2043-2044 | 5,455.4 | -no data | 5,455.4 | 0.0 | 5,455.4 | -no data |
| 2044-2045 | 5,464.0 | -no data | 5,464.0 | 0.2 | 5,464.0 | -no data |
| 2045-2046 | 5,472.5 | -no data | 5,472.5 | 0.2 | 5,472.5 | -no data |
| 2046-2047 | 5,483.9 | -no data | 5,483.9 | 0.2 | 5,483.9 | -no data |
| 2047-2048 | 5,495.3 | -no data | 5,495.3 | 0.2 | 5,495.3 | -no data |
| 2048-2049 | 5,520.6 | -no data | 5,520.6 | 0.5 | 5,520.6 | -no data |
| 2049-2050 | 5,537.2 | -no data | 5,537.2 | 0.3 | 5,537.2 | -no data |
As shown in Table 23, the initial net annual cost for the direct loan regime is $5.2 billion for the academic year 2024‑2025. The increase in net annual cost between academic years 2024–2025 and 2025–2026 is primarily driven by higher interest subsidies, increased allowance expenses, and a greater volume of grants disbursed. The net cost is projected to increase between the academic year 2028-2029Footnote 8 and the academic year 2049‑2050 from $5.1 billion to $5.5 billion, representing an annual average increase of 0.4%.
The net costs shown in Table 23 include the amount of grants disbursed, representing 52% of the net cost for the academic year 2024-2025. Moreover, the net costs also include yearly expenses to account for allowances that recognize in advance the risk of future losses associated with student loans.
5 Actuarial opinion
In our opinion, considering that this Actuarial Report on the Canada Student Financial Assistance Program was prepared pursuant to the Canada Student Financial Assistance Act:
- the data on which this report is based are sufficient and reliable for the purposes of this report;
- the assumptions used are, individually and in aggregate, reasonable and appropriate for the purposes of this report; and
- the methods employed are appropriate for the purposes of this report.
This report has been prepared, and our opinion given, in accordance with accepted actuarial practice in Canada, in particular, the General Standards of the Standards of Practice of the Canadian Institute of Actuaries.
Subsequent events have occurred after the valuation date. These include upcoming permanent and temporary changes to the program, as described in Section 2.3, initiatives to write off a portion of defaulted accounts related to bankruptcies, the introduction of a process to facilitate the timely write-off of defaulted accounts associated with bankruptcies, and an increase in the aggregate outstanding loan limit from $34 billion to $40 billion. To provide projections based on up-to-date information, these changes have been reflected in our report, with the exception of the timely write-off of defaulted accounts associated with bankruptcies. This change is expected to affect the timing of the write-offs and will be incorporated into future projections as experience emerges.
Laurence Frappier, FCIA, FSA
Senior Director
Marie-Pier Bernier, FCIA, FSA
Thierry Truong, FCIA, FSA
Ottawa, Canada
31 August 2026
Appendix - A Summary of program provisions
The Canada Student Financial Assistance Program (CSFA Program) came into force on 28 July 1964 to provide Canadians equal opportunity to study beyond the secondary level and to encourage successful and timely completion of post-secondary education. The CSFA Program is meant to supplement resources available to students from their own earnings, their families’, and other student awards.
Historically, two successive acts were established to assist qualifying students. The Canada Student Loans Act applied to academic years preceding August 1995 while the subsequent Canada Student Financial Assistance Act applies to academic years starting after July 1995.
The population covered by the CSFA Program is the Canadian population excluding non-permanent residents as well as the non-participating province and territories of Québec, Northwest Territories and Nunavut.
A.1 Eligibility criteria
In order to be eligible for financial assistance, a student must be a Canadian citizen, permanent resident, protected person within the meaning of the Immigration and Refugee Protection Act or a person registered as an Indian under the Indian Act, and must demonstrate the need for financial assistance, which is determined by the Need Assessment Process under the program. Budget 2025 limits the accessFootnote 9 to the Canada Student Loans and Grants for students studying internationally to students attending public educational institutions and not-for-profit private institutions. The assessed need is the difference between the student’s costs and the student’s resources. A student must also fulfill a series of criteria (scholastic standard and financial) to be considered for financial assistance. Each year, upon application with their province of residence, financial assistance is available to full‑time students regardless of age, and since 1983, financial assistance is also available to part-time students.
A multi-year student financial assistance agreement was implemented in all jurisdictions starting in the academic year 2013‑2014. It is referred to as the Master Student Financial Assistance Agreement (MSFAA) and replaces the former single‑year student loan agreement. By signing an MSFAA, a borrower agrees to repayment terms that will apply to their loans when they leave their studies.
Starting in the academic year 2017-2018, the student’s resources definition was modified to consider only the student contribution as well as the parental or spousal contribution, if applicable. The student contribution is comprised of the fixed student contribution, merit-based scholarships, need-based bursaries, and targeted resources.
The fixed student contribution depends on the borrower’s previous year’s gross annual family income, family size and the number of weeks of study. Students with gross family income from the previous year equal to or below the low-income threshold will contribute $1,500 for an 8-month academic year. Students with gross family income from the previous year above the low-income threshold will contribute $1,500 plus an additional 15% of income above the threshold up to a maximum total contribution of $3,000 for an 8-month academic year. The low-income thresholds vary depending on the student’s family size. The previous year’s gross family income is defined by the applicable student category. For independent students and single parent, family income is comprised of the student’s income only. For dependant students, family income is comprised of the student’s parental income only. In the case of a married or common-law student, family income is comprised of the student’s and the spouse’s or partner’s income. Indigenous learners, students with a disability recognized by the CSFA Program, students with dependants and current or former Crown wards are exempted from the fixed student contribution.
The expected contribution from merit-based scholarships and need-based bursaries is equivalent to the combined assessed actual amount less an exemption of $1,800 per academic year.
Targeted resources are those provided to help with specific educational costs and may include funds received from municipal, provincial, or federal governments (e.g., training allowances from the skills portion of Employment Insurance benefits), or from the private sector (e.g., room and board provided by an employer while a full-time student). They are assessed at 100%.
Parents of single dependant students are expected to contribute to their children’s education. The amount of parental contribution depends on family income and size, but do not depend on the living situation of the student.
The spouses and partners of married or common-law students are expected to make a spousal contribution equal to 10% of their gross family income exceeding the low-income thresholds. Spouses and partners at or below the low-income threshold, as well as those who are themselves full-time students, are not expected to make any spousal contribution.
Since the academic year 2023-2024, the credit screening requirement for mature student applicants, aged 22 years or older, applying for Canada Student Grants and loans has been eliminated.
A.1.1 Partnerships
Since the program’s inception in 1964, the Minister entered into an agreement with the participating provinces/territory regarding their powers, duties and functions related to the administration of the program. The participating provinces have their own student financial assistance programs that complement the CSFA Program. On behalf of the Government of Canada, the provinces and territory determine whether students require financial assistance as well as their eligibility for the CSFA Program. Provincial/territorial authorities determine the students’ required financial needs based on the difference between their expected expenses and available resources.
In general, for each academic year, the CSFA Program covers around 60% of the assessed need up to the sum of the maximum grant (for eligible students) and a maximum of $210 per week in student loans. This maximum was temporarily increased to $300 per week for the academic years 2023-2024 to 2025-2026. This temporary increase is extended to the academic year 2026-2027.
The participating provinces and territory complement the CSFA Program by providing additional financial assistance up to established maximum amounts. The amount of money students may borrow depends on their individual circumstances.
The National Student Loans Service Centre (NSLSC) was established on 1 March 2001 and is responsible for the administration of student loans and grants. The NSLSC processes all applicable documentation from loans’ disbursement to their consolidation and repayment for the federal portion of the loans, as well as for the provincial portion of integrated loans. It keeps students informed of all available options to assist in repaying their loans. The NSLSC is run by a private entity contracted by the government.
The type of financial arrangement has changed through time and legislation. The following describes the different arrangements and explains who bears the risk associated with default.
- Guaranteed loan regime: Student loans provided by lenders (financial institutions) under the Canada Student Loans Act prior to August 1995 were fully guaranteed by the Government to the lenders. The Government reimbursed lenders for the outstanding principal, accrued interest and costs in the event of default or death of the borrower. Therefore, the Government bore all the risk involved with guaranteed loans.
- Risk-shared loan regime: Between August 1995 and July 2000, student loans continued to be disbursed, serviced and collected by financial institutions. However, the loans were no longer fully guaranteed by the Government. Instead, the Canada Student Financial Assistance Act permitted the Government to pay financial institutions a risk premium of five per cent of the value of loans that consolidated in each academic year. Under this financial arrangement, the Government was not at risk except for the payment of the risk premium. Financial institutions could also decide to sell a certain amount of defaulted loans and the Government had to pay a put-back fee of five cents on the dollar for these loans. Finally, the agreement provided that part of the recoveries be shared with financial institutions.
- Direct loan regime: The direct loan arrangement came into force, effective 1 August 2000, following the restructuring of the delivery of the program and the amendments made to the Canada Student Financial Assistance Act and Regulations. Under this regime, the Government issues loans directly to students and bears all the risk involved.
The Government of Canada currently has integration agreements in place with six provinces: Ontario (August 2001), Saskatchewan (August 2001), Newfoundland and Labrador (April 2004), New Brunswick (May 2005), British Columbia (August 2011) and Manitoba (July 2022). Students in integrated provinces benefit from having one single loan administered through the NSLSC instead of managing two separate loans (federal and provincial).
A.2 Canada Student Grants
The Canada Student Grants (CSGs), implemented in August 2009, provide non-repayable assistance to targeted groups of students, including students from low- and middle-income families, students with a disability recognized by the CSFA Program and students with children under the age of 12. These grants are not taxable.
The regulated CSGs include:
- CSG-FT: a grant of up to $375 per month of study for full-time university undergraduate or college students with a family income that falls below the maximum threshold (which scales up based on family size). To be eligible, a student’s academic program must be at least two years (60 weeks) in duration.
- CSG-D: a grant of $2,000 per school year for students with a disability recognized by the CSFA Program.
- CSG-DSE: a grant of up to $20,000 per school year to help cover exceptional education-related costs associated with a student’s disability recognized by the CSFA Program.
- CSG-FTDEP: a grant of up to $200 per month of full-time study based on family size and income, for every dependant child under the age of 12.
- CSG-PT: a grant of up to $1,800 per school year for part-time students with a family income that falls below the maximum threshold (which scales up based on family size).
- CSG-PTDEP: a grant of up to $40 per week of study for part-time students with one or two children under 12 years of age and up to $60 per week of study for students with three or more children under 12 years of age, up to a maximum of $1,920 per year. The exact amount payable for each week depends on family size and income.
Grants amounts are stated in the Canada Student Financial Assistance Regulations. The thresholds and phase-out rates for CSG-FT, CSG-FTDEP, CSG-PT and CSG-PTDEP are based on family size and income and are set out in Schedule 4 of the Regulations.
Grants amounts for the CSG-FT, CSG-FTDEP, CSG-D, CSG-PT and CSG-PTDEP were temporarily increased by 40% (compared with the academic year 2019-2020) for the academic years 2023-2024 to 2025-2026. This temporary increase is extended to the academic year 2026-2027.
Budget 2025 limits the access to CSG-FT to students in public institutions and not-for-profit private institutions within Canada.
A.3 Loan benefit
A.3.1 In-study interest subsidy
The CSFA Program provides an interest‑free loan during the borrower’s study period and during the six‑month non-repayment period for both full-time and part-time students. The benefit takes the form of an in‑study interest subsidy. During this period, the Government pays interest (Government’s cost of borrowing) on the loan and no payment on the principal is required.
Since June 2008, members of the Reserve Force who interrupt their program of study to serve on a designated operation are considered full‑time students until the last day of the month in which their service ends and, as such, benefit from an extended in‑study interest‑free period.
A.3.2 Loan consolidation
During the first six months following the end of the study period (six‑month non-repayment period), all loans previously received by a student are added together and consolidated. No payment is required. With the implementation of the MSFAA, the Canada Student Financial Assistance Regulations were amended to remove the regulatory requirement that borrowers sign a consolidation agreement. Repayment terms are part of the MSFAA and a repayment letter is sent to borrowers upon leaving their studies. The letter provides information on their loan balance, repayment options and available repayment assistance measures.
In general, the student’s monthly payment is calculated based on a standard 114‑month repayment period. However, loans with an outstanding balance smaller than $7,000 are amortized over a shorter period of time as per ESDC’s guidelines.
Students must provide the NSLSC with a proof of enrolment for each study period in which they are enrolled even if they are not applying for a new loan. This prevents an automatic consolidation from occurring while they are still in school.
Since October 2020, more flexibility is provided for borrowers who take a temporary leave from their studies for medical or parental reasons, including mental health leaves. Borrowers are eligible for an interest-free and payment-free leave for a maximum period of 18 months.
A.3.3 In repayment interest subsidy
Bill C-14 waived the interest accrual on student loans for fiscal year 2021-2022 and Budget 2021 extended this waiver for one more year, up to 31 March 2023.
The interest accrual was permanently eliminated starting on 1 April 2023.
A.3.4 Repayment Assistance Plan (RAP)
The RAP is designed to make it easier for borrowers to manage their debt by calculating affordable payments ($0 for those under the established minimum income threshold or up to 10%Footnote 10 of family income for those above the established minimum income threshold) based on family income and family size. Therefore, the affordable payment formula ensures no borrower pays more than 10% of their gross income towards their student loan debt. Borrowers are deemed eligible for the RAP for a six‑month period if their affordable payment is less than their required monthly payment. The RAP is composed of two stages to help borrowers fully repay their loan within a maximum of 15 years of leaving school (or 10 years for borrowers with a disability).
At the beginning of the academic year 2016-2017, the RAP income thresholds were increased to ensure that students would not be required to repay their student loan until they earned at least $25,000 per year ($25,000 being the threshold for a single student with no dependants, which scales up based on family size). It was further increased in the academic year 2022-2023 to $40,000 while thresholds for borrowers from larger households were modified to match the Canada Student Grants thresholds. All thresholds also now increase with inflation, every year, on August 1st.
Under Stage 1, the required monthly payment is determined by amortizing a borrower’s outstanding principal amount over a period that ends 120 months after leaving school. The borrower’s monthly affordable payment, if any, goes directly towards the loan principal first, and then the interest, if any, while the Government covers any interest amount not covered by the affordable payment. The principal portion of the loan not covered by the affordable payment is deferred. Stage 1 can last for a maximum of five years in cumulative six‑month periods.
Stage 2 is available to borrowers who continue to experience financial difficulty after Stage 1 has been exhausted and to those whose loan has been in repayment for more than 10 years. Under Stage 2, the required payment is calculated by amortizing the outstanding principal between the start date of Stage 2 and the date corresponding to 15 years after the borrower left school (10 years for borrowers with a disability recognized by the CSFA Program). The Government covers both the required principal amount and the interest amount, if any, not covered by the borrower’s affordable payment such that the student loan is repaid in full within 15 years (10 years for borrowers with a disability recognized by the CSFA Program) of the borrower leaving school.
Since January 2020, the eligibility for loan rehabilitation was expanded after a borrower defaults on their student loan. Effective November 2025, the rehabilitation process was updated to require four payments instead of two, with a minimum total payment amount of $440. Financially vulnerable borrowers in default could access support such as the RAP and begin making affordable payments on their outstanding debt again.
Borrowers with a disability recognized by the CSFA Program who are not eligible for the Severe Permanent Disability Benefit have access to the RAP‑DFootnote 11. Additional expenses related to costs faced by borrowers with a disability recognized by the CSFA Program are taken into account in the income calculation when they apply for RAP-D. Similar to all borrowers in RAP Stage 2, additional student loans or grants are not available under RAP-D until existing loans are paid in full.
A.3.5 Loan forgiveness
The Minister has the authority, upon application and qualification, to forgive a loan in the event of a borrower’s severe permanent disability or death while in school or during the repayment period. Effective 1 August 2009, in order for a borrower’s loan to be forgiven due to a permanent disability, the Minister must be satisfied that the borrower’s condition respects the definition of “severe permanent disability”, is unable to repay the student loan and will never be able to repay it.
Effective 1 January 2013, a portion of student loans allocated to family physicians (including residents in family medicine programs), registered nurses, registered practical nurses, licensed practical nurses, registered psychiatric nurses and nurse practitioners (together referred to as “qualifying nurses” throughout the report) who work during a year in an under-served rural or remote community can be forgiven for that year. Qualifying participants who started their current employment in under-served communities on or after 1 July 2011 and who complete a year of work (starting on or after 1 April 2012) are eligible for loan forgiveness.
Prior to November 2023, qualifying family physicians were eligible for up to a maximum of $40,000 over five years. Qualifying nurses were eligible for up to a maximum of $20,000 over five years.
Starting in November 2023, the maximum amount of forgivable Canada Student Loans increased by 50% for doctors and nurses. As a result, qualifying family physicians are eligible for up to $60,000 over five years while nurses are eligible for up to $30,000 over five years.
Starting in November 2024, the Canada Student Loan Forgiveness for doctors and qualifying nurses was expanded to more rural communities.
Starting in December 2025, the following professionals are eligible for the loan forgiveness program: dentist, dental hygienist, early childhood educator, midwife, personal support worker, pharmacist, physiotherapist, psychologist, social worker and teacher.
Appendix - B Data
The input data required with respect to direct loans were extracted from data files provided by Employment and Social Development Canada (ESDC).
B.1 Direct loans issued
Table 24 presents information extracted from ESDC’s data files on the amount of direct loans issued and the number of students for academic years 2000-2001 to 2024‑2025. According to the Monthly Financial Information Schedule (MFIS), the total amount of loans issued in 2024‑2025 was $5,567 million, which is identical to the value calculated using the data file. These data were found to be complete.
| Academic year | Amount of loans issued ($ million) | Number of students |
|---|---|---|
| 2000-2001 | 1,573 | 343,746 |
| 2001-2002 | 1,507 | 328,671 |
| 2002-2003 | 1,549 | 331,042 |
| 2003-2004 | 1,648 | 342,264 |
| 2004-2005 | 1,633 | 339,204 |
| 2005-2006 | 1,936 | 345,549 |
| 2006-2007 | 1,916 | 344,214 |
| 2007-2008 | 2,004 | 353,548 |
| 2008-2009 | 2,071 | 366,145 |
| 2009-2010 | 2,088 | 403,566 |
| 2010-2011 | 2,225 | 427,054 |
| 2011-2012 | 2,412 | 450,246 |
| 2012-2013 | 2,583 | 477,394 |
| 2013-2014 | 2,721 | 497,636 |
| 2014-2015 | 2,723 | 495,297 |
| 2015-2016 | 2,722 | 496,998 |
| 2016-2017 | 2,627 | 497,045 |
| 2017-2018 | 3,352 | 592,091 |
| 2018-2019 | 3,575 | 625,135 |
| 2019-2020 | 3,449 | 607,861 |
| 2020-2021 | 3,969 | 576,463 |
| 2021-2022 | 2,940 | 558,356 |
| 2022-2023 | 3,137 | 565,848 |
| 2023-2024 | 4,839 | 649,393 |
| 2024-2025 | 5,567 | 710,110 |
B.2 Direct loans consolidated
Table 25 presents the amount of consolidated direct loans, the amounts that were reversed due to students returning to school and the accrued interest during the six-month non-repayment period according to the MFIS. These data closely match consolidations from individual data for the most recent years. It was observed that reversals (students returning to school) generally occur in the same academic year as consolidation or the year after.
| Academic year | Consolidations (1) | ReversalTable 25 Footnote a (2) | Interest accrued (3) | Total amount consolidated (1) − (2) + (3) |
|---|---|---|---|---|
| 2000-2001 | 65.7 | 4.1 | 0.7 | 62.2 |
| 2001-2002 | 901.0 | 154.9 | 26.0 | 772.2 |
| 2002-2003 | 1,211.9 | 262.7 | 39.6 | 988.8 |
| 2003-2004 | 1,434.3 | 326.6 | 43.7 | 1,151.4 |
| 2004-2005 | 1,632.6 | 388.4 | 52.6 | 1,296.7 |
| 2005-2006 | 1,720.0 | 435.4 | 61.8 | 1,346.4 |
| 2006-2007 | 1,936.3 | 499.8 | 82.7 | 1,519.3 |
| 2007-2008 | 2,100.8 | 571.8 | 90.4 | 1,619.3 |
| 2008-2009 | 2,187.5 | 638.2 | 74.8 | 1,624.0 |
| 2009-2010 | 2,302.3 | 703.3 | 54.9 | 1,654.0 |
| 2010-2011 | 2,464.8 | 762.0 | 65.3 | 1,768.1 |
| 2011-2012 | 2,580.8 | 799.9 | 72.1 | 1,852.9 |
| 2012-2013 | 2,684.9 | 801.3 | 75.0 | 1,958.6 |
| 2013-2014 | 2,797.6 | 788.3 | 78.8 | 2,088.2 |
| 2014-2015 | 2,909.9 | 797.6 | 82.0 | 2,194.3 |
| 2015-2016 | 3,034.1 | 852.6 | 81.7 | 2,263.2 |
| 2016-2017 | 3,082.9 | 904.2 | 83.6 | 2,262.2 |
| 2017-2018 | 3,072.5 | 963.8 | 88.3 | 2,197.0 |
| 2018-2019 | 3,396.2 | 966.0 | 110.0 | 2,540.2 |
| 2019-2020 | 3,723.7 | 983.5 | 85.7 | 2,825.9 |
| 2020-2021 | 3,905.9 | 1,326.6 | 0.0 | 2,579.3 |
| 2021-2022 | 4,491.4 | 1,130.9 | 0.0 | 3,360.5 |
| 2022-2023 | 4,266.5 | 1,200.1 | 0.0 | 3,066.4 |
| 2023-2024 | 4,148.6 | 1,197.8 | 0.0 | 2,950.8 |
| 2024-2025 | 4,932.4 | 1,287.1 | 0.0 | 3,645.3 |
Table 25 Footnotes
| ||||
B.3 Defaults and recoveries for direct loans
Table 26 shows the main items of the defaulted loans portfolio (principal only). This information is extracted from ESDC’s data files.
- Defaults: amount of loans transferred to the Government in each academic year after nine months without a payment;
- Account adjustments: loans recalled and financial adjustments made by ESDC;
- Rehabilitations: amount of loans rehabilitated under certain criteria;
- Recoveries: payments recovered by the CRA from borrowers in default;
- Write-offs: amounts approved for write-off when a loan meets certain criteria and has exceeded the six-year limitation period.
Adjustments, rehabilitations, recoveries and write‑offs shown in Table 26 represent the amounts recorded in each academic year, regardless of the time of default. For example, in the academic year 2024‑2025, there were $133.6 million in recoveries. This amount includes recoveries for loans that could have been transferred in default in any academic year between 2000-2001 and now.
Table 26 shows that the balance of the portfolio in default is $2,591.7 million as at 31 July 2025 based on the information extracted from the data file. There is a non-material difference between the balance determined in the DARS/PSCD data file received and the balance provided by ESDC of $2,592.1 million as at 31 July 2025.
| Academic year | Defaults | Account adjustments | Rehabilitated | Net defaults | Recoveries | Write-offs | Balance |
|---|---|---|---|---|---|---|---|
| 2000-2001 | 5.3 | -no data | -no data | 5.3 | 0.3 | -no data | 5.0 |
| 2001-2002 | 5.0 | -no data | 0.1 | 4.9 | 0.7 | -no data | 9.1 |
| 2002-2003 | 244.3 | 0.6 | 17.5 | 226.2 | 23.8 | -no data | 211.6 |
| 2003-2004 | 265.9 | 12.4 | 3.1 | 250.4 | 48.8 | -no data | 413.1 |
| 2004-2005 | 364.4 | 19.0 | 2.2 | 343.2 | 83.0 | -no data | 673.3 |
| 2005-2006 | 275.6 | 12.3 | 7.8 | 255.5 | 85.6 | -no data | 843.2 |
| 2006-2007 | 257.7 | 8.7 | 5.8 | 243.2 | 83.7 | 0.2 | 1,002.5 |
| 2007-2008 | 303.4 | 11.1 | 5.0 | 287.4 | 91.8 | 0.3 | 1,197.8 |
| 2008-2009 | 308.3 | 8.7 | 7.0 | 292.6 | 85.4 | -no data | 1,404.9 |
| 2009-2010 | 301.2 | 6.1 | 10.9 | 284.3 | 81.1 | -no data | 1,608.2 |
| 2010-2011 | 335.2 | 6.4 | 18.0 | 310.8 | 92.8 | -no data | 1,826.2 |
| 2011-2012 | 382.8 | 6.9 | 34.9 | 341.0 | 99.3 | 220.9 | 1,847.0 |
| 2012-2013 | 353.4 | 5.9 | 31.4 | 316.1 | 105.0 | 167.6 | 1,890.5 |
| 2013-2014 | 372.9 | 12.5 | 39.0 | 321.3 | 113.0 | -no data | 2,098.8 |
| 2014-2015 | 357.6 | 6.3 | 39.3 | 312.0 | 120.2 | 218.0 | 2,072.6 |
| 2015-2016 | 346.0 | 2.0 | 40.9 | 303.1 | 118.5 | 131.7 | 2,125.9 |
| 2016-2017 | 350.4 | 2.6 | 73.8 | 274.1 | 114.8 | 136.1 | 2,149.1 |
| 2017-2018 | 340.6 | −0.9 | 73.6 | 267.9 | 113.7 | 155.1 | 2,148.3 |
| 2018-2019 | 353.1 | 2.1 | 67.7 | 283.3 | 114.5 | 126.1 | 2,191.0 |
| 2019-2020 | 306.3 | 1.9 | 65.9 | 238.5 | 78.3 | 138.2 | 2,213.0 |
| 2020-2021 | 350.3 | 3.7 | 69.8 | 276.8 | 55.6 | 146.1 | 2,288.0 |
| 2021-2022 | 487.6 | 15.7 | 81.1 | 390.8 | 105.4 | 133.7 | 2,439.7 |
| 2022-2023 | 492.4 | 9.5 | 107.0 | 375.9 | 113.4 | 179.6 | 2,522.7 |
| 2023-2024 | 499.6 | 13.2 | 156.0 | 330.4 | 137.6 | 180.3 | 2,535.1 |
| 2024-2025 | 503.9 | 10.5 | 134.3 | 359.2 | 133.6 | 169.0 | 2,591.7 |
B.4 Repayment Assistance Plan (RAP)
The RAP was implemented in August 2009. Detailed data files by applicant are available. The data files received were found to be complete and have been used to update the assumptions for the utilization rates (both entrance and continuation) for each stage. Table 27 and Table 28 present the RAP expenses split by stage as found in the MFIS as well as the totals calculated from the data files. Those expenses correspond to the portion of the monthly payments covered by the Government for all borrowers in the RAP.
| Academic year | MFIS | Data files | ||
|---|---|---|---|---|
| Stage 2 | Disability | Total | Total | |
| 2009-2010 | 3.3 | 1.2 | 4.4 | 2.8 |
| 2010-2011 | 2.9 | 6.1 | 8.9 | 10.2 |
| 2011-2012 | 6.3 | 11.7 | 18.1 | 17.1 |
| 2012-2013 | 11.1 | 12.9 | 24.0 | 24.3 |
| 2013-2014 | 16.7 | 15.5 | 32.2 | 32.7 |
| 2014-2015 | 25.5 | 20.2 | 45.7 | 44.1 |
| 2015-2016 | 33.8 | 23.4 | 57.2 | 56.2 |
| 2016-2017 | 45.8 | 28.9 | 74.7 | 73.3 |
| 2017-2018 | 59.0 | 31.4 | 90.4 | 90.0 |
| 2018-2019 | 70.1 | 34.5 | 104.5 | 103.9 |
| 2019-2020 | 56.6 | 25.6 | 82.2 | 81.6 |
| 2020-2021 | 99.6 | 47.5 | 147.1 | 146.4 |
| 2021-2022 | 105.9 | 49.8 | 155.7 | 156.2 |
| 2022-2023 | 114.5 | 55.4 | 169.9 | 171.1 |
| 2023-2024 | 122.9 | 60.9 | 183.8 | 183.5 |
| 2024-2025 | 119.9 | 62.5 | 182.5 | 181.6 |
| Academic year | MFIS | Data files | |||
|---|---|---|---|---|---|
| Stage 1 | Stage 2 | Disability | Total | Total | |
| 2009-2010 | 67.5 | 0.5 | 0.7 | 68.7 | 73.7 |
| 2010-2011 | 82.7 | 1.8 | 3.0 | 87.5 | 87.6 |
| 2011-2012 | 94.1 | 3.9 | 5.8 | 103.8 | 101.9 |
| 2012-2013 | 106.1 | 6.5 | 6.1 | 118.7 | 119.3 |
| 2013-2014 | 119.2 | 9.3 | 6.8 | 135.3 | 139.1 |
| 2014-2015 | 131.3 | 12.9 | 8.5 | 152.7 | 153.9 |
| 2015-2016 | 137.8 | 15.4 | 9.3 | 162.5 | 164.0 |
| 2016-2017 | 154.3 | 19.2 | 11.1 | 184.7 | 182.3 |
| 2017-2018 | 182.2 | 27.0 | 13.6 | 222.8 | 219.4 |
| 2018-2019 | 199.3 | 34.6 | 16.6 | 250.5 | 245.3 |
| 2019-2020 | 96.8 | 18.9 | 8.6 | 124.3 | 125.3 |
| 2020-2021 | 40.2 | 6.6 | 3.6 | 50.4 | 51.5 |
| 2021-2022 | 0.1 | 0.0 | 0.0 | 0.2 | 0.0 |
| 2022-2023+ | -no data | -no data | -no data | -no data | -no data |
Appendix - C Assumptions and methodology
Several economic and demographic assumptions are needed to determine the future long-term costs of the CSFA Program. The assumptions are determined by considering historical experience, recent trends and forward looking expectations. These assumptions reflect the actuary’s best judgment and are referred to as “best-estimate” assumptions.
Chart 3 shows the typical evolution of CSFA loans starting from the moment they are issued. Multiple underlying assumptions and methodologies are needed to determine the expected path of a loan issued through the program. Those assumptions and methodologies are described in this Appendix.
Chart 3 Evolution of CSFA loans issued through the program
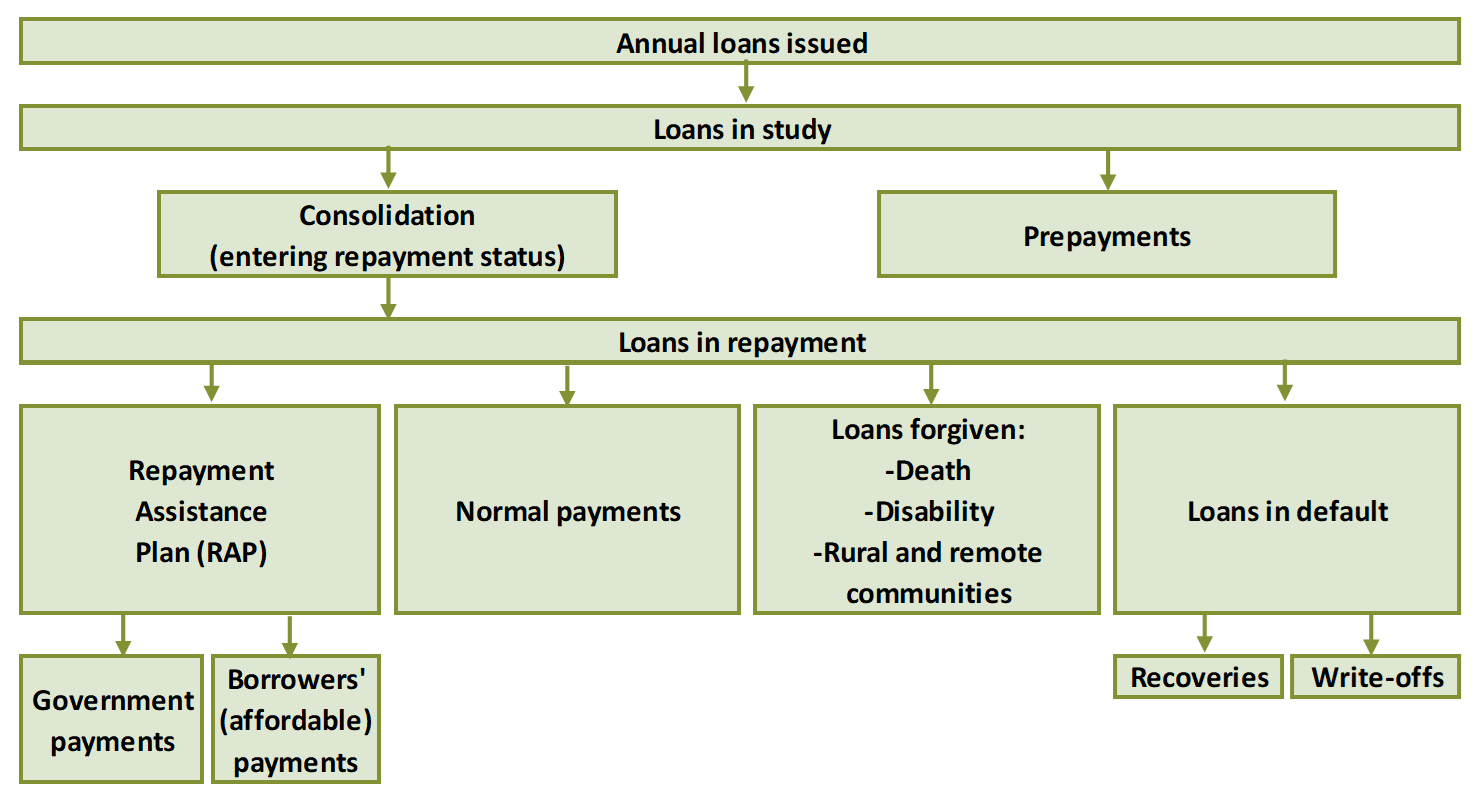
Chart 3 - Text version
“Annual loans issued” enters the “Loans in study” portfolio
- “Prepayments”
- “Consolidation (entering repayment status)” enters the “Loans in repayment” portfolio
- “Repayment Assistance Plan (RAP)”
- “Government payments”
- “Borrowers’ (affordable) payments”
- “Normal payments”
- “Loans forgiven (Death, Disability or Rural and remote communities)”
- “Loans in default”
- “Recoveries”
- “Write-offs”
- “Repayment Assistance Plan (RAP)”
C.1 Demographic
C.1.1 Covered population projections
Demographic projections are based on the population projected in the 32nd Actuarial Report on the Canada Pension Plan as at 31 December 2024. More specifically, it starts with the Canadian population on 1 July 2024, to which future fertility, mortality and migration assumptions, as shown in Table 29, are applied. The Canadian population is adjusted to exclude the non-participating province of Québec as well as the Northwest Territories, Nunavut, and non-permanent residents. The CPP population projections are essential in determining the future number of students expected to pursue a post‑secondary education.
| Total fertility rate for Canada (ultimate) | 1.35 per woman (for 2033+) |
|---|---|
| Mortality | Statistics Canada Life Tables with CPP 32nd assumed future improvements |
| Net migration rate for Canada (ultimate) | 0.72% of population (for 2051+) |
Table 29 Footnotes
| |
C.1.2 Post-secondary enrolment
Projections of post-secondary enrolment are based on enrolment data from Statistics Canada’s Labour Force Survey up to April 2026. The enrolment rates for students enrolled full-time in post-secondary institutions vary according to the following:
- 15 to 19
- 20 to 24
- 25 to 29
- 30 and over
- Male
- Female
- In labour force (individuals who are employed or looking for employment)
- Out of labour force
- University
- Public college
- Private college
Table 30 presents the labour force participation rate for participating provinces/territory for every group of ages, based on the population projected in the 32nd Actuarial Report on the Canada Pension Plan as at 31 December 2024.
| Academic year | 15 to 19 | 20 to 24 | 25 to 29 | 30 and over |
|---|---|---|---|---|
| 2023-2024 | 48.3 | 76.7 | 86.7 | 82.8 |
| 2024-2025 | 44.5 | 75.8 | 87.4 | 82.8 |
| 2025-2026 | 45.1 | 76.1 | 87.6 | 83.0 |
| 2026-2027 | 45.8 | 76.3 | 87.9 | 83.2 |
| 2027-2028 | 46.4 | 76.5 | 88.2 | 83.5 |
| … | … | … | … | … |
| 2049-2050 | 51.8 | 78.4 | 90.3 | 84.7 |
For each sub-group, historical enrolment data and recent enrolment trends are analysed. From these, expected future enrolment rates are determined. The future enrolment rates are then multiplied with the corresponding population subset (in or out of the labour force) to determine the expected number of students enrolled full-time. Since international students are not eligible to participate in the CSFA Program, they are excluded from the enrolment numbers.
Table 31 presents full‑time post‑secondary enrolment rates by age group, separated according to their labour force status, for academic years 2024‑2025, 2034-2035 and 2049‑2050. In 2024‑2025, 47% of students aged 15-29 who were enrolled full‑time in post‑secondary institutions were also participating in the labour force. The projected number of part-time students is assumed to stay equal to the last known academic year and represents about 1% of total students taking a loan in the CSFA program.
| 2024-2025 (1) | 2034-2035 (2) | Change in enrolment (2)/(1)−1 | 2049-2050 (3) | Change in enrolment (3)/(1)−1 | ||
|---|---|---|---|---|---|---|
| In labour force | 15-19 | 20.7 | 19.4 | −6.2 | 19.4 | −6.2 |
| 20-24 | 28.1 | 26.8 | −4.8 | 26.8 | −4.8 | |
| 25-29 | 5.2 | 4.9 | −6.8 | 4.9 | −6.6 | |
| 30-64 | 0.7 | 0.8 | 12.1 | 0.8 | 12.1 | |
| 15-29 | 16.0 | 15.8 | −1.0 | 15.8 | −1.0 | |
| 15-64 | 4.4 | 4.5 | 1.9 | 4.2 | −3.1 | |
| Out of the labour force | 15-19 | 24.9 | 24.9 | 0.2 | 24.9 | 0.2 |
| 20-24 | 89.0 | 86.0 | −3.4 | 86.0 | −3.4 | |
| 25-29 | 31.2 | 30.3 | −2.8 | 30.3 | −2.9 | |
| 30-64 | 3.7 | 3.5 | −3.6 | 3.5 | −3.7 | |
| 15-29 | 42.0 | 42.4 | 1.0 | 42.4 | 0.9 | |
| 15-64 | 18.6 | 19.0 | 2.2 | 17.7 | −4.8 | |
| Total enrolment over population | 15-19 | 23.0 | 22.1 | −3.9 | 22.1 | −4.1 |
| 20-24 | 42.9 | 39.8 | −7.2 | 39.6 | −7.6 | |
| 25-29 | 8.5 | 7.4 | −13.0 | 7.3 | −13.5 | |
| 30-64 | 1.2 | 1.2 | −1.2 | 1.2 | −0.1 | |
| 15-29 | 23.7 | 22.9 | −3.6 | 22.7 | −4.2 | |
| 15-64 | 7.3 | 7.1 | −3.3 | 6.7 | −8.8 | |
C.1.3 Loan uptake rate and grant uptake rate
The projection of the loan uptake rates is based on the historical number of students receiving a loan under the CSFA Program according to the educational institution attended:
Educational institution
- University
- Public college
- Private college
A trend is defined for each group based on historical data, current socio-economic conditions and the future expected mix of the student population.
The product of the number of students enrolled full-time and the CSFA Program loan uptake rate gives the number of students receiving a loan under the CSFA Program.
The same methodology is used for both the grant uptake rate and the loan and/or grant uptake rate.
C.1.4 Consolidation
Under the direct loan regime, loans are assumed to consolidate according to the distribution of consolidation by year shown in Chart 4 over a period of fifteen years after a loan is issued. This distribution is built using the experience of direct loan consolidations. The assumption remains fairly similar to the assumption from the previous report.
Each year, some borrowers having previously consolidated their student loans choose to return to school. For projection purposes, the consolidated loan amounts in each future academic year are calculated net of loans for borrowers who returned to school. Hence, the students only consolidate once for modeling purposes.
Chart 4 Distribution of consolidation amounts over 15 years
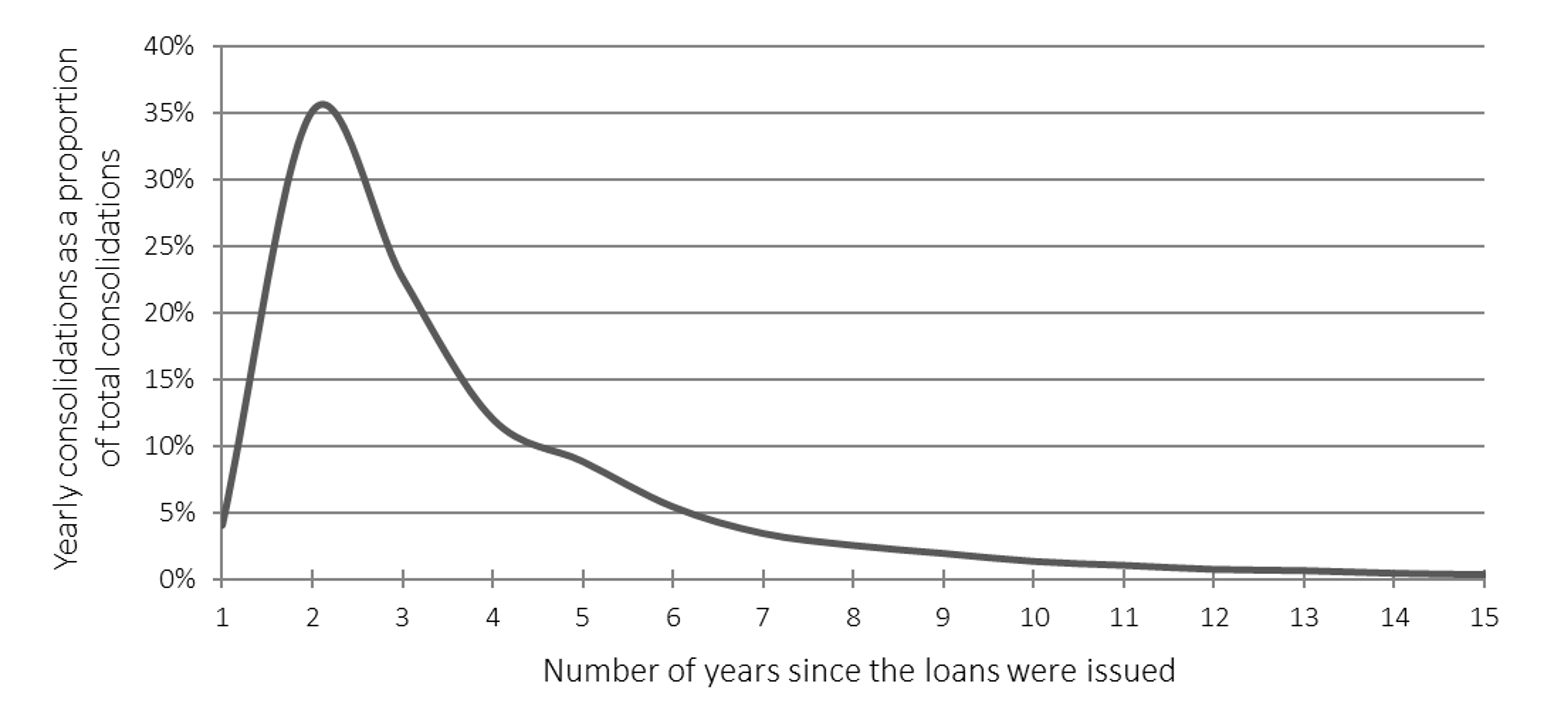
Chart 4 - Text version
| Number of years since the loans were issued | Yearly consolidations as a proportion of total consolidations |
|---|---|
| 1 | 4.0% |
| 2 | 35.1% |
| 3 | 22.6% |
| 4 | 12.0% |
| 5 | 8.8% |
| 6 | 5.4% |
| 7 | 3.4% |
| 8 | 2.5% |
| 9 | 1.9% |
| 10 | 1.3% |
| 11 | 1.0% |
| 12 | 0.7% |
| 13 | 0.6% |
| 14 | 0.4% |
| 15 | 0.3% |
C.2 Economic
C.2.1 Inflation
Table 32 presents the inflation assumption. The ultimate inflation assumption of 2.0% is consistent with the assumption used in the 32nd Actuarial Report on the Canada Pension Plan as at 31 December 2024. The ultimate assumption is unchanged from the previous report.
| Academic year | Inflation |
|---|---|
| 2025-2026 | 2.1 |
| 2026-2027+ | 2.0 |
C.2.2 Real wage increase
Table 33 presents the real wage increase assumption. The real wage increase of 0.8% is based on the 32nd Actuarial Report on the Canada Pension Plan as at 31 December 2024. The ultimate assumption was reduced from 0.9% in the previous report.
| Academic year | Real wage increases |
|---|---|
| 2025-2026+ | 0.8 |
C.2.3 Cost of borrowing
Table 34 presents the interest rates assumptions used to calculate the cost of borrowing for the Government. Since the normal repayment period lasts nine and a half years for most loans issued, the cost of borrowing for the Government is based on the expected 10-year Government of Canada bond yield.
| Academic year | Government's cost of borrowing | Government's real cost of borrowingTable 34 Footnote a | Prime rateTable 34 Footnote b |
|---|---|---|---|
| 2025-2026 | 3.4 | 1.3 | 4.3 |
| 2026-2027 | 3.5 | 1.4 | 4.5 |
| 2027-2028 | 3.6 | 1.6 | 4.5 |
| 2028-2029 | 3.6 | 1.6 | 4.5 |
| 2029-2030 | 3.6 | 1.6 | 4.5 |
| 2030-2031+ | 3.7 | 1.7 | 4.6 |
Table 34 Footnotes
| |||
The government’s cost of borrowing is expected to increase gradually from 3.4% in the academic year 2025‑2026 to an ultimate rate of 3.7% in the academic year 2030-2031. The ultimate government’s cost of borrowing assumption is unchanged from the previous report while the ultimate prime rate assumption was increased from 4.5% to 4.6%.
C.2.4 Tuition increase
Tuition fees are, in part, determined by government policies. Thus, they are projected using provincial budgets, along with recent and historical experience of tuition fee increases. The projected increases in tuition fees are shown in Table 35. The aggregate tuition increase assumption is based on the weighted average of the provinces’ tuition increases.
| Academic Year | N.L. | P.E.I. | N.S. | N.B. | Ont. | Man. | Sask. | Alta. | B.C. | Tuition increase (weighted average) |
|---|---|---|---|---|---|---|---|---|---|---|
| 2024-2025Table 35 Footnote a | 0.8 | 4.6 | 4.0 | 9.6 | 5.2 | 7.0 | 3.4 | 4.6 | 3.8 | 5.0 |
| 2025-2026Table 35 Footnote a | 3.4 | 6.4 | 0.5 | 4.2 | 2.9 | 3.9 | 3.2 | 2.0 | 2.1 | 2.7 |
| 2026-2027Table 35 Footnote b | 0.0 | 2.2 | 0.0 | 3.8 | 2.0 | 3.4 | 2.8 | 2.0 | 2.0 | 2.0 |
| 2027-2028Table 35 Footnote b | 2.4 | 2.2 | 0.0 | 3.8 | 2.0 | 3.3 | 2.7 | 2.0 | 2.0 | 2.0 |
| 2028-2029+Table 35 Footnote b | 3.0 | 2.7 | 3.9 | 4.7 | 2.0 | 4.2 | 3.4 | 2.0 | 2.0 | 2.25 |
Table 35 Footnotes
| ||||||||||
The ultimate tuition increase assumption has been reduced to 2.25% (from 3.75% in the prior report), primarily reflecting Ontario’s updated tuition framework, which is intended to support the long-term sustainability of its postsecondary sector (2026 Ontario Budget).
The starting point for the 2023‑2024 tuition fees is calculated from the need assessment data file and represents the average tuition fees for students who received a loan or a grant. Tuition fees were calculated for each of the three student groups (university, public college and private college) and a weighted average was determined based on the number of students in each group. This calculation resulted in a tuition fee estimate of $10,000 for the academic year 2023‑2024. The estimated weighted average tuition fees (including compulsory fees) for 2024‑2025 is $10,500 (resulting in an increase of 5.0% from 2023-2024).
C.3 Loan Size
C.3.1 Student needs
The projection of the average loan issued is based on the projection of the student net need, capped at the maximum weekly student loan limit. Student net need increases are calculated separately for each group (university, public college and private college students) over the projection period.
| Determining the student net need | Student need (excess of expenses over resources):
|
|---|---|
Grants reduction:
| |
Table B Footnotes
| |
ESDC provided CSFA Program need assessment data for the academic year 2023‑2024. The CSFA Program generally aims to provide 60% of the total assessed need, while the participating province or territory of residence aims to provide the remaining 40%.
C.3.2 Other student expenses
Other expenses are considered to be any student expense other than tuition fees and are projected to increase with inflation. These expenses include books, shelter, food, clothing and transportation and are assessed by the participating provinces and territory. The average expense is calculated from the need assessment data file and represents the average expenses for students who receive a loan or a grant (the projection is made individually by university, public college and private college). The estimated average for other expenses is $17,800 for the academic year 2023‑2024; it increases to $18,400 in the academic year 2024‑2025 based on an increase of 3.1%Footnote 12.
C.3.3 Student resources
The starting point for average resources in 2023‑2024 is calculated from the need assessment data file and represents the average resources for students who received a loan or a grant. The salary portion of average resources is then projected using the wage increase assumption, while the standard of living used to determine the parental contribution is projected using the inflation assumption (the projection is made individually by university, public college and private college). The estimated student average resources is $3,200Footnote 13 for 2023‑2024. It remains at $3,200 in the academic year 2024‑2025 (with an unrounded increase of 1.9%).
C.4 Grants
For the academic year 2024‑2025, the actual cost of Canada Student Grants (CSGs) was $2,673 million. Grants disbursed are projected to decrease in the academic year 2026-2027 as students in for-profit private institutions are no longer eligible for the CSG-FT. In addition, once the temporary increase in the maximum amount of grants have expired, the total amount of grants disbursed under the CSG is projected to decrease over the projection period as fewer borrowers become eligible for the CSG-FT due to the family income (inflation plus real wage) increasing at a faster pace than the grant thresholds (inflation). Over time, grant disbursements are expected to stabilize, as declines in eligibility are offset by rising post‑secondary enrolment.
For academic years 2020-2021 to 2026-2027, grants are higher due to the temporary doubling of grants followed by a 40% increase (compared with the academic year 2019-2020) in grants. Maximum monthly grant amounts, as set out by the program, are assumed to remain constant for the remaining projection period for the purpose of this valuation.
C.5 Repayment for direct loans
C.5.1 Prepayments
Prepayments correspond to payments applied to principal during the period of study and during the six‑month non-repayment period after the period of study end date. The amount of prepayments for the academic year 2024‑2025 was $321 million. Around 35% of this amount is received during the period of study and the remaining 65% is received during the non‑repayment period. Over the long‑term, it is assumed that around 10% (reduced from 13% in the previous report) of loans issued are prepaid. This assumption is based on recent historical experience.
C.5.2 Normal payments
Normal payments are made by borrowers that are not in study, RAP nor default. These payments include both the minimum payments (as set out by the repayment agreement) and any additional voluntary payments. The projected normal payments that apply to each consolidation cohort are shown in Chart 5.
Chart 5 Normal payments over 16 years
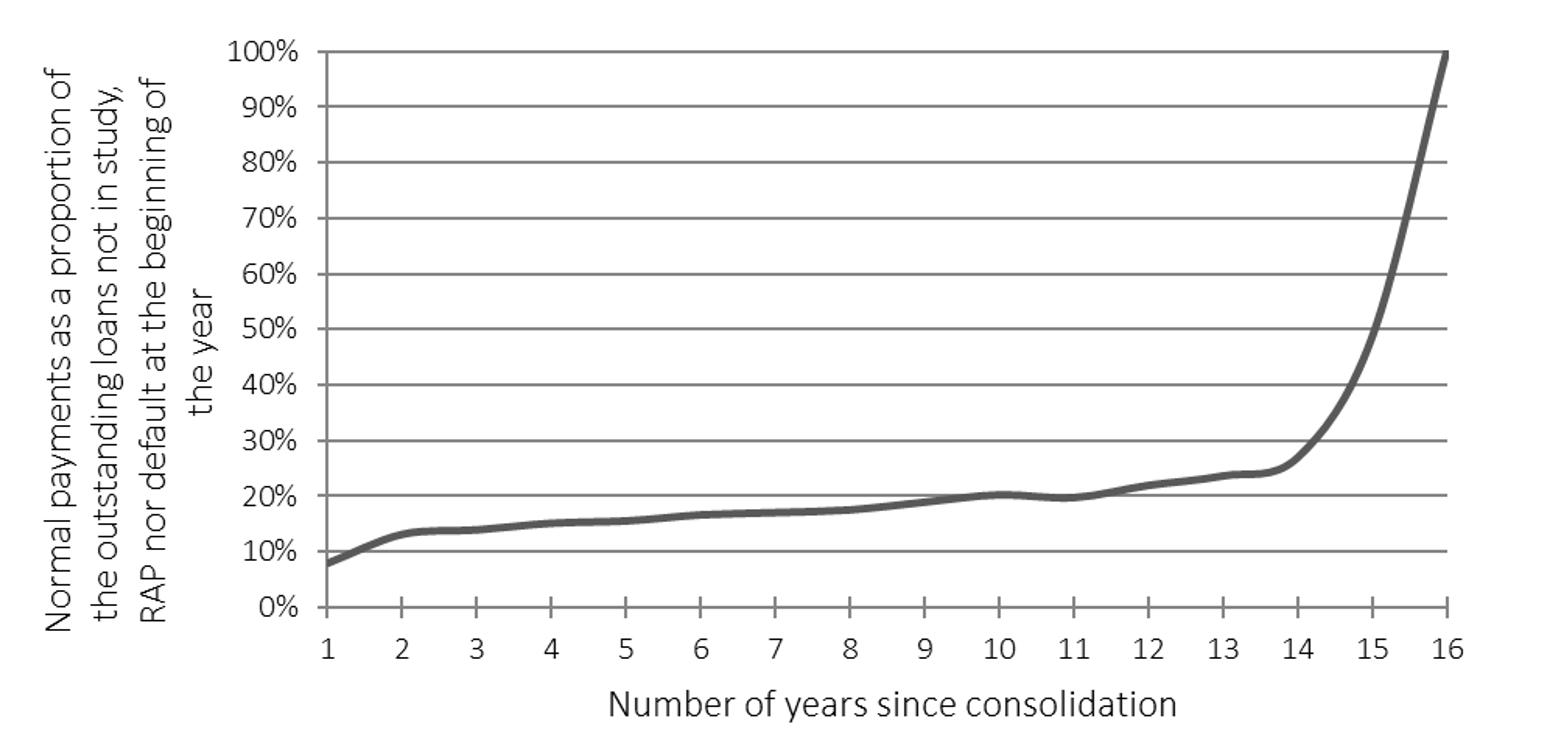
Chart 5 - Text version
| Number of years since consolidation | Normal payments as a proportion of the outstanding loans not in study, RAP nor default at the beginning of the year |
|---|---|
| 1 | 7.9% |
| 2 | 13.1% |
| 3 | 13.9% |
| 4 | 15.1% |
| 5 | 15.5% |
| 6 | 16.6% |
| 7 | 17.0% |
| 8 | 17.5% |
| 9 | 18.9% |
| 10 | 20.2% |
| 11 | 19.7% |
| 12 | 21.9% |
| 13 | 23.6% |
| 14 | 26.9% |
| 15 | 48.6% |
| 16 | 100.0% |
Recent normal payments experience has been consistently lower than observed before the pandemic. A potential reason for this could be a change in borrowers’ behavior following the elimination of interest accrual. The long-term assumption was revised downward to fully reflect this new trend.
C.5.3 Loans forgiven
There are three categories of loans forgiven: those forgiven for severe permanent disability, those forgiven for death, and those forgiven for eligible occupations (see Appendix A).
Starting with the academic year 2025-2026, loans forgiven for severe permanent disability and death correspond to 0.026% of loans in study and 0.154% of loans in repayment. The long-term rate of loans forgiven while in repayment also includes loans forgiven while in default. In the future, they are expected to directly be forgiven while in repayment instead of defaulting first. In 2024-2025, $12.6 million of loans were forgiven while in default. It is further assumed that the split between severe permanent disability and death is 35% and 65%, respectively.
Loans forgiven to professionals working in under-served rural or remote communities are projected based on the expected new number of doctors and qualifying nurses who received student loans during their studies and are expected to work in an under‑served rural or remote community after graduation to which, the expected utilization from the newly eligible professionals is added.
C.6 Administrative expenses
ESDC provided estimates of the administrative expenses to support the CSFA Program for the short-term. The costs have been converted to an academic year basis and the extrapolation of future years was done using wage increases (inflation plus real wage). Administrative expenses include ESDC salary and non‑salary resources related to the program as well as expenses for service providers and collection costs.
The general administrative fees represent the expenses incurred by the departments involved and fees paid to the National Student Loans Service Centre (NSLSC).
| Academic year | Administrative expenses |
|---|---|
| 2024-2025 | 108.1 |
| 2025-2026 | 107.2 |
| 2026-2027 | 108.2 |
| 2027-2028 | 109.5 |
| 2028-2029 | 111.4 |
| 2029-2030 | 114.6 |
| 2030-2031+ | Increases with wages |
C.6.1 Administrative fees paid to provinces
The administrative expenses include fees paid to the participating provinces and to the Yukon Territory. These fees are paid to administer certain aspects of the CSFA Program. For the academic year 2024‑2025, the administrative fees paid to the participating provinces and territory were $44.7 million. Future-year projections were derived from a historical growth assumption of 1.3%.
C.6.2 Alternative payments
Alternative payments are made directly to the province and territories that do not participate in the CSFA Program, namely Québec, the Northwest Territories, and Nunavut. These payments are projected by multiplying the net cost of the program by the ratio of the population aged 18 to 24 residing in the non‑participating province and territories to the population aged 18 to 24 residing in the participating provinces and territory.
The expenses included in the calculation are: interest subsidies, RAP–interest expenses for risk‑shared and guaranteed regimes, loans forgiven, service providers’ costs, CSG, claims, RAP payments, risk premiums, put‑backs, refunds to financial institutions and default amounts for the direct loan regime.
The revenues include student interest payments, if any, and principal and interest from recoveries. The cost of alternative payments is $938.4 million for 2024‑2025 based on expenses and revenue of 2023‑2024 and $942.2 million for 2025‑2026 based on expenses and revenue of 2024‑2025, both including temporary measures.
C.7 Allowance
Three allowances are projected in this report. There is an allowance for the RAP (principal) to cover the future cost of students benefiting from this program, and two allowances for bad debt (principal and interest) to cover the future cost of students defaulting on their loan, net of recoveries, recalls and rehabilitations. This section provides details related to the assumptions and methodologies used to determine those allowances.
C.7.1 Repayment Assistance Plan (RAP)
The methodology used to calculate the RAP allowance is based on the following components:
- The share of loans (as a percentage of the initial consolidation cohort) using the RAP at least onceFootnote 14 (based on historical experience);
- The share of loans in the RAP that will remain in the RAP after each academic year, as not all RAP borrowers end up using the 15-year maximum repayment period (based on historical experience);
- An adjustment for the expected change in future experience due to family income increasing at a rate equal to real wage plus inflation and RAP thresholds increasing at a rate equal to inflation (based on an estimate using economic data);
- An adjustment for the expected impact of the RAP threshold changes in the academic year 2022-2023 that is partially reflected in the historical data (based on an estimate using economic data);
- The required payments for loans in the RAP for each academic year (based on the RAP formula); and
- The share of the required payment paid by the Government (based on historical experience).
Sections C.7.1.1, C.7.1.2 and C.7.1.3 provide information on the resulting loan balances in RAP. Section C.7.1.4 provides additional information on the other RAP assumptions.
Tables 37, 38 and 39 show the result of steps (a) to (d) as a percentage of the initial consolidation amount (utilization rates).
C.7.1.1 RAP – Stage 1
Table 37 shows the long-term utilization rate assumptions used for RAP–Stage 1. Many borrowers complete their RAP–Stage 1 over a period longer than five years, hence the utilization rates do not always include the same borrowers from year to year, and some borrowers may be in the plan for only part of a year. The model takes all of this into account by incorporating the average time spent in RAP–Stage 1 in an academic year.
The first year in RAP–Stage 1 (the first diagonal row of Table 37) generally consists of a partial academic year since most borrowers do not enter the RAP on August 1st. However, if borrowers remain in the RAP for a greater amount of time in the second year, then the utilization rate can be higher than the preceding year. The utilization rate is based on the consolidation amounts and is applied by cohort.
| Year since consolidation | Start year after consolidation | |||||||
|---|---|---|---|---|---|---|---|---|
| 0-1 | 1-2 | 2-3 | 3-4 | 4-5 | 5-6 | 6-7 | 7-8 | |
| 0-1 | 12.2 | Not applicable | Not applicable | Not applicable | Not applicable | Not applicable | Not applicable | Not applicable |
| 1-2 | 17.6 | 3.4 | Not applicable | Not applicable | Not applicable | Not applicable | Not applicable | Not applicable |
| 2-3 | 12.1 | 2.9 | 0.8 | Not applicable | Not applicable | Not applicable | Not applicable | Not applicable |
| 3-4 | 9.7 | 2.1 | 0.8 | 0.4 | Not applicable | Not applicable | Not applicable | Not applicable |
| 4-5 | 8.1 | 1.7 | 0.6 | 0.5 | 0.2 | Not applicable | Not applicable | Not applicable |
| 5-6 | 6.2 | 1.4 | 0.5 | 0.3 | 0.3 | 0.1 | Not applicable | Not applicable |
| 6-7 | 2.3 | 0.9 | 0.4 | 0.3 | 0.2 | 0.2 | 0.1 | Not applicable |
| 7-8 | 1.0 | 0.4 | 0.3 | 0.2 | 0.1 | 0.1 | 0.1 | 0.0 |
| 8-9 | 0.6 | 0.2 | 0.1 | 0.2 | 0.1 | 0.1 | 0.1 | 0.1 |
| 9-10 | 0.4 | 0.1 | 0.1 | 0.1 | 0.1 | 0.1 | 0.0 | 0.0 |
For example, it is expected that 15.8% (12.1% + 2.9% + 0.8%) of the total initial consolidation dollar amount for a given cohort will be in RAP–Stage 1 two years after their consolidation.
C.7.1.2 RAP–Stage 2
The methodology used to calculate the amount of dollars in RAP–Stage 2 assumes that as borrowers become eligible for RAP–Stage 2 (five years after entering RAP–Stage 1), they immediately enter RAP–Stage 2. This means that a borrower could enter RAP–Stage 2 from the 6th year after consolidation until the 11th year after consolidation.
Table 38 shows the resulting long-term utilization rate assumptions used for RAP–Stage 2.
| Year since consolidation | Start year after consolidation | |||||
|---|---|---|---|---|---|---|
| 5-6 | 6-7 | 7-8 | 8-9 | 9-10 | 10-11 | |
| 5-6 | 2.0 | Not applicable | Not applicable | Not applicable | Not applicable | Not applicable |
| 6-7 | 3.0 | 1.2 | Not applicable | Not applicable | Not applicable | Not applicable |
| 7-8 | 2.1 | 1.3 | 0.5 | Not applicable | Not applicable | Not applicable |
| 8-9 | 1.5 | 0.9 | 0.4 | 0.2 | Not applicable | Not applicable |
| 9-10 | 1.1 | 0.7 | 0.3 | 0.2 | 0.1 | Not applicable |
| 10-11 | 0.8 | 0.5 | 0.2 | 0.1 | 0.2 | 0.2 |
| 11-12 | 0.5 | 0.3 | 0.1 | 0.1 | 0.1 | 0.1 |
| 12-13 | 0.3 | 0.2 | 0.1 | 0.1 | 0.1 | 0.1 |
| 13-14 | 0.2 | 0.1 | 0.0 | 0.0 | 0.0 | 0.0 |
| 14-15 | 0.0 | 0.0 | 0.0 | 0.0 | 0.0 | 0.0 |
C.7.1.3 RAP–D
RAP–D is available to borrowers with a disability recognized by the CSFA Program. A borrower who had a RAP–D application approved is eligible to start in the RAP–D as soon as his loan consolidates and can remain in the plan for a period of 9.5 years, when the loan is expected to have been repaid in full.
Table 39 shows the long-term utilization rate assumptions used for RAP–D.
| Year since consolidation | Start year after consolidation | ||||||
|---|---|---|---|---|---|---|---|
| 0-1 | 1-2 | 2-3 | 3-4 | 4-5 | 5-6 | 6-7 | |
| 0-1 | 2.12 | Not applicable | Not applicable | Not applicable | Not applicable | Not applicable | Not applicable |
| 1-2 | 2.45 | 0.43 | Not applicable | Not applicable | Not applicable | Not applicable | Not applicable |
| 2-3 | 1.42 | 0.29 | 0.12 | Not applicable | Not applicable | Not applicable | Not applicable |
| 3-4 | 0.99 | 0.18 | 0.11 | 0.07 | Not applicable | Not applicable | Not applicable |
| 4-5 | 0.71 | 0.12 | 0.06 | 0.07 | 0.06 | Not applicable | Not applicable |
| 5-6 | 0.50 | 0.09 | 0.05 | 0.04 | 0.06 | 0.04 | Not applicable |
| 6-7 | 0.34 | 0.06 | 0.03 | 0.03 | 0.03 | 0.05 | 0.05 |
| 7-8 | 0.22 | 0.04 | 0.02 | 0.02 | 0.02 | 0.02 | 0.04 |
| 8-9 | 0.12 | 0.03 | 0.01 | 0.01 | 0.01 | 0.01 | 0.02 |
| 9-10 | 0.05 | 0.01 | 0.01 | 0.00 | 0.00 | 0.00 | 0.01 |
C.7.1.4 Other RAP assumptions
Table 40 provides information on the additional assumptions used to calculate the RAP allowance.
| Academic year | Multiplicative adjustments to the share of loans in RAP due to family income growing at a faster pace than thresholds | Gradual impact of the threshold change to the share of loans in RAP | Government share of the required payment | |||
|---|---|---|---|---|---|---|
| RAP-1, RAP-2 and RAP-D | RAP-1 | RAP-2 | RAP-D | RAP-2 | RAP-D | |
| 2025-2026 | 99.6% per academic year, up to a maximum of 94.0% | 109.0 | 107.3 | 107.0 | 96.0 | 96.0 |
| 2026-2027+ | 99.6% per academic year, up to a maximum of 94.0% | 109.0 | 108.5 | 107.0 | 96.0 | 96.0 |
The values presented in the Table 37, Table 38 and Table 39 already include the long-term adjustments for the “Family income growing at a faster pace than thresholds” and for the “Gradual impact of the threshold change”.
C.7.1.5 Provision rates for RAP–principal (Stage 2 and D)
The allowance for RAP–principal covers future costs related to RAP–Stage 2 and RAP–D, which corresponds to the portion of the loan principal paid off by the Government.
As with the allowance for bad debt – principal, the methodology to determine the provision rates and allowance for RAP–principal is based on a prospective approach that uses a snapshot of the portfolio at a particular point in time to determine the amount of the allowance at that time. The calculation of the allowance is separated into three components according to the status of the loan; that is whether the loan is in-study, in repayment (excluding loans in the RAP) or in the RAP (considering the current stage). The provision rates are based on current and long-term RAP utilization rates at each stage. Three distinct provision rates, depending on the status of the loan at a given time, will be used to determine the required allowance.
The provision rates used for the projected allowance as at 31 July 2026 shown in this report are:
- 5.5% for loans in-study;
- 1.5% for loans in repayment (net of loans in the RAP); and
- 30.1% for loans in the RAP (all stages combined).
The ultimate provision rates used in this report are (corresponding rates in the previous report are in brackets):
- 5.4% (5.5%) for loans in‑study;
- 1.2% (1.8%) for loans in repayment (net of loans in the RAP); and
- 31.7% (30.0%) for loans in the RAP (all stages combined).
The lowest provision rate is for the portfolio of loans in repayment. This portfolio includes cohorts of loans for which partial reimbursements have already occurred, as well as some defaults and utilization of the RAP, resulting in a lower risk for the remaining loans and consequently, a lower required provision rate than the one for loans in-study.
The highest provision rate is for the portfolio of loans already in the RAP. Having already entered the plan by meeting the eligibility criteria, there is a greater chance that these loans will remain eligible and consequently, remain in the plan.
The annual expense for the allowance for RAP–principal is equal to the difference between the total allowance at the end of a year and the total allowance at the end of the previous year net of the current year’s RAP expenses (as shown in Table 16).
The RAP is a plan that was introduced in 2009 and thus, has limited experience. Since students using RAP–Stage 2 repay their loan over a period of 15 years after consolidation, it takes 15 years for a cohort to fully develop its experience. The first cohort (2009-2010) to have full experience was completed in the academic year 2024-2025. The related projection of costs and underlying assumptions will be revised in the future as experience continues to emerge, and the provision rates will be updated accordingly.
C.7.2 Net default rate
Several assumptions are used to determine the expected future amount of defaulted principal that will not be recovered, namely the gross default rate, the loans rehabilitations and recalls, the loans recoveries and the prepayments. These assumptions are revised each year and are based on historical observations and the actuary’s best estimates.
The net default rate is used to derive the provision rates for bad debt – principal and for bad debt – interest shown in sections C.7.3 and C.7.4. It represents the proportion of consolidated loans that will eventually be written off for each future consolidation cohort. The long-term net default rate is slightly higher than the previous report rate of 6.7% and corresponds to:
The amount of loans to be written‑offFootnote 15 each year is determined using the assumed distribution presented in Chart 6, which was updated from the last report based on recent experience data.
Chart 6 Write-off distribution over 30 years
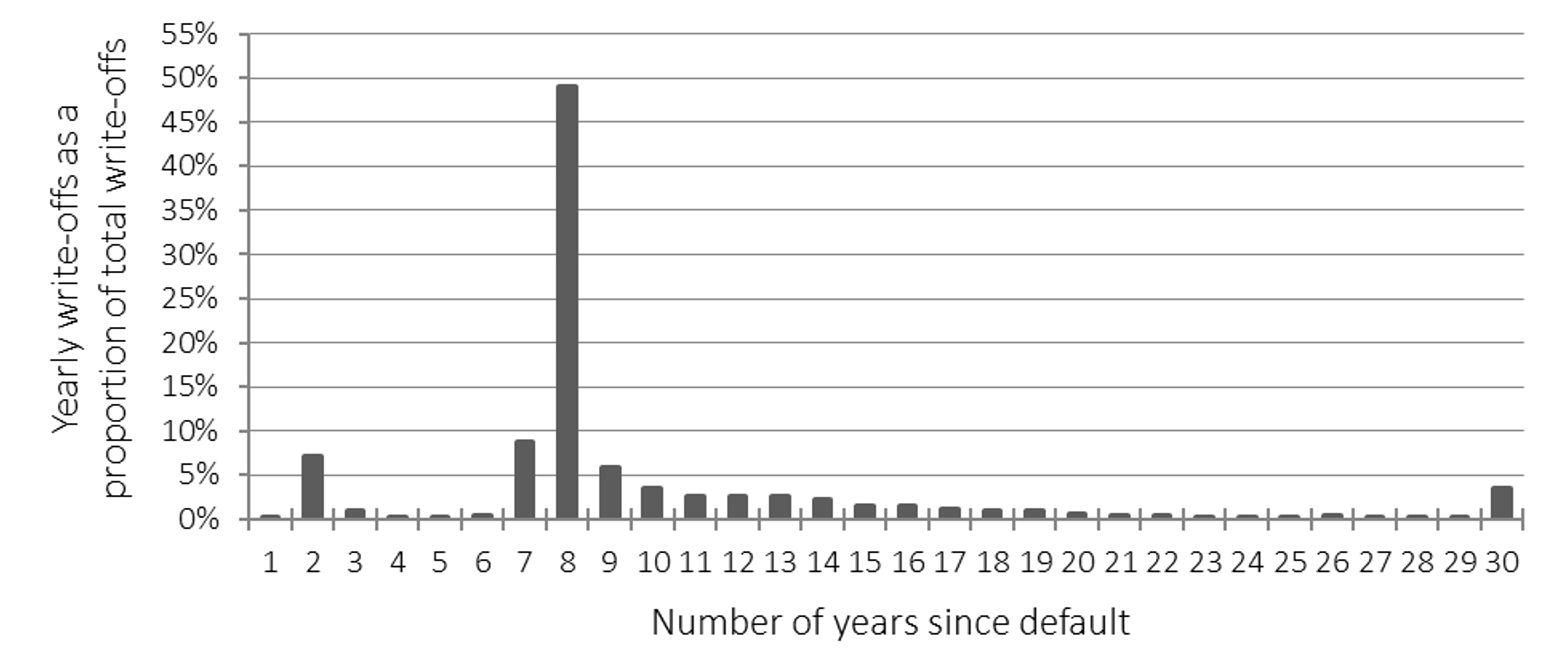
Chart 6 - Text version
| Number of years since default | Yearly write-offs as a proportion of total write-offs |
|---|---|
| 1 | 0.3% |
| 2 | 7.1% |
| 3 | 0.9% |
| 4 | 0.2% |
| 5 | 0.3% |
| 6 | 0.4% |
| 7 | 8.7% |
| 8 | 49.1% |
| 9 | 5.9% |
| 10 | 3.6% |
| 11 | 2.6% |
| 12 | 2.7% |
| 13 | 2.6% |
| 14 | 2.3% |
| 15 | 1.6% |
| 16 | 1.5% |
| 17 | 1.1% |
| 18 | 0.9% |
| 19 | 0.9% |
| 20 | 0.7% |
| 21 | 0.5% |
| 22 | 0.4% |
| 23 | 0.3% |
| 24 | 0.3% |
| 25 | 0.3% |
| 26 | 0.4% |
| 27 | 0.3% |
| 28 | 0.2% |
| 29 | 0.3% |
| 30 | 3.6% |
C.7.2.1 Gross default rate
A default rate is determined for each consolidation cohort. This rate represents the proportion of loans consolidated in a year that are expected to default at some point before they are completely repaid. Consolidation cohorts 2030-2031 and onwards are assumed to have the same ultimate gross default rate of 16.5% (based on historical experience and increased from 16.0% in the previous report). The short-term gross default rates (up to the academic year 2029-2030) are adjusted to reflect recent experience (Section C.7.2.4). As shown in Chart 7, the largest proportion of loans goes into default within three years of consolidation.
Chart 7 Default distribution over 14 years
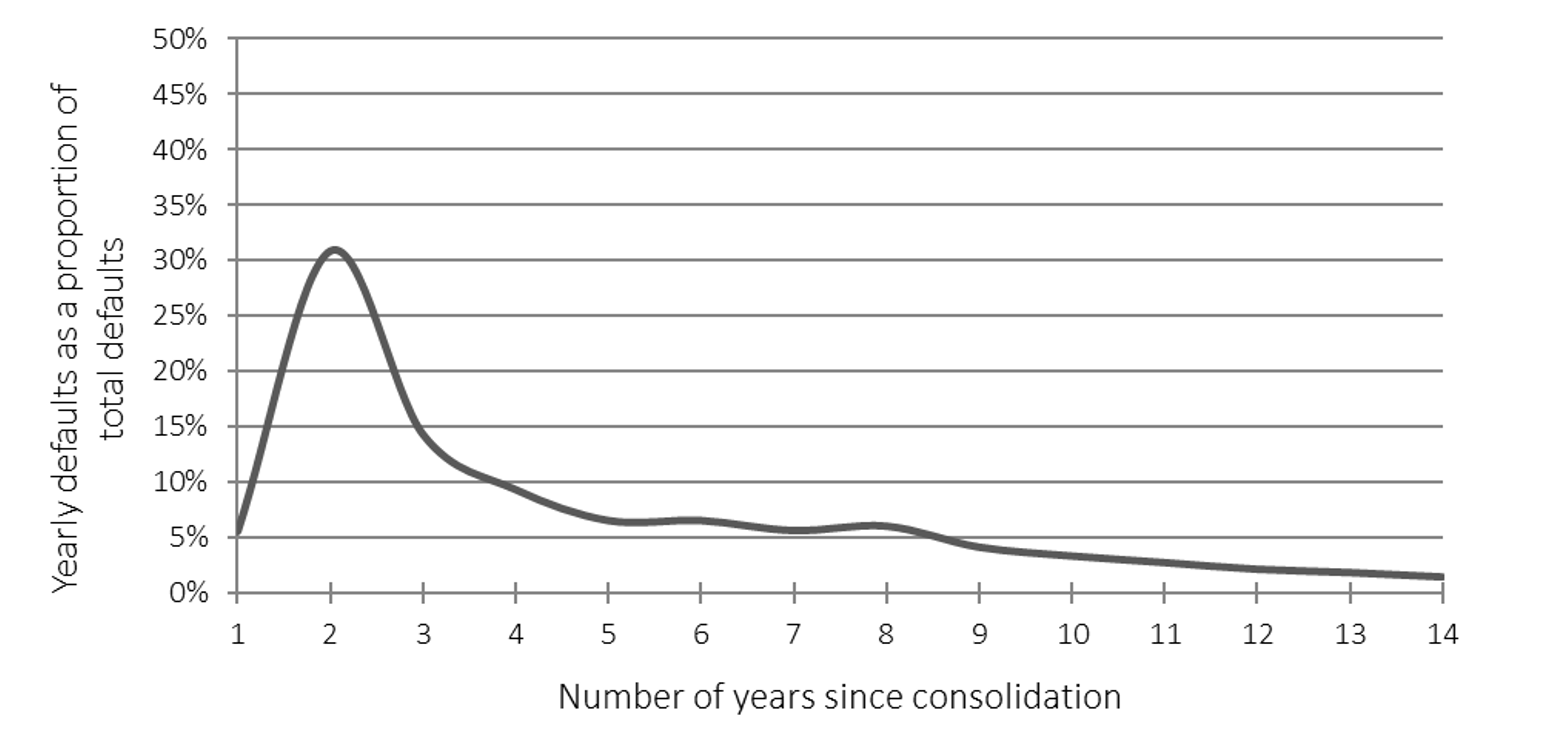
Chart 7 - Text version
| Number of years since consolidation | Yearly defaults as a proportion of total defaults |
|---|---|
| 1 | 5.5% |
| 2 | 30.9% |
| 3 | 14.3% |
| 4 | 9.3% |
| 5 | 6.5% |
| 6 | 6.5% |
| 7 | 5.6% |
| 8 | 6.0% |
| 9 | 4.1% |
| 10 | 3.3% |
| 11 | 2.7% |
| 12 | 2.1% |
| 13 | 1.8% |
| 14 | 1.4% |
C.7.2.2 Recalls and rehabilitations rate
For different reasons, loans can be mistakenly transferred in default. When they are brought back in good standing, the transaction is referred to as a recall. In addition, borrowers who find themselves legitimately in default can bring their loans back in good standing by performing what is called a rehabilitation. Since January 2020, borrowers can meet the rehabilitation criteria by making two monthly payments and capitalizing the remaining interest, if any, on their loan. Effective November 2025, the rehabilitation process was updated to require four payments instead of two, with a minimum total payment amount of $440. To be eligible for the RAP, borrowers first need to have a loan in good standing which provides an incentive for borrowers to rehabilitate their loans.
Consolidation cohorts 2027-2028 and onwards are assumed to have the same ultimate recalls/rehabilitations rate of 22.0% (unchanged from the previous report). The short-term recalls/rehabilitations rates (up to the academic year 2026-2027) are adjusted to reflect recent experience (Section C.7.2.4). While rehabilitations have been increasing in the past few years, recent experience suggests stabilization is emerging. The impact of the new rehabilitation policy will be incorporated as emerging experience becomes available, given the high degree of behavioural uncertainty.
Chart 8 shows the long-term recalls and rehabilitations distribution once a loan is transferred in default.
Chart 8 Recalls and rehabilitations distribution over 14 years
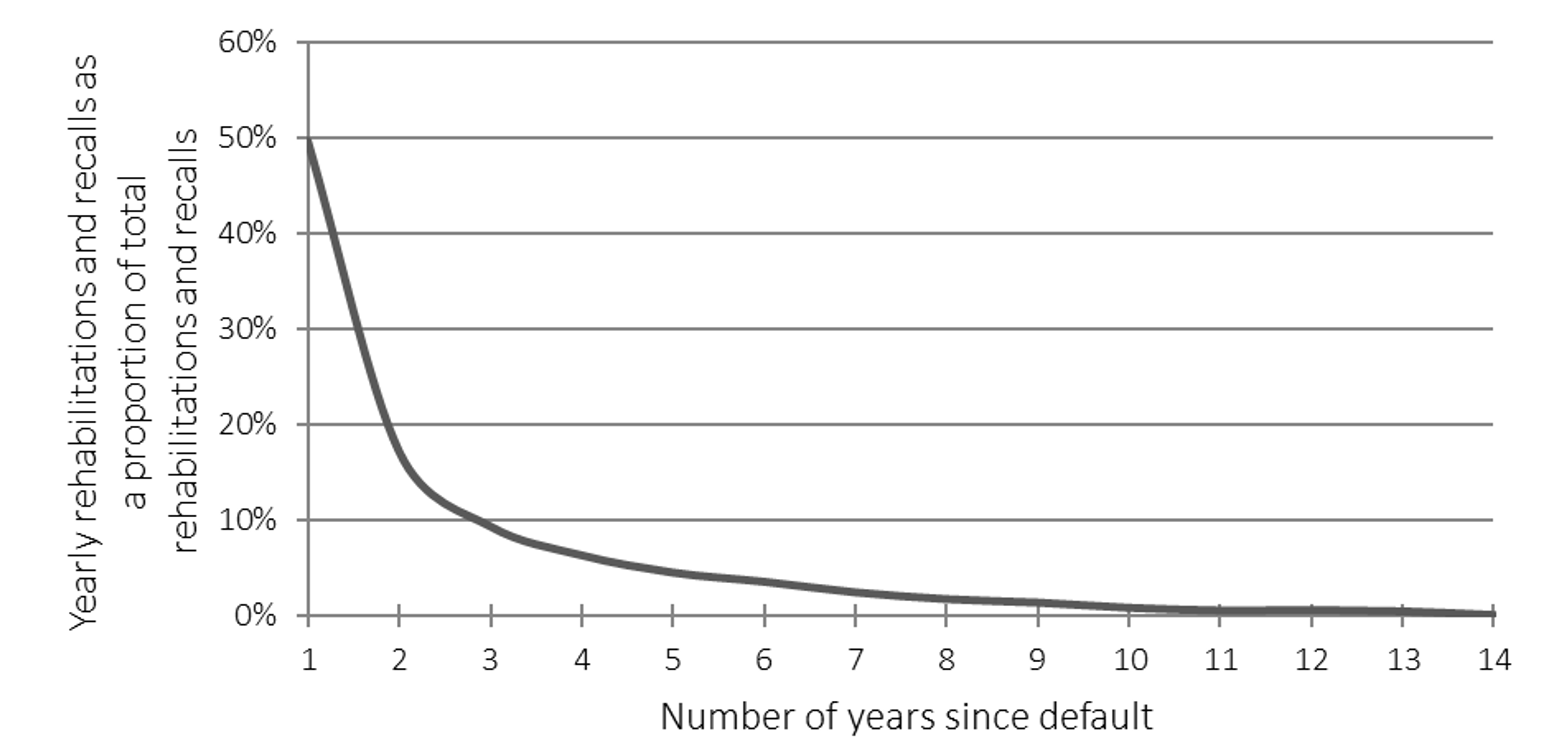
Chart 8 - Text version
| Number of years since default | Yearly rehabilitations and recalls as a proportion of total rehabilitations and recalls |
|---|---|
| 1 | 49.7% |
| 2 | 17.3% |
| 3 | 9.4% |
| 4 | 6.4% |
| 5 | 4.6% |
| 6 | 3.7% |
| 7 | 2.6% |
| 8 | 1.8% |
| 9 | 1.5% |
| 10 | 0.9% |
| 11 | 0.6% |
| 12 | 0.7% |
| 13 | 0.6% |
| 14 | 0.2% |
C.7.2.3 Recovery rate
Recoveries represent monies the program is able to recuperate after loans have defaulted. CRA is responsible for collecting this money on behalf of the program. Recoveries are analysed based on the default year after consolidation. The long-term recovery rate for a default cohort is assumed to be 35.0% (slightly decreased from 36.0% in the previous report). This assumption is based on historical experience but adjusted upward due to recoveries being applicable to principal only rather than split between principal and outstanding accrued interest.
The short-term recovery rate (academic year 2025-2026) is adjusted to reflect recent experience (Section C.7.2.4).
Chart 9 shows the recovery distribution once a loan is transferred in default.
Chart 9 Recovery distribution over 30 years
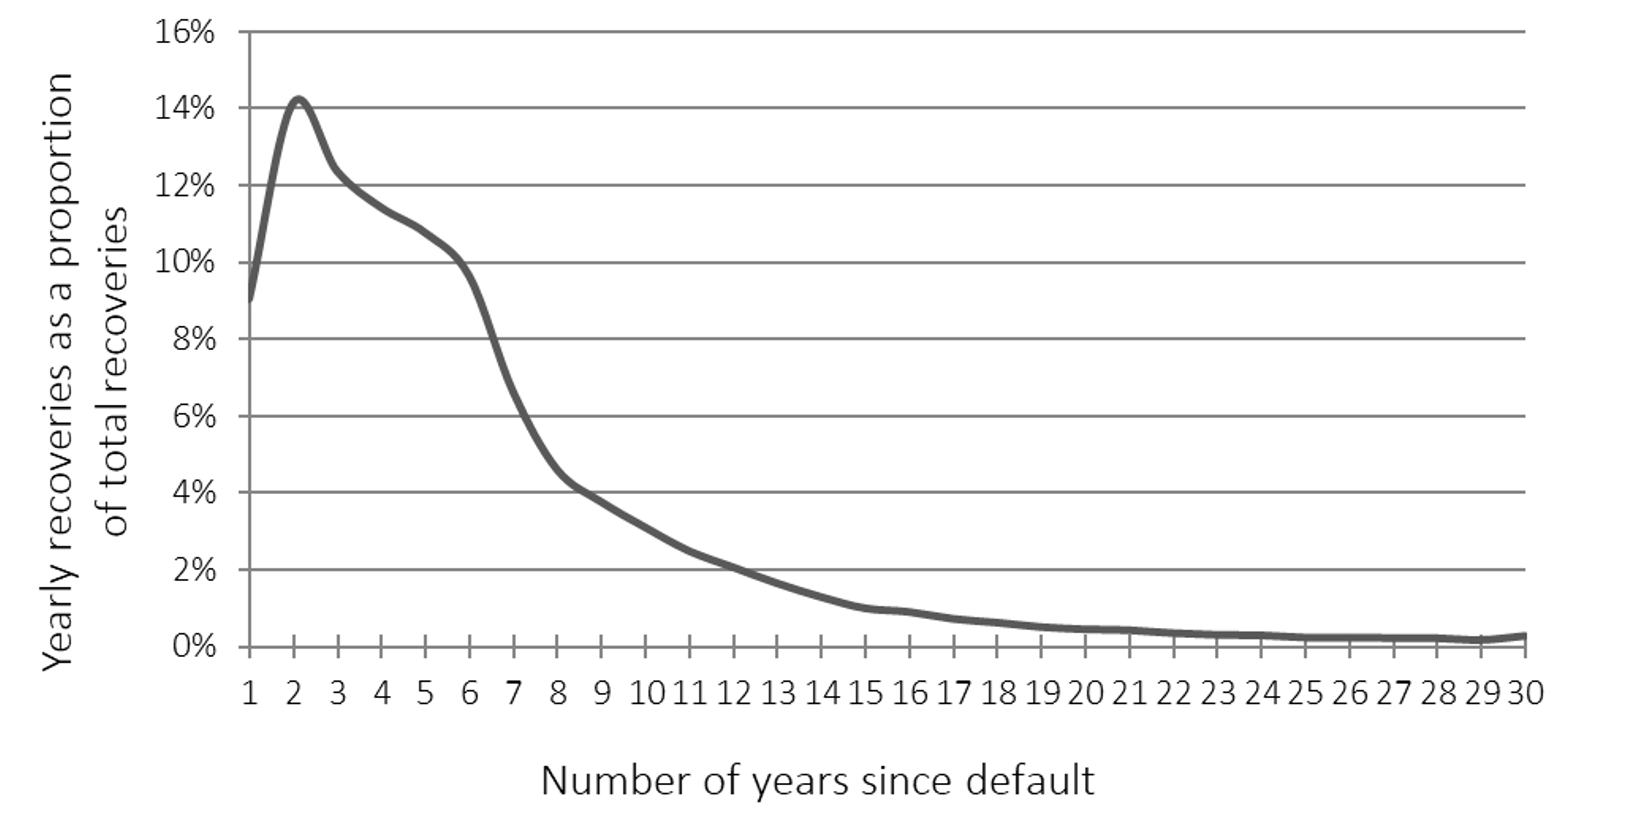
Chart 9 - Text version
| Number of years since default | Yearly recoveries as a proportion of total recoveries |
|---|---|
| 1 | 9.0% |
| 2 | 14.1% |
| 3 | 12.4% |
| 4 | 11.4% |
| 5 | 10.8% |
| 6 | 9.7% |
| 7 | 6.6% |
| 8 | 4.6% |
| 9 | 3.8% |
| 10 | 3.1% |
| 11 | 2.5% |
| 12 | 2.1% |
| 13 | 1.6% |
| 14 | 1.3% |
| 15 | 1.0% |
| 16 | 0.9% |
| 17 | 0.7% |
| 18 | 0.6% |
| 19 | 0.5% |
| 20 | 0.5% |
| 21 | 0.4% |
| 22 | 0.4% |
| 23 | 0.3% |
| 24 | 0.3% |
| 25 | 0.2% |
| 26 | 0.2% |
| 27 | 0.2% |
| 28 | 0.2% |
| 29 | 0.2% |
| 30 | 0.4% |
C.7.2.4 Short-term adjustments to the default assumptions
Table 41 provides the adjustments that were made to the default ultimate assumptions to set the short-term defaults, rehabilitations, recalls, and recoveries. These adjustments are gradually phased out as the experience is expected to transition from the partially known academic year 2025-2026 to the ultimate assumptions.
| Academic year | Multiplicative adjustments to gross defaults during the academic year | Multiplicative adjustments to rehabilitations and recalls during the academic year | Multiplicative adjustments to recoveries during the academic year |
|---|---|---|---|
| 2025-2026 | 110.8 | 90.8 | 92.5 |
| 2026-2027 | 108.0 | 95.4 | 100.0 |
| 2027-2028 | 106.0 | 100.0 | 100.0 |
| 2028-2029 | 104.0 | 100.0 | 100.0 |
| 2029-2030 | 102.0 | 100.0 | 100.0 |
| 2030-2031+ | 100.0 | 100.0 | 100.0 |
One potential driver of recent higher gross defaults and lower rehabilitations and recalls is the current economic climate, which could have made it more challenging for graduates to enter the workforce. As a result, this trend is expected to be temporary.
C.7.3 Bad debt - principal
The methodology used to calculate the allowance for bad debt – principal is based on the following components:
- For loans in-study:
- The consolidation assumption applied to all loans in-study (net of prepayments);
- The gross default assumption (including short-term adjustments); and
- The recalls and rehabilitations rate and the recovery rate assumptions (including short-term adjustments).
- For loans in repayment:
- The gross default assumption applied to all loans in repayment (including short-term adjustments); and
- The recalls and rehabilitations rate and the recovery rate assumptions (including short-term adjustments).
- For loans in default:
- The recalls and rehabilitations rate and the recovery rate assumptions applied to all loans in default (including short-term adjustments).
- The provision rate at any given date is equal to the sum of future write-offs (after the given date) divided by the expected outstanding loans (at the given date). This is done individually by the status of the loans at a given date (in-study, in repayment and in default).
The provision rates used for the projected allowance as at 31 July 2026 shown in this report are:
- 6.6% for loans in-study;
- 4.5% for loans in repayment; and
- 70.9% for loans in default.
The ultimate provision rates used in this report are (corresponding rates in the previous report are in brackets):
- 6.4% (5.8%) for loans in-study;
- 3.8% (4.3%) for loans in repayment; and
- 69.6% (69.0%) for loans in default.
The level of the total allowance is determined at the end of the academic year. The annual expense is equal to the difference between the total allowance at the end of a year and the total allowance at the end of the previous year net of write-offs that have occurred during the year (as shown in Table 17).
C.7.3.1 Allowance for loans in study
This allowance takes into account the net default rate adjusted to consider prepayments (payments received from students prior to consolidation). Based on experience, prepayments amount to approximately 10.0%. This results in a long-term provision rate for loans in study of:
C.7.3.2 Allowance for loans in repayment
This allowance is determined using projected future defaults according to the number of years since consolidation. The recovery rate assumption is then applied to determine the portion of projected defaulted loans that will not be recovered. This result corresponds to the allowance on the balance of loans in repayment. As mentioned previously, the long-term recovery rate for each gross default cohort is expected to be 35.0%; hence, it is assumed that 65.0% (1 − 35.0%) of the projected gross defaulted loans will not be recovered.
The provision rate on outstanding loans in repayment is 3.8% in the long-term. This provision rate of 3.8% for loans in repayment is lower than the provision rate of 6.4% for loans in‑study since the portfolio in repayment includes cohorts of loans for which some defaults and partial reimbursements have already occurred, resulting in a lower inherent risk of loss for the remaining loans.
C.7.3.3 Allowance for loans in default
The last component of the allowance for bad debt – principal is the balance of loans in default that will not be recovered. It is determined by applying rehabilitation, recall and recovery assumptions to loans that have already transferred in default. Those assumptions are lower than for other portfolios since the portfolio in default includes cohorts of loans that have been transferred in default for a certain number of years and for which some rehabilitations, recalls and recoveries have already occurred. Thus, the remaining loans have aged and have an increased risk of loss.
The long-term provision rate is equal to 69.6%.
C.7.4 Bad debt - interest
The methodology used to calculate the allowance for bad debt – interest is based on the following components:
- Starting point includes all active borrowers in default as at 31 July 2025;
- The historical experience is used to calculate, for each year, the probabilities of:
- Rehabilitating the loan;
- Having a non-CRA recovery and the amount of the recovery;
- Having a CRA recovery and the amount of the recovery;
- Writing off the loan (assumed to be 100% for the 30th year).
- Expected experience is generated for each individual borrower and for all future academic years (capped at 30 years after a borrower transferred in default) using the previously calculated probabilities; and
- The provision rate at any given date is equal to the sum of future write-offs (after the given date) divided by the expected outstanding interest balance (at the given date).
Provision rates can be estimated for each year since default, as shown in Table 42. The provision rate is 39.6% of interest accrued in the first year after loans are transferred into default. It increases in each of the six subsequent years before remaining at around 65% for the years after (a significant amount is written off when the six-year limitation period after the consolidation is reached). The aggregate provision rate is equal to 68.1% (66.2% as at 31 July 2025 in the previous report) of the outstanding default interest portfolio as at 31 July 2026.
| Year since default | Provision rates - academic year 2025-2026 |
|---|---|
| 1st | 39.6 |
| 2nd | 52.8 |
| 3rd | 47.0 |
| 4th | 66.5 |
| 5th | 76.0 |
| 6th | 81.6 |
| 7th | 61.0 |
| 8th | 55.8 |
| 9th | 60.1 |
| 10th | 59.2 |
| 11th | 61.7 |
| 12th | 63.5 |
| 13th | 63.4 |
| 14th | 67.7 |
| 15th | 69.6 |
| 16th | 67.2 |
| 17th | 69.4 |
| 18th | 69.9 |
| 19th | 70.7 |
| 20th | 73.4 |
| 21st | 70.8 |
| 22nd | 73.7 |
| 23rd | 73.5 |
Table 42 Footnotes
| |
The annual expense is equal to the difference between the total allowance at the end of a year and the total allowance at the end of the previous year net of write-offs that have occurred during the year (as shown in Table 18).
Appendix - D New loans and grants by institution type
The next four tables present the number of recipients as well as the amounts issued by institution type for both loans and grants.
| Academic year | University | Public college | Private college | Total |
|---|---|---|---|---|
| 2024-2025 | 320 | 176 | 120 | 617 |
| 2025-2026 | 346 | 188 | 116 | 650 |
| 2026-2027 | 342 | 187 | 83 | 612 |
| 2027-2028 | 338 | 187 | 83 | 607 |
| 2028-2029 | 335 | 186 | 82 | 603 |
| 2029-2030 | 331 | 185 | 81 | 597 |
| 2030-2031 | 327 | 184 | 80 | 592 |
| 2031-2032 | 327 | 184 | 80 | 591 |
| 2032-2033 | 326 | 184 | 80 | 590 |
| 2033-2034 | 323 | 182 | 79 | 584 |
| 2034-2035 | 320 | 180 | 79 | 579 |
| 2035-2036 | 317 | 178 | 78 | 573 |
| 2036-2037 | 314 | 176 | 77 | 568 |
| 2037-2038 | 311 | 175 | 77 | 563 |
| 2038-2039 | 308 | 172 | 76 | 556 |
| 2039-2040 | 304 | 171 | 76 | 551 |
| 2040-2041 | 301 | 170 | 75 | 546 |
| 2041-2042 | 298 | 169 | 74 | 541 |
| 2042-2043 | 296 | 168 | 74 | 537 |
| 2043-2044 | 293 | 167 | 74 | 533 |
| 2044-2045 | 291 | 166 | 73 | 531 |
| 2045-2046 | 290 | 166 | 73 | 529 |
| 2046-2047 | 289 | 166 | 73 | 528 |
| 2047-2048 | 289 | 166 | 73 | 527 |
| 2048-2049 | 289 | 166 | 73 | 527 |
| 2049-2050 | 288 | 166 | 72 | 526 |
The proportion of university, public college and private college students receiving a grant is relatively stable from academic year 2026-2027 to the end of the projection at about 55%, 31% and 14%, respectively.
The decrease in the number of private college students receiving a grant between the academic years 2025-2026 and 2026-2027 is due to the new measure that limits access to the Canada Student Grants for Full-Time Students to students attending public educational institutions and not-for-profit private institutions.
| Academic year | University | Public college | Private college | Total |
|---|---|---|---|---|
| 2024-2025 | 1,331 | 752 | 590 | 2,673 |
| 2025-2026 | 1,459 | 812 | 569 | 2,839 |
| 2026-2027 | 1,438 | 805 | 340 | 2,583 |
| 2027-2028 | 1,022 | 576 | 241 | 1,839 |
| 2028-2029 | 1,011 | 573 | 240 | 1,824 |
| 2029-2030 | 999 | 570 | 238 | 1,808 |
| 2030-2031 | 988 | 568 | 237 | 1,793 |
| 2031-2032 | 988 | 567 | 237 | 1,792 |
| 2032-2033 | 986 | 566 | 237 | 1,789 |
| 2033-2034 | 980 | 564 | 236 | 1,780 |
| 2034-2035 | 973 | 560 | 235 | 1,768 |
| 2035-2036 | 965 | 557 | 234 | 1,756 |
| 2036-2037 | 961 | 555 | 233 | 1,749 |
| 2037-2038 | 955 | 553 | 232 | 1,740 |
| 2038-2039 | 947 | 549 | 231 | 1,727 |
| 2039-2040 | 939 | 546 | 230 | 1,716 |
| 2040-2041 | 932 | 543 | 229 | 1,704 |
| 2041-2042 | 924 | 541 | 228 | 1,692 |
| 2042-2043 | 916 | 538 | 227 | 1,682 |
| 2043-2044 | 909 | 536 | 226 | 1,672 |
| 2044-2045 | 905 | 534 | 226 | 1,665 |
| 2045-2046 | 902 | 534 | 225 | 1,662 |
| 2046-2047 | 901 | 534 | 225 | 1,660 |
| 2047-2048 | 901 | 533 | 225 | 1,659 |
| 2048-2049 | 902 | 534 | 226 | 1,662 |
| 2049-2050 | 902 | 534 | 226 | 1,662 |
The proportion of university, public college and private college grants disbursed is relatively stable from academic year 2026-2027 to the end of the projection at about 54%, 32% and 14%, respectively.
The decrease in the grants disbursed for private college students between the academic years 2025-2026 and 2026-2027 is due to the new measure that limits access to the Canada Student Grants for Full-Time Students to students attending public educational institutions and not-for-profit private institutions.
| Academic year | University | Public college | Private college | Total |
|---|---|---|---|---|
| 2024-2025 | 361 | 186 | 163 | 710 |
| 2025-2026 | 376 | 197 | 192 | 765 |
| 2026-2027 | 375 | 198 | 192 | 765 |
| 2027-2028 | 373 | 196 | 178 | 748 |
| 2028-2029 | 373 | 197 | 179 | 748 |
| 2029-2030 | 371 | 197 | 179 | 748 |
| 2030-2031 | 370 | 198 | 180 | 748 |
| 2031-2032 | 373 | 199 | 181 | 754 |
| 2032-2033 | 375 | 201 | 182 | 758 |
| 2033-2034 | 376 | 201 | 183 | 760 |
| 2034-2035 | 376 | 201 | 183 | 761 |
| 2035-2036 | 376 | 202 | 183 | 761 |
| 2036-2037 | 377 | 202 | 184 | 763 |
| 2037-2038 | 378 | 203 | 184 | 765 |
| 2038-2039 | 377 | 203 | 184 | 765 |
| 2039-2040 | 377 | 203 | 185 | 765 |
| 2040-2041 | 377 | 204 | 185 | 765 |
| 2041-2042 | 376 | 204 | 185 | 766 |
| 2042-2043 | 376 | 204 | 186 | 766 |
| 2043-2044 | 376 | 205 | 186 | 767 |
| 2044-2045 | 377 | 206 | 187 | 769 |
| 2045-2046 | 378 | 207 | 188 | 773 |
| 2046-2047 | 381 | 208 | 189 | 778 |
| 2047-2048 | 383 | 209 | 190 | 783 |
| 2048-2049 | 387 | 211 | 192 | 789 |
| 2049-2050 | 389 | 212 | 193 | 795 |
The proportion of university, public college and private college students receiving a loan is relatively stable from academic year 2027-2028 to the end of the projection at about 49%, 27% and 24%, respectively.
| Academic year | University | Public college | Private college | Total |
|---|---|---|---|---|
| 2024-2025 | 2,710 | 1,174 | 1,683 | 5,567 |
| 2025-2026 | 2,939 | 1,316 | 1,920 | 6,176 |
| 2026-2027 | 2,972 | 1,344 | 2,018 | 6,334 |
| 2027-2028 | 2,435 | 1,119 | 1,535 | 5,089 |
| 2028-2029 | 2,449 | 1,133 | 1,543 | 5,126 |
| 2029-2030 | 2,460 | 1,146 | 1,550 | 5,156 |
| 2030-2031 | 2,471 | 1,161 | 1,559 | 5,190 |
| 2031-2032 | 2,507 | 1,179 | 1,573 | 5,259 |
| 2032-2033 | 2,536 | 1,196 | 1,587 | 5,318 |
| 2033-2034 | 2,556 | 1,209 | 1,595 | 5,359 |
| 2034-2035 | 2,571 | 1,219 | 1,601 | 5,392 |
| 2035-2036 | 2,584 | 1,230 | 1,608 | 5,421 |
| 2036-2037 | 2,602 | 1,242 | 1,618 | 5,462 |
| 2037-2038 | 2,615 | 1,254 | 1,625 | 5,495 |
| 2038-2039 | 2,619 | 1,263 | 1,627 | 5,510 |
| 2039-2040 | 2,625 | 1,273 | 1,632 | 5,529 |
| 2040-2041 | 2,628 | 1,282 | 1,636 | 5,546 |
| 2041-2042 | 2,630 | 1,291 | 1,643 | 5,564 |
| 2042-2043 | 2,634 | 1,301 | 1,648 | 5,582 |
| 2043-2044 | 2,637 | 1,310 | 1,653 | 5,601 |
| 2044-2045 | 2,647 | 1,321 | 1,662 | 5,631 |
| 2045-2046 | 2,662 | 1,334 | 1,672 | 5,668 |
| 2046-2047 | 2,682 | 1,347 | 1,683 | 5,713 |
| 2047-2048 | 2,701 | 1,360 | 1,696 | 5,758 |
| 2048-2049 | 2,728 | 1,375 | 1,710 | 5,813 |
| 2049-2050 | 2,751 | 1,388 | 1,723 | 5,862 |
The proportion of university, public college, and private college loans issued is relatively stable from academic year 2027-2028 to the end of the projection at about 47%, 24% and 29%, respectively.
Appendix - E Number of borrowers in the Repayment Assistance Plan
The projection of the average number of borrowers expected in each RAP category (RAP–Stage 1, RAP–Stage 2 and RAP–D) over the next 25 years is shown in Table 47. The average number of borrowers were determined using a methodology similar to the one used to calculate the RAP utilization (tables 37 to 39), but by substituting average annual headcounts for average outstanding loans.
| Academic year | RAP-1 | RAP-2 | RAP-D | Total |
|---|---|---|---|---|
| 2024-2025 | 148 | 46 | 23 | 217 |
| 2025-2026 | 155 | 47 | 26 | 228 |
| 2026-2027 | 161 | 49 | 28 | 238 |
| 2027-2028 | 167 | 50 | 29 | 246 |
| 2028-2029 | 171 | 50 | 31 | 251 |
| 2029-2030 | 174 | 51 | 32 | 256 |
| 2030-2031 | 176 | 52 | 33 | 261 |
| 2031-2032 | 177 | 54 | 34 | 265 |
| 2032-2033 | 178 | 56 | 34 | 268 |
| 2033-2034 | 179 | 58 | 35 | 272 |
| 2034-2035 | 180 | 61 | 35 | 275 |
| 2035-2036 | 180 | 62 | 35 | 277 |
| 2036-2037 | 180 | 63 | 35 | 279 |
| 2037-2038 | 181 | 65 | 35 | 280 |
| 2038-2039 | 181 | 65 | 35 | 282 |
| 2039-2040 | 181 | 66 | 35 | 282 |
| 2040-2041 | 182 | 66 | 35 | 283 |
| 2041-2042 | 182 | 66 | 35 | 283 |
| 2042-2043 | 182 | 66 | 35 | 283 |
| 2043-2044 | 182 | 66 | 35 | 284 |
| 2044-2045 | 182 | 66 | 35 | 284 |
| 2045-2046 | 182 | 67 | 35 | 284 |
| 2046-2047 | 183 | 67 | 35 | 285 |
| 2047-2048 | 183 | 67 | 36 | 285 |
| 2048-2049 | 184 | 67 | 36 | 286 |
| 2049-2050 | 184 | 67 | 36 | 287 |
Appendix - F Defaulted loans portfolio projection
The defaulted loans portfolio projections by institution type are provided in tables 48 to 53. These projections are calculated using a methodology similar to the one used to calculate the aggregate defaulted loans portfolio projection. Per institutions components may not sum to the aggregate default portfolio due to rounding.
| Academic year | Opening balance 1 August (1) | New defaulted loans (2) | Collected loans (3) | Write-offs (4) | Closing balance 31 July (1+2) - (3+4) |
|---|---|---|---|---|---|
| 2024-2025 | 967 | 124 | 45 | 59 | 987 |
| 2025-2026 | 987 | 141 | 50 | 59 | 1,019 |
| 2026-2027 | 1,019 | 139 | 58 | 71 | 1,029 |
| 2027-2028 | 1,029 | 139 | 59 | 190 | 918 |
| 2028-2029 | 918 | 142 | 62 | 59 | 939 |
| 2029-2030 | 939 | 143 | 63 | 58 | 961 |
| 2030-2031 | 961 | 143 | 65 | 56 | 983 |
| 2031-2032 | 983 | 146 | 66 | 61 | 1,002 |
| 2032-2033 | 1,002 | 148 | 67 | 66 | 1,017 |
| 2033-2034 | 1,017 | 149 | 68 | 65 | 1,033 |
| 2034-2035 | 1,033 | 151 | 69 | 67 | 1,048 |
| 2035-2036 | 1,048 | 152 | 70 | 68 | 1,062 |
| 2036-2037 | 1,062 | 154 | 71 | 70 | 1,075 |
| 2037-2038 | 1,075 | 156 | 72 | 72 | 1,087 |
| 2038-2039 | 1,087 | 157 | 73 | 73 | 1,098 |
| 2039-2040 | 1,098 | 158 | 74 | 74 | 1,108 |
| 2040-2041 | 1,108 | 159 | 75 | 75 | 1,118 |
| 2041-2042 | 1,118 | 159 | 75 | 75 | 1,126 |
| 2042-2043 | 1,126 | 160 | 76 | 75 | 1,135 |
| 2043-2044 | 1,135 | 160 | 77 | 75 | 1,143 |
| 2044-2045 | 1,143 | 161 | 77 | 76 | 1,152 |
| 2045-2046 | 1,152 | 161 | 77 | 76 | 1,159 |
| 2046-2047 | 1,159 | 162 | 78 | 77 | 1,166 |
| 2047-2048 | 1,166 | 162 | 78 | 77 | 1,172 |
| 2048-2049 | 1,172 | 163 | 79 | 78 | 1,179 |
| 2049-2050 | 1,179 | 163 | 79 | 78 | 1,185 |
| Academic year | Opening balance 1 August (1) | New defaulted loans (2) | Collected loans (3) | Write-offs (4) | Closing balance 31 July (1+2) - (3+4) |
|---|---|---|---|---|---|
| 2024-2025 | 836 | 104 | 55 | 59 | 827 |
| 2025-2026 | 827 | 129 | 44 | 56 | 856 |
| 2026-2027 | 856 | 130 | 50 | 59 | 877 |
| 2027-2028 | 877 | 132 | 52 | 169 | 788 |
| 2028-2029 | 788 | 135 | 54 | 54 | 814 |
| 2029-2030 | 814 | 134 | 55 | 53 | 840 |
| 2030-2031 | 840 | 133 | 57 | 51 | 865 |
| 2031-2032 | 865 | 136 | 58 | 55 | 889 |
| 2032-2033 | 889 | 139 | 59 | 62 | 907 |
| 2033-2034 | 907 | 141 | 60 | 63 | 926 |
| 2034-2035 | 926 | 144 | 60 | 65 | 944 |
| 2035-2036 | 944 | 145 | 61 | 67 | 961 |
| 2036-2037 | 961 | 148 | 63 | 67 | 979 |
| 2037-2038 | 979 | 150 | 63 | 69 | 996 |
| 2038-2039 | 996 | 152 | 64 | 70 | 1,013 |
| 2039-2040 | 1,013 | 153 | 65 | 71 | 1,030 |
| 2040-2041 | 1,030 | 155 | 66 | 73 | 1,046 |
| 2041-2042 | 1,046 | 156 | 67 | 74 | 1,061 |
| 2042-2043 | 1,061 | 157 | 68 | 75 | 1,076 |
| 2043-2044 | 1,076 | 159 | 69 | 76 | 1,090 |
| 2044-2045 | 1,090 | 160 | 69 | 77 | 1,103 |
| 2045-2046 | 1,103 | 161 | 70 | 78 | 1,116 |
| 2046-2047 | 1,116 | 163 | 71 | 79 | 1,129 |
| 2047-2048 | 1,129 | 164 | 72 | 80 | 1,141 |
| 2048-2049 | 1,141 | 165 | 72 | 81 | 1,153 |
| 2049-2050 | 1,153 | 167 | 73 | 82 | 1,165 |
| Academic year | Opening balance 1 August (1) | New defaulted loans (2) | Collected loans (3) | Write-offs (4) | Closing balance 31 July (1+2) - (3+4) |
|---|---|---|---|---|---|
| 2024-2025 | 723 | 141 | 33 | 52 | 779 |
| 2025-2026 | 779 | 196 | 38 | 51 | 886 |
| 2026-2027 | 886 | 219 | 48 | 45 | 1,012 |
| 2027-2028 | 1,012 | 241 | 55 | 136 | 1,062 |
| 2028-2029 | 1,062 | 263 | 64 | 51 | 1,209 |
| 2029-2030 | 1,209 | 266 | 72 | 62 | 1,342 |
| 2030-2031 | 1,342 | 266 | 79 | 68 | 1,461 |
| 2031-2032 | 1,461 | 274 | 86 | 74 | 1,575 |
| 2032-2033 | 1,575 | 282 | 91 | 89 | 1,677 |
| 2033-2034 | 1,677 | 289 | 96 | 102 | 1,767 |
| 2034-2035 | 1,767 | 295 | 101 | 112 | 1,849 |
| 2035-2036 | 1,849 | 299 | 105 | 122 | 1,922 |
| 2036-2037 | 1,922 | 303 | 109 | 126 | 1,989 |
| 2037-2038 | 1,989 | 306 | 112 | 130 | 2,053 |
| 2038-2039 | 2,053 | 308 | 115 | 137 | 2,110 |
| 2039-2040 | 2,110 | 310 | 117 | 141 | 2,161 |
| 2040-2041 | 2,161 | 311 | 119 | 146 | 2,206 |
| 2041-2042 | 2,206 | 312 | 121 | 151 | 2,246 |
| 2042-2043 | 2,246 | 312 | 123 | 155 | 2,281 |
| 2043-2044 | 2,281 | 314 | 124 | 159 | 2,311 |
| 2044-2045 | 2,311 | 315 | 125 | 162 | 2,339 |
| 2045-2046 | 2,339 | 316 | 126 | 164 | 2,365 |
| 2046-2047 | 2,365 | 317 | 127 | 166 | 2,388 |
| 2047-2048 | 2,388 | 318 | 128 | 168 | 2,411 |
| 2048-2049 | 2,411 | 320 | 129 | 171 | 2,431 |
| 2049-2050 | 2,431 | 321 | 130 | 172 | 2,450 |
| Academic year | Opening balance 1 August (1) | Interest transferred in default (2) | Interest accrued (3) | Interest collected (4) | Write-offs (5) | Closing balance 31 July (1+2+3) - (4+5) |
|---|---|---|---|---|---|---|
| 2024-2025 | 81 | −1 | 6 | 6 | 9 | 70 |
| 2025-2026 | 70 | -no data | -no data | 4 | 7 | 59 |
| 2026-2027 | 59 | -no data | -no data | 3 | 6 | 49 |
| 2027-2028 | 49 | -no data | -no data | 2 | 6 | 41 |
| 2028-2029 | 41 | -no data | -no data | 2 | 5 | 34 |
| 2029-2030 | 34 | -no data | -no data | 2 | 3 | 30 |
| 2030-2031 | 30 | -no data | -no data | 1 | 2 | 26 |
| 2031-2032 | 26 | -no data | -no data | 1 | 2 | 23 |
| 2032-2033 | 23 | -no data | -no data | 1 | 2 | 20 |
| 2033-2034 | 20 | -no data | -no data | 1 | 2 | 17 |
| 2034-2035 | 17 | -no data | -no data | 1 | 2 | 15 |
| 2035-2036 | 15 | -no data | -no data | 1 | 2 | 12 |
| 2036-2037 | 12 | -no data | -no data | 1 | 2 | 10 |
| 2037-2038 | 10 | -no data | -no data | 0 | 2 | 8 |
| 2038-2039 | 8 | -no data | -no data | 0 | 1 | 6 |
| 2039-2040 | 6 | -no data | -no data | 0 | 1 | 5 |
| 2040-2041 | 5 | -no data | -no data | 0 | 1 | 3 |
| 2041-2042 | 3 | -no data | -no data | 0 | 1 | 2 |
| 2042-2043 | 2 | -no data | -no data | 0 | 1 | 1 |
| 2043-2044 | 1 | -no data | -no data | 0 | 0 | 1 |
| 2044-2045 | 1 | -no data | -no data | 0 | 0 | 0 |
| 2045-2046 | 0 | -no data | -no data | 0 | 0 | 0 |
| 2046-2047+ | -no data | -no data | -no data | -no data | -no data | -no data |
| Academic year | Opening balance 1 August (1) | Interest transferred in default (2) | Interest accrued (3) | Interest collected (4) | Write-offs (5) | Closing balance 31 July (1+2+3) - (4+5) |
|---|---|---|---|---|---|---|
| 2024-2025 | 61 | −1 | 4 | 5 | 8 | 52 |
| 2025-2026 | 52 | -no data | -no data | 3 | 5 | 43 |
| 2026-2027 | 43 | -no data | -no data | 3 | 5 | 35 |
| 2027-2028 | 35 | -no data | -no data | 2 | 4 | 29 |
| 2028-2029 | 29 | -no data | -no data | 2 | 4 | 24 |
| 2029-2030 | 24 | -no data | -no data | 1 | 2 | 20 |
| 2030-2031 | 20 | -no data | -no data | 1 | 2 | 18 |
| 2031-2032 | 18 | -no data | -no data | 1 | 1 | 15 |
| 2032-2033 | 15 | -no data | -no data | 1 | 2 | 13 |
| 2033-2034 | 13 | -no data | -no data | 1 | 1 | 11 |
| 2034-2035 | 11 | -no data | -no data | 1 | 1 | 9 |
| 2035-2036 | 9 | -no data | -no data | 0 | 1 | 7 |
| 2036-2037 | 7 | -no data | -no data | 0 | 1 | 6 |
| 2037-2038 | 6 | -no data | -no data | 0 | 1 | 5 |
| 2038-2039 | 5 | -no data | -no data | 0 | 1 | 3 |
| 2039-2040 | 3 | -no data | -no data | 0 | 1 | 2 |
| 2040-2041 | 2 | -no data | -no data | 0 | 1 | 2 |
| 2041-2042 | 2 | -no data | -no data | 0 | 1 | 1 |
| 2042-2043 | 1 | -no data | -no data | 0 | 0 | 1 |
| 2043-2044 | 1 | -no data | -no data | 0 | 0 | 0 |
| 2044-2045 | 0 | -no data | -no data | 0 | 0 | 0 |
| 2045-2046 | 0 | -no data | -no data | 0 | 0 | 0 |
| 2046-2047+ | -no data | -no data | -no data | -no data | -no data | -no data |
| Academic year | Opening balance 1 August (1) | Interest transferred in default (2) | Interest accrued (3) | Interest collected (4) | Write-offs (5) | Closing balance 31 July (1+2+3) - (4+5) |
|---|---|---|---|---|---|---|
| 2024-2025 | 40 | −1 | 2 | 3 | 7 | 32 |
| 2025-2026 | 32 | -no data | -no data | 2 | 5 | 24 |
| 2026-2027 | 24 | -no data | -no data | 2 | 3 | 20 |
| 2027-2028 | 20 | -no data | -no data | 1 | 2 | 16 |
| 2028-2029 | 16 | -no data | -no data | 1 | 2 | 13 |
| 2029-2030 | 13 | -no data | -no data | 1 | 1 | 11 |
| 2030-2031 | 11 | -no data | -no data | 1 | 1 | 10 |
| 2031-2032 | 10 | -no data | -no data | 1 | 1 | 8 |
| 2032-2033 | 8 | -no data | -no data | 0 | 1 | 7 |
| 2033-2034 | 7 | -no data | -no data | 0 | 1 | 6 |
| 2034-2035 | 6 | -no data | -no data | 0 | 1 | 5 |
| 2035-2036 | 5 | -no data | -no data | 0 | 1 | 4 |
| 2036-2037 | 4 | -no data | -no data | 0 | 1 | 3 |
| 2037-2038 | 3 | -no data | -no data | 0 | 1 | 2 |
| 2038-2039 | 2 | -no data | -no data | 0 | 0 | 2 |
| 2039-2040 | 2 | -no data | -no data | 0 | 0 | 1 |
| 2040-2041 | 1 | -no data | -no data | 0 | 0 | 1 |
| 2041-2042 | 1 | -no data | -no data | 0 | 0 | 1 |
| 2042-2043 | 1 | -no data | -no data | 0 | 0 | 0 |
| 2043-2044 | 0 | -no data | -no data | 0 | 0 | 0 |
| 2044-2045 | 0 | -no data | -no data | 0 | 0 | 0 |
| 2045-2046 | 0 | -no data | -no data | 0 | 0 | 0 |
| 2046-2047+ | -no data | -no data | -no data | -no data | -no data | -no data |
Appendix - G Sensitivity tests
Actual experience over the projection period will likely deviate from the assumptions presented throughout this report. Particularly, the level of loans issued (presented in Table 6) has a significant impact on the aggregate amount of outstanding loans. This appendix presents the impact of varying the amount of loans issued on the aggregate amount of outstanding loans over the projection period. These tests were introduced because of the material change in the amount of loans issued over the past several years.
Three sensitivity tests are provided in this section:
- Sustained increase in amount of loans issued: starting in academic year 2026-2027 and for all future academic years, the amount of loans issued presented in Table 6 are increased by 10%;
- Sustained decrease in amount of loans issued: starting in academic year 2026-2027 and for all future academic years, the amount of loans issued presented in Table 6 are decreased by 10%; and
- Temporary increase in amount of loans issued: for academic years 2027-2028 to 2031-2032, the amount of loans issued presented in Table 6 are increased by 25%. The amount of loans issued starting in academic year 2032-2033 remains unchanged.
For purposes of these sensitivity tests, we have assumed that program provisions, data and assumptions that would normally be used to determine the amount of loans issued (such as covered population, post-secondary enrolment, loan uptake rate and average loans) are implicitly modified in order to result in the overall modified amount of loans issued. All other assumptions shown in Appendix C remain unchanged in these sensitivity tests.
Table 54 presents the amount of loans issued under the best-estimate assumptions (from Table 6) and under the three sensitivity tests.
| Academic year | Current best-estimate | Sustained 10% increase | Sustained 10% decrease | Temporary (5 years) 25% increase |
|---|---|---|---|---|
| 2024-2025 | 5,567 | 5,567 | 5,567 | 5,567 |
| 2025-2026 | 6,176 | 6,176 | 6,176 | 6,176 |
| 2026-2027 | 6,334 | 6,968 | 5,701 | 6,334 |
| 2027-2028 | 5,089 | 5,597 | 4,580 | 6,361 |
| 2028-2029 | 5,126 | 5,638 | 4,613 | 6,407 |
| 2029-2030 | 5,156 | 5,672 | 4,641 | 6,446 |
| 2030-2031 | 5,190 | 5,709 | 4,671 | 6,488 |
| 2031-2032 | 5,259 | 5,784 | 4,733 | 6,573 |
| 2032-2033 | 5,318 | 5,850 | 4,786 | 5,318 |
| 2033-2034 | 5,359 | 5,895 | 4,823 | 5,359 |
| 2034-2035 | 5,392 | 5,931 | 4,853 | 5,392 |
| 2035-2036 | 5,421 | 5,963 | 4,879 | 5,421 |
| 2036-2037 | 5,462 | 6,008 | 4,916 | 5,462 |
| 2037-2038 | 5,495 | 6,044 | 4,945 | 5,495 |
| 2038-2039 | 5,510 | 6,061 | 4,959 | 5,510 |
| 2039-2040 | 5,529 | 6,082 | 4,976 | 5,529 |
| 2040-2041 | 5,546 | 6,101 | 4,992 | 5,546 |
| 2041-2042 | 5,564 | 6,121 | 5,008 | 5,564 |
| 2042-2043 | 5,582 | 6,141 | 5,024 | 5,582 |
| 2043-2044 | 5,601 | 6,161 | 5,041 | 5,601 |
| 2044-2045 | 5,631 | 6,194 | 5,068 | 5,631 |
| 2045-2046 | 5,668 | 6,235 | 5,101 | 5,668 |
| 2046-2047 | 5,713 | 6,284 | 5,141 | 5,713 |
| 2047-2048 | 5,758 | 6,334 | 5,182 | 5,758 |
| 2048-2049 | 5,813 | 6,395 | 5,232 | 5,813 |
| 2049-2050 | 5,862 | 6,448 | 5,276 | 5,862 |
Table 55 presents the projection of the estimated peak of the aggregate amount of outstanding loans. More details on the estimated peak are presented in Section 4.2.5.
Under the best-estimate scenario, the aggregate amount of outstanding loans increases steadily over the projection period until it reaches an amount just under $50 billion in 2049-2050. The $40 billion limit is expected to be reached in the academic year 2029-2030.
Under the sustained increase (10%) and sustained decrease (−10%) scenarios, the aggregate amount of outstanding loans increases steadily (slower increase under the sustained decrease scenario) to approach $55 billion and $45 billion, respectively, at the end of the projection period. The $40 billion limit is expected to be reached in the academic years 2028-2029 and 2032-2033, respectively.
Under the temporary increase scenario (25% for academic years 2027-2028 to 2031-2032), the aggregate amount of outstanding loans increases to a level just below $48 billion in 2031-2032 (when the temporary increase ends) where it remains relatively stable for the remainder of the projection period as it finally approaches $50 billion in 2049-2050. The $40 billion limit is expected to be reached in the academic year 2028-2029.
| Academic year | Current best-estimate | Sustained 10% increase | Sustained 10% decrease | Temporary (5 years) 25% increase |
|---|---|---|---|---|
| 2024-2025 | 29,196 | 29,196 | 29,196 | 29,196 |
| 2025-2026 | 32,471 | 32,471 | 32,471 | 32,471 |
| 2026-2027 | 35,518 | 36,003 | 35,035 | 35,518 |
| 2027-2028 | 37,650 | 38,655 | 36,647 | 38,622 |
| 2028-2029 | 38,883 | 40,377 | 37,390 | 41,096 |
| 2029-2030 | 40,156 | 42,098 | 38,214 | 43,601 |
| 2030-2031 | 41,248 | 43,593 | 38,903 | 45,845 |
| 2031-2032 | 42,238 | 44,946 | 39,530 | 47,886 |
| 2032-2033 | 43,139 | 46,174 | 40,103 | 48,720 |
| 2033-2034 | 43,929 | 47,257 | 40,599 | 49,066 |
| 2034-2035 | 44,621 | 48,211 | 41,031 | 49,232 |
| 2035-2036 | 45,223 | 49,042 | 41,404 | 49,308 |
| 2036-2037 | 45,753 | 49,771 | 41,734 | 49,344 |
| 2037-2038 | 46,231 | 50,422 | 42,040 | 49,367 |
| 2038-2039 | 46,656 | 50,995 | 42,318 | 49,370 |
| 2039-2040 | 47,022 | 51,485 | 42,559 | 49,346 |
| 2040-2041 | 47,339 | 51,907 | 42,771 | 49,306 |
| 2041-2042 | 47,621 | 52,275 | 42,966 | 49,264 |
| 2042-2043 | 47,875 | 52,599 | 43,150 | 49,230 |
| 2043-2044 | 48,117 | 52,897 | 43,337 | 49,216 |
| 2044-2045 | 48,359 | 53,188 | 43,532 | 49,232 |
| 2045-2046 | 48,609 | 53,480 | 43,739 | 49,288 |
| 2046-2047 | 48,873 | 53,784 | 43,962 | 49,390 |
| 2047-2048 | 49,153 | 54,103 | 44,204 | 49,541 |
| 2048-2049 | 49,456 | 54,445 | 44,469 | 49,748 |
| 2049-2050 | 49,777 | 54,804 | 44,751 | 50,000 |