Employment Insurance Premium Rate Actuarial Report: 2023 Highlights
Report type
Employment Insurance
Published date
Message from the Actuary
The 7-year forecast break-even rate decreases from 1.81% in 2022 to 1.74% in 2023.
The maximum premium rate the Commission may set in 2023 is 1.63%. This rate reflects the limit to the annual variation in the premium rate of 0.05% established in the EI Act. The EI premium rate in 2022 is 1.58%.
Overview of financing
7-year forecast break-even rate
Single rate required over the next 7 years to:
- Pay for the expected expenditures, and
- Eliminate the projected deficit/surplus that has accumulated in the EI Operating Account.
Premium rate
Actual premium rate paid by employees for a given year – employers usually pay 1.4 times the premium rate.
Reductions
Premium reductions are available to provinces and to employers who have a plan that reduces benefits payable by the EI program.
Quick facts (2023)
- $61,500 Maximum Insurable Earnings
- 1.74% 7-Year Forecast Break-Even Rate
- 0.36% Reduction for Provincial Plans (Québec)
- $1,345 M Estimated Reduction for Qualified Wage-Loss Plans
- $(25.2) B Projected End of Year EI Operating Account
Recent program changes
Temporary – Increasing benefits and facilitating access to EI in response to the COVID-19 pandemic.
Permanent – Increasing the number of sickness benefits from 15 to 26 weeks.
Rates and multipliers
| Canada (excl. Québec) |
Québec | |
|---|---|---|
| 7-year forecast break-even rate | 1.74% | 1.38% |
| 2023 maximum premium rate | 1.63% | 1.27% |
| Employer multiplier | 1.4 | 1.4 |
| Canada (excl. Québec) |
Québec | |
|---|---|---|
| Category 1 | 0.25% / 1.249 | 0.25% / 1.206 |
| Category 2 | 0.39% / 1.160 | 0.39% / 1.092 |
| Category 3 | 0.39% / 1.163 | 0.39% / 1.096 |
| Category 4 | 0.42% / 1.140 | 0.42% / 1.066 |
Projection of the EI operating account using the 7-year forecast break-even rate
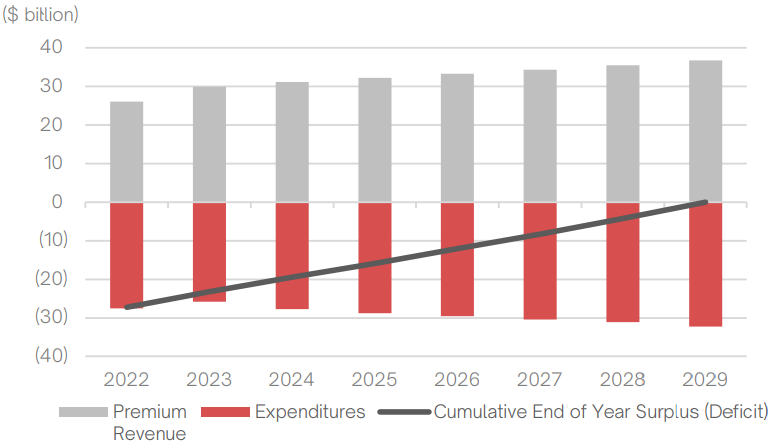
Projection of the EI operating account ($ billion) - Table
| Year | Premium Revenue | Expenditures | Cumulative Annual Surplus (Deficit) |
|---|---|---|---|
| 2022 | 26.1 | -27.5 | -27.3 |
| 2023 | 29.9 | -25.8 | -23.1 |
| 2024 | 31.2 | -27.7 | -19.5 |
| 2025 | 32.2 | -28.8 | -15.9 |
| 2026 | 33.3 | -29.5 | -12 |
| 2027 | 34.3 | -30.4 | -8.3 |
| 2028 | 35.5 | -31.1 | -4.2 |
| 2029 | 36.7 | -32.2 | 0 |
Reconciliation of the 7-year forecast break-even rate
- 1.81002022 Actuarial Report
- 0.0186EI Operating Account as at 31 December 2021
- -0.0261 Change in Unemployment Rate Assumptions
- -0.0070 Changes in Earnings Base
- 0.0048 Changes in Expenditures
- -0.0504 Updated Cost for Program Changes
- -0.0075 Change in 7-year period
- 1.74002023 Actuarial Report
Part I expenditures for 2023 - $22 billion
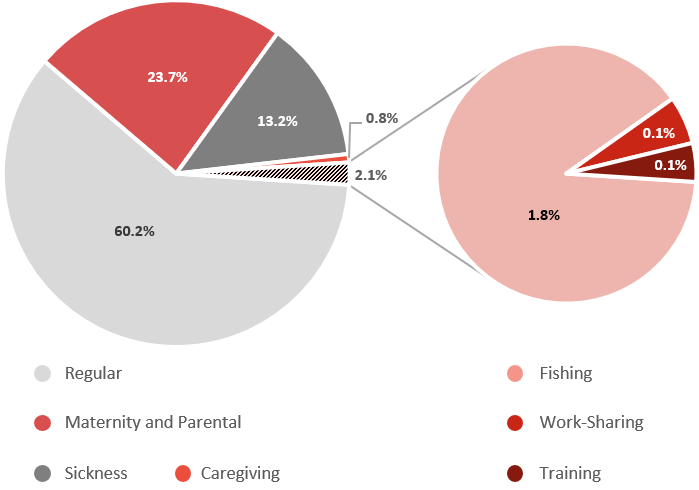
Part I expenditures for 2023 - Table
| (%) | |
|---|---|
| Regular | 60.2 |
| Maternity and Parental | 23.7 |
| Sickness | 13.2 |
| Caregiving | 0.8 |
| Fishing | 1.8 |
| Work-Sharing | 0.1 |
| Training | 0.1 |