Pension Plans for the Canadian Forces – Regular Force and Reserve Force as at 31 March 2022
The Honourable Anita Anand, P.C., M.P.
President of Treasury Board
Ottawa, Canada
K1A 0R5
Dear Minister,
Pursuant to section 6 of the Public Pensions Reporting Act, I am pleased to submit the report on the actuarial review as at 31 March 2022 of the Canadian Forces Pension Plans. This actuarial review is in respect of pension benefits and contributions of both the Regular Force Pension Plan and the Reserve Force Pension Plan. The Regular Force Pension Plan is established by Parts I, III and IV of the Canadian Forces Superannuation Act, includes the Canadian Forces-related benefits provided under the Special Retirement Arrangements Act, and is subject to the Pension Benefits Division Act. The Reserve Force Pension Plan is established by Part I.1 of the Canadian Forces Superannuation Act and subject to the Pension Benefits Division Act.
Yours sincerely,
Assia Billig, FCIA, FSA, PhD
Chief Actuary
Table of contents
List of tables
- Table 1 Ultimate best-estimate economic assumptions
- Table 2 Demographic assumptions as at 31 March 2022 and as at 31 March 2019
- Table 3 State of the Canadian Forces Superannuation Account
- Table 4 Balance sheet of the Canadian Forces Pension Fund
- Table 5 Financial position - Reserve Force Pension Fund
- Table 6 Reconciliation of financial position from plan year 2019 to 2022 by account
- Table 7 Experience gains and losses from plan year 2019 to 2022 by account
- Table 8 Impact of the revision of actuarial assumptions on the actuarial liability by account
- Table 9 Current service cost for plan year 2024
- Table 10 Reconciliation of current service cost by account
- Table 11 Member contribution rates by pension plan
- Table 12 Projection of current service cost of the CFPF on a plan year basis ($ millions)
- Table 13 Projection of current service cost of the CFPF on a plan year basis (% of pensionable payroll)
- Table 14 Projection of current service cost of the RFPF on a plan year basis ($ millions)
- Table 15 Projection of current service cost of the RFPF on a plan year basis (% of pensionable payroll)
- Table 16 CFPF current service cost on a calendar year basis ($ millions)
- Table 17 CFPF current service cost on a calendar year basis (% of pensionable payroll)
- Table 18 RFPF current service cost on a calendar year basis ($ millions)
- Table 19 RFPF current service cost on a calendar year basis (% of pensionable payroll)
- Table 20 Administrative expenses by account
- Table 21 Estimated contributions for prior service by account
- Table 22 Sensitivity of current service cost for plan year 2024 to variations in key economic assumptions by pension plan
- Table 23 Sensitivity of actuarial liability as at 31 March 2022 to variations in key economic assumptions by account
- Table 24 Sensitivity of cohort life expectancy at age 65 to variation in longevity improvement factors as at 31 March 2022 and as at 31 March 2042
- Table 25 State of the RCA Account
- Table 26 Current service cost of the RCA by plan year
- Table 27 RCA current service cost on a calendar year basis ($ millions)
- Table 28 RCA current service cost on a calendar year basis (% of pensionable payroll)
- Table 29 Estimated government credit
- Table 30 Estimated government cost
- Table 31 Regular Forces member contribution rates
- Table 32 Reconciliation of balances in Superannuation Account for plan year 2019 to 2022
- Table 33 Reconciliation of balances in Canadian Forces Pension Fund
- Table 34 Reconciliation of balances in RCA Account
- Table 35 Reconciliation of balances in Reserve Force Pension Fund for plan year 2019 to 2022
- Table 36 Interest earnings and rates of return
- Table 37 Summary of membership data by plan
- Table 38 Reconciliation of Regular Force Plan contributors
- Table 39 Reconciliation of Reserve Force Plan contributors
- Table 40 Reconciliation of Regular Force Plan pensioners
- Table 41 Reconciliation of Reserve Force Plan pensioners
- Table 42 Reconciliation of spouse survivors by plan
- Table 43 Reconciliation of children/students survivors by plan
- Table 44 Actuarial value of Canadian Forces Pension Fund assets
- Table 45 Actuarial value of Reserve Force Pension Fund assets
- Table 46 Asset mix
- Table 47 Real rate of return by asset type
- Table 48 Overall rate of return on assets of the CFPF and RFPF
- Table 49 Rates of return on assets in respect of the CFPF and the RFPF
- Table 50 Transfer value
- Table 51 Economic assumptions
- Table 52 Sample of assumed seniority and promotional salary increases
- Table 53 Proportion of female members joining the plans
- Table 54 Assumed annual increases in number of contributors per pension plan
- Table 55 Sample of assumed rates of retirement for members of the Regular Force Plan
- Table 56 Sample of assumed rates of retirement of the Reserve Force members
- Table 57 Sample of assumed 3B disability incidence rates (own occupation) for the Regular Force Plan
- Table 58 Sample of assumed withdrawal rates of the Regular Force Plan
- Table 59 Assumed withdrawal rates for Reserve Force Plan for members below age 50
- Table 60 Sample of assumed rollover rates for Reserve Force Plan
- Table 61 Sample of assumed rates of mortality for plan year 2023 for contributors and retirement pensioners
- Table 62 Sample of assumed rates of mortality for plan year 2023 for disability (3A) pensioners
- Table 63 Sample of assumed rates of mortality plan year 2023 for surviving spouses
- Table 64 Sample of assumed longevity improvement factors at initial and ultimate plan year mortality reductions
- Table 65 Cohort life expectancy of contributors and retirement pensioners
- Table 66 Probability of an eligible spouse at death of member
- Table 67 Spouse age difference with the member at death of member
- Table 68 Assumed rates of children ceasing to be eligible for a survivor allowance
- Table 69 Wage measure - RFPF
- Table 70 Financial position of the CFPF as at 31 March 2025 due to asset return tail-events
- Table 71 Regular Force - Male officers
- Table 72 Regular Force - Male officers - Summary
- Table 73 Regular Force - Male other ranks
- Table 74 Regular Force - Male other ranks - Summary
- Table 75 Regular Force - Female officers
- Table 76 Regular Force - Female officers - Summary
- Table 77 Regular Force - Female other ranks
- Table 78 Regular Force - Female other ranks - Summary
- Table 79 Reserve Force - Male officers
- Table 80 Reserve Force - Male officers - Summary
- Table 81 Reserve Force - Male other ranks
- Table 82 Reserve Force - Male other ranks - Summary
- Table 83 Reserve Force - Female officers
- Table 84 Reserve Force - Female officers - Summary
- Table 85 Reserve Force - Female other ranks
- Table 86 Reserve Force - Female other ranks - Summary
- Table 87 Regular Force - Male officers - Retirement pensioners
- Table 88 Summary of Regular Force - Male officers - Retirement pensioners
- Table 89 Regular Force - Female officers - Retirement pensioners
- Table 90 Summary of Regular Force - Female officers - Retirement pensioners
- Table 91 Regular Force - Male other ranks - Retirement pensioners
- Table 92 Summary of Regular Force - Male other ranks - Retirement pensioners
- Table 93 Regular Force - Female other ranks - Retirement pensioners
- Table 94 Summary of Regular Force - Female other ranks - Retirement pensioners
- Table 95 Regular Force - Male officers - 3B Pensioners
- Table 96 Summary of Regular Force - Male officers - 3B Pensioners
- Table 97 Regular Force - Female officers - 3B Pensioners
- Table 98 Summary of Regular Force - Female officers - 3B Pensioners
- Table 99 Regular Force - Male other ranks - 3B Pensioners
- Table 100 Summary of Regular Force - Male other ranks - 3B Pensioners
- Table 101 Regular Force - Female other ranks - 3B Pensioners
- Table 102 Summary of Regular Force - Female other ranks - 3B Pensioners
- Table 103 Regular Force - Male officers - 3A Pensioners
- Table 104 Summary of Regular Force - Male officers - 3A Pensioners
- Table 105 Regular Force - Female officers - 3A Pensioners
- Table 106 Summary of Regular Force - Female officers - 3A Pensioners
- Table 107 Regular Force - Male other ranks - 3A Pensioners
- Table 108 Summary of Regular Force - Male other ranks - 3A Pensioners
- Table 109 Regular Force - Female other ranks - 3A Pensioners
- Table 110 Summary of Regular Force - Female other ranks - 3A Pensioners
- Table 111 Reserve Force - Male officers - Retirement pensioners
- Table 112 Summary of Reserve Force - Male officers - Retirement pensioners
- Table 113 Reserve Force - Male other ranks - Retirement pensioners
- Table 114 Summary of Reserve Force - Male other ranks - Retirement pensioners
- Table 115 Reserve Force - Female officers - Retirement pensioners
- Table 116 Summary of Reserve Force - Female officers - Retirement pensioners
- Table 117 Reserve Force - Female other ranks - Retirement pensioners
- Table 118 Summary of Reserve Force - Female other ranks - Retirement pensioners
- Table 119 Reserve Force - Officers - Disability pensioners
- Table 120 Summary of Reserve Force - Officers - Disability pensioners
- Table 121 Reserve Force - Other ranks - Disability pensioners
- Table 122 Summary of Reserve Force - Other ranks - Disability pensioners
- Table 123 Regular Force - Surviving spouses
- Table 124 Summary of Regular Force - Surviving spouses
- Table 125 Reserve Force - Surviving spouses
- Table 126 Summary of Reserve Force - Surviving spouses
List of charts
- Chart 1 Evolution of liabilities of Superannuation Account and CFPF over time
- Chart 2 Evolution of cash flows of the CFPF over time
- Chart 3 Evolution of liabilities of the RFPF over time
- Chart 4 Evolution of cash flows of the RFPF over time
- Chart 5 Range of potential funding ratio for the best-estimate portfolio - CFPF
- Chart 6 Likelihood of deficits and non-permitted surplus due to investment volatility
1. Highlights of the report
| blank | Superannuation Account (Service prior to 1 April 2000) |
Pension Fund (Service since 1 April 2000) |
|---|---|---|
| Financial position |
|
|
|
|
|
|
|
|
| Funding ratio/special credits or payments |
|
|
| Member contribution rates |
|
|
| Projected current service cost in millions of dollars (Calendar year 2024) |
|
|
|
Section 1, Table A footnotes
|
||
| blank | Pension Fund (Service since 1 March 2007) |
|---|---|
| Financial position |
|
| Funding ratio/special payments |
|
| Member contribution rates |
|
| Projected current service cost in millions of dollars (Calendar year 2024) |
|
2. Introduction
This actuarial report on the Canadian Forces Regular Force Pension Plan (Regular Force Plan) and the Reserve Force Pension Plan (Reserve Force Plan) was made pursuant to the Public Pensions Reporting Act (PPRA).
This actuarial valuation is as at 31 March 2022 and is in respect of the pension benefits and contributions defined by Parts I, III and IV of the Canadian Forces Superannuation Act (CFSA), the Special Retirement Arrangements Act (SRAA), which covers the Retirement Compensation Arrangements (RCA), and the Pension Benefits Division Act (PBDA) for members of the Regular Force Plan. This valuation is also in respect of the pension benefits and contributions defined by Part I.1 of the CFSA and the PBDA for members of the Reserve Force Plan.
The previous actuarial report was prepared as at 31 March 2019. The date of the next periodic review is scheduled to occur no later than 31 March 2025.
2.1 Purposes of the report
The purposes of this actuarial valuation are to:
-
determine the state of the Regular Force Plan composed of the Canadian Forces Superannuation Account (Superannuation Account), the Canadian Forces Pension Fund (CFPF) and the Retirement Compensation Arrangements (RCA) Account;
-
determine the state of the Reserve Force Plan composed of the Reserve Force Pension Fund (RFPF);
-
determine the projected current service costs for the CFPF, the RFPF and the RCA Account; and
-
assist the President of the Treasury Board in making informed decisions regarding the financing of the government's pension benefit obligation.
This report may not be suitable for other purposes.
2.2 Scope of the report
Section 3 presents a general overview of the valuation basis used in preparing this actuarial report and section 4 presents the financial position of the plan as well as the reconciliation of the changes in financial position and the cost of certificate.
Finally, section 5 provides the actuarial opinion for the current valuation.
The various appendices provide a summary of the Regular Force Plan and Reserve Force Plan provisions, a description of data, methodology and assumptions employed. The appendices also provide the pension plan projections and the uncertainty of results.
3. Valuation basis
This report is based on pension benefit provisions enacted by legislation, summarized in Appendices A and B.
Contribution rates for Regular Force members for calendar years 2022 to 2024 (as approved by the Treasury Board) and for calendar year 2025 and beyond (estimated) have been updated since the last valuation and are assumed to be equal to the contribution rates of Group 1 contributors under the pension plan for the Public Service of Canada (PS pension plan).
Contribution rates for Reserve Force members are set by regulation.
The Canadian Forces Superannuation Act was amended by Bill C-97 which received Royal Assent on 21 June 2019. The amendment modified the rule regarding the non-permitted surplus, increasing the permitted surplus from 10% to 25% of liabilities. The regulations which outline the corresponding provisions for the Reserve Force Plan remain unchanged. There have been no other changes to the plan provisions of either plan since the previous valuation.
The Funding Policy for the Public Sector Pension Plans (Funding Policy) was approved by the Treasury Board in 2018. The policy provides guidance and rules to support prudent governance of the plansFootnote 1 and ensures that sufficient assets are accumulated to meet the cost of the accrued pension benefits. The methods and assumptions of this actuarial valuation are consistent with the provisions of the Funding Policy.
For the Regular Force Plan, the financial data on which this valuation is based are composed of:
-
The CFPF invested assets that the government has earmarked for the payment of benefits for service since 1 April 2000;
-
the Superannuation Account established to track the government's pension benefit obligations for service prior to 1 April 2000; and
-
the RCA Account for benefits in excess of those that can be provided under the Income Tax Act limits for registered pension plans.
For the Reserve Force Plan, the financial data on which this valuation is based are composed of RFPF invested assets that the government has earmarked for the payment of benefits for Reserve Force service.
These pension assets and accounts balances are summarized in Appendix C.
The membership data are provided by the Public Services and Procurement Canada (PSPC). Membership data and tests performed on them are summarized in Appendix D.
The valuation was prepared using accepted actuarial practices in Canada and is based on methods and assumptions summarized in Appendices E to H.
All actuarial assumptions used in this report are best-estimate assumptions and do not include any margin for adverse deviations. They are independently reasonable and appropriate in aggregate for the purposes of the valuation at the date of this report.
Actuarial assumptions used in the previous report were revised based on economic trends and demographic experience. A complete description of the assumptions is given in Appendices F to H.
A summary of the ultimate economic assumptions used in this and the previous report is shown in the following table.
| Economic assumptions | 31 March 2022 | 31 March 2019 |
|---|---|---|
| Assumed level of inflation | 2.00% | 2.00% |
| Real increase in pensionable earnings | 0.60% | 0.70% |
| Real increase in YMPE and MPETable 1 footnote a | 0.90% | 1.00% |
| Real rate of return on the Pension Fund | 4.00% | 4.00% |
| Real rate of return on the Superannuation Account and RCA Account | 2.00% | 2.50% |
|
Table 1 footnotes
|
||
Table 2 presents a summary of the main demographic assumptions used in this report and those used in the previous report.
| Demographic assumptions | 31 March 2022 | 31 March 2019 |
|---|---|---|
| Promotional and seniority rate of increaseTable 2 footnote a | ||
| Officer | 0.5% to 10.6% | 0.5% to 9.5% |
| Other rank | 0.5% to 5.4% | 0.5% to 7.3% |
| Cohort life expectancy at age 65 | ||
| Male officer | 23.5 | 23.6 |
| Male other rank | 20.8 | 21.2 |
| Female | 24.4 | 24.6 |
| Average age at retirement | ||
| Regular Force members | 52.7 | 53.7 |
| Reserve Force members | 58.8 | 57.0 |
|
Table 2 footnotes
|
||
As of the date of the signing of this report, we were not aware of any subsequent events that may have a material impact on the results of this valuation.
4. Valuation results
This report is based on pension benefit provisions enacted by legislation, summarized in Appendices A and B, and the financial and membership data summarized in Appendices C and D. The valuation was prepared using accepted actuarial practices in Canada as well as methods and assumptions summarized in Appendices E to H. Emerging experience that differs from the corresponding assumptions will result in gains or losses to be revealed in subsequent reports.
Projections of the financial positions of the Superannuation Account, the CFPF and the RFPF are shown in Appendix I.
4.1 Financial position
Beginning on 1 April 2000, member and government contributions of the Regular Force Plan are no longer credited to the Superannuation Account. Rather, they are credited to the CFPF, and the total amount of contributions net of benefits paid and administrative expenses is transferred to the Public Sector Pension Investment Board (PSP) and invested in the financial markets.
Contributions made by the government and members of the Reserve Force Plan are credited to the RFPF. The total amount of contributions net of benefits paid and administrative expenses is transferred to PSP and invested in the financial markets.
The valuation results of this section show the financial position as at 31 March 2022 for each financing arrangement under the CFSA. The results of the previous valuation are also shown for comparison.
4.1.1 Canadian Forces Superannuation Account
| Components of financial position | 31 March 2022 | 31 March 2019 |
|---|---|---|
| Assets | ||
| Recorded account balance | 45,303 | 45,607 |
| Present value of prior service contributions | 19 | 23 |
| Asset subtotal | 45,322 | 45,630 |
| Actuarial liability | ||
| Active contributors | 2,443 | 4,153 |
| Retirement pensioners | 32,329 | 31,609 |
| Disabled 3B | 9,639 | 8,602 |
| Disabled 3A | 114 | 122 |
| Deferred vested members | 83 | 69 |
| Eligible survivors | 3,703 | 3,356 |
| Outstanding payments | - dash | 1 |
| Administrative expenses | 111 | 145 |
| Total actuarial liability | 48,422 | 48,057 |
| Actuarial excess or shortfall | (3,100) | (2,427) |
In accordance with the CFSA, the actuarial shortfall of $3,100 million could be amortized over a maximum period of 15 years beginning on 31 March 2024. If the shortfall is amortized over the maximum period, 15 equal annual credits of $264 million could be made to the Superannuation Account. The time, manner and amount of such credits are to be determined by the President of the Treasury Board. It is expected that the government will amortize the actuarial shortfall through a one-time special credit to the Superannuation Account of $3,298 million as at 31 March 2024 that takes into account the interest on the shortfall accumulated from 31 March 2022 to 31 March 2024.
4.1.2 Canadian Forces Pension Fund
| Components of financial position | 31 March 2022 | 31 March 2019 |
|---|---|---|
| Actuarial value of assets | ||
| Market value of assets | 44,663 | 33,123 |
| Actuarial smoothing adjustment | (3,942) | (1,928) |
| Present value of prior service contributions | 297 | 328 |
| Amount receivable from Part I.1 - Rollover members | 73 | 63 |
| Total actuarial value of assets | 41,091 | 31,586 |
| Actuarial liability | ||
| Active contributors | 18,652 | 17,720 |
| Retirement pensioners | 9,328 | 7,213 |
| Disabled 3B | 8,399 | 5,701 |
| Disabled 3A | 11 | 7 |
| Deferred vested members | 273 | 147 |
| Eligible survivors | 212 | 136 |
| Outstanding payments | 97 | 83 |
| Total actuarial liability | 36,972 | 31,007 |
| Actuarial surplus/(deficit) | 4,119 | 579 |
As at 31 March 2022, the Pension Fund has a surplus of $4,119 million and the funding ratio is 111.1%. As such, no special payments are required and there is no non-permitted surplusFootnote 2.
4.1.3 Reserve Force Pension Fund
| Components of financial position | 31 March 2022 | 31 March 2019 |
|---|---|---|
| Actuarial value of assets | ||
| Market value of assets | 864 | 613 |
| Actuarial smoothing adjustment | (86) | (50) |
| Present value of prior service contributions | 33 | 38 |
| Amount payable to Regular Force pension plan | (73) | (63) |
| Total actuarial value of assets | 738 | 538 |
| Actuarial liability | ||
| Active contributors | 483 | 481 |
| Retirement pensioners | 287 | 215 |
| Disability pensioners | 0 | 1 |
| Surviving dependents | 5 | 4 |
| Outstanding payments | 17 | 10 |
| Total actuarial liability | 792 | 711 |
| Actuarial surplus/(deficit) | (54) | (173) |
In accordance with section 87 of the Reserve Force Pension Plan Regulations, the actuarial deficit is amortized with equal annual instalments over a period of 15 years. Taking into account the special payment of $17.4 million that was made on 31 March 2023, the actuarial deficit of $54 million could be amortized in 15 equal annual payments of $4.1 million beginning on 31 March 2024.
4.2 CFSA - Reconciliation of the changes in financial position
Table 6 presents the reconciliation of the changes in financial positions of the Superannuation Account, CFPF and the RFPF. Explanations of the main items responsible for the changes follow the table.
| Components of reconciliation of the financial position | Superannuation Account actuarial excess/(shortfall) | CFPF actuarial surplus/(deficit) | RFPF actuarial surplus/(deficit) |
|---|---|---|---|
| Financial position as at 31 March 2019 | (2,427) | 579 | (173) |
| Recognized investment gains/(losses) as at 31 March 2019 | n/a | 1,928 | 50 |
| Change in methodology | (70) | 34 | 0 |
| Retroactive changes to the population data | (59) | (15) | 0 |
| Revised initial financial position as at 31 March 2022 | (2,556) | 2,526 | (123) |
| Expected interest on initial financial position | (218) | 412 | (26) |
| Special credits or payments | 2,691 | 159 | 40 |
| Net experience gains and (losses) | (268) | 4,113 | 84 |
| Revision of actuarial assumptions | (2,739) | 935 | 68 |
| Change in the present value of prior service contributions | (7) | (84) | (11) |
| Change in the present value of administrative expenses | (3) | n/a | n/a |
| Unrecognized investment (gains)/losses as at 31 March 2022 | 0 | (3,942) | (86) |
| Financial position as at 31 March 2022 | (3,100) | 4,119 | (54) |
4.2.1 Recognized investment gains as at 31 March 2019
An actuarial asset valuation method that minimizes the impact of short-term fluctuations in the market value of assets was used in the previous valuation, causing the actuarial value of the CFPF assets to be $1,928 million less than their market value. The same actuarial asset valuation method was used for the RFPF, causing the actuarial value of the RFPF assets to be $50 million less than their market value.
4.2.2 Change in methodology
Two changes occurred since the last valuation:
-
New actuarial valuation software was used to complete the valuation.
-
As a result of the change in actuarial valuation software, the Age Last approach was replaced by an Age Nearest approach. These two methodologies are detailed in Appendix E.2.6.
The combined changes increased the Superannuation Account liability by $70 million and decreased the Pension Fund liability by $34 million. The impact was negligible for the Reserve Force Pension Fund.
4.2.3 Retroactive changes to the population data
The net impact of the retroactive changes to the population data received from PSPC resulted in an increase of $59 million in the Superannuation Account actuarial liabilities and an increase of $15 million in the CFPF actuarial liabilities.
4.2.4 Expected interest on revised initial financial position
The amount of interest expected to accrue during the intervaluation period increased the revised actuarial shortfall by $218 million for the Superannuation Account, increased the revised actuarial surplus by $412 million for the CFPF and increased the revised actuarial deficit by $26 million for the RFPF.
These amounts of interest were based on the Superannuation Account yields, the CFPF returns and the RFPF returns projected in the previous report for the three-year intervaluation period.
4.2.5 Special credit and payments made in the intervaluation period
An actuarial shortfall of $2,427 million was reported in the Superannuation Account as at 31 March 2019. The government made a one-time credit of $2,605 million as at 31 March 2021 which resulted in an increase of $2,691 million in the recorded balance of the Account as at 31 March 2022.
Even though no actuarial deficit was reported in the CFPF in the 31 March 2019 report, before the 31 March 2019 report was tabled, the government made a special payment of $145 million as at 31 March 2020 as per requested in the 31 March 2016 report. This payment resulted in an increase of $159 million in the CFPF as at 31 March 2022.
A deficit of $173 million was reported in the RFPF as at 31 March 2019 which was to be amortized over a period of 15 years in accordance with the Reserve Force Pension Plan Regulations. A total of $39 million of special payments were made to the RFPF during the intervaluation period that resulted in an increase of $40 million in assets after including the expected interest to 31 March 2022.
4.2.6 Experience gains and losses
Since the previous valuation, experience gains and losses have increased the Superannuation Account actuarial shortfall by $268 million. The CFPF actuarial surplus has increased by $4,113 and RFPF actuarial deficit has decreased by $84 million due to the experience gains and losses over the three-year intervaluation period. The main experience gain and loss items are described in Table 7.
| Component of experience gains and (losses) | Superannuation Account | CFPF | RFPF |
|---|---|---|---|
| Terminations | 3 | 39 | 2 |
| Rollover experience | n/a | n/a | (39) |
| Retirements | 43 | 12 | 2 |
| Disabilities | 22 | (6) | 0 |
| MortalityTable 7 footnote (i) | (105) | 46 | 4 |
| Promotional and seniority salary increasesTable 7 footnote (ii) | (74) | (309) | 0 |
| Interest and investment earningsTable 7 footnote (iii) | 8 | 4,845 | 137 |
| Pension indexationTable 7 footnote (iv) | (120) | (49) | (1) |
| Economic increases in pensionable earningsTable 7 footnote (v) | (37) | (273) | (5) |
| Transfer value ratesTable 7 footnote (vi) | 0 | (71) | (9) |
| PBDA payments | 32 | (93) | 0 |
| Miscellaneous | (40) | (28) | (8) |
| Total experience gains and (losses) | (268) | 4,113 | 84 |
|
Table 7 footnotes
|
|||
4.2.7 Revision of actuarial assumptions
Actuarial assumptions were revised based on economic trends and demographic experience as described in Appendices F and G. This revision has increased the Superannuation Account actuarial liability by $2,739 million, reduced the CFPF actuarial liability by $935 million and decreased the RFPF actuarial liability by $68 million. The impacts of these revisions are shown in the following table and the most important items are discussed thereafter.
| Actuarial assumption | Superannuation Account | CFPF | RFPF |
|---|---|---|---|
| Yields and rates of return | 206 | 2,103 | 40 |
| Increases in pensionable earnings and YMPE/MPE | (1) | 44 | 2 |
| Pension indexation | (3,172) | (1,366) | (24) |
| Transfer value rates | 0 | 154 | 35 |
| Mortality rates and improvement factors | 165 | 40 | 1 |
| Withdrawal ratesTable 8 footnote a | 0 | (113) | (39) |
| Retirement rates | 4 | 21 | 33 |
| Disability rates | 1 | 144 | 3 |
| Seniority and promotional increases | (1) | (186) | 0 |
| Proportion opting for a deferred annuity | 0 | 56 | 15 |
| Family composition | 59 | 38 | 2 |
| Net impact of revision | (2,739) | 935 | 68 |
|
Table 8 footnotes
|
|||
The net impact of the revision of the assumptions is largely attributable to the changes in the following economic assumptions:
-
the known pension indexation of 6.3% of 1 January 2023 and the increase of our assumption of 1 January 2024 to 5.1%; and
-
the increase in the expected return on assets assumptions for the Canadian Forces Pension Fund and the Reserve Force Pension Fund.
The impact of the change on the yields to the Superannuation Account are of lesser importance than the CFPF and the RFPF as the ultimate nominal yield was reduced from 4.5% to 4.0%; while nominal yields for the plan years 2023 through 2040 were increased. The equivalent flat nominal yield for the purpose of calculating the actuarial liability as at 31 March 2022 is 3.00% compared to a flat rate of 2.97% based on the stream of nominal yields from the previous valuation. As a result, there is a negligible decrease in the actuarial liability of the Superannuation Account.
Details of the changes in economic assumptions are described in Appendix F.
Details of the changes in demographic assumptions, in particular for mortality rates, are described in Appendix G.
4.2.8 Change in the present value of prior service contributions
The expected total government cost is shown in Table 30. The government is expected to make additional contributions in excess of the current service cost for members' prior service elections. The change in the present value of prior service contributions corresponds to members' elections since the last report where the members opted to pay for these elections by instalments. Members' prior service elections paid through instalments increased the Superannuation Account by $7 million and the CFPF and the RFPF assets by $84 million and $11 million less than expected respectively.
4.2.9 Change in the present value of administrative expenses for the Superannuation Account
The previous report annual administrative expenses assumption of 0.55% of total pensionable payroll is increased to 0.60% in this report. This increase is based on average administrative expenses observed during the intervaluation period.
For plan year 2023, 40.0% of total administrative expenses are being charged to the Superannuation Account; it is assumed that the proportion charged to the Superannuation Account will reduce at the same rate of 2.5% per year as assumed in the previous valuation.
4.2.10 Unrecognized investment gains
An actuarial asset valuation method that minimizes the impact of short-term fluctuations in the market value of assets was also used for this valuation. The method, which is described in Appendix E.2, resulted in an actuarial value of the CFPF and the RFPF assets that are $3,942 and $86 million less than their respective market values as at 31 March 2022.
4.3 CFSA - Cost certificate
4.3.1 Current service cost
The details of the current service cost for plan yearFootnote 3 2024 and reconciliation with the 2021 current service cost are shown below.
| Components of current service cost | CFPF | RFPF |
|---|---|---|
| Members required contributions | 590.0 | 24.1 |
| Government current service cost | 869.7 | 45.8 |
| Total current service cost | 1,459.7 | 69.9 |
| Total current service cost as % of expected pensionable payroll | 25.30% | 15.12% |
| Component of reconciliation of current service cost | CFPF | RFPF |
|---|---|---|
| Current service cost for plan year 2021 | 27.54 | 18.65 |
| Expected current service cost change between plan years 2021 and 2024 | (0.82) | (0.66) |
| Change in methodology | 0.39 | (0.13) |
| Intervaluation experience | (0.19) | (0.39) |
| Changes in administration expenses assumption | 0.04 | (0.47) |
| Changes in demographic assumptions | 0.02 | 0.20 |
| Changes in economic assumptions | (1.68) | (2.08) |
| Current service cost for plan year 2024 | 25.30 | 15.12 |
4.3.2 Projection of current service costs
The current service cost is borne jointly by the plan members and the government. The Regular Force Plan member contribution rates are determined on a calendar year basis and they have been changed since the last valuation. Contribution rates are set equal to the contribution rates of Group 1 contributors under the PS pension plan. Contribution rates for the Reserve Force Plan members are set by regulation. The contribution rates are as follows:
| Calendar year | Regular Force below YMPE | Regular Force above YMPE | Reserve Force |
|---|---|---|---|
| 2022 | 9.36% | 12.48% | 5.20% |
| 2023 | 9.35% | 12.37% | 5.20% |
| 2024 and after | 9.35% | 12.25% | 5.20% |
Current service costs on a plan year basis, expressed as a percentage of the projected pensionable payroll as well as in dollar amounts are shown in Table 12 and Table 13 for Regular Force Plan members and in Table 14 and Table 15 for Reserve Force Plan members. Member contributions and the government current service costs are also shown on a calendar year basis in Table 16 to Table 19.
| Plan year | Contributors | Government | Total |
|---|---|---|---|
| 2024 | 590 | 870 | 1,460 |
| 2025 | 611 | 916 | 1,527 |
| 2026 | 638 | 968 | 1,606 |
| 2027 | 669 | 1,025 | 1,694 |
| Plan year | Contributors | Government | Total |
|---|---|---|---|
| 2024 | 10.23 | 15.07 | 25.30 |
| 2025 | 10.19 | 15.28 | 25.47 |
| 2026 | 10.16 | 15.40 | 25.56 |
| 2027 | 10.12 | 15.52 | 25.64 |
| Plan year | Contributors | Government | Total |
|---|---|---|---|
| 2024 | 24.0 | 45.9 | 69.9 |
| 2025 | 25.6 | 48.7 | 74.3 |
| 2026 | 27.2 | 51.4 | 78.6 |
| 2027 | 28.9 | 54.2 | 83.1 |
| Plan year | Contributors | Government | Total |
|---|---|---|---|
| 2024 | 5.20 | 9.92 | 15.12 |
| 2025 | 5.20 | 9.89 | 15.09 |
| 2026 | 5.20 | 9.81 | 15.01 |
| 2027 | 5.20 | 9.77 | 14.97 |
| Calendar year | Contributors | Government | Total |
|---|---|---|---|
| 2024 | 606 | 904 | 1,510 |
| 2025 | 631 | 955 | 1,586 |
| 2026 | 661 | 1,011 | 1,672 |
| Calendar year | Contributors | Government | Total | Ratio of government to contributors' current service cost |
|---|---|---|---|---|
| 2024 | 10.20 | 15.23 | 25.43 | 1.49 |
| 2025 | 10.16 | 15.38 | 25.54 | 1.51 |
| 2026 | 10.13 | 15.49 | 25.62 | 1.53 |
| Calendar year | Contributors | Government | Total |
|---|---|---|---|
| 2024 | 25.2 | 48.0 | 73.2 |
| 2025 | 26.8 | 50.7 | 77.5 |
| 2026 | 28.5 | 53.5 | 82.0 |
| Calendar year | Contributors | Government | Total | Ratio of government to contributors' current service cost |
|---|---|---|---|---|
| 2024 | 5.20 | 9.90 | 15.10 | 1.90 |
| 2025 | 5.20 | 9.83 | 15.03 | 1.89 |
| 2026 | 5.20 | 9.78 | 14.98 | 1.88 |
4.3.3 Administrative expenses
Based upon the assumptions described in Appendix F.3.5, the CFPF and the RFPF administrative expenses are included in the total current service costs. As for the previous report, the expected administration expenses exclude PSP operating expenses as these are recognized implicitly through a decrease in the real rate of return. The estimated administrative expenses are shown in the following table:
| Plan year | Superannuation Account | CFPF | RFPF |
|---|---|---|---|
| 2023 | 13.9 | 20.9 | 6.5 |
| 2024 | 13.4 | 22.3 | 6.9 |
| 2025 | 13.0 | 24.1 | 7.3 |
| 2026 | 12.6 | 26.2 | 7.8 |
| 2027 | 12.3 | 28.6 | 8.2 |
The Superannuation Account administrative expenses have been capitalized and increase the liability for service accrued prior to 1 April 2000.
4.3.4 Contributions for prior service elections
Based on the valuation data and the assumptions described in Appendices F.2 and F.3 and recent statistical information provided by the PSPC, member and government contributions for prior service elections were estimated as follows:
| Plan year | Superannuation Account contributors | Superannuation Account government | CFPF contributors | CFPF government | RFPF contributors | RFPF government |
|---|---|---|---|---|---|---|
| 2025 | 1.3 | 1.3 | 15.0 | 24.5 | 2.0 | 3.2 |
| 2025 | 1.3 | 1.3 | 15.0 | 24.5 | 1.9 | 3.1 |
| 2026 | 1.2 | 1.2 | 14.4 | 23.5 | 1.9 | 3.0 |
| 2027 | 1.0 | 1.0 | 13.6 | 22.2 | 1.7 | 2.8 |
| 2028 | 0.9 | 0.9 | 12.6 | 20.5 | 1.4 | 2.4 |
|
Table 21 footnotes
|
||||||
4.4 Sensitivity to variations in key economic assumptions
The information required by statute, which is presented in the main report, has been derived using best-estimate assumptions regarding future demographic and economic trends. The key best-estimate assumptions, i.e. those for which changes within a reasonable range have the most significant impact on the long-term financial results, are described in Appendices F and G.
Given the length of the projection period and the number of assumptions required, it is unlikely that the actual experience will develop precisely in accordance with best-estimate assumptions that underlie the actuarial estimates. Individual sensitivity tests have been performed using alternative assumptions.
Table 22 presents the effect on the plan year 2024 current service cost for the Regular Force Plan and the Reserve Force Plan when key economic assumptions are varied by one percentage point per annum.
Similarly, Table 23 presents the effect on the liabilities as at 31 March 2022 for the Regular Force Plan and the Reserve Force Plan when key economic assumptions are varied by one percentage point per annum.
| Assumption varied | Regular Force | Effect | Reserve Force | Effect |
|---|---|---|---|---|
| None (i.e. current basis) | 25.30 | None | 15.12 | None |
| Investment yield is 1% higher | 20.33 | (4.97) | 13.30 | (1.81) |
| Investment yield is 1% lower | 32.18 | 6.88 | 18.01 | 2.89 |
| Pension indexation is 1% higher | 28.94 | 3.64 | 16.33 | 1.21 |
| Pension indexation is 1% lower | 22.43 | (2.87) | 14.19 | (0.93) |
| Salary, wage, YMPE and MPE are 1% higher | 27.47 | 2.16 | 15.94 | 0.83 |
| Salary, wage, YMPE and MPE are 1% lower | 23.42 | (1.88) | 14.39 | (0.73) |
| Inflation is 1% higherTable 22 footnote a | 24.75 | (0.56) | 14.84 | (0.27) |
| Inflation is 1% lowerTable 22 footnote a | 25.89 | 0.58 | 15.39 | 0.27 |
|
Table 22 footnotes
|
||||
| Assumption varied | Superannuation Account | Effect | CFPF | Effect | RFPF | Effect |
|---|---|---|---|---|---|---|
| None (i.e. current basis) | 48,422 | None | 36,972 | None | 792.0 | None |
| Investment yield is 1% higher | 42,887 | (5,535) | 31,612 | (5,360) | 683.1 | (108.9) |
| Investment yield is 1% lower | 55,255 | 6,833 | 44,172 | 7,200 | 936.5 | 144.5 |
| Pension indexation is 1% higher | 55,002 | 6,580 | 42,386 | 5,414 | 894.6 | 102.6 |
| Pension indexation is 1% lower | 42,984 | (5,438) | 32,806 | (4,166) | 711.8 | (80.2) |
| Salary, wage, YMPE and MPE are 1% higher | 48,454 | 32 | 38,161 | 1,189 | 820.0 | 28.0 |
| Salary, wage, YMPE and MPE are 1% lower | 48,390 | (32) | 36,092 | (880) | 767.6 | (24.4) |
| Inflation is 1% higherTable 23 footnote a | 48,294 | (128) | 36,664 | (308) | 784.0 | (8.0) |
| Inflation is 1% lowerTable 23 footnote a | 48,554 | 132 | 37,497 | 525 | 800.4 | 8.4 |
|
Table 23 footnotes
|
||||||
4.5 Assessing and illustrating downside risks
This section focuses on assessing and illustrating downside risks due to potential adverse scenarios. It illustrates the potential impacts of a decrease in the nominal yield on 10-year-plus Government of Canada bonds, as well as the potential impact of a scenario where future longevity improvement is higher than expected. Downside risks of future investment returns are illustrated in Appendix J.3.
Given the purpose of this section, only adverse scenarios are presented. This section is not meant to represent forecasts or predictions and should be interpreted with caution.
4.5.1 Decrease in the nominal yield on 10-year-plus Government of Canada bonds
In the event of a decrease of 1% in the nominal yield on 10-year-plus Government of Canada bonds, the resulting new money rate and consequently, the government's real cost of borrowing would also decrease by 1%. The financial impact on the Superannuation Account of this plausible adverse scenario would be an increase of $6,833 million in actuarial liabilities.
Considering the high termination and rollover incidence in the Reserve Force Plan, there would be a notable potential impact to the RFPF if a similar event resulted in a decrease of 1% in the assumed transfer value real interest rates (details in Appendix F.3.4). The financial impact on the RFPF of this plausible adverse scenario would be an increase of $72.7 million in actuarial liabilities, and an estimated increase representing 3.28% of pensionable payroll in the current service cost.
4.5.2 Future longevity improvement higher than expected
Mortality rates are reduced in the future in accordance with the same longevity improvement assumption used in the 31st Actuarial Report on the Canada Pension Plan. Mortality improvements are expected to continue in the future but at a slower pace, reaching the ultimate improvement rate of 0.8% for ages below 89 in plan year 2040. If these improvement factors were underestimated, future mortality would be lower than expected. For example, the financial impact of a possible adverse scenario where the ultimate longevity improvement was 50% higher than projected would be:
-
an increase of $132 million in actuarial liabilities of the Superannuation Account,
-
an increase of $172 million in actuarial liabilities of the CFPF,
-
an increase of $6 million in actuarial liabilities of the RFPF,
-
an increase of 0.18% of pensionable payroll in the CFPF current service cost, and
-
an increase of 0.18% of pensionable payroll in the RFPF current service cost.
The cohort life expectancy of a member aged 65 would be impacted, as presented in the table below:
| Longevity improvement factors | As at 31 March 2022 | As at 31 March 2042 | ||||
|---|---|---|---|---|---|---|
| Male officer | Male other rank | Female | Male officer | Male other rank | Female | |
| Best-estimate | 23.5 | 20.8 | 24.4 | 24.6 | 22.0 | 25.5 |
| if ultimate 50% higher | 23.6 | 20.9 | 24.6 | 25.1 | 22.6 | 26.2 |
4.6 RCA – Financial position
This section shows the financial position of the RCA Account as at 31 March 2022. The results of the previous valuation are also shown for comparison.
| Components of financial position | 31 March 2022 | 31 March 2019 |
|---|---|---|
| Actuarial value of assets | ||
| Recorded account balance | 499 | 443 |
| Tax credit (CRA refundable tax) | 493 | 439 |
| Total assets | 992 | 882 |
| Actuarial liability | ||
| Pensionable excess earnings from active contributors | 482 | 415 |
| Pensionable excess earnings from pensioners | 356 | 264 |
| Survivor allowance from active contributors | 18 | 7 |
| Survivor allowance from pensioners | 64 | 41 |
| Total actuarial liability | 920 | 727 |
| Actuarial excess or shortfall | 72 | 155 |
The sum of the recorded balance of the RCA Account and the tax credit (CRA refundable tax) is $992 million; it exceeds the actuarial liability of $920 million by $72 million as at 31 March 2022 ($155 million as at 31 March 2019). The SRAA does not allow for an adjustment to be made to the RCA Account that would allow the recorded balance to track the actuarial liability when there is an actuarial excess.
4.7 RCA – Current service cost
The projected current service cost, borne jointly by the members and the government, of 0.67% of pensionable payroll for plan year 2024 calculated in the previous valuation has increased to 0.76% in this valuation. The RCA current service cost is estimated to stay at 0.76% of pensionable payroll for Plan year 2024 to Plan year 2027 as shown the following table. Members' contributions and the government current service costs are also shown on a calendar year basis in Table 27 and Table 28.
| Components of current service cost | Plan year 2024 | Plan year 2025 | Plan year 2026 | Plan year 2027 |
|---|---|---|---|---|
| Pensionable excess earnings | 43.0 | 44.7 | 46.8 | 49.4 |
| Survivor allowance | 1.0 | 1.0 | 1.0 | 1.0 |
| Total current service cost | 44.0 | 45.7 | 47.8 | 50.4 |
| Less member contributions | (5.9) | (6.1) | (6.4) | (6.8) |
| Government current service cost | 38.1 | 39.6 | 41.4 | 43.6 |
| Current service cost as % of total pensionable payroll | 0.76% | 0.76% | 0.76% | 0.76% |
| Calendar year | Contributors | Government | Total |
|---|---|---|---|
| 2024 | 6.1 | 39.2 | 45.3 |
| 2025 | 6.3 | 41.0 | 47.3 |
| 2026 | 6.7 | 43.0 | 49.7 |
| Calendar year | Contributors | Government | Total | Ratio of government to contributors current service cost |
|---|---|---|---|---|
| 2024 | 0.10 | 0.66 | 0.76 | 6.60 |
| 2025 | 0.10 | 0.66 | 0.76 | 6.60 |
| 2026 | 0.10 | 0.66 | 0.76 | 6.60 |
4.8 Summary of estimated government cost
The following tables summarize the estimated total government credit and cost on a plan year basis.
| Plan year | RCA current service cost | Superannuation Account total prior service contributions | Superannuation Account special credit | RCA special credit | Total government credit |
|---|---|---|---|---|---|
| 2024 | 38.1 | 1.4 | 3,298.4 | 0.0 | 3,337.9 |
| 2025 | 39.6 | 1.3 | 0.0 | 0.0 | 40.9 |
| 2026 | 41.4 | 1.2 | 0.0 | 0.0 | 42.6 |
| Plan year | CFPF current service cost | RFPF current service cost | CFPF prior service contributions | RFPF prior service contributions | RFPF special payment | Total government cost |
|---|---|---|---|---|---|---|
| 2024 | 869.7 | 45.9 | 25.5 | 3.2 | 17.4 | 961.7 |
| 2025 | 915.9 | 48.7 | 24.5 | 3.1 | 4.1 | 996.3 |
| 2026 | 967.8 | 51.4 | 23.5 | 3.0 | 4.1 | 1,049.8 |
5. Actuarial opinion
In our opinion, considering that this report was prepared pursuant to the Public Pensions Reporting Act,
-
the valuation data on which the valuation is based are sufficient and reliable for the purposes of the valuation;
-
the assumptions used are individually reasonable and appropriate in aggregate for the purposes of the valuation; and
-
the methods employed are appropriate for the purposes of the valuation.
This report has been prepared, and our opinion given, in accordance with accepted actuarial practice in Canada. In particular, this report was prepared in accordance with the Standards of Practice (General Standards and Practice – Practice-Specific Standards for Pension Plans) published by the Canadian Institute of Actuaries.
To the best of our knowledge, after discussion with the Department of National Defence, there were no events between the valuation date and the date of this report that would have a material impact on the results of this valuation.
Assia Billig, FCIA, FSA
Chief Actuary
John Kmetic, FCIA, FSA
Senior Actuary
Yann Bernard, FCIA, FSA
Senior Actuary
Ottawa, Canada
29 September 2023
Appendix A ― Summary of pension benefit provisions
Pensions for members of the regular force were first provided under the Militia Pension Act of 1901, when in 1950 it became the Defence Services Pension Act until the Defence Services Pension Continuation Act and the Canadian Forces Superannuation Act (CFSA) were enacted in 1959. Benefits are also provided to members of the regular force under the Special Retirement Arrangements Act.
The enactment of Bill C-78 on 21 September 1999 gave authority to create a pension plan for the members of the reserve force. The Reserve Force Plan was established on 1 March 2007 and provides pension benefits to part-time members of the reserve force who meet the threshold requirements for becoming plan members. The benefit eligibility rules under this plan are the same as the rules that apply to Regular Force members starting on 1 March 2007.
Benefits under both the Regular Force Plan and the Reserve Force Plan may be reduced in accordance with the Pension Benefits Division Act if there is a breakdown of a spousal union.
This appendix summarizes the pension benefits for both Regular Force members and Reserve Force members, provided under the CFSA registered provisions, which are in compliance with the Income Tax Act. For the Regular Force Plan, the portion of the benefits in excess of the Income Tax Act limits for the registered provisions is provided under the RCA described in Appendix B.
The legislation shall prevail if there is a discrepancy between it and this summary.
A.1 Changes since the last valuation
The previous valuation report was based on the pension benefit provisions as they stood as at 31 March 2019. There were no changes to the plan provisions since the last valuation.
A.2 Membership
Regular Force membership in the Regular Force Plan is compulsory for all full-time members of the Canadian Forces.
As of 1 March 2007, a member of the reserve force is considered to be a member of the regular force and will become a member of the Regular Force Plan,
-
on 1 March 2007 if, on that date,
-
the member's total number of days of paid Canadian Forces service during any period of 60 months beginning on or after 1 April 1999 was no less than 1,674,
-
the member already was or became a member of the Canadian Forces during the first month of the period and remained a member of the Canadian Forces throughout the period without any interruption of more than 60 days,
-
the member is not a person required to contribute to the Public Service Pension Fund or the Royal Canadian Mounted Police Pension Fund, and
-
the member does not have any pensionable service to their credit under Part I of the CFSA;
-
-
in any other case, on the first day of the month following a period of 60 months ending after 1 March 2007 if
-
the member's total number of days of paid Canadian Forces service during the period was no less than 1,674,
-
the member already was or became a member of the Canadian Forces during the first month of the period and remained a member of the Canadian Forces throughout the period without any interruption of more than 60 days, and
-
the member does not have any pensionable service to their credit under Part I of the CFSA.
-
The general rule is that, once a Reserve Force member is deemed a Regular Force member for the purposes of Part I of the CFSA and does not fail to receive pensionable earnings in any 12 consecutive months, the member remains a contributor under Part I of the CFSA as long as they remain a member of the Reserve Force. There are exceptions to the general rule previously described but for the purpose of this report, these were considered immaterial.
A member of the reserve force is deemed to become a participant in the Reserve Force Plan, defined under Part I.1 of the CFSA, if,
-
during each of any two consecutive periods of 12 months beginning on or after 1 April 1999 and ending no later than 1 March 2007, the earnings that the member was entitled to receive were at least 10 per cent of the Annual Earnings ThresholdFootnote 4, provided that the member already was or became a member of the Canadian Forces during the first month of the first period and remained a member of the Canadian Forces, without any interruption of more than 60 days, until 1 March 2007; or
-
in any other case, on the first day of the month following two consecutive periods of 12 months, the second of which ending after 1 March 2007 and during each of which the earnings that they were entitled to receive were at least 10 per cent of the Annual Earnings Threshold, provided that the member already was or became a member of the Canadian Forces during the first month of the first period and remained a member of the Canadian Forces, without any interruption of more than 60 days, throughout those two periods.
A.3 Contributions
A.3.1 Members
For Regular Force members, during the first 35 years of pensionable service, members contribute according to the rates determined by the Treasury Board which must not exceed the contribution rates paid by Group 1 contributors under the Public Service pension plan (PS pension plan). Contribution rates of Group 1 contributors under the PS pension plan are shown in the following table. It is assumed that the Regular Force member contribution rates will be equal to those of the PS pension plan. More information on the rates assumed under the PS pension plan can be found in the Actuarial Report on the Pension Plan for the Public Service of Canada as at 31 March 2020. The contribution rates shown after calendar year 2024 are not final and are subject to change.
| blank | Calendar year | |||
|---|---|---|---|---|
| 2022 | 2023 | 2024 | 2025 | |
| Contribution rates on earnings up to the maximum covered by the Canada Pension Plan | 9.36% | 9.35% | 9.35% | 9.35% |
| Contribution rates on earnings over the maximum covered by the Canada Pension Plan | 12.48% | 12.37% | 12.25% | 12.25% |
For Reserve Force members, during the first 35 years of pensionable service, members contribute 5.2% on all earnings up to 66 2/3 times the defined benefit limit as determined under the Income Tax Regulations. After 35 years of pensionable service, members contribute only 1% of pensionable earnings.
A.3.2 Government
A.3.2.1 Current service
The government determines its normal monthly contribution as that amount which, when combined with the required member contributions in respect of current service and expected interest earnings, is sufficient to cover the cost, as estimated by the President of the Treasury Board, of all future payable benefits that have accrued in respect of pensionable service during that month and the administrative expenses incurred during that month.
A.3.2.2 Elected prior service
The government matches Regular Force member contributions credited under the Superannuation Account for prior service elections; however, no contributions are credited if the member is paying the double rate.
Government credits to the Canadian Forces Pension Fund in respect of elected prior service are as described for current service; however, if the member is paying the double rate the government contribution rate is generally adjusted so that total member and government contributions match the current service cost.
For Reserve Force members, this valuation assumes that the government will match member contributions for prior service elections.
A.3.2.3 Actuarial excess and surplus
In accordance with the CFSA, the government has the authority to:
-
debit the excess of accounts available for benefits over the actuarial liability from the Superannuation Account subject to limitations, and
-
deal with any actuarial surplus, subject to limitations, in the Canadian Forces Pension Fund as it occurs, either by reducing members and/or employer contributions or by making withdrawals.
The regulations under Part I.1 of the CFSA give the government the authority to deal with any actuarial surplus, subject to limitations, in the RFPF as it occurs by reducing employer contributions.
A.3.2.4 Actuarial shortfall and actuarial deficit
In accordance with the CFSA, if an actuarial shortfall under the Superannuation Account is identified through a statutory actuarial report, the actuarial shortfall can be amortized over a period of up to 15 years, such that the amount that in the opinion of the President of the Treasury Board will, at the end of the fifteenth fiscal year following the tabling of that report or at the end of the shorter period that the President of the Treasury Board may determine, together with the amount that the President of the Treasury Board estimates will be to the credit of the Superannuation Account at that time, meet the cost of the benefits payable in respect of pensionable service prior to 1 April 2000.
If an actuarial deficit under the CFPF is identified through a statutory actuarial report, the actuarial deficit can be amortized over a period of up to 15 years, such that the amount that in the opinion of the President of the Treasury Board will, at the end of the fifteenth fiscal year following the tabling of that report or at the end of the shorter period that the President of the Treasury Board may determine, together with the amount that the President of the Treasury Board estimates will be to the credit of the Canadian Forces Pension Fund at that time, meet the cost of the benefits payable in respect of pensionable service since 1 April 2000.
Similarly, if an actuarial deficit under the RFPF is identified through a statutory actuarial report, the RFPF is to be credited with such annual amounts that will fully amortize the actuarial deficit over a period of 15 years.
A.4 Summary description of benefits under the Regular Force Plan and the Reserve Force Plan
The objective of the Regular Force Plan and the Reserve Force Plan is to provide an employment earnings–related lifetime retirement pension to eligible members. Benefits to members in case of disability and to the spouse and children in case of death are also provided.
Regular Force Plan pension benefits are coordinated with the pensions paid by the CPP. The initial rate of a Regular Force Plan member's retirement pension is equal to 2% of the highest average of annual pensionable earnings over any period of five consecutiveFootnote 5 years, multiplied by the number of years of pensionable service not exceeding 35. The pension is indexed annually with the Consumer Price Index (CPI) and the accumulated indexation may be payable at age 55 at the earliest as defined in Appendix A.5.6. Entitlement to benefits depends on either the qualifying service in the Canadian Forces or the pensionable service, as defined below in Appendices A.5.7 and A.5.8.
Reserve Force Plan member's pension benefits are equal to 1.5% of the greater of the Reserve Force Plan member's total pensionable earnings and total updated pensionable earnings over the most recent 35 years of pensionable service (i.e. updated career average plan). The Reserve Force Plan also provides a bridge benefit equal to 0.5% of the greater of the pensioner's total bridge benefit earnings and total updated bridge benefit earnings over the most recent 35 years of pensionable service. Reserve Force pension and bridge benefits are indexed annually with the Consumer Price Index and the accumulated indexation may be payable at age 55 at the earliest, as defined in Appendix A.5.6.
Entitlement to benefits depends on either the qualifying service in the Canadian Forces or the pensionable service, as defined below in Appendices A.5.7 and A.5.8.
Detailed notes on the following overview are provided in Appendix A.5.
A.4.1 Active member benefit entitlement on the basis of qualifying service
A.4.1.1 Active Regular Force members
| Type of termination | Qualifying service in the Canadian Forces (Appendix A.5.7) |
Benefit |
|---|---|---|
| With less than two years of pensionable service (Appendix A.5.8) | Return of contributions (Appendix A.5.11) | |
| With two or more years of pensionable service (Appendix A.5.8); and | ||
| Retirement on completion of short engagement (an officer other than a subordinate officer who has not reached retirement age and is not serving on an intermediate engagement or for an indefinite period of service) (Appendix A.5.9) |
Less than 25 years (less than 20 years – old terms of service) |
At option of member
|
|
25 years or more (20 years or more – old terms of service) |
See "Retirement for reasons other than those previously mentioned" | |
| Retirement during an indefinite period of service after having completed an intermediate engagement and prior to reaching retirement age, for reasons other than disability or, to promote economy or efficiency | Any length | Immediate annuity to which member was entitled upon completion of intermediate engagement increased to such extent as prescribed by regulationSection A.4.1.1, Table A, footnote a (Appendix A.5.15) |
| Retirement on completion of intermediate engagement (a member who has not reached retirement age and is not serving for an indefinite period of service) (Appendix A.5.10) |
25 years or more (20 years or more – old terms of service) |
Immediate annuity (Appendix A.5.12) |
|
Section A.4.1.1, Table A, footnotes
|
||
| Type of termination | Qualifying service in the Canadian Forces (Appendix A.5.7) |
Benefit |
|---|---|---|
| With less than two years of pensionable service | Return of contributions (Appendix A.5.11) | |
| With two or more years of pensionable service; and | ||
| Compulsory retirement to promote economy or efficiency | Less than 10 years |
At option of member
|
|
At least 10 but less than 25 years (less than 20 years – old terms of service) |
At option of member
|
|
|
25 years or more (20 years or more – old terms of service) |
Immediate annuity (Appendix A.5.12) | |
| Retirement for reasons other than those previously mentioned |
Less than 25 years (less than 20 years – old terms of service) |
At option of member
|
| (At least 20 but less than 25 years – old terms of service) | Immediate reduced annuity (Appendix A.5.16) | |
| 25 years or more |
Officer: immediate reduced annuity (Appendix A.5.16); Other rank: immediate annuity (Appendix A.5.12) |
|
A.4.1.2 Active Reserve Force members
| Member's type of termination | Benefit |
|---|---|
| Retirement on completion of 25 years or more of Canadian Forces service (Appendix A.5.7) | Immediate annuity (Appendix A.5.12) |
A.4.2 Member benefit entitlement on the basis of pensionable service
A.4.2.1 Active Regular Force members
| Type of termination | Years of pensionable service (Appendix A.5.8) |
Benefit |
|---|---|---|
| Compulsory retirement because of disabilitySection A.4.2.1, Table A, footnote a | Less than 2 years | Return of contributions (Appendix A.5.11) |
| At least 2 but less than 10 years |
At option of member
|
|
| 10 years or more | Immediate annuity (Appendix A.5.12) | |
|
Section A.4.2.1, Table A footnotes
|
||
A.4.2.2 Active member benefit entitlement
| Type of termination | Benefit |
|---|---|
| With less than two years of pensionable service | Return of contributions (Appendix A.5.11) |
| With two or more years of pensionable service; and | |
| Involuntary termination due to a work force reduction program and | |
|
Immediate annuity (Appendix A.5.12) |
| Leaving prior to age 50, | |
|
Deferred annuity (Appendix A.5.13) or transfer value if under age 50 (Appendix A.5.14) |
|
Immediate annuity (Appendix A.5.12) |
| Leaving at age 50 or over, except for death or disability, and | |
|
Immediate annuity (Appendix A.5.12) |
|
Deferred annuity (Appendix A.5.13) or annual allowance (Appendix A.5.17) |
A.4.2.3 Benefits in case of death
| Status at death | Years of pensionable service (Appendix A.5.8) |
Benefit |
|---|---|---|
| Leaving no eligible spouse or children under 25 (Appendices A.5.18 and A.5.19) | Less than 2 years | Return of contributions |
| 2 years or more | Minimum death benefit (Appendix A.5.21) | |
| Leaving eligible spouse and/or children under 25 | Less than 2 years | Return of contributions or an amount equal to one month's earnings of the deceased member for each year of credited pensionable service, whichever is the greater |
| 2 years or more | Annual allowance (Appendix A.5.20) |
A.5 Explanatory notes
A.5.1 Pensionable earnings
For the Regular Force Plan, pensionable earnings means the salary at the annual rate prescribed by the regulations made pursuant to the National Defence Act together with the allowances for medical and dental care costs. Pensionable payroll means the aggregate pensionable earnings of all members with less than 35 years of pensionable service.
For the Reserve Force Plan, earnings means pay earned by a member of the Canadian Forces at the rates prescribed by the regulations made pursuant to the National Defence Act together with premiums in lieu of leave. Pensionable earnings means the earnings of a member with less than 35 years of pensionable service, who has completed the required two-year waiting period. Pensionable payroll means the aggregate pensionable earnings of all members.
A.5.2 Wage measure for Reserve Force Plan
Wage measure is
-
for a calendar year prior to 2024 , the corresponding rate of pay shown in Table 69 of this report; and
-
for a calendar year after 2023 , the greater of
-
the standard basic rate of pay for a period of duty or training of six hours or more, before any retroactive adjustment, that was prescribed or established under the National Defence Act, to be paid on October 1 of the preceding year to a member at the rank of Corporal (class A), and
-
the wage measure of the previous year.
-
A.5.3 Updated pensionable earnings for Reserve Force Plan
The updated pensionable earnings for a calendar year are the Reserve Force member's pensionable earnings for that year, subject to the Income Tax Act limits, times A/B, rounded to the nearest fourth decimal place, where
-
A = the average of the wage measures for five years consisting of the year the member most recently ceased to be a member and the most recent years during which the member was a member and, if necessary, the years preceding all of those years, and
-
B = the wage measure for that calendar year.
A.5.4 Bridge benefit earnings for Reserve Force Plan
Bridge benefit earnings for a calendar year are the lesser of
-
the member's pensionable earnings for that year, and
-
the Year's Maximum Pensionable Earnings (YMPE) for that year.
A.5.5 Updated bridge benefit earnings for Reserve Force Plan
Updated bridge benefit earnings for a calendar year are the lesser of
-
the member's updated pensionable earnings for that year, and
-
the average of the YMPE for five years consisting of the year the member most recently ceased to be a member and the preceding four years.
A.5.6 Indexation for Regular Force Plan and Reserve Force Plan
A.5.6.1 Level of indexation adjustments
All immediate and deferred annuities (pensions and allowances) are adjusted every January to the extent warranted by the increase, as at 30 September of the previous year, in the 12-month average Consumer Price Index. If the indicated adjustment is negative, annuities are not decreased for that year; however, the next following adjustment is diminished accordingly.
A.5.6.2 First Indexation adjustment
Indexation adjustments accrue from the end of the month in which employment or participation in the plan terminates. The first annual adjustment following termination of employment is prorated accordingly.
A.5.6.3 Commencement of indexation payments
Payment of the indexation portion of a retirement, disability or survivor pension normally commences when the pension is put into pay. However, regarding a retirement pension, the pensioner must be at least 55 years old and the sum of age and pensionable service at least 85; or the retirement pensioner must be at least 60 years old.
A.5.7 Qualifying service in the Canadian Forces (Regular Force Plan and Reserve Force Plan)
Qualifying service in the Canadian Forces means service for which a Regular or Reserve Force member is paid, and includes:
-
days of service in the Regular Force for which pay was authorized and periods of authorized leave of absence;
-
excluding any service for which a member was paid a return of contributions or lump sum payment under the CFSA that he or she did not elect to repay on subsequent enrolment;
-
-
days of service in the Reserve Force for which pay was authorized and authorized absences for maternity and parental purposes:
-
days of training or duty of less than 6 hours = half-day
-
days of Class "A" service = 1.4 days
-
periods before 1 April 1999 (when duration of period is verifiable but not the number of days) = quarter time
-
during maternity and parental leaves, days of Canadian Forces service are based on service in previous 12 months
-
A.5.8 Pensionable service
Pensionable service includes any period of service in the Regular Force or Reserve Force in respect of which an active member either (1) made contributions that remain in the Superannuation Account, CFPF or the RFPF, or (2) elected to contribute. It also includes any period of prior service for which an active member was paid a return of contributions or lump sum payment under the CFSA that he or she did elect to repay on subsequent enrolment. It also includes prior service in the Public Service of Canada, the Royal Canadian Mounted Police and the militaries of the Commonwealth of Nations that the member elected to count as pensionable service.
A.5.9 Short engagement for Regular Force Plan
Short engagement means a continuous period of service as a commissioned officer in the regular force for a period not exceeding nine years.
A.5.10 Intermediate engagement for Regular Force Plan
Intermediate engagement means, under the old terms of service, 20 years of continuous service as a member of the regular force. Under the new terms of service, an intermediate engagement is 25 years of continuous service as a member of the regular force.
A.5.11 Return of contributions
Return of contributions means the payment of an amount equal to the accumulated current and prior service contributions paid or transferred by the member into the Superannuation Account, the CFPF or the RFPF together with interest. Interest is calculated at the quarterly Pension Fund rate each quarter on the accumulated contributions with interest as at the end of the previous quarter.
A.5.12 Immediate annuity
For Regular Force Plan, immediate annuity means an unreduced pension that becomes payable immediately upon a pensionable retirement or a pensionable disability. The annual amount is equal to 2% of the highest average annual pensionable earnings (Appendix A.5.1) of the active member over any period of fiveFootnote 6 consecutiveFootnote 7 years, multiplied by the number of years of pensionable service not exceeding 35. However, if such highest five-year earnings average exceeds the yearly maximum prescribed for the calendar year in which service is terminated, then the annual amount is reduced by 2% of such excess, multiplied by the number of years of pensionable service after April 1995.
When a regular force pensioner attains age 65 or becomes entitled to a disability pension from the CPP, the annual amount of pension is reduced by a percentage of the indexed CPP annual pensionable earningsFootnote 8 (or, if lesser, the indexed five-year pensionable earnings average on which the immediate annuity is based), multiplied by the years of CPP pensionable serviceFootnote 9. The applicable percentage is 0.625%.
For Reserve Force Plan, immediate annuity means an unreduced pension that becomes payable immediately upon a pensionable retirement or a pensionable disability. The annual amount is equal to 1.5% of the greater of the member's total pensionable earnings and total updated pensionable earnings over the most recent 35 years of pensionable service, plus an additional bridge benefit equal to 0.5% of the greater of the member's total bridge benefit earnings and total updated bridge benefit earnings.
For both plans, annuities are payable in equal monthly instalments in arrears until the end of the month in which the pensioner dies or when the disability pensioner recovers from disability. Upon the death of the pensioner, either a survivor allowance (Appendix A.5.20) or a minimum death benefit (Appendix A.5.21) may be payable.
A.5.13 Deferred annuity
Deferred annuity means an annuity that becomes payable to a retirement pensioner when he or she reaches age 60. The annual payment is determined as for an immediate annuity (see Appendix A.5.12 above) but is adjusted to reflect the indexation (see Appendix A.5.6) from the date of termination to the commencement of annuity payments.
The deferred annuity becomes an immediate annuity during any period of disability beginning before age 60. If the disability ceases before age 60, the immediate annuity reverts to the original deferred annuity.
A.5.14 Transfer value
Active members who, at their date of termination of pensionable service, are under age 50 and who are eligible for a deferred annuity may elect to transfer the commuted value of their benefits, determined in accordance with the regulations, to
-
a locked-in Registered Retirement Savings Plan of the prescribed kind; or
-
another pension plan registered under the Income Tax Act; or
-
a financial institution for the purchase of a locked-in immediate or deferred annuity of the prescribed kind.
A.5.15 Annuity payable upon retirement during an indefinite period of service for Regular Force Plan
For a Regular Force active member who has not reached retirement age and who, while on an indefinite period of service after completing an intermediate engagement, ceases to be a member of the regular force for any reason other than disability, or to promote economy or efficiency, the Canadian Forces Superannuation Regulations (CFSR) prescribe an annuity that is equal to the greater of
-
an immediate annuity based on the pensionable service to the date of completion of the intermediate engagement only and the highest consecutive five-year earnings average at date of retirement, and
-
an immediate annuity based upon the total pensionable service to the date of retirement and the highest consecutive five-year employment earnings average at that date reduced by 5% for each full year by which
-
in the case of an officer, the age at the date of retirement is less than the retirement age applicable to the member's rank; or
-
in the case of a member of other rank, the age at the date of retirement is less than the retirement age applicable to the member's rank or the period of service in the Regular Force is less than 25 years, whichever is the lesser.
-
A.5.16 Reduced immediate annuity for Regular Force members
Reduced immediate annuity means an immediate annuity for which the annual amount of the annuity as determined in Appendix A.5.12 is reduced as stated below.
With the consent of the Minister of National Defence, a regular force active member who is required to terminate to promote economy or efficiency and has between 10 and 20 years of service in the regular force may choose an immediate annuity reduced, until attainment of age 65 but not thereafter, by 5% for each full year not exceeding six by which
-
the period of service in the regular force is less than 20 years; or
-
the age of the active member at the time of retirement is less than the retirement age applicable to the member's rank,
whichever is the lesser.
A regular force active member who, not having reached retirement age, ceases to be a member of the regular force for any reason other than disability, or to promote economy or efficiency, or while on an indefinite period of service is entitled
-
as an officer having served in the regular force for 20 years or more, to an immediate annuity reduced by 5% for each full year by which his or her age at the time of retirement is less than the retirement age applicable to his or her rank, or
-
as other than an officer having served in the regular force for 20 years or more but less than 25 years, to an immediate annuity reduced by 5% for each full year by which
-
the period of service in the regular force is less than 25 years, or
-
the age at the time of retirement is less than the retirement age applicable to the member's rank,
-
whichever is the lesser.
When a Regular Force Plan pensioner in receipt of an immediate reduced annuity becomes disabled before reaching age 60, the pensioner ceases to be entitled to that immediate reduced annuity and becomes entitled to an immediate annuity adjusted in accordance with regulations to take into account the amount of any immediate reduced annuity which the pensioner may have received prior to becoming disabled.
A.5.17 Annual allowance for Regular Force and Reserve Force Plan members
Annual allowance for members means an annuity payable immediately on retirement or upon attaining age 50, if later. The amount of the allowance is equal to the amount of the deferred annuity to which the member would otherwise be entitled, reduced by 5% multiplied by the difference between 60 and the age when the allowance becomes payable.
However, if the member is at least 50 years old at termination, and has at least 25 years of pensionable service, then the difference is reduced (subject to the above as a maximum) to the greater of
-
55 minus the age, and
-
30 minus the number of years of pensionable service.
When a member in receipt of an annual allowance becomes disabled before reaching age 60, the annual allowance becomes an immediate annuity adjusted in accordance with regulations to take into account the amount of any annual allowance received prior to becoming disabled.
A.5.18 Eligible surviving spouse or common-law partner
Eligible surviving spouse means the surviving spouse or common-law partner of an active member or pensioner except where
-
the active member or pensioner died within one year of marriage, unless the Minister of National Defence is satisfied that the member's health at the time of the marriage justified an expectation of surviving for at least one year; or
-
the pensioner married or began a common-law relationship at age 60 or over, unless after such marriage or partnership the pensioner either
-
became a plan contributor again, or
-
made an optional survivor benefit election within 12 months following the marriage to accept a reduced pension so that the new spouse would be eligible for a survivor pension. This reduction is reversed if and when the new spouse predeceases the pensioner or the spousal union is terminated for reason other than death; or
-
the pensioner is a female who retired before 20 December 1975 and did not make an optional survivor benefit election within the one-year period ending 6 May 1995.
-
A.5.19 Eligible surviving children
Eligible surviving children are all surviving children of an active member or pensioner who are either under age 18, or age 18 or over but under 25 and in full-time attendance at a school or university.
A.5.20 Annual allowance for eligible survivors
Annual allowance means, for the eligible surviving spouse or common-law partner and children of an active member or pensioner, an annuity that becomes payable immediately upon the death of that individual. The amount of the allowance, called a "basic allowance" is different for each Plan.
For Regular Force Plan: the basic allowance equals to:
- 1% of the highest average of annual pensionable earnings of the active member over five consecutive years, multiplied by the number of years of pensionable service not exceeding 35.
The annual allowance for a spouse or a common-law partner is equal to the basic allowance except in the case where the spouse became eligible to a survivor pension as a result of an optional survivor benefit election, in which case it is equal to the percentage of the basic allowance specified by the pensioner making the election.
The annual allowance for an eligible surviving child is equal to 20% of the basic allowance, subject to a reduction if there are more than four eligible surviving children in the same family. The annuity otherwise payable to an eligible surviving child is doubled if the child is an orphan.
Annual allowances are not coordinated with the CPP and are payable in equal monthly instalments in arrears until the end of the month in which the survivor dies or otherwise loses eligibility. If applicable, a residual benefit (Appendix A.5.21) is payable to the estate upon the death of the last survivor.
For Reserve Force Plan, the basic allowance equals to:
-
1% of the greater of the pensioner's total pensionable earnings and total updated pensionable earnings; or,
-
if the member was in receipt of an annual allowance at the time of death, an amount equal to A × B / C where:
-
A = the amount calculated under paragraph (a),
-
B = the amount of the annual allowance, and
-
C = the amount of the deferred annuity to which the pensioner was entitled.
-
Each eligible surviving child of a member is entitled to receive,
-
if the member died leaving an eligible surviving spouse, an allowance equal to 1/4 of the basic allowance or, if there are more than two children, to an annual allowance equal to 1/2 of the basic allowance divided by the number of children; or
-
if the member died without leaving an eligible surviving spouse, and
-
there are fewer than four children, an annual allowance equal to 1/2 of the basic allowance, or
-
there are more than three children, an annual allowance equal to 1.5 times the basic allowance divided by the number of children.
-
The proportion of the basic allowance that constitutes the annual allowance shall be revised when the number of children who are entitled changes (see Appendix A.5.19).
A.5.21 Minimum death benefit
Upon the death of a contributor or pensioner without an eligible survivor, or when the person(s) receiving the annual survivor's allowance (see Appendix A.5.20) dies shortly thereafter, a death benefit is payable in the form of a lump-sum benefit equal to the difference between the greater of:
-
a return of contributions; and
-
five times the annual amount of the unreduced basic pension (life and bridge) to which the contributor would have been entitled, or to which the pensioner was entitled, at the time of death,
and all amounts paid to the contributor or pensioner and eligible survivors.
Adjustments for indexation since termination or retirement are excluded from this calculation.
A.5.22 Division of pension in case of spousal union breakdown
In accordance with the Pension Benefits Division Act (PBDA), upon the breakdown of a spousal union (including common-law partnership), a lump sum can be transferred upon application supported by a court order or by mutual consent agreement, from the amounts in the Superannuation Account, the CFPF and the RFPF to the credit of an active member or pensioner. As at the transfer date, the maximum transferable amount is half the value of the retirement pension accrued by the active or former member during the period of cohabitation. If the member's benefits are not vested, the maximum transferable amount corresponds to half the member's contributions made during the period subject to division, accumulated with interest at the rate applicable on a refund of contributions. The benefits of the active member or pensioner are then reduced accordingly.
As of 31 March 2022, the Pension Benefits Division Regulations does not provide the necessary directions to account for the different benefit provisions under the Reserve Force Plan. Hence, the pension accrued for a member of the Reserve Force Plan cannot be divided upon a breakdown of a spousal union at this time.
A.5.23 Rollovers
Certain members who cease to participate in the Reserve Force Plan subsequently become participants in the Regular Force Plan. As described in section 10.2 of CFSR, any period of pensionable service which is to a member's credit under the Reserve Force Plan on the day before the day on which that member becomes a contributor to the Regular Force Plan is rolled over to the Regular Force Plan. Whenever a rollover occurs, the actuarial liability associated with the member under the Reserve Force Plan is immediately extinguished and a new actuarial liability is immediately established under the Regular Force Plan.
There are two main scenarios in which a rollover of service from the Reserve Force Plan to the Regular Force Plan would arise. In the first scenario a member of Reserve Force makes a successful application to join the Regular Force. The member's transfer from the Reserve Force to the Regular Force triggers the rollover of service. In the second scenario the member begins to contribute to the Regular Force Plan by virtue of meeting the criteria described in section 8.1(1) (d) of the CFSR. This occurs upon the completion of a minimum of 55 months of Canadian Forces service within a period of 60 consecutive months. The member remains in the Reserve Force but is considered to be a member of the Regular Force for the purposes of Part I of the CFSA and the CFSR.
Following a rollover the actuarial liability is removed from Reserve Force Plan and created under the Regular Force Plan and assets are transferred from the RFPF to the CFPF. For members who are not vested when the rollover occurs, PSPC calculates the amount to transfer between the pension funds in the same manner as a return of contributions. For members who are vested when the rollover occurs, PSPC calculates the amount to transfer between the pension plans as the commuted value of the accrued pension at age 60.
Appendix B ― RCA benefit provisions under the Regular Force Plan
This appendix describes the Regular Force Plan pension benefits financed through RCA rather than through the CFSA registered provisions using the Superannuation Account and the CFPF. As described below, RCAs are pension plans not subject to the benefit limitations that apply to registered pension plans because they are taxed on a current rather than on a deferred basis.
Effective 1 May 1995, RCA was established pursuant to the SRAA to provide for all pension benefits in excess of those that may be paid under the CFSA but are limited to be in accordance with the Income Tax Act restrictions on registered pension plans.
The following benefits are currently provided under a RCA to the extent that they are in excess of the Income Tax Act limits.
| Benefit | CFSA registered provisions limit |
|---|---|
| Survivor allowance for service from 1 January 1992 onward (see A.5.20) |
Pre‑retirement death
The amount of spouse allowance is limited in any year to a maximum of two-thirds the retirement benefit that would have been payable to the member in that year. |
| Minimum lump sum death benefit (see A.5.21) |
Pre‑retirement death The amount of pre‑retirement death benefit where the member has no eligible dependants is limited to the greater of the member contributions with interest and the present value of the member's accrued benefits on the day prior to death. Post‑retirement death If the member has no eligible dependants at retirement, then the minimum death benefit is limited to the member contributions with interest. |
| Excess pensionable earnings (provided since 1 May 1995 for service since then) |
The highest consecutive average pensionable earnings is subject to a prescribed yearly maximum that varies by calendar year and the registered plan's benefit formula. The calendar year 2023 Maximum Pensionable Earnings was 196,200 for the Regular Force Plan. |
Appendix C ― Assets, accounts and rates of return
C.1 Assets and accounts available for benefits
The government has a statutory obligation to fulfill the pension promise enacted by legislation to members of the Regular Force Plan. Since 1 April 2000, the government has earmarked invested assets to meet the cost of pension benefits under the CFPF. For the RFPF, the government has earmarked invested assets since its inception on 1 March 2007.
With respect to the unfunded portion of the Regular Force Plan, accounts available for benefits were established to track the government's pension benefit obligations such as the Superannuation Account, for service prior to 1 April 2000, and the RCA Account for benefits in excess of those that can be provided under the Income Tax Act limits for registered pension plans.
C.2 Canadian Forces Superannuation Account
Regular Force Plan member contributions, government costs and benefits earned up to 31 March 2000 are tracked entirely through the CFSA Superannuation Account, which forms part of the Public Accounts of Canada.
The Superannuation Account was credited with all Regular Force member contributions and government costs prior to 1 April 2000, as well as with prior service contributions and costs for elections made prior to 1 April 2000 for periods before 1 April 2000 but credited after that date. It is charged with both the benefit payments made in respect of service earned under the Superannuation Account and the allocated portion of the plan administrative expenses.
The Superannuation Account is credited with interest as though net cash flows were invested quarterly in 20-year Government of Canada bonds issued at prescribed interest rates and held to maturity. No formal debt instrument is issued to the Superannuation Account by the government in recognition of the amounts therein. Interest is credited every three months on the basis of the average yield for the same period on the combined Superannuation Accounts of the Public Service, Canadian Forces and RCMP pension plans.
| Components of plan year balance | Balance in 2020 | Balance in 2021 | Balance in 2022 | Total balance 2020 to 2022 |
|---|---|---|---|---|
| Public accounts opening balance | 45,607 | 44,742 | 46,322 | 45,607 |
| Income | ||||
| Net interest earnings | 1,682 | 1,514 | 1,512 | 4,708 |
| Employer contributions | 2 | 2 | 2 | 6 |
| Member contributions | 2 | 2 | 2 | 6 |
| Transfers received | - dash | - dash | - dash | - dash |
| Actuarial liability adjustments | - dash | 2,605 | - dash | 2,605 |
| Income subtotal | 1,686 | 4,123 | 1,516 | 7,325 |
| Expenditures | ||||
| Annuities | 2,511 | 2,510 | 2,503 | 7,524 |
| Pension divisions | 23 | 14 | 15 | 52 |
| Return of contributions | - dash | - dash | - dash | - dash |
| Pension transfer value payments | 1 | 1 | 1 | 3 |
| Transfers to other pension plans | - dash | - dash | - dash | - dash |
| Minimum benefits | - dash | - dash | - dash | - dash |
| Administrative expenses | 16 | 18 | 16 | 50 |
| Expenditures subtotal | 2,551 | 2,543 | 2,535 | 7,629 |
| Public accounts closing balance | 44,742 | 46,322 | 45,303 | 45,303 |
Since the last valuation, the Superannuation Account balance has decreased by $304 million (a 0.7% decrease) to reach $45,303 million as at 31 March 2022.
C.3 Canadian Forces Pension Fund (CFPF)
Since 1 April 2000, Regular Force contributions (except for prior service elections made prior to 1 April 2000) have been credited to the CFPF. The CFPF is invested in the financial markets with a view to achieving maximum rates of return without undue risk.
The CFPF has been credited with all Regular Force contributions since 1 April 2000, as well as with prior service contributions in respect of elections made since that date. The Pension Fund is also credited with the net investment returns generated by the capital assets managed by PSP. It is debited with both the benefit payments made in respect of service earned and prior service elections made since 1 April 2000 and the allocated portion of the plan administrative expenses.
| Components of plan year balance | Balance in 2020 | Balance in 2021 | Balance in 2022 | Total balance 2020 to 2022 |
|---|---|---|---|---|
| Opening balance | 33,123 | 33,401 | 40,041 | 33,123 |
| Income | ||||
| Net investment earnings | (199) | 6,185 | 4,384 | 10,370 |
| Employer contributions | 799 | 941 | 923 | 2,663 |
| Member contributions | 532 | 610 | 566 | 1,708 |
| Transfers received | 57 | 60 | 34 | 151 |
| Actuarial liability adjustments | 145 | - dash | - dash | 145 |
| Income subtotal | 1,334 | 7,796 | 5,907 | 15,037 |
| Expenditures | ||||
| Annuities | 773 | 854 | 956 | 2,583 |
| Pension divisions | 47 | 35 | 36 | 118 |
| Return of contributions | 2 | 1 | 2 | 5 |
| Pension transfer value payments | 214 | 243 | 267 | 724 |
| Transfers to other pension plans | 2 | 2 | - dash | 4 |
| Minimum benefits | 2 | 1 | 2 | 5 |
| Administrative expenses | 16 | 20 | 22 | 58 |
| Expenditures subtotal | 1,056 | 1,156 | 1,285 | 3,497 |
| Closing balance | 33,401 | 40,041 | 44,663 | 44,663 |
Since the last valuation, the CFPF balance has increased by $11,540 million (a 34.8% increase) to reach $44,663 million as at 31 March 2022.
C.4 Canadian Forces RCA Account
The amount in the RCA account available for benefits is composed of the recorded balance in the RCA Account, which forms part of the Public Accounts of Canada, and a tax credit (CRA refundable tax). Each calendar year, a debit is made from the RCA Account such that in total roughly half of the recorded balances in the Account are held as a tax credit (CRA refundable tax).
No formal debt instrument is issued to the RCA Account by the government in recognition of the amounts therein. Interest is credited every three months on the basis of the average yield for the same period on the combined Superannuation Accounts of the Public Service, Canadian Forces and RCMP pension plans.
| Components of plan year balance | Balance in 2020 | Balance in 2021 | Balance in 2022 | Total balance 2020 to 2022 |
|---|---|---|---|---|
| Public accounts opening balance | 443 | 460 | 487 | 443 |
| Income | ||||
| Net interest earnings | 17 | 16 | 17 | 50 |
| Employer contributions | 26 | 31 | 29 | 86 |
| Member contributions | 5 | 6 | 4 | 15 |
| Income subtotal | 48 | 53 | 50 | 151 |
| Expenditures | ||||
| Annuities | 10 | 11 | 12 | 33 |
| Pension divisions | 1 | 0 | 0 | 1 |
| Pension transfer value payments | 2 | 1 | 3 | 6 |
| Minimum benefits | 0 | 0 | 0 | 0 |
| Amount transfer to CRA | 18 | 14 | 23 | 55 |
| Expenditures subtotal | 31 | 26 | 38 | 95 |
| Public accounts closing balance | 460 | 487 | 499 | 499 |
| Refundable tax | 456 | 470 | 493 | 493 |
Since the last valuation, the RCA Account balance has grown by $56 million (a 12.6% increase) to reach $499 million as at 31 March 2022, and the refundable tax, totalling $439 million as at 31 March 2019, has increased by $54 million (a 12.3% increase) to reach $493 million as at 31 March 2022.
C.5 Reserve Force Pension Fund (RFPF)
Since 1 March 2007, Reserve Force member contributions (for current and prior service) have been credited to the RFPF. The Fund is invested in the financial markets with a view to achieving maximum rates of return without undue risk.
The RFPF has been credited with all contributions as well as with the net investment returns generated by the capital assets managed by PSP. It is debited with benefit payments and plan administrative expenses.
| Components of plan year balance | Balance in 2020 | Balance in 2021 | Balance in 2022 | Total balance 2020 to 2022 |
|---|---|---|---|---|
| Public accounts opening balance | 613 | 596 | 735 | 613 |
| Income | ||||
| Net investment earnings | (4) | 135 | 95 | 226 |
| Employer contributions | 51 | 55 | 60 | 166 |
| Member contributions | 23 | 29 | 26 | 78 |
| Actuarial liability adjustments | 5 | 17 | 17 | 39 |
| Income subtotal | 75 | 236 | 198 | 509 |
| Expenditures | ||||
| Annuities | 10 | 11 | 12 | 33 |
| Pension transfer value payments | 17 | 21 | 17 | 55 |
| Transfers to other pension plans | 57 | 60 | 34 | 151 |
| Minimum benefits | - dash | - dash | - dash | - dash |
| Administrative expenses | 8 | 5 | 6 | 19 |
| Expenditure subtotal | 92 | 97 | 69 | 258 |
| Public accounts closing balance | 596 | 735 | 864 | 864 |
Since the last valuation, the Fund balance has increased by $251 million (a 40.9% increase) to reach $864 million as at 31 March 2022.
C.6 Interest earnings and rates of return
The interest earnings in respect of the Superannuation Account were calculated using the entries in Table 32 which are based on book values since the notional bonds are deemed to be held to maturity. The interest earnings were computed using the dollar-weighted approach and assume that cash flows occur in the middle of the plan year (except for actuarial liability adjustments, which occur on 31 March). The CFPF and the RFPF rates of return are those from PSP 2023 Annual Report.
| Plan year | Superannuation Account | Canadian Forces Pension Fund | Reserve Force Pension Fund |
|---|---|---|---|
| 2020 | 3.8% | (0.6%) | (0.6%) |
| 2021 | 3.5% | 18.4% | 18.4% |
| 2022 | 3.4% | 10.9% | 10.9% |
C.7 Sources of asset and accounts available for benefits data
The Superannuation Account, the RCA Account, the CFPF and the RFPF entries shown in Appendix C.1 above were taken from the Public Accounts of Canada and the financial statements from PSP.
Appendix D ― Membership data
D.1 Sources of membership Data
The individual data in respect of contributors, pensioners, and eligible survivors were provided as at 31 March 2022. The data are extracted from master computer files maintained by the Public Services and Procurement Canada (PSPC). PSPC also provided a listing of pension benefits paid in March 2022 for each pensioner and eligible survivor.
Various tests of internal consistency, as well as tests of consistency with the data used in the previous valuation, with respect to membership reconciliation, basic information (date of birth, date of hire, date of termination, sex, etc.), pensionable service, salary levels and pensions to retirees and survivors were performed. Based on the omissions and discrepancies identified by these tests, and after consulting with PSPC and the Department of National Defence, appropriate adjustments were made to the membership data.
D.2 Summary of membership data
A summary of the valuation data as at 31 March 2022 and the reconciliation of contributors, pensioners, and survivors from 31 March 2019 to at 31 March 2022 are shown in this section. Relevant detailed statistics on contributors, pensioners and survivors are shown in Appendix K.
| blank | Regular Force as at 31 March 2022 | Regular Force as at 31 March 2019 | Reserve Force as at 31 March 2022 | Reserve Force as at 31 March 2019 |
|---|---|---|---|---|
| Contributors | ||||
| Number | 69,711 | 71,532 | 20,890 | 18,217 |
| Average pensionable earnings | $82,982 | $74,054 | $20,284 | $18,595 |
| Average age | 35.9 | 35.6 | 34.5 | 34.5 |
| Average accrued serviceTable 37 footnote a | 11.6 | 11.6 | 7.2 | 7.6 |
| Retirement pensioners in pay | ||||
| Number | 64,802 | 90,620 | 2,519 | 1,829 |
| Average annual pension in pay | $36,755 | $36,803 | $4,765 | $5,035 |
| Average age | 68.8 | 64.5 | 65.9 | 64.6 |
| 3B disability pensioners in payTable 37 footnote b | ||||
| Number | 28,101 | n/a | 281 | n/a |
| Average annual pension in pay | $32,136 | n/a | $2,801 | n/a |
| Average age | 56.0 | n/a | 63.3 | n/a |
| 3A disability pensioners | ||||
| Number | 432 | 494 | 2 | n/a |
| Average annual pension in pay | $18,576 | $18,934 | $1,461 | n/a |
| Average age | 72.0 | 71.6 | 70.8 | n/a |
| Deferred pensionersTable 37 footnote c | ||||
| Number | 3,937 | 2,715 | 8,530 | 7,103 |
| Average annual deferred pension | $8,782 | $8,761 | $1,366 | $1,348 |
| Average age | 39.4 | 38.4 | 38.0 | 36.3 |
| Eligible surviving spouses | ||||
| Number | 21,049 | 21,720 | 160 | 112 |
| Average annual pension in pay | $16,001 | $14,905 | $1,936 | $1,988 |
| Average age | 79.9 | 79.4 | 60.6 | 57.5 |
| Eligible surviving children | ||||
| Number | 515 | 575 | 44 | 50 |
| Average annual pension in pay | $2,968 | $2,671 | $508 | $376 |
| Pending members | ||||
| Number | 1,157 | n/a | 880 | n/a |
| Average age | 31.7 | n/a | 33.1 | n/a |
|
Table 37 footnotes
|
||||
| Components of the reconciliation | Male officer | Male other rank | Male total | Female officer | Female other rank | Female total | Total |
|---|---|---|---|---|---|---|---|
| As at 31 March 2019 | 14,914 | 45,189 | 60,103 | 3,619 | 7,810 | 11,429 | 71,532 |
| Data corrections | (155) | 426 | 271 | (35) | 90 | 55 | 326 |
| New contributors | |||||||
| New entrants | 1,754 | 6,965 | 8,719 | 625 | 1,336 | 1,961 | 10,680 |
| Rehired from cash-out | 53 | 262 | 315 | 14 | 26 | 40 | 355 |
| Rehired from pensioners Part I | 55 | 97 | 152 | 6 | 8 | 14 | 166 |
| Rehired from pensioners Part I.1 | 1 | 16 | 17 | 1 | 2 | 3 | 20 |
| Subtotal | 1,863 | 7,340 | 9,203 | 646 | 1,372 | 2,018 | 11,221 |
| Changes of officers/other ranks | 667 | (667) | - dash | 145 | (145) | - dash | - dash |
| Lump sum terminations | |||||||
| Return of contribution | (185) | (1,234) | (1,419) | (69) | (197) | (266) | (1,685) |
| Transfer value | (372) | (2,280) | (2,652) | (90) | (300) | (390) | (3,042) |
| Pending | (108) | (705) | (813) | (24) | (106) | (130) | (943) |
| Rollover termination | |||||||
| Transfer to Res. Part I | (5) | (21) | (26) | (2) | (3) | (5) | (31) |
| Transfer to Reg. Force | 240 | 1,084 | 1,324 | 100 | 335 | 435 | 1,759 |
| Subtotal | (430) | (3,156) | (3,586) | (85) | (271) | (356) | (3,942) |
| Pensionable terminations | |||||||
| Disability (3B) | (560) | (3,392) | (3,952) | (206) | (878) | (1,084) | (5,036) |
| Disability (3A) | (1) | (4) | (5) | (1) | (3) | (4) | (9) |
| Death | (19) | (104) | (123) | (6) | (13) | (19) | (142) |
| Retirement | |||||||
| Immediate | (1,157) | (1,625) | (2,782) | (160) | (177) | (337) | (3,119) |
| Deferred | (190) | (781) | (971) | (54) | (95) | (149) | (1,120) |
| Subtotal | (1,927) | (5,906) | (7,833) | (427) | (1,166) | (1,593) | (9,426) |
| As at 31 March 2022 | 14,932 | 43,226 | 58,158 | 3,863 | 7,690 | 11,553 | 69,711 |
| Components of the reconciliation | Male officer | Male other rank | Male total | Female officer | Female other rank | Female total | Total |
|---|---|---|---|---|---|---|---|
| As at 31 March 2019 | 4,180 | 10,012 | 14,192 | 2,090 | 1,935 | 4,025 | 18,217 |
| Data corrections | 48 | (15) | 33 | 5 | 7 | 12 | 45 |
| New contributors | |||||||
| New participants | 1,165 | 5,905 | 7,070 | 442 | 1,363 | 1,805 | 8,875 |
| Rehired/pensioners Part I.1 | 180 | 247 | 427 | 100 | 47 | 147 | 574 |
| Subtotal | 1,345 | 6,152 | 7,497 | 542 | 1,410 | 1,952 | 9,449 |
| Changes of officers/other ranks | 122 | (122) | - dash | 37 | (37) | - dash | - dash |
| Lump sum terminations | |||||||
| Return of contribution | (90) | (438) | (528) | (43) | (82) | (125) | (653) |
| Transfer value | (238) | (643) | (881) | (124) | (136) | (260) | (1,141) |
| Pending | (123) | (531) | (654) | (53) | (86) | (139) | (793) |
| Rollover termination | |||||||
| Transfer to Res. Part I | 5 | 21 | 26 | 2 | 3 | 5 | 31 |
| Transfer to Reg. Force | (240) | (1,084) | (1,324) | (100) | (335) | (435) | (1,759) |
| Subtotal | (686) | (2,675) | (3,361) | (318) | (636) | (954) | (4,315) |
| Pensionable terminations | |||||||
| Disability | (25) | (32) | (57) | (12) | (10) | (22) | (79) |
| Death | (7) | (27) | (34) | (5) | (2) | (7) | (41) |
| Retirement | (610) | (1,250) | (1,860) | (329) | (197) | (526) | (2,386) |
| Subtotal | (642) | (1,309) | (1,951) | (346) | (209) | (555) | (2,506) |
| As at 31 March 2022 | 4,367 | 12,043 | 16,410 | 2,010 | 2,470 | 4,480 | 20,890 |
| Components of the reconciliation | Male officer | Male other rank | Male total | Female officer | Female other rank | Female total | Total |
|---|---|---|---|---|---|---|---|
| Retirement pensioners | |||||||
| As at 31 March 2019 | 17,187 | 47,189 | 64,376 | 1,327 | 3,664 | 4,991 | 69,367 |
| Data corrections | 143 | (147) | (4) | 8 | (32) | (24) | (28) |
| New pensioners | 1,347 | 2,406 | 3,753 | 214 | 272 | 486 | 4,239 |
| Death | (1,226) | (4,047) | (5,273) | (34) | (56) | (90) | (5,363) |
| Rehired | (55) | (97) | (152) | (6) | (8) | (14) | (166) |
| As at 31 March 2022 | 17,396 | 45,304 | 62,700 | 1,509 | 3,840 | 5,349 | 68,049 |
| Disability pensioners (3A) | |||||||
| As at 31 March 2019 | 45 | 380 | 425 | 13 | 56 | 69 | 494 |
| Data corrections | 6 | 2 | 8 | - dash | 6 | 6 | 14 |
| New pensioners | 1 | 4 | 5 | 1 | 3 | 4 | 9 |
| Death | (8) | (74) | (82) | (1) | (2) | (3) | (85) |
| As at 31 March 2022 | 44 | 312 | 356 | 13 | 63 | 76 | 432 |
| Disability pensioners (3B) | |||||||
| As at 31 March 2019 | 2,257 | 17,618 | 19,875 | 609 | 3,484 | 4,093 | 23,968 |
| Data corrections | 37 | 259 | 296 | 15 | 85 | 100 | 395 |
| New pensioners | 560 | 3,392 | 3,952 | 206 | 878 | 1,084 | 5,036 |
| Death | (45) | (518) | (563) | (6) | (39) | (45) | (608) |
| Rehired | (1) | - dash | (1) | - dash | - dash | - dash | - dash |
| As at 31 March 2022 | 2,808 | 20,751 | 23,559 | 824 | 4,408 | 5,232 | 28,791 |
| Components of the reconciliation | Male officer | Male other rank | Male total | Female officer | Female other rank | Female total | Total |
|---|---|---|---|---|---|---|---|
| Retirement pensioners | |||||||
| As at 31 March 2019 | 2,145 | 4,747 | 6,892 | 858 | 874 | 1,732 | 8,624 |
| Data corrections | (60) | (17) | (77) | (37) | 33 | (4) | (81) |
| New pensioners | 610 | 1,250 | 1,860 | 329 | 197 | 526 | 2,386 |
| Death | (19) | (10) | (29) | (6) | (1) | (7) | (36) |
| Rehired | (79) | (118) | (197) | (42) | (19) | (61) | (258) |
| As at 31 March 2022 | 2,597 | 5,852 | 8,449 | 1,102 | 1,084 | 2,186 | 10,635 |
| Disability pensioners | |||||||
| As at 31 March 2019 | 67 | 165 | 232 | 7 | 69 | 76 | 308 |
| Data corrections | 49 | (2) | 47 | 33 | (26) | 7 | 54 |
| New pensioners | 25 | 32 | 57 | 12 | 10 | 22 | 79 |
| Death | (3) | (4) | (7) | (5) | (2) | (7) | (14) |
| Rehired | (3) | (5) | (8) | (3) | - dash | (3) | (11) |
| As at 31 March 2022 | 135 | 186 | 321 | 44 | 51 | 95 | 416 |
| Components of the reconciliation | Regular Force | Reserve Force | ||||
|---|---|---|---|---|---|---|
| Widows | Widowers | Total | Widows | Widowers | Total | |
| 31 March 2019 | 21,330 | 390 | 21,720 | 98 | 14 | 112 |
| Data corrections | 162 | (16) | 146 | 1 | 2 | 3 |
| New from the death of | ||||||
| contributors | 70 | 11 | 81 | 13 | 4 | 17 |
| pensioners | 3,281 | 58 | 3,339 | 22 | 8 | 30 |
| Spouse deaths | (4,178) | (59) | (4,237) | (1) | (1) | (2) |
| 31 March 2022 | 20,665 | 384 | 21,049 | 133 | 27 | 160 |
| Components of the reconciliation | Regular Force | Reserve Force | ||||
|---|---|---|---|---|---|---|
| Children | Students | Total | Children | Students | Total | |
| As at 31 March 2019 | 443 | 132 | 575 | 41 | 9 | 50 |
| Data corrections | 11 | 31 | 42 | 7 | (14) | (7) |
| New from the death of | ||||||
| contributors | 77 | 9 | 86 | 6 | 1 | 7 |
| pensioners | 63 | 30 | 93 | 5 | 1 | 6 |
| Eligible as student | (73) | 73 | - dash | (3) | 3 | - dash |
| Termination of benefits | (105) | (176) | (281) | (12) | - dash | (12) |
| As at 31 March 2022 | 416 | 99 | 515 | 44 | - dash | 44 |
Appendix E ― CFSA Valuation methodology
E.1 Plan assets and accounts
E.1.1 Canadian Forces Superannuation Account
The balance of the Superannuation Account forms part of the Public Accounts of Canada. The underlying notional bond portfolio described in Appendix C is shown at book value.
The only other Superannuation Account–related amount available for benefits consists of the discounted value of future Regular Force member contributions and government credits in respect of prior service elections. The discounted value of future member contributions was calculated using the projected Superannuation Account yields. The government is assumed to match these future member contributions when paid at a single rate, but no contributions are credited by the government if the member is paying the double rate.
E.1.2 Canadian Forces and Reserve Force Pension Funds
For valuation purposes, an adjusted market value method is used to determine the actuarial value of assets in respect of the CFPF and RFPF. The method is unchanged from the previous valuations.
Under the adjusted market value method, the difference between the observed investment returns during a given plan year and the expected investment returns for that year based on the previous report assumptions, is recognized over five years at the rate of 20% per year. The actuarial value of assets is then determined by applying a 10% corridor, such that the actuarial value of assets is within 10% of the market value of assets. As a result, the actuarial value of assets is a five-year smoothed market value where the investment gains or losses are recognized at the rate of 20% per year subject to a 10% corridor to the market value of assets. The value produced by this method is related to the market value of the assets but is more stable than the market value.
The other Pension Fund–related assets consist of:
-
the discounted value of future member and government contributions in respect of prior service electionsFootnote 10. The discounted value of future member and government contributions was calculated using the assumed rates of return on the Pension Fund;
-
the amount payable/receivable from Reserve Force Rollover membersFootnote 11; and
-
the remaining contributions for processed and unprocessed Reserve Force prior service. This is the estimated amount of contributions for pre-2007 Reserve Force service that Regular Force members and Reserve Force members have committed to purchase.
The actuarial value of Canadian Forces Pension Fund assets determined as at 31 March 2022 under the adjusted market value method is $41,091 million and was determined as follows.
Table 44 Actuarial value of Canadian Forces Pension Fund assets
($ millions)
| blank | Plan year | Total | ||||
|---|---|---|---|---|---|---|
| 2018 | 2019 | 2020 | 2021 | 2022 | ||
| Actual net investment return (A) | 2,665 | 2,188 | (199) | 6,185 | 4,384 | blank |
| Expected investment return (B) | 1,304 | 1,497 | 1,964 | 1,412 | 2,128 | blank |
| Investment gains (losses) (A-B) | 1,361 | 691 | (2,163) | 4,773 | 2,256 | blank |
| Unrecognized percentage | 0% | 20% | 40% | 60% | 80% | blank |
| Unrecognized investment gains (losses) | 0 | 138 | (865) | 2,864 | 1,805 | 3,942 |
| blank | Total |
|---|---|
| Market value as at 31 March 2022 | 44,663 |
| Less | |
| Total unrecognized investment gains (losses) | 3,942 |
| Actuarial value as at 31 March 2022 (before application of corridor) | 40,721 |
| Impact of the application of corridorTable 44 footnote a | 0 |
| Actuarial value as at 31 March 2022 (after application of corridor) | 40,721 |
| Plus | |
| Present value of prior service contributions | 297 |
| Amount receivable from Part I.1 - Rollover members | 73 |
| Actuarial value as at 31 March 2022 | 41,091 |
|
Table 44 footnotes
|
|
The actuarial value of the Reserve Force Fund assets determined as at 31 March 2022 under the adjusted market value method is $738 million and was determined as follows.
Table 45 Actuarial value of Reserve Force Pension Fund assets
($ millions)
| blank | Plan year | Total | ||||
|---|---|---|---|---|---|---|
| 2018 | 2019 | 2020 | 2021 | 2022 | ||
| Actual net investment return (A) | 61 | 49 | (4) | 135 | 95 | blank |
| Expected investment return (B) | 27 | 29 | 36 | 25 | 40 | blank |
| Investment gains (losses) (A-B) | 34 | 20 | (40) | 110 | 55 | blank |
| Unrecognized percentage | 0% | 20% | 40% | 60% | 80% | blank |
| Unrecognized investment gains (losses) | - dash | 4 | (16) | 66 | 44 | 98 |
| blank | Total |
|---|---|
| Market value as at 31 March 2022 | 864 |
| Less | |
| Total unrecognized investment gains (losses) | 98 |
| Actuarial value as at 31 March 2022 (before application of corridor) | 766 |
| Impact of the application of corridorTable 45 footnote a | 12 |
| Actuarial value as at 31 March 2022 (after application of corridor) | 778 |
| Less | |
| Amount payable to Regular Force Plan (rollover members) | 73 |
| Plus | |
| Present value of prior service contributions | 33 |
| Actuarial value as at 31 March 2022 | 738 |
|
Table 45 footnotes
|
|
E.2 Actuarial cost method
As benefits earned in respect of current service will not be payable for many years, the purpose of an actuarial cost method is to assign costs over the working lifetime of the members.
As in the previous valuation, the projected accrued benefit actuarial cost method (also known as the projected unit credit method) was used to determine the current service cost and actuarial liability. Consistent with this cost method, pensionable earnings are projected up to retirement using the assumed annual increases in average pensionable earnings (including seniority and promotional increases). The yearly maximum salary cap and other benefit limits under the Income Tax Act described in Appendix B were taken into account to determine the benefits payable under CFPF and RFPF and those payable under the RCA.
E.2.1 Current service cost
Under the projected accrued benefit actuarial cost method, the current service cost, also called the normal cost, computed in respect of a given year, is the sum of the value, discounted in accordance with the actuarial assumptions for the CFPF and RFPF, of all future payable benefits considered to accrue in respect of that year's service. The CFPF and RFPF administrative expensesFootnote 12 are deemed to be included in the total current service cost.
Under this method, the current service cost for an individual member will increase each year as the member approaches retirement. However, all other things being equal, the current service cost for the total population, expressed as a percentage of total pensionable payroll, can be expected to remain stable as long as the average age and service of the total population remains constant. For a given year, the government current service cost is the total current service cost reduced by the members' contributions during the year.
E.2.2 Actuarial liability
The actuarial liability with respect to contributor corresponds to the value, discounted in accordance with the actuarial assumptions, of all future payable benefits accrued as at the valuation date in respect of all previous service to the credit of members. For pensioners and survivors, the actuarial liability corresponds to the value, discounted in accordance with the actuarial assumptions, of future payable benefits.
E.2.3 Actuarial excess/(shortfall) and actuarial surplus/(deficit)
It is unlikely that the actual experience will conform exactly to the assumptions that underlie the actuarial estimates. Thus, a balancing item must be calculated under this cost method to estimate the necessary adjustments. Adjustments may also be necessary if the terms of the pension benefits enacted by legislation are modified or if assumptions need to be updated.
The actuarial excess/(shortfall) is the difference between the actuarial value of assets and the actuarial liability under the Superannuation Account and the actuarial surplus/(deficit) is the difference between the actuarial value of assets and the actuarial liability under the CFPF or the RFPF. The disposition of any actuarial surplus or deficit is defined in the CFSA.
E.2.4 Government contributions
The recommended government contribution corresponds to the sum of:
-
the government current service cost;
-
the government contributions for prior service; and
-
as applicable, special payments in respect of a deficit or, as the case may be, actuarial surplus debits.
E.2.5 Hypothetical wind-up valuation
The payment of accrued pension benefits being the responsibility of the government, the likelihood of the plan being wound-up and its obligation not being fulfilled is practically nonexistent. Further, the legislation does not define the benefits payable upon wind-up. Therefore, a hypothetical wind-up valuation has not been performed.
E.2.6 Age and service determination
In the previous valuation, the Age Last methodology was applied to determine ages and services used for eligibility and decrements. Under this approach, age is the age at the most recent birthday and service is based on the member's completed years of service.
In this valuation, the Age Nearest methodology is applied; age and service are determined by rounding the exact value to the nearest integer.
The change from Age Last to Age Nearest methodology mainly affects the timing of benefit eligibility and application of age and/or service-dependent decrements.
E.3 Projected yields and rates of return
The projected yields (shown in Appendix F) used to calculate future interest credits to the Superannuation Account are the projected annual yields on the combined book value of the Superannuation Accounts of the Public Service, Canadian Forces and RCMP pension plans.
The projected Superannuation Account yields were determined by an iterative process involving the following:
-
the combined notional bond portfolio of the three Superannuation Accounts as at the valuation date;
-
the assumed future new money interest rates (also shown in Appendix F);
-
the expected future benefits payable in respect of all pension entitlements accrued up to 31 March 2000;
-
the expected future contributions for prior service elections made up to 31 March 2000; and
-
the expected future administrative expenses,
taking into account that the quarterly interest credited to the Superannuation Account is calculated as if the principal at the beginning of a quarter remains unchanged during the quarter.
The projected yields (shown in Appendix F) were then used for the computation of the present value of benefits to determine the liability for service prior to 1 April 2000.
The projected rates of return (shown in Appendix F) assumed for computing the present value of the benefits accrued or accruing under the CFPF and the RFPF were developed on the basis that the Funds hold a diversified mix of assets.
E.4 Membership data
For valuation purposes, individual data on each member were used. The member data shown in Appendices D and K was provided as at 31 March 2022. This valuation is based on the member data as at the valuation date. The information in respect of the contributions for elected prior service was provided as at 31 March 2022. Future member contributions in respect of elected prior service take into account only the payment streams that were still in effect at 31 March 2022. Only payments due after 31 March 2022 were included.
Appendix F ― CFSA Economic assumptions
As per the Funding Policy, all economic assumptions used in this report are best-estimate assumptions, i.e. they reflect our best judgement of the future long-term experience of the plan and do not include margins.
F.1 Inflation-related assumptions
F.1.1 Level of inflation
Price increases, as measured by changes in the Consumer Price Index (CPI), tend to fluctuate from year to year. In 2021, the Bank of Canada and the Government of Canada renewed their commitment to keep inflation between 1% and 3% with a target at the mid-point of 2% until the end of 2026Footnote 13. The Bank of Canada renewed its monetary policy framework in 2021 and came up with Canada's flexible inflation-targeting framework for 2022 to 2026. Based on economic forecasts as of January 2023, the CPI is expected to increase at a rate above 2% for the following five years and to revert to the Bank of Canada's long-term target thereafter. It is assumed that the Bank of Canada will remain committed to meeting the mid-range 2% target. In this report, it is assumed that the level of inflation will be 6.6% in plan year 2023, 3.3% in plan year 2024, 2.3% in plan year 2025, and 2.1% in plan years 2026 and 2027. The ultimate rate of 2.0% is reached in plan year 2028, which is unchanged from the assumed ultimate rate in the previous valuation.
F.1.2 Increase in pension amounts
The assumption related to increase in pension amounts is required to account for indexation of pensions each January 1st. It is derived by applying the indexation formula described in Appendix A, which relates to the assumed CPI increases over successive 12-month periods ending on September 30.
F.2 Employment earnings increases
F.2.1 Increase in the Year's Maximum Pensionable Earnings (YMPE)
Since the benefit payable under the plan when a pensioner attains age 65Footnote 14 is calculated based on the YMPE, an assumption for the increase in the YMPE is required. The assumed increase in the YMPE for a given calendar year is derived, in accordance with the Canada Pension Plan to correspond to the increase in the average weekly earnings (AWE), as calculated by Statistics Canada, over successive 12-month periods ending on 30 June. The AWE, and thus the YMPE, is deemed to include a component for seniority and promotional increases.
The YMPE is equal to $66,600 for calendar year 2023. It increased by 2.6% compared to 2022. Future increases in the YMPE correspond to the assumed realFootnote 15 increases in the AWE plus assumed increases in the CPI.
The real-wage differential (real increase in the AWE) is developed taking into account historical trends, a possible labour shortage and an assumed moderate economic growth for Canada. Due to elevated inflation that arose as the economy emerged from the COVID-19 pandemic, it is -0.1% in 2023, but is assumed to gradually converge to the ultimate assumption of 0.9% by 2026 (1.0% in the previous valuation). The ultimate real-wage differential assumption combined with the ultimate price increase assumption results in an assumed annual increase in nominal wages of 2.9% in 2027 and thereafter. Thus, the ultimate rate of increase for the YMPE is 2.9%.
F.2.2 Economic increase in pensionable earnings and wage measure
Pensionable earnings are projected to calculate the pension liability and service cost. The increase in pensionable earnings has two components, the economic increase and the seniority and promotional increase. It is assumed that the economic increase in pensionable earnings is separate from the seniority and promotional increase which is accounted for in the demographic assumptions. Except for the first three years which were provided by the Department of National Defence, the annual increase in pensionable earnings is assumed to be 0.6% higher than the corresponding increase in CPI. This corresponds to an ultimate increase in average pensionable earnings of 2.6% for plan year 2028 and thereafter (2.7% in the previous valuation for plan year 2026 and thereafter).
F.2.3 Increase in tax related Maximum Pensionable Earnings (MPE)
The maximum annual pension accrual of $3,420.00 for 2022 will increase to $3,506.67 for 2023, in accordance with the Income Tax Regulations. Thereafter, the maximum annual pension accrual is assumed to increase in accordance with the assumed annual increase in the YMPE, which is the same as the assumed annual increase in the AWE.
F.2.3.1 Regular Force Plan
The tax-related maximum pensionable earnings were derived from both the maximum annual pension accrual under a registered defined benefit plan as previously defined and the YMPE.
The MPE is $196,200 for calendar year 2023.
F.2.3.2 Reserve Force Plan
The tax-related maximum pensionable earnings were derived from the maximum annual pension accrual under a registered defined benefit plan.
The MPE is $233,800 for calendar year 2023. Since no Registered Compensation Agreement has been setup for members of Part I.1, no contributions nor benefit accrual are accumulated for members earnings above the MPE.
F.3 Investment-related assumptions
F.3.1 New money rate
The new money rate is the nominal yield on 10-year-plus Government of Canada bonds and is set for each year in the projection period. The real yield on 10-year-plus federal bonds is equal to the new money rate less the assumed rate of inflation.
The one-year average real yield on long-term Canadian federal bonds as at 31 March 2023 is set at (3.6%) and is assumed to gradually increase to reach 2.0% by plan year 2034 and remain at that level.
The annual nominal yield on 10-year-plus federal bonds is assumed to be 3.1% in plan year 2023. It is projected to increase gradually to its ultimate level of 4.0% in plan year 2034. The assumed rates over the short-term (2023-2026) are consistent with the average of private sector forecasts and take into account the recent market conditions as of 31 March 2023. The ultimate level of 4.0% is equivalent to an ultimate real rate of 2.0%. The ultimate real yield was assumed to be 2.5% in plan year 2036 in the previous valuation. The assumed real new money rates over the plan years 2023 to 2034 are on average 0.4% higher than those assumed in the previous valuation over the same period.
F.3.2 Projected yields on Superannuation Account
The projected yields on the Superannuation Account are required for the computation of present values of benefits to determine the liability for service prior to 1 April 2000. The projected nominal yields on the Superannuation Account were determined by an iterative process involving the following:
-
the combined notional bond portfolio of the three Superannuation Accounts as at the valuation date;
-
the assumed future new money interest rates;
-
the expected future benefits payable in respect of all pension entitlements accrued up to 31 March 2000;
-
the expected future contributions for prior service elections made up to 31 March 2000; and
-
the expected future administrative expenses,
taking into account that each quarterly interest credit to a Superannuation Account is calculated as if the principal at the beginning of a quarter remains unchanged during the quarter. The projected nominal yield on the Account is 3.2% in plan year 2023. It is projected to reach a low of 2.5% in 2032 and to reach its ultimate value of 4.0% in 2049.
F.3.3 Rate of return on the CFPF & RFPF
The expected annual nominal rates of return on the Pension Fund are required for the computation of present values of benefits to determine the liability for service since 1 April 2000 and the current service cost. The following sections describe how the rates of return on the Pension Fund are determined.
F.3.3.1 Investment strategy and asset mix
Since 1 April 2000, government and employee contributions, net of benefit payments and administrative expenses, are invested in capital markets by PSP. PSP's mandate is to achieve a maximum rate of return, without undue risk of loss, with regard to the funding, policies and requirements of the PSP. PSP's investment policy is set and approved by its Board of Directors and takes into account the Funding Policy for the Public Sector Pension Plans, including the Reference Portfolio set out in this Funding Policy, as well as financial market constraints. The Reference Portfolio is a passively managed, easily investable portfolio used to express the funding risk target of the Government of Canada in respect to the public sector pension plans. It is communicated by the Treasury Board of Canada Secretariat on behalf of the President of the Treasury Board to PSP, which then uses this portfolio as a starting point for its investment policy.
For the purpose of this report and in line with PSP's investment policy, the investments have been grouped into four broad categories: fixed income securities, equities, real assets and credit. Fixed income securities consist of a mix of federal, provincial and inflation-linked bonds. Equities consist of public (Canadian and foreign) and private equities. Real assets include real estate, infrastructure and natural resources. Credit is composed of private debt investments, non-investment-grade public debt and quasi-debt investments.
As at 31 March 2022, PSP's assets consisted of 20% fixed income securities (including 2% cash), 41% equity (including 0.6% complementary investments), 29% real assets and 10% credit. PSP has developed a long-term target Policy Portfolio (approved by its Board of Directors in fall 2022 and subject to an annual review), which consists of 21% fixed income securities, 39% equity, 31% real assets and 9% credit. The Policy Portfolio asset mix weights represent long-term targets. Therefore, it is assumed that the initial asset mix (derived using the actual investments reported by PSP as at 31 March 2022) will gradually converge towards the long-term target Policy Portfolio. The ultimate asset mix will be reached in plan year 2025 in the projection period.
Net cash flows (contributions less expenditures, excluding special payments, if any) are expected to become negative during plan year 2026 for CFPF and 2042 for RFPF, at which points a portion of investment income will be required to pay benefits.
Table 46 presents the assumed asset mix for each plan year throughout the projection period.
| Plan year | Fixed income securities | Cash | Public equity | Private equity | Real assets | Credit |
|---|---|---|---|---|---|---|
| 2023 | 18% | 2% | 26% | 15% | 29% | 10% |
| 2024 | 19% | 2% | 27% | 13% | 30% | 9% |
| 2025 and after | 19% | 2% | 27% | 12% | 31% | 9% |
F.3.3.2 Real rates of return by asset type
Rates of return are determined for each asset class in which the Pension Fund assets are invested. With the exception of fixed income securities and cash, rates of return are assumed to remain constant for the entire projection period. The expected progression of fixed income securities' rates of return reflects the current context of rising yields. A constant rate of return is assumed for more volatile asset classes, reflecting the difficulty to predict annual market returns.
The rates of return were developed by looking at historical returns (expressed in Canadian dollars); these returns were then adjusted upward or downward to reflect future expectations. Given the long projection period, future gains and (losses) due to currency variations are expected to offset each other over time. Hence, it was assumed that currency variations will not have an impact on the long-term rates of return.
As in the previous valuation, an overall allowance for diversification has been added to the rate of return on the total assets. Such diversification is achieved through the rebalancing of the portfolio and aims at keeping the asset mix constant.
All rates of return described in this section are shown before reduction for assumed investment expenses; Appendix F.3.3.3 describes how the returns are adjusted for investment expenses.
Cash
The real yield on cash is negative in the first year of the projection period, reflecting higher-than-normal inflation. The real yield on cash in the subsequent years is expected to converge to historical norms. This is due to the central banks' recent consecutive policy interest rate hikes to stave off high inflation. The real yield on cash is expected to reach 0.5% in plan year 2033.
Fixed income securities
As at 31 March 2022, PSP had 20% of its portfolio invested in fixed income securities, including Canadian fixed income, inflation-linked bonds (mostly US Treasury Inflation-Protected Securities (TIPS)) and cash. It is assumed that the proportion invested in fixed income securities will increase to 21% of Pension Fund assets in plan year 2024 and remain at that level for the projection period.
The fixed income securities' ultimate mix (excluding cash) in plan year 2024 and thereafter is expected to consist of 17% federal bonds, 20% provincial bonds, 37% US TIPS and 26% emerging market debt, which reflects PSP's long-term target allocation.
As described in Appendix F.3.1 above, the assumed real yield on 10-year-plus federal bonds is expected to remain negative until plan year 2024 and then increase gradually to its ultimate level of 2.0% in plan year 2034. Compared to cash, the yield on 10-year-plus federal bonds is 35 basis points lower in plan year 2023 and 142 basis points lower in plan year 2024 due to the inverted yield curve. Starting in plan year 2025, the yield on 10-year plus federal bonds is assumed to be higher than cash and is assumed to reach the ultimate spread of 150 basis points by plan year 2034.
Since the current PSP'S Policy Portfolio and its long-term target Policy Portfolio are composed of universe bonds (long, mid and short term), it is assumed that fixed income securities are composed of universe bonds for the entire projection period. Due to their overall shorter maturity, the yields on universe bonds are lower than the yields on long-term bonds. As a result, the spreads of universe bonds over cash are lower than those of long-term bonds over cash. The spread of the universe federal bonds over cash is assumed to be negative 50 basis points in plan year 2023 due to the inverted yield curve but will gradually increase to 79 basis points in plan year 2034.
Credit quality is another important factor affecting bond spreads. The spread on provincial bonds versus cash is expected to be greater than the spread of federal bonds versus cash. However, that spread is smaller than the spread on emerging market bonds, which present additional credit risk and currency risk. The initial spread of universe provincial bonds over cash is assumed to be 28 basis points while the ultimate spread is assumed to be 168 basis points (in plan year 2034). The initial spread of emerging market debt over cash is assumed to be 240 basis points and the ultimate spread is assumed to increase to 269 basis points in plan year 2034. Inflation-linked bonds offer protection against inflation, which tend to lower the spread versus cash. The initial spread of inflation-linked bonds (US TIPS) over cash is assumed to be 309 basis points and is expected to decrease to 110 basis points in plan year 2034.
The expected real rates of return for individual bonds take into account the coupons and market value fluctuations due to the expected movement of their respective yield rates. An ultimate fixed income real rate of return of 2.1% is assumed for 2034 and thereafter.
Equity
As at 31 March 2022, 41% of the assets of the Pension Fund are invested in equities (both public and private). In the derivation of the real rates of return for these equity investments, consideration was given to dividend yields, expected growth of the underlying economies, and long-term risk premiums for various factors such as size and geography.
Public equities are composed of developed market equities, developed market small capitalization equities (small caps), and emerging market equities.
Various elements contribute to the return on an equity investment such as earnings, dividends paid to shareholders, fluctuation in valuation, and exchange rates for non-Canadian investments.
Over long periods, valuation changes and currency fluctuations are not expected to contribute significantly to the return on broad equity markets. Therefore, it is assumed that expectations regarding dividend yields and earnings growth are sufficient to project future equity returns, with additional adjustments for the riskiness of small caps and emerging market equities. Based on historical dividend yields for developed markets and PSP's Policy Portfolio equity allocation, the income derived from dividend and buybacks yield on developed market equities is expected to be 3.1%. Growth in earnings is proxied using GDP growth per capita; and it is expected to add 0.9% to the overall real return of developed market equities. Hence, the expected return on developed market equities is 4.0%. Because of their additional risk, small caps are assumed to yield an additional 0.2% and emerging market equities are assumed to yield an additional 1.0%.
The overall real return on public equities, based on PSP's relative allocation to developed market, small caps and emerging market equities, is projected to be 4.3%.
The expected real return for private equities is expected to be 70 basis points higher than for public equities, reflecting the additional risk inherent with investments in private markets. Thus, the real rate of return for private equity is projected to be 5.0%.
Real assets
As at 31 March 2022, 29% of the assets of the Pension Fund are invested in the real assets (47% real estate, 36% infrastructure, and 17% natural resources). The expected real rate of return on real assets is the asset-value weighted average returns of the three sub-classes. The returns on real estate and infrastructure assets are derived from two components: income returns and asset valuation growth. Each component references historical data and judgment on the expectation of the future outcomes such as projected per capita GDP growth rate. Since natural resources is a relatively new type of asset class, the historical data on returns is limited. Therefore, the return on natural resources is assumed as the weighted average returns of real estate and infrastructure. The income returns for real estate and infrastructure are 3.2% and 3.3%, respectively. In addition, a 0.6% growth return is assumed for both asset types. Collectively, the real assets are projected to earn 3.9% throughout the projection period.
Credit
As at 31 March 2022, 10% of the assets of the Pension Fund are invested in credit. Based on the information received, PSP'S exposure to this asset class is made through High yield US treasury bonds. It is assumed that the return on credit would yield 250 basis points above Canadian federal universe bonds (130 basis points) adjusted to U.S. market (-10 basis points). Thus, Credit is projected to earn 3.7% real throughout the projection period.
Summary of real rate of return by asset class
In Table 47, the real rates of return by asset type are presented without any allowance for rebalancing and diversification. The rebalancing and diversification allowance is presented at the portfolio level in Table 48.
It is important to recognize that rates of return for most assets are volatile. The real rates of return presented in the following table represent expected trends and assumed levels of returns to be obtained over a long horizon. As such, limited emphasis should be put on individual projection years.
| Plan year | Fixed income securities | Cash | Public equity | Private equity | Real assets | Credit |
|---|---|---|---|---|---|---|
| 2023 | (1.2) | (3.2) | 4.3 | 5.0 | 3.9 | 3.7 |
| 2024 | 2.4 | 1.2 | 4.3 | 5.0 | 3.9 | 3.7 |
| 2025 | 3.3 | 0.8 | 4.3 | 5.0 | 3.9 | 3.7 |
| 2026 | 3.4 | 0.4 | 4.3 | 5.0 | 3.9 | 3.7 |
| 2027 | 3.2 | 0.3 | 4.3 | 5.0 | 3.9 | 3.7 |
| 2028 | 3.2 | 0.3 | 4.3 | 5.0 | 3.9 | 3.7 |
| 2029 | 3.1 | 0.3 | 4.3 | 5.0 | 3.9 | 3.7 |
| 2030 | 3.0 | 0.4 | 4.3 | 5.0 | 3.9 | 3.7 |
| 2031 | 2.9 | 0.4 | 4.3 | 5.0 | 3.9 | 3.7 |
| 2032 | 2.8 | 0.4 | 4.3 | 5.0 | 3.9 | 3.7 |
| 2033 | 2.7 | 0.5 | 4.3 | 5.0 | 3.9 | 3.7 |
| 2034 and after | 2.1 | 0.5 | 4.3 | 5.0 | 3.9 | 3.7 |
|
Table 47 footnotes
|
||||||
F.3.3.3 Investment expenses
Over the last three plan years, PSP's operating and asset management expenses averaged 0.7% of average net assets. It is assumed that going forward, PSP'S investment expenses will average 0.7% of average net assets. The majority of those investment expenses were incurred through active management decisions.
The objective of active management is to generate returns in excess of those from the Policy Portfolio, after reduction for additional expenses. Thus, the additional returns from a successful active management program should equal at least the cost incurred to pursue active management. For the purpose of this valuation and in accordance with the Canadian Institute of Actuaries' guidance, it is assumed that additional returns generated by active management will equal additional expenses incurred from active management. These expenses are assumed to be 0.5%, which is the difference between total investment expenses of 0.7% and the assumed expenses of 0.2%Footnote 16 that would be incurred for the passive management of the portfolio.
The next section shows the overall rate of return on the fund net of investment expenses.
F.3.3.4 Overall rate of return on assets of the CFPF and the RFPF
The best-estimate rate of return on total assets is derived from the weighted average assumed rate of return on all types of assets using the assumed asset mix proportions as weights. The best-estimate rate of return is further increased to reflect additional returns due to active management and allowance for rebalancing and diversification, and reduced to reflect all investment expenses.
| blank | Nominal | Real |
|---|---|---|
| Weighted average rate of return | 5.7% | 3.7% |
| Additional returns due to active management | 0.5% | 0.5% |
| Allowance for rebalancing and diversificationTable 48 footnote a | 0.5% | 0.5% |
| Expected investment expenses | ||
| Expenses due to passive management | (0.2%) | (0.2%) |
| Additional expenses due to active management | (0.5%) | (0.5%) |
| Total expected investment expenses | (0.7%) | (0.7%) |
| Ultimate net rate of return | 6.0% | 4.0% |
|
Table 48 footnotes
|
||
The resulting nominal and real rates of return for each projection year are as follows:
| Plan year | Nominal | Real |
|---|---|---|
| 2023 | 5.3 | -1.3 |
| 2024 | 6.1 | 2.8 |
| 2025 | 6.2 | 3.9 |
| 2026 | 6.2 | 4.1 |
| 2027 | 6.2 | 4.1 |
| 2028 | 6.2 | 4.2 |
| 2029 | 6.2 | 4.2 |
| 2030 | 6.1 | 4.1 |
| 2031 | 6.1 | 4.1 |
| 2032 | 6.1 | 4.1 |
| 2033 | 6.1 | 4.1 |
| 2034 and after | 6.0 | 4.0 |
| Average from 2023 to 2027 | 6.0 | 2.7 |
| Average from 2023 to 2032 | 6.1 | 3.4 |
| Average from 2023 to 2042 | 6.0 | 3.7 |
|
Table 49 footnotes
|
||
It is assumed that the ultimate real rate of return on investments will be 4.0% in 2034, net of all investment expenses, which is the same as the previous valuation. Due to the more normal level of interest rates compared to the previous valuation, the real rates of returns over the first ten years of the projection are closer to the ultimate rate. The real rate of return on assets takes into account the assumed asset mix as well as the assumed real rate of return for all categories of assets. The nominal returns projected for the Pension Fund are simply the sum of the assumed level of inflation and the real return.
Using the variable nominal rates of return on assets shown in previous table is equivalent to using a flat nominal discount rate of 6.0% for purpose of calculating the liability as at 31 March 2022 for service since 1 April 2000.
F.3.4 Transfer value real interest rate
Interest rates for transfer values are determined in accordance with the Standards of Practice published by the Canadian Institute of Actuaries (CIA). The CIA issued amendments to the standards for determining the interest rates used for the computation of commuted value which are effective 1 February 2022.
Details can be found in the Section 3540 of the CIA Standards of Practice.
Table 50 shows the assumed transfer value real interest rates used in this report:
| Plan year | rL | iL | i7 | r7 | Real interest rates | |
|---|---|---|---|---|---|---|
| First 10 years | After 10 years | |||||
| 2023 | 1.18 | 3.04 | 2.99 | 1.13 | 2.10 | 2.50 |
| 2024 | 1.21 | 3.09 | 2.98 | 1.11 | 2.00 | 2.50 |
| 2025 | 1.29 | 3.18 | 3.03 | 1.14 | 2.00 | 2.60 |
| 2026 | 1.38 | 3.28 | 3.08 | 1.18 | 2.10 | 2.70 |
| 2027 | 1.46 | 3.38 | 3.12 | 1.21 | 2.10 | 2.80 |
| 2028 | 1.54 | 3.48 | 3.17 | 1.25 | 2.10 | 2.80 |
| 2029 | 1.63 | 3.57 | 3.22 | 1.28 | 2.00 | 2.90 |
| 2030 | 1.71 | 3.67 | 3.27 | 1.31 | 2.10 | 3.00 |
| 2031 | 1.79 | 3.77 | 3.31 | 1.35 | 2.10 | 3.10 |
| 2032 | 1.88 | 3.86 | 3.36 | 1.38 | 2.10 | 3.20 |
| 2033 | 1.96 | 3.96 | 3.41 | 1.42 | 2.20 | 3.30 |
| 2034 and after | 2.04 | 4.06 | 3.45 | 1.45 | 2.20 | 3.40 |
F.3.5 Administrative expenses
The operating expenses of PSP continue to be recognized implicitly in this report.
All pension plan administrative expenses are charged to the Superannuation Account, the CFPF and the RFPF.
For the Regular Force Plan, the annual administrative expenses assumption was increased from 0.55% to 0.60% of total pensionable payroll and was decreased from 1.75% to 1.40% of total pensionable payroll for the Reserve Force Plan. The revisions for the Regular Force Plan are based on the observed experience over the intervaluation period. For plan year 2023, the Superannuation Account is assumed to be charged with 40.0% of total administrative expenses of the Regular Force Plan, reducing by 2.5% each year thereafter. The future expenses expected to be charged to the Superannuation Account have been capitalized and are shown as a liability, whereas the expenses to the CFPF and RFPF have been recognized as a part of the annual current service cost.
F.3.6 Summary of economic assumptions
The economic assumptions used in this report are summarized in the following table.
| Plan year | Inflation | Employment earning increases | Interest | |||||
|---|---|---|---|---|---|---|---|---|
| CPI increaseTable 51 footnote b | Pension indexingTable 51 footnote c | YMPETable 51 footnote c | Pensionable earningsTable 51 footnote d | Maximum pensionable earningsTable 51 footnote c | New money rateTable 51 footnote c | Projected yield on account | Projected return on funds | |
| 2023 | 6.6 | 6.3 | 2.6 | 4.8 | 2.6 | 3.1 | 3.2 | 5.3 |
| 2024 | 3.3 | 5.1 | 3.7 | 3.0 | 3.7 | 3.1 | 3.1 | 6.1 |
| 2025 | 2.3 | 2.2 | 3.4 | 2.3 | 3.4 | 3.2 | 3.0 | 6.2 |
| 2026 | 2.1 | 2.2 | 2.9 | 2.7 | 2.9 | 3.3 | 2.9 | 6.2 |
| 2027 | 2.1 | 2.1 | 2.9 | 2.7 | 2.9 | 3.4 | 2.9 | 6.2 |
| 2028 | 2.0 | 2.1 | 2.9 | 2.6 | 2.9 | 3.5 | 2.8 | 6.2 |
| 2029 | 2.0 | 2.0 | 2.9 | 2.6 | 2.9 | 3.6 | 2.7 | 6.2 |
| 2030 | 2.0 | 2.0 | 2.9 | 2.6 | 2.9 | 3.6 | 2.7 | 6.1 |
| 2031 | 2.0 | 2.0 | 2.9 | 2.6 | 2.9 | 3.7 | 2.6 | 6.1 |
| 2032 | 2.0 | 2.0 | 2.9 | 2.6 | 2.9 | 3.8 | 2.5 | 6.1 |
| 2033 | 2.0 | 2.0 | 2.9 | 2.6 | 2.9 | 3.9 | 2.6 | 6.1 |
| 2036 | 2.0 | 2.0 | 2.9 | 2.6 | 2.9 | 4.0 | 2.6 | 6.0 |
| 2041 | 2.0 | 2.0 | 2.9 | 2.6 | 2.9 | 4.0 | 3.3 | 6.0 |
| 2046 | 2.0 | 2.0 | 2.9 | 2.6 | 2.9 | 4.0 | 3.9 | 6.0 |
| 2049+ | 2.0 | 2.0 | 2.9 | 2.6 | 2.9 | 4.0 | 4.0 | 6.0 |
|
Table 51 footnotes
|
||||||||
Appendix G ― CFSA Demographic assumptions
G.1 Demographic assumptions
As per the Funding Policy, all of the demographic assumptions used in this report are best-estimate assumptions, i.e., they reflect our best judgement of the future long-term experience of the plan and do not include margins.
Given the size of the Regular Force Plan population subject to the CFSA, the plan's own experience, except where otherwise noted, was deemed to be the best model to determine the demographic assumptions. Demographic assumptions were updated to reflect past experience to the extent it was deemed credible.
The Reserve Force Plan is a less mature plan, with little experience, providing limited predictable information for establishing appropriate demographic assumptions. Except where otherwise noted, the experience of the Regular Force members covered under Part I of the CFSA was deemed to be the best source of data to determine the demographic assumptions.
The demographic assumptions in the previous report were based on the members' completed years of service, age at most recent birthday, or both. In this valuation, members age and service are determined by rounding the exact value to the nearest integer. Previous assumptions were converted to reflect this change of methodology. All references to assumptions from the previous valuation in this section refer to assumptions converted to Age Nearest basis.
Unless stated otherwise, Qualifying Service in the Canadian Forces is used for demographic assumptions based on service for members of the Regular Force Plan and Pensionable Service is used for members of the Reserve Force Plan.
G.1.1 Seniority and promotional salary increases
Seniority means length of service within a classification and promotion means moving to a higher rank.
The assumption for seniority and promotional salary increase for both the Regular Force Plan and Reserve Force Plan are determined by studying the experience for the Regular Force members.
The seniority and promotion salary increase rates were slightly increased to reflect the intervaluation experience. The following table provides sample rates of seniority and promotional increases for both pension plans.
| Years of qualifying serviceTable 52 footnote a | Officer | Other rank |
|---|---|---|
| 0 | 7.9 | 20.0 |
| 1 | 7.4 | 19.1 |
| 2 | 12.8 | 10.4 |
| 3 | 14.1 | 8.8 |
| 4 | 22.1 | 5.4 |
| 5 | 10.6 | 2.2 |
| 6 | 7.1 | 1.9 |
| 7 | 7.4 | 1.7 |
| 8 | 5.1 | 1.2 |
| 9 | 4.3 | 0.8 |
| 10 | 4.0 | 0.8 |
| 15 | 2.7 | 1.2 |
| 20 | 2.4 | 1.4 |
| 25 | 2.2 | 1.3 |
| 30 | 1.7 | 1.0 |
| 35 and above | 1.1 | 0.5 |
|
Table 52 footnotes
|
||
G.1.2 New contributors
As the active population of the plan is expected to grow, new contributors are projected to replace members that cease to be active as well as increase the number of contributors over time.
The proportion of female members joining the Plans, is assumed to remain constant, consistent with recent experience:
| Pension plan | Officer | Other rank |
|---|---|---|
| Regular Force - as new members of the Canadian Forces | 26% | 16% |
| Regular Force - from rollover | 29% | 22% |
| Reserve Force | 31% | 17% |
These proportions are in line with both the current representation of female members and the recent distribution of new contributors. It is assumed that the distribution of new members by age, sex, rank, service, salary level and working schedule will be on average the same as those of members with less than one year of service at each of the three years preceding the valuation date. It is assumed that 13% of new members of the Regular Force Plan are rollovers from the Reserve Force Plan.
The assumed percentage increase in the number of contributors for each plan year is shown in Table 54.
| Plan year | Regular Force | Reserve Force |
|---|---|---|
| 2023 | (1.3) | (4.8) |
| 2024 to 2028 | 2.6 | 2.0 |
| 2029 and after | 0.6 | 0.4 |
G.1.3 Pensionable retirement
Pensionable retirement means ceasing to be an active member and immediately starting to receive an annuity (immediate annuity or an annual allowance) for reasons other than disability 3A and 3B.
The assumed rates of pensionable retirement were revised to reflect the intervaluation experience.
Regular Force Plan
In general, the rates before 35 years of service remained similar to the previous valuation, the rates at 35 years of service were increased and the rates after 35 years of service were decreased from the previous valuation.
The following tables provide sample rates of pensionable retirement for member of the Regular Force Plan.
Retirement rates for 20 to 24 years of service only apply under the old terms of service.
| Years of qualifying service | Male officer | Female officer | Male other rank | Female other rank |
|---|---|---|---|---|
| 20 | 50 | 50 | 80 | 40 |
| 21 | 50 | 75 | 50 | 40 |
| 22 | 50 | 75 | 45 | 40 |
| 23 | 50 | 75 | 43 | 45 |
| 24 | 50 | 75 | 50 | 50 |
| 25 | 100 | 100 | 75 | 55 |
| 26 | 90 | 100 | 75 | 60 |
| 27 | 85 | 100 | 75 | 65 |
| 28 | 85 | 100 | 75 | 70 |
| 29 | 85 | 100 | 75 | 75 |
| 30 | 100 | 150 | 90 | 80 |
| 34 | 250 | 150 | 150 | 150 |
| 35 | 500 | 300 | 400 | 200 |
| 36 | 250 | 200 | 200 | 150 |
| 38 and above | 150 | 150 | 150 | 150 |
Reserve Force Plan
After a review of the Reserve Force Plan intervaluation experience, the retirement rates were simplified to service-based for two age groups: below age 58 and age 58 and above. Table 56 provides sample rates of retirement for the Reserve Force Plan members of age below 58.
| Years of pensionable service | All genders and rank |
|---|---|
| 5 | 8 |
| 10 | 20 |
| 15 | 30 |
| 25 | 30 |
| 30 | 30 |
| 33 | 50 |
| 34 | 100 |
| 35 and above | 90 |
All members are deemed to retire upon reaching age 60 and rates for ages 58 and 59 are on average 40% higher than those presented in the table above.
G.1.4 Disability
Disability means ceasing to be an active member of the Regular Force Plan or the Reserve Force Plan for reasons of occupation disability (own occupation).
Regular Force Plan
Historically, two types of occupation disability were valued for the Regular Force Plan:
-
Any occupation disability (3A);
-
Own occupation disability (3B).
The disability assumption is based on the intervaluation experience from both disabilities 3A and 3B.
For the purpose of the valuation, it is assumed that no disability 3A will occur and that all disability benefits fall under 3B. This has no material impact on the valuation because there are very few 3A disability retirement each year.
In the previous valuation, the disability assumption was based on service. The assumption is now based on age as it better reflects actual experience. Given the increase in credible experience, disability rates for female members have been modified to differ by rank. The current intervaluation experience has been consistent with the disability incidence rates observed between plan years 2017 to 2019.
The following table provides a sample of 3B disability incidence rates for the Regular Force Plan.
| Age | Male officer | Female officer | Male other rank | Female other rank |
|---|---|---|---|---|
| 15 | 0.0 | 0.0 | 0.0 | 0.0 |
| 20 | 3.5 | 8.0 | 3.0 | 7.0 |
| 25 | 3.5 | 8.0 | 6.0 | 10.0 |
| 30 | 3.5 | 8.0 | 17.0 | 22.5 |
| 35 | 6.0 | 8.0 | 29.5 | 35.0 |
| 40 | 11.0 | 31.0 | 42.0 | 52.0 |
| 45 | 16.5 | 33.5 | 54.5 | 72.0 |
| 50 | 24.0 | 36.0 | 61.0 | 92.0 |
| 55 | 59.0 | 95.0 | 115.0 | 142.0 |
| 60 | 300.0 | 450.0 | 500.0 | 500.0 |
Reserve Force Plan
After a review of the Reserve Force Plan intervaluation experience, the disability rates were removed. This will have no material impact on the valuation because there are very few disability retirements each year for members of the Reserve Force Plan.
G.1.5 Withdrawal
Withdrawal means ceasing to be an active member of the Regular Force Plan or the Reserve Force Plan for reasons other than death, disability or immediate retirement (immediate annuity or an annual allowance).
Regular Force Plan
The assumed withdrawal rates were revised to reflect the intervaluation experience.
The experience showed that officers had similar behaviors whether they were male or female. Officers' rates have therefore been modified to be unisex. In general, withdrawal rates for Regular Force members are slightly higher than those of the previous valuation.
The following table provides sample rates of withdrawal.
| Years of qualifying service | Officer | Male other rank | Female other rank |
|---|---|---|---|
| 0 | 60 | 100 | 90 |
| 1 | 40 | 50 | 40 |
| 5 | 17.5 | 38 | 22 |
| 10 | 17.5 | 27.5 | 22 |
| 12 | 17.5 | 22.5 | 14 |
| 13 to 19 | 17.5 | 20 | 14 |
| 20 to 24Table 58 footnote a | 18 | 20 | 14 |
| 25 and above | 0 | 0 | 0 |
|
Table 58 footnotes
|
|||
Reserve Force Plan
In the previous valuations, the withdrawal assumptions for members of the Reserve Force Plan included decrements due to roll-over to the Regular Force Plan and decrements due to actual terminations. This method has been modified in this valuation so that decrements due to rollover to the Regular Force Plan are distinct rates. These rates are shown Appendix G.1.7.
Compared to last valuation, withdrawal rates were simplified and are based on years of pensionable service for two age groups: below age 50 and age 50 and above. The following table provides sample withdrawal rates for Reserve Force Plan.
| Years of pensionable service | Male officer | Female officer | Male other rank | Female other rank |
|---|---|---|---|---|
| 0 | 36 | 22 | 33 | 32 |
| 1 | 38 | 38 | 47 | 38 |
| 2 | 38 | 38 | 47 | 44 |
| 5 | 45 | 50 | 72 | 61 |
| 10 | 36 | 45 | 63 | 61 |
| 15 | 32 | 39 | 55 | 61 |
| 20 | 22 | 28 | 36 | 48 |
| 25 | 22 | 20 | 16 | 34 |
For members above age 50 rates are the following:
-
Rates from Table 59 for members with 0 and 1 year of pensionable service;
-
2% for members with 2 and 3 years of pensionable service;
-
3.3% for members with 4 to 25 years of pensionable service; and
-
1.0% for members with 26 years or more of pensionable service.
There is no withdrawal rate for members above age 55 with at least 30 years of pensionable service (see A.4.2.2 eligibility for Immediate annuity (Appendix A.5.12)).
G.1.6 Proportion of members opting for a deferred annuity
Following a termination of employment, vested members (at least 2 years of pensionable service) not immediately retiring (immediate annuity or an annual allowance) are entitled to defer their annuity (Appendix A.5.13). Members below age 50 can also opt to transfer the commuted value of their deferred pension out of the Plans (Appendix A.5.14).
An assumption must be made as to the proportion of members opting for a deferred annuity or a commuted value. This assumption was revised to reflect the intervaluation experience.
It is assumed that the proportion of members of the Regular Force Plan electing a deferred annuity upon termination or disability are respectively 30% and 35% when they are not eligible to an immediate annuity (with less than 10 years of pensionable service). The proportion of Reserve Force members electing a deferred annuity is assumed to be 50%.
G.1.7 Rollover from the Reserve Plan to the Regular PlanFootnote 17
As mentioned previously, for this valuation, decrements due to rollover to the Regular Force Plan are distinct to those for regular termination.
Since one of the key factors for rolling-over to the Regular Force Plan is the working schedule of the Reserve Plan members, rates were developed based on whether the members were working part-time or full timeFootnote 18.
The following table provides sample rollover rates from the Reserve Force Plan to the Regular Force Plan.
| Years of pensionable service | Full-time | Part-time officer | Part-time other rank |
|---|---|---|---|
| 0 | 50 | 15 | 30 |
| 2 | 100 | 15 | 30 |
| 4 | 150 | 15 | 30 |
| 8 | 190 | 15 | 30 |
| 9 to 14 | 200 | 15 | 30 |
| 15 and above | 200 | 10 | 20 |
G.1.8 Mortality
Mortality rate assumptions for contributors, retired pensioners, disabled pensioners, surviving spouses and longevity improvement factors are the same for both the Regular Force Plan and the Reserve Force Plan. For 3B (own occupation) disability pensioners, the mortality rates assumption is the same as that for contributors and retirement pensioners.
The mortality rate assumptions were revised based on the experience from the 6 years preceding the valuation and to account for expected longevity improvements. Due to the small size of the population, the assumption for male surviving spouses is the same as the one used in the Actuarial Report on the Pension Plan for the Public Service of Canada as at 31 March 2020.
For contributors and retirement pensioners, experience showed that actual deaths of male officers were higher than expected before age 60, lower between age 75 and 90 and higher after age 90. For male other ranks, actual deaths were lower than expected before age 60 and higher than expected between age 60 and 80. For female members actual deaths were higher for all ages.
It is to be noted that the intervaluation mortality experience did not suggest higher than expected deaths due to the COVID-19 pandemic.
The following tables provides sample mortality rates.
| Age | Male officer | Male other rank | Female |
|---|---|---|---|
| 40 | 0.5 | 0.8 | 0.4 |
| 50 | 0.7 | 2.1 | 1.1 |
| 60 | 2.0 | 5.3 | 3.2 |
| 70 | 7.6 | 17.6 | 9.4 |
| 80 | 35.0 | 46.8 | 30.4 |
| 90 | 132.1 | 150.9 | 97.3 |
| 100 | 320.8 | 340.7 | 263.4 |
| 115 | 1000.0 | 1000.0 | 1000.0 |
| Age | Male officer | Male other rank | Female |
|---|---|---|---|
| 40 | 0.9 | 8.6 | 3.6 |
| 50 | 2.4 | 11.5 | 5.8 |
| 60 | 5.9 | 17.3 | 11.0 |
| 70 | 14.6 | 35.9 | 22.7 |
| 80 | 43.7 | 76.2 | 50.3 |
| 90 | 124.5 | 160.5 | 115.4 |
| 100 | 308.0 | 312.4 | 268.9 |
| 115 | 1000.0 | 1000.0 | 1000.0 |
| Age | Male | Female |
|---|---|---|
| Before 60 | 0.0 | 0.0 |
| 60 | 8.2 | 6.1 |
| 70 | 16.9 | 14.7 |
| 80 | 54.1 | 39.2 |
| 90 | 146.0 | 111.4 |
| 100 | 360.6 | 295.7 |
| 115 | 1000.0 | 1000.0 |
Longevity improvement factors
Mortality rates are reduced in the future in accordance with the same longevity improvement assumptionFootnote 19 used in the 31st Actuarial Report on the Canada Pension Plan. Mortality improvements are expected to continue in the future but at a slower pace, reaching the ultimate improvement rate of 0.8% for ages below 89 in plan year 2040. Further, it is assumed that, ultimately, mortality improvement rates for males will decrease to the same level as females.
Factors shown in the 31st Actuarial Report on the Canada Pension Plan are based on calendar years. These factors have been interpolated to obtain plan year longevity improvement factors (as at 31 March).
A sample of assumed longevity improvement factors is shown in following table.
| Age | Male at plan year 2024 | Male at plan year 2040 | Female at plan year 2024 | Female at plan year 2040 |
|---|---|---|---|---|
| 40 | 0.59 | 0.80 | 0.79 | 0.80 |
| 50 | 1.38 | 0.80 | 1.30 | 0.80 |
| 60 | 1.79 | 0.80 | 1.58 | 0.80 |
| 70 | 1.71 | 0.80 | 1.30 | 0.80 |
| 80 | 1.59 | 0.80 | 1.06 | 0.80 |
| 90 | 1.53 | 0.62 | 1.38 | 0.62 |
| 100 | 0.69 | 0.28 | 0.77 | 0.28 |
| 110 | 0.00 | 0.00 | 0.00 | 0.00 |
The following table shows the calculated cohort life expectancy for contributors and retirement pensioners based on the mortality assumptions described in this section. Cohort life expectancies take into account assumed longevity improvement factors and differ from calendar year life expectancies, which are based on the mortality rates of the given attained year.
| Age | As at 31 March 2022 | As at 31 March 2042 | ||||
|---|---|---|---|---|---|---|
| Male officer | Male other rank | Female | Male officer | Male other rank | Female | |
| 60 | 28.5 | 25.4 | 29.2 | 29.6 | 26.7 | 30.3 |
| 65 | 23.5 | 20.8 | 24.4 | 24.6 | 22.0 | 25.5 |
| 70 | 18.8 | 16.6 | 19.8 | 19.8 | 17.8 | 20.9 |
| 75 | 14.3 | 12.8 | 15.6 | 15.3 | 13.9 | 16.6 |
| 80 | 10.4 | 9.5 | 11.8 | 11.3 | 10.4 | 12.7 |
| 85 | 7.2 | 6.6 | 8.6 | 7.9 | 7.4 | 9.3 |
| 90 | 4.8 | 4.5 | 5.9 | 5.4 | 5.0 | 6.5 |
G.1.9 Family compositionFootnote 20
Upon the death of the member, spouse and children might be eligible for an annual allowance for eligible survivors (Appendix A.5.20).
The assumptions regarding survivors are the same for both Regular and Reserve Force members and were revised based on the intervaluation experience.
The probability of leaving, upon death, a spouse eligible for a survivor allowance for male members was decreased on average by 3% before age 45 and increased by 1% thereafter. For female members, it was increased on average by 45% before age 60 and was decreased progressively thereafter.
| Age | Male | Female |
|---|---|---|
| 30 | 0.47 | 0.70 |
| 40 | 0.68 | 0.85 |
| 50 | 0.72 | 0.85 |
| 60 | 0.74 | 0.55 |
| 70 | 0.72 | 0.40 |
| 80 | 0.61 | 0.29 |
| 90 | 0.41 | 0.06 |
| 100 | 0.14 | 0.00 |
The assumed eligible spouse age difference at the death of the member is shown in the following table.
A widow is assumed to always be younger. A widower is assumed to be older when death occurs at a younger age and is assumed to be younger when death occurs at later ages. Other than the ultimate age difference set at age 93, few changes were made to this assumption.
| Age | Widow | Widower |
|---|---|---|
| Before 20 | 0 | 0 |
| 21 to 22 | 0 | 1 |
| 23 to 34 | (1) | 1 |
| 35 to 64 | (2) | 1 |
| 65 to 70 | (3) | 1 |
| 71 to 80 | (3) | 0 |
| 81 to 82 | (3) | (2) |
| 83 to 92 | (4) | (2) |
| 93 and above | (5) | (2) |
The sex of each eligible surviving spouse is assumed to be the opposite of the deceased member's. Furthermore, it is assumed that deceased members will have no eligible child survivors.
For actual eligible children at valuation date, the following table shows the rates of children ceasing to be eligible to a survivor allowance (Appendix A.5.19).
| Child age | All children |
|---|---|
| Before 18 | 0 |
| 18 to 20 | 150 |
| 21 | 200 |
| 22 | 250 |
| 23 | 333 |
| 24 | 500 |
| 25 | 1000 |
G.2 Other assumptions
G.2.1 Pension benefits division/Optional survivor benefit/Leave without pay
The division of pension benefits has almost no effect on the valuation results because the liability is reduced, on average, by approximately the amount paid to the credit of the former spouse. Consequently, no future pension benefits divisions were assumed in estimating the current service cost and liability. However, past pension benefits divisions were fully reflected in the liability. Two other provisions, namely the optional survivor benefit and the suspension of membership while on leave without pay, were also treated like pension benefits divisions for the same reason.
G.2.2 Minimum post-retirement death benefit
This valuation does not take into account the minimum death benefit described in Appendix A.5.21, with respect to deaths occurring after retirement. The resulting understatement of the accrued liability and current service cost is not material since the majority of the relatively few pensioners who die in the early years of retirement leave an eligible survivor.
G.2.3 Wage measure
Under the Reserve Force Plan, the retirement benefit is based on the career average of the updated earnings. Past earnings are updated using the wage measure as defined in the schedule of the Reserve Force Pension Plan Regulations. The regulations also prescribe the wage measures for calendar year 2007 and later as the greater of:
-
the standard basic rate of pay for a period of duty or training of six hours or more, before any retroactive adjustment, that was prescribed or established under the National Defence Act to be paid on October 1 of the preceding year to a member at the rank of Corporal (class A), and
-
the wage measure of the previous year.
The wage measure for calendar years up to 2022 is shown in the following table.
| Calendar year | Rate of pay ($) |
|---|---|
| 2022 | 162.32 |
| 2021 | 152.98 |
| 2020 | 152.98 |
| 2019 | 140.12 |
| 2018 | 140.12 |
| 2017 | 131.74 |
| 2016 | 131.74 |
| 2015 | 131.74 |
| 2014 | 131.74 |
| 2013 | 129.16 |
| 2012 | 125.08 |
| 2011 | 125.08 |
| 2010 | 123.24 |
| 2000 | 89.52 |
| 1990 | 54.50 |
| 1980 | 25.75 |
| 1970 | 10.10 |
| 1960 | 5.67 |
G.2.4 Financing of elected prior service
The assumed future government credits in respect of prior service elections vary according to the financing vehicle (i.e. the Superannuation Account, the CFPF or the RFPF) into which the contributions are credited. The government matches member contributions made to the Superannuation Account for prior service elections; however, it makes no contributions if the member is paying the double rate. Government credits to the Pension Funds in respect of elected prior service are as described for the current service.
G.2.5 Outstanding terminations
Amounts paid from 1 April 2022 onward for terminations that occurred prior to that date were estimated from actual payments made using historical information provided in the valuation data at 31 March 2022. For this valuation, after reviewing the information, a total of $97 million and $17 million were set aside for the CFPF and the RFPF respectively.
G.2.6 Disability incidence rates for pensioners under age 60
Both deferred pensioners and pensioners receiving an annual allowance while under age 60 were assumed to have a 0% disability rate. The impact of this assumption on liability and current service cost is negligible.
G.2.7 Recovery rates for disability pensioners
No recoveries are assumed for disability pensioners. The resulting overstatement of liability and current service cost is negligible.
Appendix H ― RCA Valuation methodology and assumptions
H.1 Valuation of the amounts available for benefits
The amounts available for benefits comprise the recorded balance in the Retirement Compensation Arrangements Account (RCA), which forms part of the Accounts of Canada, as well as a tax credit (CRA refundable tax).
Interest is credited every three months in accordance with the actual average yield on a book value basis for the same period on the combined Superannuation Accounts of the Public Service, Canadian Forces - Regular Force and Royal Canadian Mounted Police pension plans. The actuarial value of the amounts available for benefits is equal to the book value.
H.2 Valuation of liabilities
This appendix describes the liability valuation methodologies used and any differences in economic assumptions from those used in the CFSA valuation.
H.2.1 Terminally funded RCA benefits
The following RCA benefits are being terminally funded (i.e. funded only when they occur):
-
pre-retirement survivor benefits
-
minimum death benefit
The above benefits are terminally funded because they are uncommon or of little financial significance. The pre-retirement survivor benefit becomes payable only when the average salary is less than 1.4 times the YMPE. As well, the minimum death benefit is expected to occur only with deaths at younger ages where the mortality rates are low.
H.2.2 Post-retirement survivor benefits
The limit on the amount of spousal annual allowance that can be provided under the CFSA decreases at the same time the member's pension reduces due to the CPP coordination, usually at age 65.The projected accrued benefit cost method was used to estimate the liabilities and current service cost for this RCA benefit.
H.2.3 Excess pensionable earnings
The projected accrued benefit cost method (described in detail in Appendix E.2) was used to estimate plan liabilities and current service costs for benefits in excess of the Maximum Pensionable Earnings (MPE).
H.2.4 Administrative expenses
To compute the liabilities and current service cost, no provision was made regarding the expenses incurred for the administration of the RCA Account. These expenses, which are not debited to the RCA Account, are borne entirely by the government and are commingled with all other government expenses.
H.3 Actuarial assumptions
The valuation economic assumptions described in Appendix F were used without any modifications.
H.4 Valuation data
The RCA pension benefits in payment were provided as at 31 March 2022. RCA benefits expected to be paid in respect of contributor and accrued spousal allowances of current retired members were all derived from the membership data described in Appendix D and shown in Appendix K.
Appendix I ― Canadian Forces Pension Plans projection
The results of the following projection were computed using the amounts available for benefits described in Appendix C, the data described in Appendices D and K, the methodology described in Appendix A and the assumptions described in Appendices F and G.
I.1 Projection of the Superannuation Account and the Canadian Forces Pension Fund liabilities
Prior to 1 April 2000, the CFSA Superannuation Account tracked all government pension benefit obligations related to the CFSA. The Superannuation Account is now debited only with benefit payments made in respect of service earned before that date and administrative expenses; it is credited with prior service related to elections made prior to 1 April 2000 and interest earnings.
Starting 1 April 2000, the CFSA is financed through the Canadian Forces Pension Fund (CFPF). Government and member contributions, investment earnings and prior service contributions for elections since 1 April 2000 are added to the CFPF. The Pension Fund is debited with benefit payments made in respect of service earned since that date and administrative expenses.
The following graph presents the evolution over time of the Superannuation Account liabilities for service prior to 1 April 2000 and the Pension Fund liabilities for service after 31 March 2000. The red bar shows that it is expected that the CFPF liabilities will exceed the Superannuation Account liabilities in 2026.
Chart 1 Evolution of liabilities of Superannuation Account and CFPF over time (in billions)
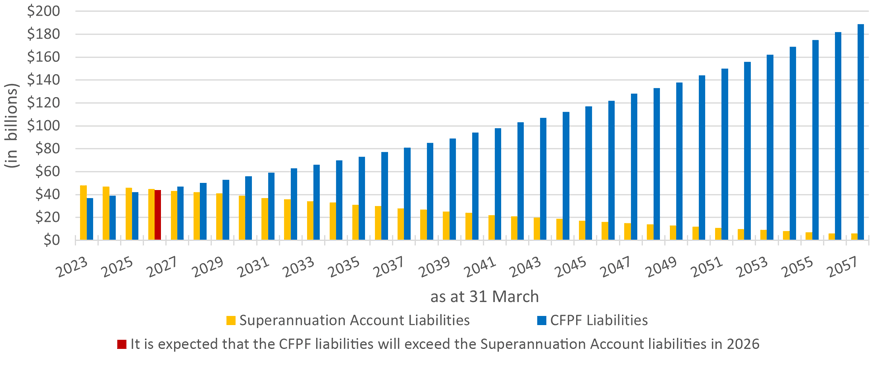
Account and CFPF liabilities - Text version
Bar graph showing the evolution of liabilities related to the Superannuation Account and to the Pension Fund over time. Y-axis represents the expected liabilities in billions, and X-axis represents the years, starting on March 31 2022 and ending on 31 March 2056.
On 31 March 2022, the Superannuation Account liabilities were approximately $48 billion and the Pension Fund liabilities were approximately $37 billion. The Superannuation Account liabilities are expected to steadily decrease and the Pension Fund liabilities are expected to steadily increase over time. As a result, it is estimated that as at 31 March 2026, the Pension Fund liabilities of $47 billion will exceed the Superannuation Account liabilities of $43 billion.
From 2026 to 2056, the Superannuation Account liabilities will continue to steadily decrease by an average of $1.2 billion per year resulting in liabilities of $6 billion in 2056. The Pension Fund liabilities will continue to steadily increase, by an average of $4.7 billion each year resulting in liabilities of $189 billion in 2056.
| Plan year | Superannuation Account liabilities | CFPF liabilities |
|---|---|---|
| 2023 | 48 | 37 |
| 2024 | 47 | 39 |
| 2025 | 46 | 42 |
| 2026Chart 1 - Table footnote * | 45 | 44 |
| 2027 | 43 | 47 |
| 2028 | 42 | 50 |
| 2029 | 41 | 53 |
| 2030 | 39 | 56 |
| 2031 | 37 | 59 |
| 2032 | 36 | 63 |
| 2033 | 34 | 66 |
| 2034 | 33 | 70 |
| 2035 | 31 | 73 |
| 2036 | 30 | 77 |
| 2037 | 28 | 81 |
| 2038 | 27 | 85 |
| 2039 | 25 | 89 |
| 2040 | 24 | 94 |
| 2041 | 22 | 98 |
| 2042 | 21 | 103 |
| 2043 | 20 | 107 |
| 2044 | 19 | 112 |
| 2045 | 17 | 117 |
| 2046 | 16 | 122 |
| 2047 | 15 | 128 |
| 2048 | 14 | 133 |
| 2049 | 13 | 138 |
| 2050 | 12 | 144 |
| 2051 | 11 | 150 |
| 2052 | 10 | 156 |
| 2053 | 9 | 162 |
| 2054 | 8 | 169 |
| 2055 | 7 | 175 |
| 2056 | 6 | 182 |
| 2057 | 6 | 189 |
|
Chart 1 - Table footnotes
|
||
I.2 Evolution of cash flows under the Canadian Forces Pension Fund
In plan year 2023, contributions to the Pension Fund are expected to reach $1,464 million, whereas payouts, including benefit payments and administrative expenses, are expected to reach $1,333 million. Contributions that are higher than payouts ensure that the Pension Fund has sufficient liquidity to cover all the payouts in a year. However, as the population of the Pension Fund matures, the amount of payouts will increase and will eventually exceed the contributions. This will result in negative cash flows to the Pension Fund.
It is expected that the Pension Fund will have negative cash flows from plan year 2026, at which point a portion of the assets will be required to pay benefits. This implies that from plan year 2026, some portion of the Pension Fund's assets must be invested in liquid investments in order to be readily available to cover the excess payouts. Nevertheless, although negative cash flows is projected to begin in the plan year 2026, the Pension Fund's overall assets are expected to grow for the entire duration of the projection presented below when investment income is taken into consideration.
Chart 2 Evolution of cash flows of the CFPF over time (in millions)
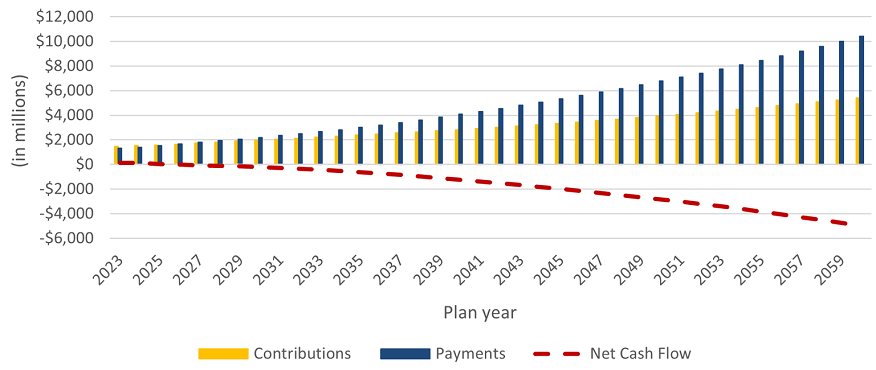
CFPF cash flows - Text version
Bar graph showing the evolution of cash flows under the Pension Fund over time. Y-axis represents the expected contributions, payments, special payments, and resulting net cash flows in millions. X-axis represents the plan years, starting in 2022 and ending in 2060.
In plan year 2023, contributions to the Pension Fund are expected to reach $1,464 million, whereas payments are expected to reach $1,333 million, resulting in net cash flows of $131 million. No special payments are required as at 31 March 2022. Both contributions and payments are expected to increase over time. However, payments are expected to increase at a higher rate than the contributions. It is expected that the contributions will be higher than the payments until plan year 2025. In plan year 2026, the expected payments of $1,670 million will exceed the estimated contributions of $1,643 million resulting in net cash flows of negative $27 million. Starting plan year 2026, the Pension Fund is expected to have negative net cash flows. In plan year 2060, contributions to the Pension Fund are expected to reach approximately $5,407 million, whereas payouts are expected to reach approximately $10,411 million resulting in net cash flows of negative $5,004 million.
| Plan year | Contributions | Payments | Special payments | Net cash flow |
|---|---|---|---|---|
| 2023 | 1,464 | 1,333 | 0 | 131 |
| 2024 | 1,521 | 1,396 | 0 | 125 |
| 2025 | 1,567 | 1,542 | 0 | 25 |
| 2026 | 1,643 | 1,670 | 0 | (27) |
| 2027 | 1,727 | 1,798 | 0 | (71) |
| 2028 | 1,818 | 1,926 | 0 | (108) |
| 2029 | 1,902 | 2,060 | 0 | (158) |
| 2030 | 1,975 | 2,194 | 0 | (219) |
| 2031 | 2,052 | 2,341 | 0 | (289) |
| 2032 | 2,131 | 2,493 | 0 | (362) |
| 2033 | 2,214 | 2,654 | 0 | (440) |
| 2034 | 2,298 | 2,823 | 0 | (525) |
| 2035 | 2,383 | 3,002 | 0 | (619) |
| 2036 | 2,467 | 3,198 | 0 | (731) |
| 2037 | 2,550 | 3,404 | 0 | (854) |
| 2038 | 2,635 | 3,619 | 0 | (984) |
| 2039 | 2,727 | 3,841 | 0 | (1,114) |
| 2040 | 2,822 | 4,075 | 0 | (1,253) |
| 2041 | 2,919 | 4,309 | 0 | (1,390) |
| 2042 | 3,019 | 4,550 | 0 | (1,531) |
| 2043 | 3,119 | 4,797 | 0 | (1,678) |
| 2044 | 3,224 | 5,059 | 0 | (1,835) |
| 2045 | 3,332 | 5,324 | 0 | (1,992) |
| 2046 | 3,445 | 5,600 | 0 | (2,155) |
| 2047 | 3,563 | 5,884 | 0 | (2,321) |
| 2048 | 3,685 | 6,176 | 0 | (2,491) |
| 2049 | 3,810 | 6,468 | 0 | (2,658) |
| 2050 | 3,939 | 6,769 | 0 | (2,830) |
| 2051 | 4,069 | 7,085 | 0 | (3,016) |
| 2052 | 4,200 | 7,413 | 0 | (3,213) |
| 2053 | 4,335 | 7,750 | 0 | (3,415) |
| 2054 | 4,475 | 8,099 | 0 | (3,624) |
| 2055 | 4,618 | 8,460 | 0 | (3,842) |
| 2056 | 4,769 | 8,826 | 0 | (4,057) |
| 2057 | 4,924 | 9,206 | 0 | (4,282) |
| 2058 | 5,082 | 9,592 | 0 | (4,510) |
| 2059 | 5,243 | 10,000 | 0 | (4,757) |
| 2060 | 5,407 | 10,411 | 0 | (5,004) |
I.3 Projection of the Reserve Force Pension Fund liabilities
The Reserve Force Plan was established on 1 April 2007 and is financed through the Reserve Force Pension Fund (RFPF). Government and member contributions, investment earnings and prior service contributions for elections are invested in the RFPF. The Pension Fund is debited with benefit payments made in respect of service earned since the establishment date and administrative expenses.
The following graph presents the evolution over time of the Pension Fund liabilities for service under the Reserve Force Plan.
Chart 3 Evolution of liabilities of the RFPF over time (in billions)
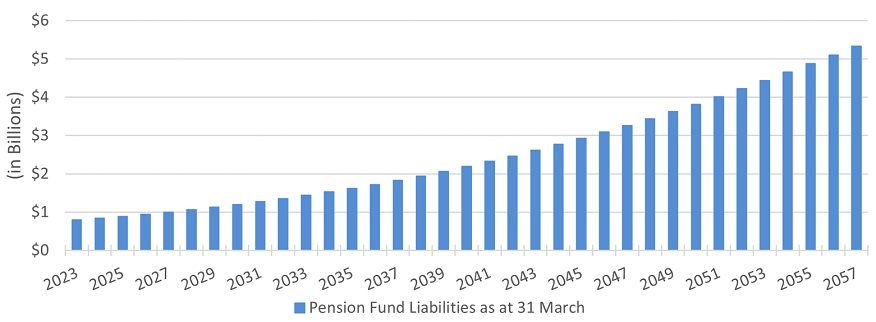
RFPF liabilities - Text version
Bar graph showing the evolution of liabilities related to the Reserve Force Pension Fund over time. Y-axis represents the expected liabilities in billions, and X-axis represents the year, starting on 31 March 2022 and ending on 31 March 2056.
At 31 March 2022, the Pension Fund liabilities were approximately $0.8 billion. The Pension Fund liabilities are expected to steadily increase over time by an average of $0.1 billion each year resulting in liabilities of $5.3 billion in 2056.
| Plan year | Pension fund liabilities as at 31 March |
|---|---|
| 2023 | 0.8 |
| 2024 | 0.8 |
| 2025 | 0.9 |
| 2026 | 0.9 |
| 2027 | 1.0 |
| 2028 | 1.1 |
| 2029 | 1.1 |
| 2030 | 1.2 |
| 2031 | 1.3 |
| 2032 | 1.4 |
| 2033 | 1.4 |
| 2034 | 1.5 |
| 2035 | 1.6 |
| 2036 | 1.7 |
| 2037 | 1.8 |
| 2038 | 1.9 |
| 2039 | 2.1 |
| 2040 | 2.2 |
| 2041 | 2.3 |
| 2042 | 2.5 |
| 2043 | 2.6 |
| 2044 | 2.8 |
| 2045 | 2.9 |
| 2046 | 3.1 |
| 2047 | 3.3 |
| 2048 | 3.4 |
| 2049 | 3.6 |
| 2050 | 3.8 |
| 2051 | 4.0 |
| 2052 | 4.2 |
| 2053 | 4.4 |
| 2054 | 4.7 |
| 2055 | 4.9 |
| 2056 | 5.1 |
| 2057 | 5.3 |
I.4 Evolution of cash flows under the Reserve Force Pension Fund
In plan year 2023, contributions to the Pension Fund are expected to reach $69 million, whereas payouts, including benefit payments and administrative expenses, are expected to reach $67 million. Contributions that are higher than payouts ensure that the Pension Fund has sufficient liquidity to cover all the payouts in a year. However, as the population of the Pension Fund matures, the amount of payouts will increase and will eventually exceed the contributions. This will result in negative cash flows to the Pension Fund.
It is expected that the Pension Fund will have negative cash flows from plan year 2042, at which point a portion of the assets will be required to pay benefits. This implies that from plan year 2042, some portion of the Pension Fund's assets must be invested in liquid investments in order to be readily available to cover the excess payouts. As experienced in recent years, the high volatility of the number of members rolling over and the magnitude of assets being transferred from the RFPF to the CFPF can create negative cash flows in any given year. Nevertheless, although negative cash flows can occur in any year, the Pension Fund's overall assets are expected to grow for the entire duration of the projection presented below when investment income is taken into consideration.
Chart 4 Evolution of cash flows of the RFPF over time (in millions)
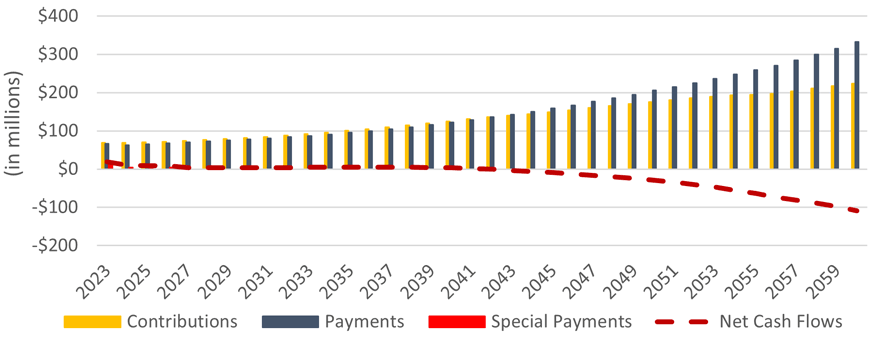
RFPF cash flows - Text version
Bar graph showing the evolution of cash flows under the Pension Fund over time. Y-axis represents the expected contributions, payments, special payments, and resulting net cash flows in millions. X-axis represents the plan year, starting in 2023 and ending in 2060.
In plan year 2023, contributions to the Pension Fund are expected to reach $69 million, whereas payments and special payments are expected to reach $67 million and $17 million, respectively, resulting in net cash flows of $20 million. Both contributions and payments are expected to increase over time. However, payments are expected to increase at a higher rate than the contributions. Special payments are expected to be made until 2026. It is expected that the contributions will be higher than the payments until plan year 2041. In 2042, the expected payments of $136.1 million will exceed the estimated contributions of $135.7 million resulting in net cash flows of negative $0.4 million. From 2042, the Pension Fund is expected to have negative net cash flows. In plan year 2060, contributions to the Pension Fund are expected to reach approximately $224 million, whereas payouts are expected to reach approximately $333 million resulting in net cash flows of negative $109 million.
| Plan year | Contributions | Payments | Special payments | Net cash flows |
|---|---|---|---|---|
| 2023 | 69.0 | 66.8 | 17.4 | 19.6 |
| 2024 | 68.9 | 62.5 | 4.1 | 10.5 |
| 2025 | 70.0 | 65.4 | 4.1 | 8.7 |
| 2026 | 71.9 | 67.4 | 4.1 | 8.6 |
| 2027 | 74.1 | 70.2 | 0.0 | 3.9 |
| 2028 | 76.4 | 72.9 | 0.0 | 3.5 |
| 2029 | 78.9 | 75.5 | 0.0 | 3.4 |
| 2030 | 81.2 | 77.7 | 0.0 | 3.5 |
| 2031 | 84.1 | 80.6 | 0.0 | 3.5 |
| 2032 | 87.6 | 83.9 | 0.0 | 3.7 |
| 2033 | 91.5 | 87.1 | 0.0 | 4.4 |
| 2034 | 95.9 | 91.0 | 0.0 | 4.9 |
| 2035 | 100.3 | 95.5 | 0.0 | 4.8 |
| 2036 | 104.9 | 99.9 | 0.0 | 5.0 |
| 2037 | 109.7 | 104.8 | 0.0 | 4.9 |
| 2038 | 114.8 | 110.1 | 0.0 | 4.7 |
| 2039 | 120.1 | 115.9 | 0.0 | 4.2 |
| 2040 | 125.4 | 122.2 | 0.0 | 3.2 |
| 2041 | 130.6 | 128.9 | 0.0 | 1.7 |
| 2042 | 135.7 | 136.1 | 0.0 | (0.4) |
| 2043 | 139.7 | 143.2 | 0.0 | (3.5) |
| 2044 | 144.1 | 150.5 | 0.0 | (6.4) |
| 2045 | 149.2 | 158.5 | 0.0 | (9.3) |
| 2046 | 154.4 | 167.2 | 0.0 | (12.8) |
| 2047 | 159.8 | 176.4 | 0.0 | (16.6) |
| 2048 | 165.2 | 185.8 | 0.0 | (20.6) |
| 2049 | 170.6 | 195.1 | 0.0 | (24.5) |
| 2050 | 175.8 | 205.5 | 0.0 | (29.7) |
| 2051 | 180.6 | 215.1 | 0.0 | (34.5) |
| 2052 | 185.2 | 225.6 | 0.0 | (40.4) |
| 2053 | 189.5 | 236.8 | 0.0 | (47.3) |
| 2054 | 192.7 | 248.2 | 0.0 | (55.5) |
| 2055 | 194.6 | 258.7 | 0.0 | (64.1) |
| 2056 | 197.1 | 270.9 | 0.0 | (73.8) |
| 2057 | 203.0 | 284.7 | 0.0 | (81.7) |
| 2058 | 210.7 | 299.7 | 0.0 | (89.0) |
| 2059 | 217.5 | 315.6 | 0.0 | (98.1) |
| 2060 | 224.1 | 333.1 | 0.0 | (109.0) |
Appendix J ― Uncertainty of future investment returns
J.1 Introduction
The projected financial status of the CFPF depends on many demographic and economic factors, including new contributors, average earnings, inflation, level of interest rates and investment returns. The projected long-term financial status of the CFPF is based on best-estimate assumptions. The objective of this section is to present a range of outcomes resulting from various alternative investment return scenarios. In this appendix, any references to assets, liabilities, surplus/(deficit), annual special payments and service cost are related to the CFPF only. Due to its relative small size, results for the RFPF are not presented in this appendix.
Appendix J.2 illustrates how investment experience may affect the funding status of the CFPF over time. The impact of financial market tail events on the financial status of the CFPF is explored in Section J.3, where a severe one-time financial shock is applied to PSP's portfolio with the purpose of quantifying the impact on the funding ratio over the short-term horizon.
J.2 Range of potential funding ratios due to investment volatility
Chart 5 illustrates a range of funded ratios (actuarial value of assets over actuarial liabilities) that could be expected under the best-estimate portfolio. It takes into account that actuarial valuations would occur every three years starting in plan year 2022, that deficits are covered by additional government contributions, and that legislated non-permitted surplus (surplus in excess of 25% of liabilities) results in a full or partial contribution holiday for the government. The median expected funded ratios range between 110% - 121% over the projection period.
Chart 5 Range of potential funding ratio for the best-estimate portfolio - CFPF
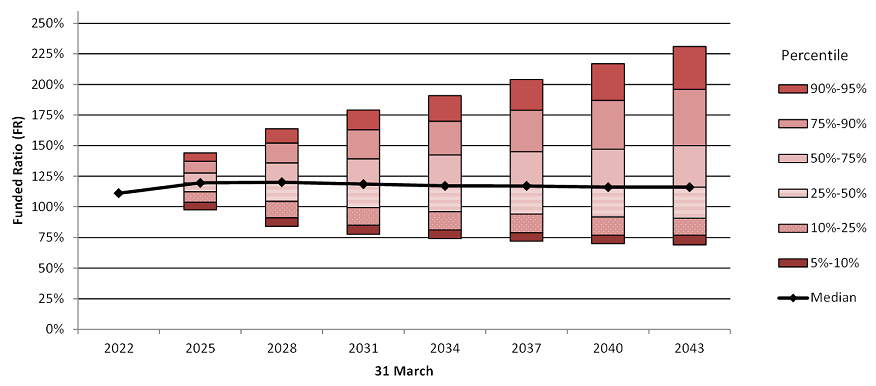
CFPF range of funding ratios - Text version
Bar graph showing the range of potential funding ratio of the best-estimate portfolio over time. Y-axis represents the funded ratio. X-axis shows the year, starting on 31 March 2022 and ending on 31 March 2043.
The Pension Fund was fully funded (funding ratio of 111%) on 31 March 2022. The median expected funding ratio varies between 111% and 120% over the projection period. On 31 March 2025, the funding ratio is expected to be between 97% (5th percentile) and 144% (95th percentile) with a median of 120%, on 31 March 2034, between 74% (5th percentile) and 191% (95th percentile) with a median of 117%, and on 31 March 2043, between 69% (5th percentile) and 231% (95th percentile) with a median of 116%.
| Percentile | 31 March 2022 | 31 March 2025 | 31 March 2028 | 31 March 2031 | 31 March 2034 | 31 March 2037 | 31 March 2040 | 31 March 2043 |
|---|---|---|---|---|---|---|---|---|
| 5% | 111% | 97% | 84% | 78% | 74% | 72% | 70% | 69% |
| 10% | 111% | 104% | 91% | 85% | 81% | 79% | 77% | 77% |
| 25% | 111% | 112% | 104% | 99% | 96% | 94% | 92% | 91% |
| Median | 111% | 120% | 120% | 118% | 117% | 117% | 116% | 116% |
| 75% | 111% | 128% | 136% | 139% | 142% | 145% | 147% | 150% |
| 90% | 111% | 137% | 152% | 163% | 170% | 179% | 187% | 196% |
| 95% | 111% | 144% | 164% | 179% | 191% | 204% | 217% | 231% |
Chart 6 shows that the range of potential outcomes widens with time. It illustrates the probabilities associated with three possible funded statuses over the next 20 years: deficit, surplus less than 25% of liabilities, and non-permitted surplus.
Chart 6 Likelihood of deficits and non-permitted surplus due to investment volatility
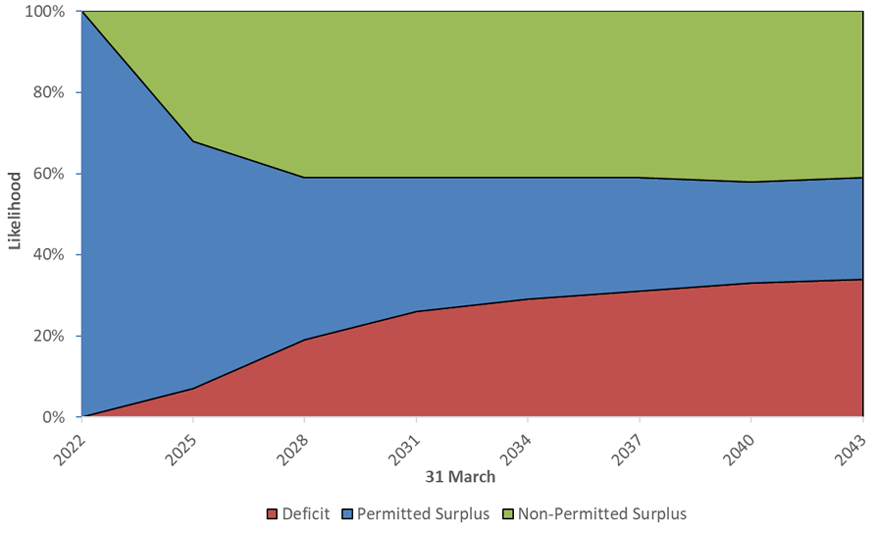
CFPF likelihood of deficits, permitted and non-permitted surplus - Text version
Probability density graph showing the likelihood of deficit, permitted and non-permitted surplus due to investment volatility. The left Y-axis shows the likelihood of the situation. X-axis shows the plan year, starting at 31 March 2022 and ending at 31 March 2043.
There is a permitted surplus as at 31 March 2022. As at 31 March 2025, the probability of a deficit is 7% whereas the probability of a non-permitted surplus is approximately 32%. The probability of a deficit increases to 19% as at 31 March 2028, to reach 34% by plan year 2043. The probability of a non-permitted surplus increases to 41% as at 31 March 2028 and remains stable at 41% until plan year 2043.
| 31 March | Deficit | Permitted surplus | Non-permitted surplus |
|---|---|---|---|
| 2022 | 0% | 100% | 0% |
| 2023 | 1% | 91% | 8% |
| 2024 | 4% | 79% | 17% |
| 2025 | 7% | 61% | 32% |
| 2026 | 11% | 50% | 39% |
| 2027 | 16% | 43% | 41% |
| 2028 | 19% | 40% | 41% |
| 2029 | 22% | 36% | 42% |
| 2030 | 24% | 35% | 41% |
| 2031 | 26% | 33% | 41% |
| 2032 | 27% | 32% | 41% |
| 2033 | 29% | 31% | 40% |
| 2034 | 29% | 30% | 41% |
| 2035 | 31% | 28% | 41% |
| 2036 | 31% | 28% | 41% |
| 2037 | 31% | 28% | 41% |
| 2038 | 32% | 28% | 40% |
| 2039 | 33% | 26% | 41% |
| 2040 | 33% | 25% | 42% |
| 2041 | 34% | 25% | 41% |
| 2042 | 34% | 23% | 43% |
| 2043 | 34% | 25% | 41% |
J.3 Financial market tail events
This section focuses on the inherent volatility in PSP's portfolio and the extreme outcomes that could result. During plan year 2009, the nominal return on Plan assets was negative 22.7% due to the economic slowdown. Such an event could be characterized as low probability (also referred to as a "tail event"). However, when these events do occur, the impact on the funding ratio may be significant. This section analyzes the impacts that tail-event returns would have on the Plan's funded ratio and the projected surplus/(deficit) as at 31 March 2025 (the expected date of the next actuarial review).
To illustrate this, returns other than the best-estimate are assumed to occur in plan year 2023 followed by the best-estimate returns for plan years 2024 and 2025.
The returns are assumed to follow a normal distribution. Two percentiles were selected to analyze: 10th and 2nd percentiles. The left tail event is the occurrence of a nominal return such that the probability of earning that return or less is equal to 10% (or 2%). The right tail event is the occurrence of a nominal return such that the probability of earning that return or more is equal to 10% (or 2%).
Extreme events occurring during the intervaluation period can result in the plan either requiring a special payment when there is a severe economic downturn or exceeding the non-permitted surplus threshold when market conditions are extremely favorable. Table 70 shows the impact on the financial position of the CFPF such potential isolated tail-events. The use of the actuarial value of assets mitigates the funding risk due to extreme returns.
| Tail-events assessed | Nominal return | Components of the financial situation (in $ millions) | Funding ratio | |||||
|---|---|---|---|---|---|---|---|---|
| Plan year 2023 | Average 2023 to 2025 | Market value of assets | Actuarial value of assets | Liability | Surplus/ (deficit) | Annual special payments | ||
| Current basis | 5.3% | 5.9% | 53,306 | 52,855 | 44,217 | 8,639 | 0 | 120% |
| Left tail at the 2nd percentile | (15.2%) | (1.5%) | 42,980 | 46,195 | 44,217 | 1,978 | 0 | 104% |
| Left tail at the 10th percentile | (7.3%) | 1.5% | 46,953 | 48,757 | 44,217 | 4,541 | 0 | 110% |
| Right tail at the 10th percentile | 18.9% | 10.3% | 60,140 | 57,263 | 44,217 | 13,047 | 0 | 130% |
| Right tail at the 2nd percentile | 26.7% | 12.6% | 64,113 | 59,826 | 44,217 | 15,609 | 0 | 135% |
Appendix K ― Detailed information on membership
In this appendix, the 'Age' and 'Service' nomenclature refers to completed years calculated at the beginning of the plan year.
| Age | Male officers | Years of accrued service | ||||||||
|---|---|---|---|---|---|---|---|---|---|---|
| 0 to 4 | 5 to 9 | 10 to 14 | 15 to 19 | 20 to 24 | 25 to 29 | 30 to 34 | 35+ | All years | ||
| 15 to 19 | Number | 363 | 0 | 0 | 0 | 0 | 0 | 0 | 0 | 363 |
| Average annual earnings | $30,278 | $0 | $0 | $0 | $0 | $0 | $0 | $0 | $30,278 | |
| 20 to 24 | Number | 1,049 | 350 | 0 | 0 | 0 | 0 | 0 | 0 | 1,399 |
| Average annual earnings | $41,964 | $69,550 | $0 | $0 | $0 | $0 | $0 | $0 | $48,866 | |
| 25 to 29 | Number | 845 | 927 | 241 | 0 | 0 | 0 | 0 | 0 | 2,013 |
| Average annual earnings | $72,055 | $91,647 | $100,108 | $0 | $0 | $0 | $0 | $0 | $84,436 | |
| 30 to 34 | Number | 477 | 782 | 978 | 258 | 0 | 0 | 0 | 0 | 2,495 |
| Average annual earnings | $80,824 | $103,814 | $111,328 | $120,918 | $0 | $0 | $0 | $0 | $104,133 | |
| 35 to 39 | Number | 228 | 417 | 745 | 902 | 218 | 0 | 0 | 0 | 2,510 |
| Average annual earnings | $86,612 | $107,192 | $115,371 | $124,651 | $134,367 | $0 | $0 | $0 | $116,385 | |
| 40 to 44 | Number | 152 | 153 | 326 | 749 | 693 | 94 | 0 | 0 | 2,167 |
| Average annual earnings | $104,304 | $108,891 | $118,166 | $131,032 | $134,030 | $152,697 | $0 | $0 | $127,557 | |
| 45 to 49 | Number | 103 | 81 | 160 | 341 | 497 | 446 | 98 | 0 | 1,726 |
| Average annual earnings | $107,125 | $104,177 | $118,720 | $129,651 | $139,539 | $152,218 | $159,596 | $0 | $136,477 | |
| 50 to 54 | Number | 49 | 81 | 112 | 156 | 217 | 248 | 486 | 49 | 1,398 |
| Average annual earnings | $114,244 | $115,062 | $118,906 | $130,823 | $142,869 | $140,379 | $154,590 | $149,175 | $140,844 | |
| 55 to 59 | Number | 8 | 44 | 83 | 78 | 69 | 88 | 220 | 177 | 767 |
| Average annual earnings | $114,151 | $119,316 | $125,102 | $136,122 | $137,954 | $138,266 | $146,094 | $146,241 | $139,342 | |
| 60 to 64Table 71 footnote b | Number | 2 | 9 | 16 | 13 | 8 | 7 | 14 | 25 | 94 |
| Average annual earnings | $113,292 | $148,155 | $123,198 | $134,505 | $131,788 | $146,958 | $133,800 | $149,318 | $137,967 | |
| All ages | Number | 3,276 | 2,844 | 2,661 | 2,497 | 1,702 | 883 | 818 | 251 | 14,932 |
| Average annual earnings | $63,438 | $97,111 | $113,546 | $127,657 | $136,957 | $147,512 | $152,549 | $147,120 | $109,160 | |
|
Table 71 footnotes
|
||||||||||
| blank | As at 31 March 2022 | As at 31 March 2019 |
|---|---|---|
| Average age | 37.4 | 37.3 |
| Average accrued service | 13.7 | 13.9 |
| Annualized pensionable payroll (in millions)Table 72 footnote a | $1,630 | $1,446 |
| Total PBDA indexed reduction to basic annuity (in millions) | $3.5 | $4.4 |
| Total PBDA indexed reduction adjustment (in millions) | $0.6 | $0.8 |
|
Table 72 footnotes
|
||
| Age | Male other ranks | Years of accrued service | ||||||||
|---|---|---|---|---|---|---|---|---|---|---|
| 0 to 4 | 5 to 9 | 10 to 14 | 15 to 19 | 20 to 24 | 25 to 29 | 30 to 34 | 35+ | All years | ||
| 15 to 19 | Number | 749 | 0 | 0 | 0 | 0 | 0 | 0 | 0 | 749 |
| Average annual earnings | $41,381 | $0 | $0 | $0 | $0 | $0 | $0 | $0 | $41,381 | |
| 20 to 24 | Number | 5,038 | 585 | 0 | 0 | 0 | 0 | 0 | 0 | 5,623 |
| Average annual earnings | $54,891 | $70,107 | $0 | $0 | $0 | $0 | $0 | $0 | $56,474 | |
| 25 to 29 | Number | 3,800 | 4,328 | 289 | 0 | 0 | 0 | 0 | 0 | 8,417 |
| Average annual earnings | $60,405 | $72,662 | $76,991 | $0 | $0 | $0 | $0 | $0 | $67,277 | |
| 30 to 34 | Number | 1,529 | 3,108 | 3,812 | 493 | 0 | 0 | 0 | 0 | 8,942 |
| Average annual earnings | $62,166 | $73,993 | $78,069 | $82,264 | $0 | $0 | $0 | $0 | $74,164 | |
| 35 to 39 | Number | 630 | 1,106 | 2,694 | 2,772 | 267 | 0 | 0 | 0 | 7,469 |
| Average annual earnings | $62,710 | $74,489 | $78,715 | $84,097 | $88,512 | $0 | $0 | $0 | $79,087 | |
| 40 to 44 | Number | 295 | 414 | 999 | 1,904 | 1,554 | 96 | 0 | 0 | 5,262 |
| Average annual earnings | $62,829 | $74,119 | $78,628 | $84,455 | $89,484 | $92,372 | $0 | $0 | $82,952 | |
| 45 to 49 | Number | 163 | 169 | 464 | 753 | 986 | 728 | 87 | 0 | 3,350 |
| Average annual earnings | $66,517 | $75,267 | $78,619 | $83,709 | $88,439 | $97,717 | $102,036 | $0 | $86,654 | |
| 50 to 54 | Number | 65 | 95 | 214 | 284 | 315 | 409 | 758 | 73 | 2,213 |
| Average annual earnings | $64,608 | $74,434 | $77,744 | $82,921 | $87,352 | $91,361 | $97,159 | $100,140 | $89,154 | |
| 55 to 59 | Number | 22 | 46 | 127 | 128 | 128 | 122 | 291 | 261 | 1,125 |
| Average annual earnings | $69,403 | $76,500 | $77,989 | $81,475 | $84,140 | $85,379 | $91,519 | $95,709 | $87,269 | |
| 60 to 64Table 73 footnote b | Number | 1 | 5 | 14 | 11 | 5 | 8 | 16 | 16 | 76 |
| Average annual earnings | $101,666 | $71,164 | $76,451 | $81,379 | $85,816 | $82,377 | $83,527 | $92,452 | $83,247 | |
| All ages | Number | 12,292 | 9,856 | 8,613 | 6,345 | 3,255 | 1,363 | 1,152 | 350 | 43,226 |
| Average annual earnings | $57,504 | $73,275 | $78,317 | $83,906 | $88,666 | $94,239 | $95,914 | $96,484 | $73,967 | |
|
Table 73 footnotes
|
||||||||||
| blank | As at 31 March 2022 | As at 31 March 2019 |
|---|---|---|
| Average age | 34.4 | 34.1 |
| Average accrued service | 11.1 | 11.0 |
| Annualized pensionable payroll (in millions)Table 74 footnote a | $3,197 | $3,008 |
| Total PBDA indexed reduction to basic annuity (in millions) | $4.2 | $5.1 |
| Total PBDA indexed reduction adjustment (in millions) | $1.0 | $1.2 |
|
Table 74 footnotes
|
||
| Age | Female officers | Years of accrued service | ||||||||
|---|---|---|---|---|---|---|---|---|---|---|
| 0 to 4 | 5 to 9 | 10 to 14 | 15 to 19 | 20 to 24 | 25 to 29 | 30 to 34 | 35+ | All years | ||
| 15 to 19 | Number | 152 | 0 | 0 | 0 | 0 | 0 | 0 | 0 | 152 |
| Average annual earnings | $29,666 | $0 | $0 | $0 | $0 | $0 | $0 | $0 | $29,666 | |
| 20 to 24 | Number | 295 | 77 | 0 | 0 | 0 | 0 | 0 | 0 | 372 |
| Average annual earnings | $43,056 | $70,019 | $0 | $0 | $0 | $0 | $0 | $0 | $48,637 | |
| 25 to 29 | Number | 270 | 219 | 50 | 0 | 0 | 0 | 0 | 0 | 539 |
| Average annual earnings | $79,129 | $94,056 | $100,955 | $0 | $0 | $0 | $0 | $0 | $87,219 | |
| 30 to 34 | Number | 191 | 198 | 255 | 56 | 0 | 0 | 0 | 0 | 700 |
| Average annual earnings | $85,465 | $109,834 | $113,422 | $122,838 | $0 | $0 | $0 | $0 | $105,532 | |
| 35 to 39 | Number | 99 | 133 | 156 | 256 | 70 | 0 | 0 | 0 | 714 |
| Average annual earnings | $80,271 | $113,222 | $119,913 | $125,271 | $139,575 | $0 | $0 | $0 | $117,019 | |
| 40 to 44 | Number | 59 | 53 | 108 | 191 | 162 | 23 | 0 | 0 | 596 |
| Average annual earnings | $93,893 | $102,913 | $121,211 | $132,587 | $132,647 | $146,017 | $0 | $0 | $124,591 | |
| 45 to 49 | Number | 32 | 31 | 40 | 75 | 131 | 67 | 10 | 0 | 386 |
| Average annual earnings | $91,082 | $106,485 | $121,988 | $128,723 | $137,957 | $144,264 | $154,691 | $0 | $129,623 | |
| 50 to 54 | Number | 20 | 14 | 31 | 42 | 63 | 53 | 45 | 5 | 273 |
| Average annual earnings | $114,657 | $105,375 | $115,721 | $135,304 | $132,770 | $148,377 | $154,518 | $158,022 | $135,569 | |
| 55 to 59 | Number | 3 | 10 | 12 | 21 | 25 | 16 | 21 | 15 | 123 |
| Average annual earnings | $241,112 | $117,855 | $133,015 | $130,530 | $136,375 | $130,474 | $161,009 | $161,598 | $142,612 | |
| 60 to 64Table 75 footnote b | Number | 0 | 3 | 1 | 0 | 0 | 2 | 1 | 1 | 8 |
| Average annual earnings | $0 | $99,825 | $136,574 | $0 | $0 | $108,230 | $116,621 | $176,488 | $118,202 | |
| All ages | Number | 1,121 | 738 | 653 | 641 | 451 | 161 | 77 | 21 | 3,863 |
| Average annual earnings | $66,295 | $100,954 | $116,336 | $128,472 | $135,489 | $144,050 | $155,818 | $161,455 | $105,313 | |
|
Table 75 footnotes
|
||||||||||
| blank | As at 31 March 2022 | As at 31 March 2019 |
|---|---|---|
| Average age | 36.0 | 35.8 |
| Average accrued service | 11.8 | 11.9 |
| Annualized pensionable payroll (in millions)Table 76 footnote a | $407 | $341 |
| Total PBDA indexed reduction to basic annuity (in millions) | $0.1 | $0.1 |
| Total PBDA indexed reduction adjustment (in millions) | $0.0 | $0.0 |
|
Table 76 footnotes
|
||
| Age | Female other ranks | Years of accrued service | ||||||||
|---|---|---|---|---|---|---|---|---|---|---|
| 0 to 4 | 5 to 9 | 10 to 14 | 15 to 19 | 20 to 24 | 25 to 29 | 30 to 34 | 35+ | All years | ||
| 15 to 19 | Number | 87 | 0 | 0 | 0 | 0 | 0 | 0 | 0 | 87 |
| Average annual earnings | $42,827 | $0 | $0 | $0 | $0 | $0 | $0 | $0 | $42,827 | |
| 20 to 24 | Number | 608 | 57 | 0 | 0 | 0 | 0 | 0 | 0 | 665 |
| Average annual earnings | $55,584 | $70,525 | $0 | $0 | $0 | $0 | $0 | $0 | $56,864 | |
| 25 to 29 | Number | 777 | 538 | 25 | 0 | 0 | 0 | 0 | 0 | 1,340 |
| Average annual earnings | $60,267 | $71,768 | $78,827 | $0 | $0 | $0 | $0 | $0 | $65,230 | |
| 30 to 34 | Number | 481 | 604 | 421 | 40 | 0 | 0 | 0 | 0 | 1,546 |
| Average annual earnings | $60,278 | $72,011 | $76,024 | $81,908 | $0 | $0 | $0 | $0 | $69,709 | |
| 35 to 39 | Number | 271 | 350 | 400 | 300 | 24 | 0 | 0 | 0 | 1,345 |
| Average annual earnings | $60,856 | $71,839 | $76,114 | $81,214 | $85,351 | $0 | $0 | $0 | $73,229 | |
| 40 to 44 | Number | 131 | 176 | 254 | 357 | 199 | 10 | 0 | 0 | 1,127 |
| Average annual earnings | $62,166 | $72,122 | $76,510 | $82,127 | $86,169 | $94,790 | $0 | $0 | $77,804 | |
| 45 to 49 | Number | 56 | 86 | 134 | 206 | 185 | 81 | 12 | 0 | 760 |
| Average annual earnings | $60,631 | $71,860 | $75,675 | $81,497 | $85,944 | $88,248 | $99,273 | $0 | $79,925 | |
| 50 to 54 | Number | 31 | 52 | 87 | 140 | 97 | 83 | 66 | 2 | 558 |
| Average annual earnings | $63,343 | $72,777 | $76,051 | $81,932 | $83,884 | $87,361 | $96,177 | $107,910 | $82,054 | |
| 55 to 59 | Number | 9 | 28 | 34 | 56 | 35 | 26 | 31 | 17 | 236 |
| Average annual earnings | $57,701 | $72,858 | $75,160 | $80,942 | $83,695 | $80,050 | $93,871 | $91,988 | $81,068 | |
| 60 to 64Table 77 footnote b | Number | 0 | 2 | 6 | 2 | 5 | 4 | 5 | 2 | 26 |
| Average annual earnings | $0 | $75,764 | $72,925 | $74,250 | $80,443 | $78,078 | $86,982 | $99,407 | $80,224 | |
| All ages | Number | 2,451 | 1,893 | 1,361 | 1,101 | 545 | 204 | 114 | 21 | 7,690 |
| Average annual earnings | $58,693 | $71,906 | $76,125 | $81,653 | $85,439 | $86,963 | $95,472 | $94,211 | $71,606 | |
|
Table 77 footnotes
|
||||||||||
| blank | As at 31 March 2022 | As at 31 March 2019 |
|---|---|---|
| Average age | 36.2 | 36.2 |
| Average accrued service | 10.2 | 10.3 |
| Annualized pensionable payroll (in millions)Table 78 footnote a | $551 | $502 |
| Total PBDA indexed reduction to basic annuity (in millions) | $0.1 | $0.1 |
| Total PBDA indexed reduction adjustment (in millions) | $0.0 | $0.0 |
|
Table 78 footnotes
|
||
| Age | Male officers | Years of pensionable service | ||||||||
|---|---|---|---|---|---|---|---|---|---|---|
| 0 to 4 | 5 to 9 | 10 to 14 | 15 to 19 | 20 to 24 | 25 to 29 | 30 to 34 | 35+ | All years | ||
| 15 to 19 | Number | 4 | 0 | 0 | 0 | 0 | 0 | 0 | 0 | 4 |
| Average annual earnings | $21,764 | $0 | $0 | $0 | $0 | $0 | $0 | $0 | $21,764 | |
| 20 to 24 | Number | 277 | 6 | 0 | 0 | 0 | 0 | 0 | 0 | 283 |
| Average annual earnings | $19,881 | $50,471 | $0 | $0 | $0 | $0 | $0 | $0 | $20,530 | |
| 25 to 29 | Number | 442 | 249 | 7 | 0 | 0 | 0 | 0 | 0 | 698 |
| Average annual earnings | $22,841 | $29,265 | $45,016 | $0 | $0 | $0 | $0 | $0 | $25,355 | |
| 30 to 34 | Number | 213 | 251 | 195 | 6 | 0 | 0 | 0 | 0 | 665 |
| Average annual earnings | $22,297 | $21,179 | $26,136 | $29,991 | $0 | $0 | $0 | $0 | $23,070 | |
| 35 to 39 | Number | 141 | 101 | 186 | 121 | 15 | 0 | 0 | 0 | 564 |
| Average annual earnings | $20,669 | $22,856 | $17,499 | $26,990 | $23,740 | $0 | $0 | $0 | $21,453 | |
| 40 to 44 | Number | 125 | 72 | 121 | 145 | 60 | 12 | 0 | 0 | 535 |
| Average annual earnings | $19,773 | $21,667 | $18,885 | $24,478 | $32,576 | $26,278 | $0 | $0 | $22,684 | |
| 45 to 49 | Number | 115 | 63 | 85 | 107 | 24 | 54 | 29 | 0 | 477 |
| Average annual earnings | $16,594 | $18,877 | $20,308 | $21,368 | $28,150 | $36,322 | $33,338 | $0 | $22,461 | |
| 50 to 54 | Number | 116 | 59 | 100 | 127 | 11 | 24 | 78 | 24 | 539 |
| Average annual earnings | $18,579 | $18,986 | $22,447 | $28,936 | $17,874 | $43,034 | $40,252 | $33,197 | $26,643 | |
| 55 to 59 | Number | 60 | 61 | 81 | 97 | 9 | 14 | 18 | 44 | 384 |
| Average annual earnings | $11,814 | $17,248 | $24,818 | $24,842 | $25,174 | $28,130 | $33,080 | $39,432 | $23,781 | |
| 60+Table 79 footnote b | Number | 17 | 32 | 75 | 62 | 6 | 1 | 5 | 20 | 218 |
| Average annual earnings | $8,323 | $11,220 | $10,104 | $17,919 | $29,882 | $6,788 | $6,594 | $24,158 | $14,090 | |
| All ages | Number | 1,510 | 894 | 850 | 665 | 125 | 105 | 130 | 88 | 4,367 |
| Average annual earnings | $20,357 | $22,925 | $20,812 | $24,777 | $28,710 | $35,335 | $36,422 | $34,260 | $23,002 | |
|
Table 79 footnotes
|
||||||||||
| blank | As at 31 March 2022 | As at 31 March 2019 |
|---|---|---|
| Average age | 40.3 | 40.2 |
| Average years of pensionable service | 10.1 | 9.9 |
| Annualized pensionable payroll (in millions)Table 80 footnote a | $97 | $83 |
|
Table 80 footnotes
|
||
| Age | Male other ranks | Years of pensionable service | ||||||||
|---|---|---|---|---|---|---|---|---|---|---|
| 0 to 4 | 5 to 9 | 10 to 14 | 15 to 19 | 20 to 24 | 25 to 29 | 30 to 34 | 35+ | All years | ||
| 15 to 19 | Number | 441 | 0 | 0 | 0 | 0 | 0 | 0 | 0 | 441 |
| Average annual earnings | $12,522 | $0 | $0 | $0 | $0 | $0 | $0 | $0 | $12,522 | |
| 20 to 24 | Number | 3,413 | 149 | 0 | 0 | 0 | 0 | 0 | 0 | 3,562 |
| Average annual earnings | $20,913 | $30,583 | $0 | $0 | $0 | $0 | $0 | $0 | $21,317 | |
| 25 to 29 | Number | 1,514 | 1,280 | 113 | 0 | 0 | 0 | 0 | 0 | 2,907 |
| Average annual earnings | $21,671 | $23,476 | $23,248 | $0 | $0 | $0 | $0 | $0 | $22,527 | |
| 30 to 34 | Number | 589 | 468 | 679 | 53 | 0 | 0 | 0 | 0 | 1,789 |
| Average annual earnings | $18,453 | $20,814 | $20,356 | $18,663 | $0 | $0 | $0 | $0 | $19,799 | |
| 35 to 39 | Number | 294 | 155 | 275 | 258 | 45 | 0 | 0 | 0 | 1,027 |
| Average annual earnings | $16,612 | $19,267 | $17,756 | $17,145 | $15,712 | $0 | $0 | $0 | $17,414 | |
| 40 to 44 | Number | 239 | 82 | 94 | 158 | 73 | 22 | 0 | 0 | 668 |
| Average annual earnings | $13,448 | $17,401 | $13,862 | $17,748 | $21,602 | $26,784 | $0 | $0 | $16,339 | |
| 45 to 49 | Number | 179 | 75 | 65 | 121 | 14 | 66 | 29 | 0 | 549 |
| Average annual earnings | $11,460 | $17,033 | $13,032 | $20,602 | $21,202 | $22,858 | $18,539 | $0 | $16,415 | |
| 50 to 54 | Number | 152 | 80 | 58 | 108 | 9 | 11 | 78 | 19 | 515 |
| Average annual earnings | $11,863 | $15,232 | $16,490 | $22,648 | $21,170 | $17,991 | $22,380 | $19,028 | $17,320 | |
| 55 to 59 | Number | 75 | 48 | 50 | 74 | 1 | 8 | 8 | 34 | 298 |
| Average annual earnings | $8,429 | $10,208 | $7,379 | $17,134 | $10,471 | $18,411 | $21,238 | $23,161 | $13,000 | |
| 60+Table 81 footnote b | Number | 162 | 46 | 53 | 23 | 2 | 0 | 1 | 0 | 287 |
| Average annual earnings | $3,336 | $5,249 | $5,881 | $7,978 | $14,888 | $0 | $4,224 | $0 | $4,568 | |
| All ages | Number | 7,058 | 2,383 | 1,387 | 795 | 144 | 107 | 116 | 53 | 12,043 |
| Average annual earnings | $18,943 | $21,816 | $18,111 | $18,373 | $19,525 | $22,832 | $21,185 | $21,679 | $19,453 | |
|
Table 81 footnotes
|
||||||||||
| blank | As at 31 March 2022 | As at 31 March 2019 |
|---|---|---|
| Average age | 31.2 | 31.0 |
| Average years of pensionable service | 6.0 | 6.7 |
| Annualized pensionable payroll (in millions)Table 82 footnote a | $233 | $198 |
|
Table 82 footnotes
|
||
| Age | Female officers | Years of pensionable service | ||||||||
|---|---|---|---|---|---|---|---|---|---|---|
| 0 to 4 | 5 to 9 | 10 to 14 | 15 to 19 | 20 to 24 | 25 to 29 | 30 to 34 | 35+ | All years | ||
| 15 to 19 | Number | 0 | 0 | 0 | 0 | 0 | 0 | 0 | 0 | 0 |
| Average annual earnings | $0 | $0 | $0 | $0 | $0 | $0 | $0 | $0 | $0 | |
| 20 to 24 | Number | 91 | 1 | 0 | 0 | 0 | 0 | 0 | 0 | 92 |
| Average annual earnings | $13,374 | $28,955 | $0 | $0 | $0 | $0 | $0 | $0 | $13,543 | |
| 25 to 29 | Number | 171 | 133 | 2 | 0 | 0 | 0 | 0 | 0 | 306 |
| Average annual earnings | $19,088 | $15,302 | $55,005 | $0 | $0 | $0 | $0 | $0 | $17,677 | |
| 30 to 34 | Number | 95 | 131 | 112 | 5 | 0 | 0 | 0 | 0 | 343 |
| Average annual earnings | $17,245 | $15,722 | $16,254 | $2,163 | $0 | $0 | $0 | $0 | $16,120 | |
| 35 to 39 | Number | 48 | 54 | 132 | 65 | 6 | 0 | 0 | 0 | 305 |
| Average annual earnings | $21,167 | $19,127 | $18,108 | $21,761 | $3,623 | $0 | $0 | $0 | $19,264 | |
| 40 to 44 | Number | 57 | 37 | 83 | 85 | 31 | 5 | 0 | 0 | 298 |
| Average annual earnings | $14,331 | $24,317 | $15,123 | $15,921 | $21,910 | $9,297 | $0 | $0 | $16,949 | |
| 45 to 49 | Number | 48 | 39 | 41 | 55 | 9 | 17 | 6 | 0 | 215 |
| Average annual earnings | $14,008 | $21,392 | $20,355 | $16,380 | $37,612 | $14,653 | $49,229 | $0 | $19,186 | |
| 50 to 54 | Number | 31 | 51 | 40 | 35 | 1 | 5 | 11 | 3 | 177 |
| Average annual earnings | $12,762 | $16,194 | $16,070 | $22,934 | $94,406 | $17,097 | $35,322 | $16,261 | $18,555 | |
| 55 to 59 | Number | 31 | 21 | 47 | 46 | 2 | 3 | 3 | 7 | 160 |
| Average annual earnings | $11,030 | $16,812 | $17,504 | $15,249 | $7,919 | $7,756 | $10,592 | $31,999 | $15,712 | |
| 60+Table 83 footnote b | Number | 14 | 19 | 34 | 36 | 4 | 0 | 1 | 6 | 114 |
| Average annual earnings | $9,419 | $8,766 | $13,387 | $13,571 | $5,252 | $0 | $1,131 | $11,657 | $11,704 | |
| All ages | Number | 586 | 486 | 491 | 327 | 53 | 30 | 21 | 16 | 2,010 |
| Average annual earnings | $16,201 | $16,947 | $16,968 | $17,346 | $22,089 | $13,478 | $34,135 | $21,420 | $17,099 | |
|
Table 83 footnotes
|
||||||||||
| Components | As at 31 March 2022 | As at 31 March 2019 |
|---|---|---|
| Average age | 40.1 | 39.0 |
| Average years of pensionable service | 9.7 | 8.7 |
| Annualized pensionable payroll (in millions)Table 84 footnote a | $34 | $33 |
|
Table 84 footnotes
|
||
| Age | Female other ranks | Years of pensionable service | ||||||||
|---|---|---|---|---|---|---|---|---|---|---|
| 0 to 4 | 5 to 9 | 10 to 14 | 15 to 19 | 20 to 24 | 25 to 29 | 30 to 34 | 35+ | All years | ||
| 15 to 19 | Number | 77 | 0 | 0 | 0 | 0 | 0 | 0 | 0 | 77 |
| Average annual earnings | $13,982 | $0 | $0 | $0 | $0 | $0 | $0 | $0 | $13,982 | |
| 20 to 24 | Number | 634 | 25 | 0 | 0 | 0 | 0 | 0 | 0 | 659 |
| Average annual earnings | $23,338 | $25,830 | $0 | $0 | $0 | $0 | $0 | $0 | $23,433 | |
| 25 to 29 | Number | 401 | 192 | 15 | 0 | 0 | 0 | 0 | 0 | 608 |
| Average annual earnings | $25,022 | $24,053 | $31,502 | $0 | $0 | $0 | $0 | $0 | $24,876 | |
| 30 to 34 | Number | 151 | 89 | 116 | 9 | 0 | 0 | 0 | 0 | 365 |
| Average annual earnings | $25,742 | $21,483 | $23,314 | $23,040 | $0 | $0 | $0 | $0 | $23,865 | |
| 35 to 39 | Number | 106 | 25 | 49 | 50 | 16 | 0 | 0 | 0 | 246 |
| Average annual earnings | $24,831 | $20,242 | $14,745 | $23,250 | $27,433 | $0 | $0 | $0 | $22,204 | |
| 40 to 44 | Number | 77 | 22 | 15 | 31 | 16 | 8 | 0 | 0 | 169 |
| Average annual earnings | $20,728 | $14,625 | $16,012 | $25,230 | $6,414 | $23,317 | $0 | $0 | $19,108 | |
| 45 to 49 | Number | 56 | 28 | 13 | 11 | 8 | 7 | 3 | 0 | 126 |
| Average annual earnings | $21,265 | $20,380 | $17,372 | $8,078 | $23,898 | $23,483 | $27,718 | $0 | $19,960 | |
| 50 to 54 | Number | 49 | 17 | 13 | 6 | 0 | 2 | 3 | 2 | 92 |
| Average annual earnings | $12,440 | $8,438 | $27,744 | $28,708 | $0 | $11,294 | $40,993 | $50,849 | $16,665 | |
| 55 to 59 | Number | 37 | 10 | 7 | 15 | 1 | 1 | 4 | 9 | 84 |
| Average annual earnings | $11,092 | $11,007 | $4,679 | $24,071 | $40,528 | $47,533 | $31,722 | $19,283 | $15,510 | |
| 60+Table 85 footnote b | Number | 24 | 6 | 9 | 4 | 1 | 0 | 0 | 0 | 44 |
| Average annual earnings | $4,136 | $8,807 | $7,967 | $5,495 | $821 | $0 | $0 | $0 | $5,605 | |
| All ages | Number | 1,612 | 414 | 237 | 126 | 42 | 18 | 10 | 11 | 2,470 |
| Average annual earnings | $22,538 | $21,451 | $20,382 | $22,192 | $18,431 | $23,391 | $33,302 | $25,022 | $22,123 | |
|
Table 85 footnotes
|
||||||||||
| Components | As at 31 March 2022 | As at 31 March 2019 |
|---|---|---|
| Average age | 31.8 | 31.3 |
| Average years of pensionable service | 5.3 | 6.3 |
| Annualized pensionable payroll (in millions)Table 86 footnote a | $54 | $45 |
|
Table 86 footnotes
|
||
| Age | Immediate annuity (includes PBDA, CPP if applicable)Table 87 footnote a |
Deferred annuity | ||||||
|---|---|---|---|---|---|---|---|---|
| SA/CFPF | RCA | SA/CFPF | RCA | |||||
| Number of pensioners | Average pension ($) | Number of pensioners | Average pension ($) | Number of pensioners | Average pension ($) | Number of pensioners | Average pension ($) | |
| 0 to 19 | 0 | n/a | 0 | n/a | 0 | n/a | 0 | n/a |
| 20 to 24 | 0 | n/a | 0 | n/a | 48 | 1,617 | 0 | n/a |
| 25 to 29 | 0 | n/a | 0 | n/a | 38 | 2,933 | 0 | n/a |
| 30 to 34 | 0 | n/a | 0 | n/a | 66 | 9,530 | 1 | 7,983 |
| 35 to 39 | 3 | 38,537 | 0 | n/a | 90 | 11,654 | 3 | 2,580 |
| 40 to 44 | 153 | 50,620 | 5 | 42,232 | 70 | 14,740 | 3 | 13,084 |
| 45 to 49 | 507 | 54,328 | 17 | 22,060 | 82 | 17,358 | 2 | 1,103 |
| 50 to 54 | 1,011 | 55,808 | 79 | 14,653 | 61 | 14,516 | 0 | n/a |
| 55 to 59 | 2,358 | 58,319 | 181 | 9,604 | 98 | 13,233 | 1 | 18,040 |
| 60 to 64 | 2,912 | 63,696 | 238 | 11,717 | 0 | n/a | 0 | n/a |
| 65 to 69 | 2,281 | 55,830 | 152 | 12,590 | 0 | n/a | 0 | n/a |
| 70 to 74 | 2,008 | 53,503 | 100 | 7,265 | 0 | n/a | 0 | n/a |
| 75 to 79 | 2,257 | 49,551 | 49 | 1,840 | 0 | n/a | 0 | n/a |
| 80 to 84 | 1,669 | 51,141 | 7 | 3,293 | 0 | n/a | 0 | n/a |
| 85 to 89 | 964 | 51,959 | 0 | n/a | 0 | n/a | 0 | n/a |
| 90 to 94 | 546 | 48,981 | 0 | n/a | 0 | n/a | 0 | n/a |
| 95 to 99 | 147 | 48,301 | 0 | n/a | 0 | n/a | 0 | n/a |
| 100 to 104 | 26 | 35,727 | 0 | n/a | 0 | n/a | 0 | n/a |
| 105+ | 1 | 39,938 | 0 | n/a | 0 | n/a | 0 | n/a |
| All ages | 16,843 | 55,317 | 828 | 10,899 | 553 | 11,762 | 10 | 7,522 |
|
Table 87 footnotes
|
||||||||
| blank | As at 31 March 2022 | As at 31 March 2019 |
|---|---|---|
| Average age | 69.2 | 68.4 |
| Average age at retirement/termination | 49.0 | 48.8 |
| Age | Immediate annuity (includes PBDA, CPP if applicable)Table 89 footnote a |
Deferred annuity | ||||||
|---|---|---|---|---|---|---|---|---|
| SA/CFPF | RCA | SA/CFPF | RCA | |||||
| Number of pensioners | Average pension ($) | Number of pensioners | Average pension ($) | Number of pensioners | Average pension ($) | Number of pensioners | Average pension ($) | |
| 0 to 19 | 0 | n/a | 0 | n/a | 0 | n/a | 0 | n/a |
| 20 to 24 | 0 | n/a | 0 | n/a | 6 | 1,274 | 0 | n/a |
| 25 to 29 | 0 | n/a | 0 | n/a | 8 | 3,956 | 0 | n/a |
| 30 to 34 | 0 | n/a | 0 | n/a | 14 | 13,935 | 0 | n/a |
| 35 to 39 | 2 | 24,041 | 0 | n/a | 25 | 10,962 | 0 | n/a |
| 40 to 44 | 50 | 49,410 | 2 | 42,773 | 37 | 16,452 | 1 | 7,807 |
| 45 to 49 | 138 | 51,395 | 9 | 28,913 | 17 | 13,505 | 2 | 1,547 |
| 50 to 54 | 164 | 49,477 | 13 | 19,395 | 18 | 18,783 | 2 | 13,585 |
| 55 to 59 | 256 | 44,904 | 22 | 5,619 | 25 | 17,335 | 1 | 4,706 |
| 60 to 64 | 276 | 53,731 | 21 | 18,498 | 2 | 16,363 | 0 | n/a |
| 65 to 69 | 188 | 43,467 | 14 | 10,224 | 0 | n/a | 0 | n/a |
| 70 to 74 | 130 | 43,620 | 7 | 2,903 | 0 | n/a | 0 | n/a |
| 75 to 79 | 73 | 37,491 | 4 | 3,418 | 0 | n/a | 0 | n/a |
| 80 to 84 | 34 | 41,147 | 1 | 1,081 | 0 | n/a | 0 | n/a |
| 85 to 89 | 22 | 37,340 | 0 | n/a | 0 | n/a | 0 | n/a |
| 90 to 94 | 14 | 33,738 | 0 | n/a | 0 | n/a | 0 | n/a |
| 95 to 99 | 8 | 28,789 | 0 | n/a | 0 | n/a | 0 | n/a |
| 100 to 104 | 2 | 36,253 | 0 | n/a | 0 | n/a | 0 | n/a |
| 105+ | 0 | n/a | 0 | n/a | 0 | n/a | 0 | n/a |
| All ages | 1,357 | 46,887 | 93 | 13,851 | 152 | 14,151 | 6 | 7,129 |
|
Table 89 footnotes
|
||||||||
| blank | As at 31 March 2022 | As at 31 March 2019 |
|---|---|---|
| Average age | 62.0 | 60.7 |
| Average age at retirement/termination | 47.0 | 46.7 |
| Age | Immediate annuity (includes PBDA, CPP if applicable)Table 91 footnote a |
Deferred annuity | ||||||
|---|---|---|---|---|---|---|---|---|
| SA/CFPF | RCA | SA/CFPF | RCA | |||||
| Number of pensioners | Average pension ($) | Number of pensioners | Average pension ($) | Number of pensioners | Average pension ($) | Number of pensioners | Average pension ($) | |
| 0 to 19 | 0 | n/a | 0 | n/a | 1 | 1,952 | 0 | n/a |
| 20 to 24 | 0 | n/a | 0 | n/a | 122 | 2,076 | 0 | n/a |
| 25 to 29 | 0 | n/a | 0 | n/a | 339 | 3,514 | 0 | n/a |
| 30 to 34 | 12 | 15,039 | 0 | n/a | 456 | 5,303 | 0 | n/a |
| 35 to 39 | 57 | 25,707 | 0 | n/a | 520 | 6,423 | 0 | n/a |
| 40 to 44 | 305 | 31,380 | 0 | n/a | 317 | 9,485 | 0 | n/a |
| 45 to 49 | 761 | 33,683 | 3 | 5,533 | 165 | 10,461 | 0 | n/a |
| 50 to 54 | 2,850 | 34,272 | 5 | 3,824 | 158 | 10,177 | 0 | n/a |
| 55 to 59 | 6,106 | 33,229 | 4 | 2,016 | 161 | 7,624 | 0 | n/a |
| 60 to 64 | 8,114 | 34,329 | 0 | n/a | 3 | 24,101 | 0 | n/a |
| 65 to 69 | 5,495 | 26,718 | 0 | n/a | 0 | n/a | 0 | n/a |
| 70 to 74 | 5,087 | 27,753 | 0 | n/a | 0 | n/a | 0 | n/a |
| 75 to 79 | 4,775 | 27,412 | 0 | n/a | 0 | n/a | 0 | n/a |
| 80 to 84 | 4,593 | 26,613 | 0 | n/a | 0 | n/a | 0 | n/a |
| 85 to 89 | 3,421 | 25,444 | 0 | n/a | 0 | n/a | 0 | n/a |
| 90 to 94 | 1,204 | 24,967 | 0 | n/a | 0 | n/a | 0 | n/a |
| 95 to 99 | 254 | 25,497 | 0 | n/a | 0 | n/a | 0 | n/a |
| 100 to 104 | 24 | 24,539 | 0 | n/a | 0 | n/a | 0 | n/a |
| 105+ | 4 | 23,469 | 0 | n/a | 0 | n/a | 0 | n/a |
| All ages | 43,062 | 29,756 | 12 | 3,649 | 2,242 | 6,621 | 0 | n/a |
|
Table 91 footnotes
|
||||||||
| blank | As at 31 March 2022 | As at 31 March 2019 |
|---|---|---|
| Average age | 69.4 | 68.3 |
| Average age at retirement/termination | 45.3 | 45.2 |
| Age | Immediate annuity (includes PBDA, CPP if applicable)Table 93 footnote a |
Deferred annuity | ||||||
|---|---|---|---|---|---|---|---|---|
| SA/CFPF | RCA | SA/CFPF | RCA | |||||
| Number of pensioners | Average pension ($) | Number of pensioners | Average pension ($) | Number of pensioners | Average pension ($) | Number of pensioners | Average pension ($) | |
| 0 to 19 | 0 | n/a | 0 | n/a | 0 | n/a | 0 | n/a |
| 20 to 24 | 0 | n/a | 0 | n/a | 13 | 3,290 | 0 | n/a |
| 25 to 29 | 1 | 14,045 | 0 | n/a | 19 | 3,560 | 0 | n/a |
| 30 to 34 | 0 | n/a | 0 | n/a | 31 | 6,925 | 0 | n/a |
| 35 to 39 | 3 | 26,528 | 0 | n/a | 55 | 7,770 | 0 | n/a |
| 40 to 44 | 20 | 28,502 | 0 | n/a | 52 | 10,239 | 0 | n/a |
| 45 to 49 | 69 | 32,010 | 0 | n/a | 33 | 12,450 | 0 | n/a |
| 50 to 54 | 325 | 31,409 | 2 | 3,092 | 40 | 10,962 | 0 | n/a |
| 55 to 59 | 820 | 28,081 | 4 | 2,100 | 57 | 6,803 | 0 | n/a |
| 60 to 64 | 1,166 | 28,195 | 0 | n/a | 0 | n/a | 0 | n/a |
| 65 to 69 | 709 | 22,308 | 0 | n/a | 0 | n/a | 0 | n/a |
| 70 to 74 | 291 | 23,586 | 0 | n/a | 0 | n/a | 0 | n/a |
| 75 to 79 | 56 | 24,619 | 0 | n/a | 0 | n/a | 0 | n/a |
| 80 to 84 | 55 | 21,268 | 0 | n/a | 0 | n/a | 0 | n/a |
| 85 to 89 | 17 | 21,387 | 0 | n/a | 0 | n/a | 0 | n/a |
| 90 to 94 | 8 | 20,337 | 0 | n/a | 0 | n/a | 0 | n/a |
| 95 to 99 | 0 | n/a | 0 | n/a | 0 | n/a | 0 | n/a |
| 100 to 104 | 0 | n/a | 0 | n/a | 0 | n/a | 0 | n/a |
| 105+ | 0 | n/a | 0 | n/a | 0 | n/a | 0 | n/a |
| All ages | 3,540 | 26,761 | 6 | 2,431 | 300 | 8,407 | 0 | n/a |
|
Table 93 footnotes
|
||||||||
| blank | As at 31 March 2022 | As at 31 March 2019 |
|---|---|---|
| Average age | 62.6 | 60.2 |
| Average age at retirement/termination | 44.1 | 43.7 |
| Age | Immediate annuity (includes PBDA, CPP if applicable)Table 95 footnote a |
Deferred annuity | ||||||
|---|---|---|---|---|---|---|---|---|
| SA/CFPF | RCA | SA/CFPF | RCA | |||||
| Number of pensioners | Average pension ($) | Number of pensioners | Average pension ($) | Number of pensioners | Average pension ($) | Number of pensioners | Average pension ($) | |
| 0 to 19 | 0 | n/a | 0 | n/a | 0 | n/a | 0 | n/a |
| 20 to 24 | 0 | n/a | 0 | n/a | 8 | 2,174 | 0 | n/a |
| 25 to 29 | 0 | n/a | 0 | n/a | 12 | 3,042 | 0 | n/a |
| 30 to 34 | 23 | 23 | 0 | n/a | 12 | 3,899 | 0 | n/a |
| 35 to 39 | 75 | 75 | 1 | 49,613 | 9 | 4,980 | 0 | n/a |
| 40 to 44 | 160 | 160 | 4 | 10,456 | 6 | 16,957 | 0 | n/a |
| 45 to 49 | 224 | 224 | 13 | 18,550 | 9 | 20,216 | 0 | n/a |
| 50 to 54 | 354 | 354 | 24 | 10,796 | 10 | 13,549 | 0 | n/a |
| 55 to 59 | 609 | 609 | 46 | 11,859 | 2 | 7,501 | 0 | n/a |
| 60 to 64 | 640 | 640 | 44 | 9,099 | 1 | 66,294 | 0 | n/a |
| 65 to 69 | 354 | 354 | 24 | 12,828 | 0 | n/a | 0 | n/a |
| 70 to 74 | 182 | 182 | 6 | 5,559 | 0 | n/a | 0 | n/a |
| 75 to 79 | 76 | 76 | 4 | 7,723 | 0 | n/a | 0 | n/a |
| 80 to 84 | 30 | 30 | 1 | 2,453 | 0 | n/a | 0 | n/a |
| 85 to 89 | 12 | 12 | 0 | n/a | 0 | n/a | 0 | n/a |
| 90 to 94 | 0 | n/a | 0 | n/a | 0 | n/a | 0 | n/a |
| 95 to 99 | 0 | n/a | 0 | n/a | 0 | n/a | 0 | n/a |
| 100 to 104 | 0 | n/a | 0 | n/a | 0 | n/a | 0 | n/a |
| 105+ | 0 | n/a | 0 | n/a | 0 | n/a | 0 | n/a |
| All ages | 2,739 | 421 | 167 | 11,450 | 69 | 9,362 | 0 | n/a |
|
Table 95 footnotes
|
||||||||
| blank | As at 31 March 2022 | As at 31 March 2019 |
|---|---|---|
| Average age | 58.8 | 57.8 |
| Average age at retirement/termination | 49.0 | 48.6 |
| Age | Immediate annuity (includes PBDA, CPP if applicable)Table 97 footnote a |
Deferred annuity | ||||||
|---|---|---|---|---|---|---|---|---|
| SA/CFPF | RCA | SA/CFPF | RCA | |||||
| Number of pensioners | Average pension ($) | Number of pensioners | Average pension ($) | Number of pensioners | Average pension ($) | Number of pensioners | Average pension ($) | |
| 0 to 19 | 0 | n/a | 0 | n/a | 0 | n/a | 0 | n/a |
| 20 to 24 | 0 | n/a | 0 | n/a | 2 | 597 | 0 | n/a |
| 25 to 29 | 2 | 17,410 | 0 | n/a | 6 | 3,489 | 0 | n/a |
| 30 to 34 | 12 | 22,856 | 0 | n/a | 3 | 4,519 | 0 | n/a |
| 35 to 39 | 34 | 27,017 | 1 | 6,307 | 10 | 6,007 | 0 | n/a |
| 40 to 44 | 101 | 34,579 | 5 | 15,011 | 5 | 3,269 | 0 | n/a |
| 45 to 49 | 118 | 42,261 | 10 | 11,492 | 0 | n/a | 0 | n/a |
| 50 to 54 | 117 | 47,272 | 7 | 9,716 | 2 | 6,819 | 0 | n/a |
| 55 to 59 | 186 | 57,610 | 26 | 19,440 | 1 | 2,944 | 0 | n/a |
| 60 to 64 | 119 | 54,445 | 19 | 6,689 | 0 | n/a | 0 | n/a |
| 65 to 69 | 70 | 43,928 | 3 | 13,341 | 0 | n/a | 0 | n/a |
| 70 to 74 | 28 | 48,324 | 2 | 19,906 | 0 | n/a | 0 | n/a |
| 75 to 79 | 8 | 32,588 | 0 | n/a | 0 | n/a | 0 | n/a |
| 80 to 84 | 0 | n/a | 0 | n/a | 0 | n/a | 0 | n/a |
| 85 to 89 | 0 | n/a | 0 | n/a | 0 | n/a | 0 | n/a |
| 90 to 94 | 0 | n/a | 0 | n/a | 0 | n/a | 0 | n/a |
| 95 to 99 | 0 | n/a | 0 | n/a | 0 | n/a | 0 | n/a |
| 100 to 104 | 0 | n/a | 0 | n/a | 0 | n/a | 0 | n/a |
| 105+ | 0 | n/a | 0 | n/a | 0 | n/a | 0 | n/a |
| All ages | 795 | 46,693 | 73 | 13,379 | 29 | 4,437 | 0 | n/a |
|
Table 97 footnotes
|
||||||||
| blank | As at 31 March 2022 | As at 31 March 2019 |
|---|---|---|
| Average age | 54.5 | 53.2 |
| Average age at retirement/termination | 46.2 | 45.8 |
| Age | Immediate annuity (includes PBDA, CPP if applicable)Table 99 footnote a |
Deferred annuity | ||||||
|---|---|---|---|---|---|---|---|---|
| SA/CFPF | RCA | SA/CFPF | RCA | |||||
| Number of pensioners | Average pension ($) | Number of pensioners | Average pension ($) | Number of pensioners | Average pension ($) | Number of pensioners | Average pension ($) | |
| 0 to 19 | 0 | n/a | 0 | n/a | 0 | n/a | 0 | n/a |
| 20 to 24 | 0 | n/a | 0 | n/a | 19 | 3,072 | 0 | n/a |
| 25 to 29 | 14 | 13,445 | 0 | n/a | 72 | 3,755 | 0 | n/a |
| 30 to 34 | 408 | 15,619 | 0 | n/a | 91 | 6,375 | 0 | n/a |
| 35 to 39 | 1,237 | 18,277 | 0 | n/a | 121 | 7,166 | 0 | n/a |
| 40 to 44 | 1,725 | 22,432 | 1 | 0 | 57 | 7,845 | 0 | n/a |
| 45 to 49 | 2,078 | 26,332 | 2 | 19 | 23 | 8,264 | 0 | n/a |
| 50 to 54 | 3,435 | 30,969 | 0 | n/a | 19 | 6,804 | 0 | n/a |
| 55 to 59 | 4,770 | 34,145 | 2 | 112 | 30 | 9,133 | 0 | n/a |
| 60 to 64 | 3,576 | 35,485 | 0 | n/a | 0 | n/a | 0 | n/a |
| 65 to 69 | 1,396 | 28,716 | 0 | n/a | 0 | n/a | 0 | n/a |
| 70 to 74 | 694 | 27,304 | 0 | n/a | 0 | n/a | 0 | n/a |
| 75 to 79 | 423 | 23,687 | 0 | n/a | 0 | n/a | 0 | n/a |
| 80 to 84 | 302 | 19,946 | 0 | n/a | 0 | n/a | 0 | n/a |
| 85 to 89 | 172 | 16,900 | 0 | n/a | 0 | n/a | 0 | n/a |
| 90 to 94 | 79 | 16,995 | 0 | n/a | 0 | n/a | 0 | n/a |
| 95 to 99 | 9 | 16,249 | 0 | n/a | 0 | n/a | 0 | n/a |
| 100 to 104 | 1 | 19,480 | 0 | n/a | 0 | n/a | 0 | n/a |
| 105+ | 0 | n/a | 0 | n/a | 0 | n/a | 0 | n/a |
| All ages | 20,319 | 29,442 | 5 | 53 | 432 | 6,520 | 0 | n/a |
|
Table 99 footnotes
|
||||||||
| blank | As at 31 March 2022 | As at 31 March 2019 |
|---|---|---|
| Average age | 55.9 | 55.2 |
| Average age at retirement/termination | 43.4 | 43.2 |
| Age | Immediate annuity (includes PBDA, CPP if applicable)Table 101 footnote a |
Deferred annuity | ||||||
|---|---|---|---|---|---|---|---|---|
| SA/CFPF | RCA | SA/CFPF | RCA | |||||
| Number of pensioners | Average pension ($) | Number of pensioners | Average pension ($) | Number of pensioners | Average pension ($) | Number of pensioners | Average pension ($) | |
| 0 to 19 | 0 | n/a | 0 | n/a | 0 | n/a | 0 | n/a |
| 20 to 24 | 0 | n/a | 0 | n/a | 6 | 2,868 | 0 | n/a |
| 25 to 29 | 0 | n/a | 0 | n/a | 15 | 3,315 | 0 | n/a |
| 30 to 34 | 56 | 14,534 | 0 | n/a | 19 | 4,539 | 0 | n/a |
| 35 to 39 | 206 | 17,050 | 0 | n/a | 37 | 5,692 | 0 | n/a |
| 40 to 44 | 389 | 20,787 | 0 | n/a | 28 | 7,290 | 0 | n/a |
| 45 to 49 | 483 | 24,141 | 0 | n/a | 20 | 7,836 | 0 | n/a |
| 50 to 54 | 856 | 28,547 | 0 | n/a | 14 | 19,843 | 0 | n/a |
| 55 to 59 | 1,097 | 29,928 | 0 | n/a | 20 | 5,873 | 0 | n/a |
| 60 to 64 | 820 | 29,439 | 0 | n/a | 1 | 17,356 | 0 | n/a |
| 65 to 69 | 280 | 24,283 | 0 | n/a | 0 | n/a | 0 | n/a |
| 70 to 74 | 53 | 21,665 | 0 | n/a | 0 | n/a | 0 | n/a |
| 75 to 79 | 5 | 25,396 | 0 | n/a | 0 | n/a | 0 | n/a |
| 80 to 84 | 1 | 27,951 | 0 | n/a | 0 | n/a | 0 | n/a |
| 85 to 89 | 1 | 19,367 | 0 | n/a | 0 | n/a | 0 | n/a |
| 90 to 94 | 1 | 7,596 | 0 | n/a | 0 | n/a | 0 | n/a |
| 95 to 99 | 0 | n/a | 0 | n/a | 0 | n/a | 0 | n/a |
| 100 to 104 | 0 | n/a | 0 | n/a | 0 | n/a | 0 | n/a |
| 105+ | 0 | n/a | 0 | n/a | 0 | n/a | 0 | n/a |
| All ages | 4,248 | 26,744 | 0 | n/a | 160 | 7,108 | 0 | n/a |
|
Table 101 footnotes
|
||||||||
| blank | As at 31 March 2022 | As at 31 March 2019 |
|---|---|---|
| Average age | 54.5 | 53.1 |
| Average age at retirement/termination | 44.4 | 43.8 |
| Age | Immediate annuity (includes PBDA, CPP if applicable)Table 103 footnote a |
Deferred annuity | ||||||
|---|---|---|---|---|---|---|---|---|
| SA/CFPF | RCA | SA/CFPF | RCA | |||||
| Number of pensioners | Average pension ($) | Number of pensioners | Average pension ($) | Number of pensioners | Average pension ($) | Number of pensioners | Average pension ($) | |
| 0 to 19 | 0 | n/a | 0 | n/a | 0 | n/a | 0 | n/a |
| 20 to 24 | 0 | n/a | 0 | n/a | 0 | n/a | 0 | n/a |
| 25 to 29 | 0 | n/a | 0 | n/a | 0 | n/a | 0 | n/a |
| 30 to 34 | 0 | n/a | 0 | n/a | 0 | n/a | 0 | n/a |
| 35 to 39 | 0 | n/a | 0 | n/a | 0 | n/a | 0 | n/a |
| 40 to 44 | 0 | n/a | 0 | n/a | 0 | n/a | 0 | n/a |
| 45 to 49 | 1 | 13,910 | 0 | n/a | 0 | n/a | 0 | n/a |
| 50 to 54 | 0 | n/a | 0 | n/a | 0 | n/a | 0 | n/a |
| 55 to 59 | 3 | 52,337 | 0 | n/a | 0 | n/a | 0 | n/a |
| 60 to 64 | 4 | 16,615 | 0 | n/a | 0 | n/a | 0 | n/a |
| 65 to 69 | 9 | 32,212 | 1 | 6,459 | 0 | n/a | 0 | n/a |
| 70 to 74 | 8 | 37,796 | 0 | n/a | 0 | n/a | 0 | n/a |
| 75 to 79 | 4 | 29,869 | 0 | n/a | 0 | n/a | 0 | n/a |
| 80 to 84 | 6 | 25,552 | 0 | n/a | 0 | n/a | 0 | n/a |
| 85 to 89 | 6 | 12,886 | 0 | n/a | 0 | n/a | 0 | n/a |
| 90 to 94 | 1 | 38,482 | 0 | n/a | 0 | n/a | 0 | n/a |
| 95 to 99 | 2 | 26,872 | 0 | n/a | 0 | n/a | 0 | n/a |
| 100 to 104 | 0 | n/a | 0 | n/a | 0 | n/a | 0 | n/a |
| 105+ | 0 | n/a | 0 | n/a | 0 | n/a | 0 | n/a |
| All ages | 44 | 28,909 | 1 | 6,459 | 0 | n/a | 0 | n/a |
|
Table 103 footnotes
|
||||||||
| blank | As at 31 March 2022 | As at 31 March 2019 |
|---|---|---|
| Average age | 74.2 | 75.3 |
| Average age at retirement/termination | 41.0 | 40.0 |
| Age | Immediate annuity (includes PBDA, CPP if applicable)Table 105 footnote a |
Deferred annuity | ||||||
|---|---|---|---|---|---|---|---|---|
| SA/CFPF | RCA | SA/CFPF | RCA | |||||
| Number of pensioners | Average pension ($) | Number of pensioners | Average pension ($) | Number of pensioners | Average pension ($) | Number of pensioners | Average pension ($) | |
| 0 to 19 | 0 | n/a | 0 | n/a | 0 | n/a | 0 | n/a |
| 20 to 24 | 0 | n/a | 0 | n/a | 0 | n/a | 0 | n/a |
| 25 to 29 | 0 | n/a | 0 | n/a | 0 | n/a | 0 | n/a |
| 30 to 34 | 0 | n/a | 0 | n/a | 0 | n/a | 0 | n/a |
| 35 to 39 | 0 | n/a | 0 | n/a | 0 | n/a | 0 | n/a |
| 40 to 44 | 0 | n/a | 0 | n/a | 0 | n/a | 0 | n/a |
| 45 to 49 | 0 | n/a | 0 | n/a | 0 | n/a | 0 | n/a |
| 50 to 54 | 1 | 8,310 | 0 | n/a | 0 | n/a | 0 | n/a |
| 55 to 59 | 0 | n/a | 0 | n/a | 0 | n/a | 0 | n/a |
| 60 to 64 | 0 | n/a | 0 | n/a | 0 | n/a | 0 | n/a |
| 65 to 69 | 3 | 20,370 | 0 | n/a | 0 | n/a | 0 | n/a |
| 70 to 74 | 5 | 29,242 | 0 | n/a | 0 | n/a | 0 | n/a |
| 75 to 79 | 3 | 24,929 | 0 | n/a | 0 | n/a | 0 | n/a |
| 80 to 84 | 0 | n/a | 0 | n/a | 0 | n/a | 0 | n/a |
| 85 to 89 | 0 | n/a | 0 | n/a | 0 | n/a | 0 | n/a |
| 90 to 94 | 1 | 14,085 | 0 | n/a | 0 | n/a | 0 | n/a |
| 95 to 99 | 0 | n/a | 0 | n/a | 0 | n/a | 0 | n/a |
| 100 to 104 | 0 | n/a | 0 | n/a | 0 | n/a | 0 | n/a |
| 105+ | 0 | n/a | 0 | n/a | 0 | n/a | 0 | n/a |
| All ages | 13 | 23,423 | 0 | n/a | 0 | n/a | 0 | n/a |
|
Table 105 footnotes
|
||||||||
| blank | As at 31 March 2022 | As at 31 March 2019 |
|---|---|---|
| Average age | 72.4 | 70.0 |
| Average age at retirement/termination | 44.8 | 43.4 |
| Age | Immediate annuity (includes PBDA, CPP if applicable)Table 107 footnote a |
Deferred annuity | ||||||
|---|---|---|---|---|---|---|---|---|
| SA/CFPF | RCA | SA/CFPF | RCA | |||||
| Number of pensioners | Average pension ($) | Number of pensioners | Average pension ($) | Number of pensioners | Average pension ($) | Number of pensioners | Average pension ($) | |
| 0 to 19 | 0 | n/a | 0 | n/a | 0 | n/a | 0 | n/a |
| 20 to 24 | 0 | n/a | 0 | n/a | 0 | n/a | 0 | n/a |
| 25 to 29 | 0 | n/a | 0 | n/a | 0 | n/a | 0 | n/a |
| 30 to 34 | 0 | n/a | 0 | n/a | 0 | n/a | 0 | n/a |
| 35 to 39 | 3 | 17,812 | 0 | n/a | 0 | n/a | 0 | n/a |
| 40 to 44 | 0 | n/a | 0 | n/a | 0 | n/a | 0 | n/a |
| 45 to 49 | 1 | 37,152 | 0 | n/a | 0 | n/a | 0 | n/a |
| 50 to 54 | 7 | 22,457 | 0 | n/a | 0 | n/a | 0 | n/a |
| 55 to 59 | 43 | 18,094 | 0 | n/a | 0 | n/a | 0 | n/a |
| 60 to 64 | 49 | 20,650 | 0 | n/a | 0 | n/a | 0 | n/a |
| 65 to 69 | 36 | 18,205 | 0 | n/a | 0 | n/a | 0 | n/a |
| 70 to 74 | 26 | 21,198 | 0 | n/a | 0 | n/a | 0 | n/a |
| 75 to 79 | 24 | 15,496 | 0 | n/a | 0 | n/a | 0 | n/a |
| 80 to 84 | 41 | 13,206 | 0 | n/a | 0 | n/a | 0 | n/a |
| 85 to 89 | 51 | 14,101 | 0 | n/a | 0 | n/a | 0 | n/a |
| 90 to 94 | 26 | 15,794 | 0 | n/a | 0 | n/a | 0 | n/a |
| 95 to 99 | 5 | 13,857 | 0 | n/a | 0 | n/a | 0 | n/a |
| 100 to 104 | 0 | n/a | 0 | n/a | 0 | n/a | 0 | n/a |
| 105+ | 0 | n/a | 0 | n/a | 0 | n/a | 0 | n/a |
| All ages | 312 | 17,169 | 0 | n/a | 0 | n/a | 0 | n/a |
|
Table 107 footnotes
|
||||||||
| blank | As at 31 March 2022 | As at 31 March 2019 |
|---|---|---|
| Average age | 73.8 | 73.1 |
| Average age at retirement/termination | 38.0 | 37.7 |
| Age | Immediate annuity (includes PBDA, CPP if applicable)Table 109 footnote a |
Deferred annuity | ||||||
|---|---|---|---|---|---|---|---|---|
| SA/CFPF | RCA | SA/CFPF | RCA | |||||
| Number of pensioners | Average pension ($) | Number of pensioners | Average pension ($) | Number of pensioners | Average pension ($) | Number of pensioners | Average pension ($) | |
| 0 to 19 | 0 | n/a | 0 | n/a | 0 | n/a | 0 | n/a |
| 20 to 24 | 0 | n/a | 0 | n/a | 0 | n/a | 0 | n/a |
| 25 to 29 | 0 | n/a | 0 | n/a | 0 | n/a | 0 | n/a |
| 30 to 34 | 0 | n/a | 0 | n/a | 0 | n/a | 0 | n/a |
| 35 to 39 | 0 | n/a | 0 | n/a | 0 | n/a | 0 | n/a |
| 40 to 44 | 0 | n/a | 0 | n/a | 0 | n/a | 0 | n/a |
| 45 to 49 | 3 | 18,352 | 0 | n/a | 0 | n/a | 0 | n/a |
| 50 to 54 | 5 | 16,400 | 0 | n/a | 0 | n/a | 0 | n/a |
| 55 to 59 | 16 | 18,711 | 0 | n/a | 0 | n/a | 0 | n/a |
| 60 to 64 | 23 | 14,148 | 0 | n/a | 0 | n/a | 0 | n/a |
| 65 to 69 | 11 | 20,476 | 0 | n/a | 0 | n/a | 0 | n/a |
| 70 to 74 | 3 | 15,129 | 0 | n/a | 0 | n/a | 0 | n/a |
| 75 to 79 | 2 | 26,404 | 0 | n/a | 0 | n/a | 0 | n/a |
| 80 to 84 | 0 | n/a | 0 | n/a | 0 | n/a | 0 | n/a |
| 85 to 89 | 0 | n/a | 0 | n/a | 0 | n/a | 0 | n/a |
| 90 to 94 | 0 | n/a | 0 | n/a | 0 | n/a | 0 | n/a |
| 95 to 99 | 0 | n/a | 0 | n/a | 0 | n/a | 0 | n/a |
| 100 to 104 | 0 | n/a | 0 | n/a | 0 | n/a | 0 | n/a |
| 105+ | 0 | n/a | 0 | n/a | 0 | n/a | 0 | n/a |
| All ages | 63 | 17,227 | 0 | n/a | 0 | n/a | 0 | n/a |
|
Table 109 footnotes
|
||||||||
| blank | As at 31 March 2022 | As at 31 March 2019 |
|---|---|---|
| Average age | 61.6 | 58.6 |
| Average age at retirement/termination | 39.9 | 38.9 |
| Age | Immediate annuity | Deferred annuity | ||
|---|---|---|---|---|
| Number of pensioners | Average pension ($) | Number of pensioners | Average pension ($) | |
| 20 to 24 | 0 | n/a | 4 | 825 |
| 25 to 29 | 0 | n/a | 76 | 669 |
| 30 to 34 | 0 | n/a | 216 | 1,012 |
| 35 to 39 | 0 | n/a | 241 | 1,168 |
| 40 to 44 | 0 | n/a | 241 | 1,359 |
| 45 to 49 | 0 | n/a | 169 | 1,663 |
| 50 to 54 | 10 | 6,595 | 195 | 2,344 |
| 55 to 59 | 63 | 12,238 | 211 | 2,441 |
| 60 to 64 | 307 | 6,592 | 0 | n/a |
| 65 to 69 | 492 | 4,292 | 0 | n/a |
| 70 to 74 | 280 | 3,758 | 0 | n/a |
| 75+ | 92 | 2,624 | 0 | n/a |
| All ages | 1,244 | 5,037 | 1,353 | 1,578 |
| blank | Immediate annuity as at 31 March 2022 | Immediate annuity as at 31 March 2019 | Deferred annuity as at 31 March 2022 | Deferred annuity as at 31 March 2019 |
|---|---|---|---|---|
| Average age | 67.4 | 65.9 | 43.6 | 42.6 |
| Average age at retirement/termination | 60.1 | 60.3 | 37.2 | 37.8 |
| Age | Immediate annuity | Deferred annuity | ||
|---|---|---|---|---|
| Number of pensioners | Average pension ($) | Number of pensioners | Average pension ($) | |
| 20 to 24 | 0 | n/a | 158 | 652 |
| 25 to 29 | 0 | n/a | 885 | 745 |
| 30 to 34 | 1 | 9,304 | 1,787 | 978 |
| 35 to 39 | 2 | 3,299 | 1,280 | 1,246 |
| 40 to 44 | 1 | 8,749 | 547 | 1,362 |
| 45 to 49 | 2 | 7,536 | 307 | 1,779 |
| 50 to 54 | 14 | 6,511 | 219 | 2,078 |
| 55 to 59 | 63 | 8,686 | 147 | 1,731 |
| 60 to 64 | 221 | 5,213 | 0 | n/a |
| 65 to 69 | 166 | 3,859 | 0 | n/a |
| 70 to 74 | 45 | 3,439 | 0 | n/a |
| 75+ | 7 | 1,960 | 0 | n/a |
| All ages | 522 | 5,056 | 5,330 | 1,146 |
| blank | Immediate annuity as at 31 March 2022 | Immediate annuity as at 31 March 2019 | Deferred annuity as at 31 March 2022 | Deferred annuity as at 31 March 2019 |
|---|---|---|---|---|
| Average age | 63.9 | 62.8 | 36.0 | 34.0 |
| Average age at retirement/termination | 57.4 | 57.9 | 29.5 | 29.2 |
| Age | Immediate annuity | Deferred annuity | ||
|---|---|---|---|---|
| Number of pensioners | Average pension ($) | Number of pensioners | Average pension ($) | |
| 20 to 24 | 0 | n/a | 1 | 1,117 |
| 25 to 29 | 0 | n/a | 54 | 692 |
| 30 to 34 | 0 | n/a | 141 | 880 |
| 35 to 39 | 0 | n/a | 182 | 1,010 |
| 40 to 44 | 0 | n/a | 133 | 997 |
| 45 to 49 | 0 | n/a | 85 | 1,298 |
| 50 to 54 | 8 | 6,728 | 88 | 2,425 |
| 55 to 59 | 18 | 5,529 | 73 | 1,036 |
| 60 to 64 | 105 | 3,891 | 0 | n/a |
| 65 to 69 | 122 | 3,704 | 0 | n/a |
| 70 to 74 | 69 | 3,520 | 0 | n/a |
| 75+ | 23 | 2,314 | 0 | n/a |
| All ages | 345 | 3,797 | 757 | 1,160 |
| blank | Immediate annuity as at 31 March 2022 | Immediate annuity as at 31 March 2019 | Deferred annuity as at 31 March 2022 | Deferred annuity as at 31 March 2019 |
|---|---|---|---|---|
| Average age | 66.7 | 65.6 | 41.5 | 40.2 |
| Average age at retirement/termination | 60.3 | 60.3 | 35.4 | 35.4 |
| Age | Immediate annuity | Deferred annuity | ||
|---|---|---|---|---|
| Number of pensioners | Average pension ($) | Number of pensioners | Average pension ($) | |
| 20 to 24 | 0 | n/a | 21 | 671 |
| 25 to 29 | 0 | n/a | 104 | 873 |
| 30 to 34 | 0 | n/a | 279 | 1,069 |
| 35 to 39 | 0 | n/a | 235 | 1,272 |
| 40 to 44 | 0 | n/a | 147 | 1,383 |
| 45 to 49 | 0 | n/a | 76 | 1,571 |
| 50 to 54 | 4 | 15,950 | 57 | 2,607 |
| 55 to 59 | 17 | 13,996 | 38 | 2,889 |
| 60 to 64 | 65 | 7,984 | 0 | n/a |
| 65 to 69 | 32 | 3,957 | 0 | n/a |
| 70 to 74 | 9 | 5,860 | 0 | n/a |
| 75+ | 0 | n/a | 0 | n/a |
| All ages | 127 | 7,875 | 957 | 1,341 |
| blank | Immediate annuity as at 31 March 2022 | Immediate annuity as at 31 March 2019 | Deferred annuity as at 31 March 2022 | Deferred annuity as at 31 March 2019 |
|---|---|---|---|---|
| Average age | 63.3 | 61.6 | 37.8 | 35.4 |
| Average age at retirement/termination | 55.7 | 56.2 | 30.6 | 30.2 |
| Age | Male officer | Female officer | ||
|---|---|---|---|---|
| Number of pensioners | Average pension ($) | Number of pensioners | Average pension ($) | |
| 30 to 34 | 2 | 677 | 0 | n/a |
| 35 to 39 | 1 | 877 | 0 | n/a |
| 40 to 44 | 3 | 2,577 | 0 | n/a |
| 45 to 49 | 0 | n/a | 0 | n/a |
| 50 to 54 | 2 | 561 | 2 | 1,337 |
| 55 to 59 | 10 | 7,390 | 5 | 566 |
| 60 to 64 | 55 | 2,565 | 22 | 1,441 |
| 65 to 69 | 46 | 1,807 | 10 | 1,078 |
| 70 to 74 | 14 | 2,247 | 5 | 1,351 |
| 75+ | 2 | 105 | 0 | n/a |
| All ages | 135 | 2,525 | 44 | 1,244 |
| blank | Male officer as at 31 March 2022 | Male officer as at 31 March 2019 | Female officer as at 31 March 2022 | Female officer as at 31 March 2019 |
|---|---|---|---|---|
| Average age | 63.8 | 57.3 | 63.8 | 54.0 |
| Average age at retirement/termination | 56.6 | 52.1 | 56.8 | 50.1 |
| Age | Male other rank | Female other rank | ||
|---|---|---|---|---|
| Number of pensioners | Average pension ($) | Number of pensioners | Average pension ($) | |
| 20 to 24 | 1 | 686 | 0 | n/a |
| 25 to 29 | 4 | 1,025 | 2 | 1,427 |
| 30 to 34 | 18 | 1,215 | 10 | 1,248 |
| 35 to 39 | 21 | 1,814 | 3 | 1,300 |
| 40 to 44 | 23 | 1,729 | 8 | 2,053 |
| 45 to 49 | 13 | 1,946 | 1 | 604 |
| 50 to 54 | 15 | 3,579 | 4 | 6,177 |
| 55 to 59 | 18 | 3,708 | 7 | 5,396 |
| 60 to 64 | 51 | 2,661 | 10 | 3,127 |
| 65 to 69 | 19 | 2,087 | 5 | 5,780 |
| 70 to 74 | 2 | 1,019 | 1 | 10,109 |
| 75+ | 1 | 732 | 0 | n/a |
| All ages | 186 | 2,303 | 51 | 3,314 |
| blank | Male other rank as at 31 March 2022 | Male other rank as at 31 March 2019 | Female other rank as at 31 March 2022 | Female other rank as at 31 March 2019 |
|---|---|---|---|---|
| Average age | 51.6 | 46.2 | 49.5 | 51.4 |
| Average age at retirement/termination | 44.8 | 41.4 | 43.1 | 45.7 |
| Age | SA/CFPF | RCA | |||
|---|---|---|---|---|---|
| Number of widow |
Number of widower |
Allowance ($) | Number | Allowance ($) | |
| 25 to 29 | 9 | 1 | 5,375 | 0 | n/a |
| 30 to 34 | 39 | 0 | 6,267 | 0 | n/a |
| 35 to 39 | 72 | 8 | 7,504 | 1 | 200 |
| 40 to 44 | 89 | 5 | 10,708 | 4 | 3,407 |
| 45 to 49 | 151 | 4 | 13,282 | 1 | 1,057 |
| 50 to 54 | 322 | 15 | 15,126 | 7 | 739 |
| 55 to 59 | 614 | 39 | 14,404 | 46 | 1,047 |
| 60 to 64 | 968 | 61 | 12,595 | 39 | 1,584 |
| 65 to 69 | 1,328 | 48 | 16,694 | 151 | 332 |
| 70 to 74 | 2,101 | 31 | 17,277 | 122 | 259 |
| 75 to 79 | 3,155 | 38 | 17,229 | 35 | 186 |
| 80 to 84 | 4,114 | 39 | 16,339 | 9 | 59 |
| 85 to 89 | 4,044 | 47 | 15,661 | 1 | 24 |
| 90 to 94 | 2,479 | 32 | 15,827 | 1 | 9,854 |
| 95 to 99 | 997 | 16 | 15,586 | 0 | n/a |
| 100 to 104 | 176 | 0 | 15,843 | 0 | n/a |
| 105+ | 7 | 0 | 11,705 | 0 | n/a |
| All ages | 20,665 | 384 | 15,990 | 417 | 548 |
| blank | As at 31 March 2022 | As at 31 March 2019 |
|---|---|---|
| Widower average age | 72.4 | 74.3 |
| Widow average age | 80.0 | 79.5 |
| Widower average age at death of member | 60.4 | 62.2 |
| Widow average age at death of member | 65.3 | 64.7 |
| Total annual allowances payable - $ millions | 336.8 | 318.4 |
| Age | Widow | Widower | ||
|---|---|---|---|---|
| Number | Allowance ($) | Number | Allowance ($) | |
| To 29 | 0 | n/a | 0 | n/a |
| 30 to 34 | 4 | 1,147 | 1 | 802 |
| 35 to 39 | 7 | 2,998 | 1 | 1,754 |
| 40 to 44 | 5 | 2,475 | 0 | n/a |
| 45 to 49 | 12 | 2,438 | 3 | 1,033 |
| 50 to 54 | 10 | 1,424 | 2 | 821 |
| 55 to 59 | 18 | 2,412 | 2 | 405 |
| 60 to 64 | 31 | 2,587 | 6 | 1,619 |
| 65 to 69 | 19 | 1,788 | 4 | 1,444 |
| 70 to 74 | 19 | 1,073 | 3 | 4,580 |
| 75+ | 8 | 942 | 5 | 1,077 |
| All ages | 133 | 2,007 | 27 | 1,582 |
| blank | Widow as at 31 March 2022 | Widow as at 31 March 2019 | Widower as at 31 March 2022 | Widower as at 31 March 2019 |
|---|---|---|---|---|
| Average age | 60.0 | 56.7 | 63.3 | 62.6 |
| Average age at death of member | 54.5 | 52.9 | 59.2 | 58.9 |
Appendix L ― Acknowledgements
Superannuation Directorate of the Department of Public Services and Procurement Canada provided all the relevant valuation input data on active members, pensioners and survivors.
The co-operation and able assistance received from the above-mentioned data providers deserve to be acknowledged.
The following individuals assisted in the preparation of this report:
- Linda Benjauthrit, ACIA, ASA
- Simon Brien, ACIA, ASA
- Alexandre Filiatreault, FCIA, FSA
- Julie Fortier
- Shufen Lee, ACIA, ASA
- Guillaume Lépine-Mathieu, ACIA, ASA
- Kelly Moore
- Mieke Steenbakkers Lucuik
Footnotes
- Footnote 1
-
The plans refer to the Pension Plans for the Public Service of Canada, the Canadian Forces – Regular Force and Reserve Force and the Royal Canadian Mounted Police.
- Footnote 2
-
A non-permitted surplus exists when the amount by which assets exceed liabilities in the CFPF as determined by the actuarial valuation report referred to in section 56 of the CFSA or one requested by the President of Treasury Board is greater than 25 percent of the amount of liabilities as determined in that report.
- Footnote 3
-
Any reference to a given plan year throughout this report should be taken as the 12-month period ending 31 March of the given year.
- Footnote 4
-
Annual Earnings Threshold is equal to the sum of 1/12 of the Year's Maximum Pensionable Earnings over any 12-month period.
- Footnote 5
-
Any five-year period of pensionable service selected by or on behalf of the contributor, or during any period so selected consisting of consecutive periods of pensionable service totalling five years.
- Footnote 6
-
If the number of years of pensionable service is less than five, then the average is over the entire period of pensionable service.
- Footnote 7
-
Any five-year period of pensionable service selected by or on behalf of the contributor, or during any period so selected consisting of consecutive periods of pensionable service totalling five years.
- Footnote 8
-
Indexed CPP annual pensionable earnings means the average of the YMPE, as defined in the CPP, over the last five years of pensionable service, increased by indexation proportionate to that accrued in respect of the immediate annuity.
- Footnote 9
-
Years of CPP pensionable service, means the number of years of pensionable service after 1965 or after attaining age 18, whichever is later, but not exceeding 35.
- Footnote 10
-
As defined in Appendix A.3.2.2.
- Footnote 11
-
As defined in Appendix A.5.23.
- Footnote 12
-
As defined in Appendix F.3.5.
- Footnote 13
- Footnote 14
-
Or becomes entitled to a disability pension from the CPP or the QPP.
- Footnote 15
-
Note that all real rates presented in this report are actually differentials, i.e. the difference between the effective annual rate and the rate of increase in prices. This differs from the technical definition of a real rate of return, which, for example in the case of the ultimate Projected Return on the Fund assumption would be 3.9% (derived as 1.060/1.020) rather than 4.0%.
- Footnote 16
-
The unrounded assumed expenses assumption is 0.18%. The rounding has no impact on the total portfolio long term expected return.
- Footnote 17
-
See Appendix A.5.23.
- Footnote 18
-
Full-time members are defined as working at least 90% of a full-time schedule.
- Footnote 19
-
In this report ‘longevity improvement assumption’ is equivalent to the ‘mortality improvement assumption’ discussed in the 31st Actuarial Report on the Canada Pension Plan.
- Footnote 20
-
Survivor pensions are not payable if the deceased member has less than two years of pensionable service.