Regular Force Death Benefit Account as at 31 March 2022
President of the Treasury Board
Ottawa, Canada
K1A 0R6
Dear Minister:
Pursuant to Section 72 of the Canadian Forces Superannuation Act, I am pleased to submit the report on the actuarial review as at 31 March 2022 of the Regular Force Death Benefit Account established under Part II of this Act.
Yours sincerely,
Assia Billig, FCIA, FSA, PhD
Chief Actuary
Table of contents
Tables
- Table 1 - Ultimate best-estimate economic assumptions
- Table 2 - Demographic assumptions as at 31 March 2022 and as at 31 March 2019
- Table 3 - State of the Account
- Table 4 - Financial position
- Table 5 - Paid-up insurance per $5,000 of coverage for plan year 2023
- Table 6 - Single premium for paid-up insurance per $5,000 coverage at age 65
- Table 7 - Monthly cost and contribution per $1,000 of coverage for plan year 2023 (cents)
- Table 8 - Projected monthly cost
- Table 9 - Reconciliation of results
- Table 10 - Sensitivity of valuation results to variations in key assumptions
- Table 11 - Contribution per $2,000 of death benefit
- Table 12 - Legislated single premium per $5,000 of paid-up benefit
- Table 13 - Regular Force Death Benefit Account
- Table 14 - Rates of interest
- Table 15 - State of the Account at the end of plan year
- Table 16 - Income and expenditure projection
- Table 17 - Reconciliation of contributors
- Table 18 - Reconciliation of pensioners
- Table 19 - Non-elective officers
- Table 20 - Non-elective officers - Summary
- Table 21 - Non-elective other ranks
- Table 22 - Non-elective other ranks - Summary
- Table 23 - Elective disabled (3A) participants
- Table 24 - Elective disabled (3A) participants - Summary
- Table 25 - Elective retired and disabled (3B) participants
- Table 26 - Elective retired and disabled (3B) participants - Summary
- Table 27 - Elective participants entitled to a deferred annuity
- Table 28 - Summary of economic assumption
- Table 29 - Sample of assumed seniority and promotional salary increases
- Table 30 - Sample of assumed withdrawal rates of the Regular Force Plan
- Table 31 - Sample of assumed rates of retirement for members of the Regular Force Plan
- Table 32 - Sample of assumed 3B disability incidence rates (own occupation) for the Regular Force Plan
- Table 33 - Sample of assumed rates of mortality for plan year 2023 for contributors and retirement pensioners
- Table 34 - Sample of assumed rates of mortality for plan year 2023 for disability (3A) pensioners
- Table 35 - Sample of assumed rates of mortality plan year 2023 for surviving spouses
- Table 36 - Sample of assumed longevity improvement factors at initial and ultimate plan year mortality reductions
Figures
1. Highlights of the report
| blank | Regular Force Death Benefit Account |
|---|---|
| Financial position |
|
| Ratio of actuarial excess to annual benefit payments |
|
| Term insurance monthly cost and contribution per $1000 of coverage for plan year 2023 |
|
| Paid-up death benefit |
|
2. Introduction
This actuarial report on the Regular Force Death Benefit (RFDB) Account was made pursuant to Section 72 of the Canadian Forces Superannuation Act (CFSA) which states that "A valuation report on the state of the Regular Force Death Benefit Account shall be prepared … in accordance with the Public Pensions Reporting Act and as if the supplementary death benefit plan established by this Part were a pension plan established under an Act referred to in subsection 3(1) of that Act".
This actuarial valuation is as at 31 March 2022 and is in respect of the death benefits and contributions defined by Part II of the CFSA.
The previous actuarial report was made as at 31 March 2019. The date of the next periodic review is scheduled to occur no later than 31 March 2025.
2.1 Purpose of this actuarial report
The purpose of this actuarial valuation is to determine the state of the RFDB Account as well as to assist the President of the Treasury Board in making informed decisions regarding the financing of the government's death benefit obligation. This is achieved by providing a best-estimate long-term projection of the RFDB Account based on the projected contributions and interest credited to the account and projected death benefits debited from the account.
2.2 Scope of the report
Section 3 presents a general overview of the valuation basis used in preparing this actuarial report and section 4 presents the financial position of the plan as well as the cost of the term and paid up-insurances as well as sensitivity of those results to a variations in key assumptions.
Finally, section 5 provides the actuarial opinion for the current valuation.
The various appendices provide a summary of the plan provisions, a description of data, methodology and assumptions employed.
3. Valuation basis
This valuation report is based on the supplementary death benefit (SDB) plan provisions enacted by legislation, summarized in Appendix A. There have been no changes to the plan provisions since the last actuarial valuation report.
The financial data on which this valuation is based is the RFDB Account established to track contributions and benefits under the SDB plan provisions. The account data is summarized in Appendix B.
The participant data provided by Public Services and Procurement Canada (PSPC) are summarized in Appendix C.
This valuation was prepared using accepted actuarial practices in Canada, methods and assumptions which are summarized in Appendices D to F.
All actuarial assumptions used in this report are best-estimate assumptions. They are independently reasonable and appropriate in aggregate for the purposes of the valuation at the date of this report.
Actuarial assumptions used in the previous report were revised based on economic trends and demographic experience.
Death benefits are paid out of the Consolidated Revenue Fund of Canada and charged against the RFDB Account. Contributions made by participants and the government are credited to the RFDB Account. Based on the balance of the RFDB Account, interest credits are calculated in such manner and at such rates and credited at such times as the Canadian Forces Superannuation Regulations provide.
The following table presents a summary of the ultimate economic assumptions used in this report and a comparison with those used in the previous report.
| blank | 31 March 2022 | 31 March 2019 |
|---|---|---|
| Real increase in average earnings | 0.6% | 0.7% |
| Real projected yield on the Regular Force Death Benefit Account | 2.0% | 2.5% |
Table 2 presents a summary of the main demographic assumptions used in this report and those used in the previous report.
| Demographic assumptions | 31 March 2022 | 31 March 2019 |
|---|---|---|
| Promotional and seniority rate of increase | ||
| Officer | 0.5% to 10.6% | 0.5% to 9.5% |
| Other rank | 0.5% to 5.4% | 0.5% to 7.3% |
| Cohort life expectancy at age 65 | ||
| Male officer | 23.5 | 23.6 |
| Male other rank | 20.8 | 21.2 |
| Female | 24.4 | 24.6 |
| Average age at retirement | ||
| Regular Force members | 52.7 | 53.7 |
As of the date of the signing of this report, we were not aware of any subsequent events that may have a material impact on the results of this valuation.
4. Valuation results
4.1 State of Account
The following State of the Account as at 31 March 2022 was prepared using the RFDB Account balance available for benefits described in Appendix B, the data described in Appendix C, the methodology described in Appendix D and the assumptions described in Appendices E and F. The results of the previous valuation are shown for comparison purposes.
| blank | 31 March 2022 | 31 March 2019 |
|---|---|---|
| Account balance | 169.6 | 179.5 |
| Liabilities - paid-up death benefitTable 3 footnote a | 123.7 | 119.3 |
| Liabilities - IBNRTable 3 footnote b | 5.5 | 5.4 |
| Liabilities - outstanding paymentsTable 3 footnote c | 19.3 | 0.0 |
| Total liabilities | 148.5 | 124.7 |
| Actuarial excess | 21.1 | 54.8 |
|
Table 3 footnotes
|
||
4.2 Financial position
At 31 March 2022 the actuarial excess totalling $21.1 million is 0.6 times the total amount of death benefits projected for plan yearFootnote 1 2023. By comparison, the actuarial excess as at 31 March 2019 under the previous report was $54.8 million, which was 1.5 times the amount of death benefits that were projected for plan year 2020.
| blank | 31 March 2022 | 31 March 2019 |
|---|---|---|
| Actuarial excess (A) | 21.1 | 54.8 |
| Estimated benefits for next plan year (B) | 37.3 | 35.8 |
| Ratio of the actuarial excess over estimated benefits for next plan year (A/B) | 0.6 | 1.5 |
As shown in Appendix B.5 and explained in section 4.4 below, the projected contributions to the plan are less than the projected death benefits for all future plan years. This projected annual shortfall is greater than the projected annual interest credits to the RFDB Account and accordingly entails a continuously decreasing account balance and actuarial excess. The actuarial excess is therefore projected to become an actuarial shortfall during plan year 2024. The RFDB Account is therefore projected to be reducing significantly each year.
4.3 The monthly benefit cost rate
The monthly benefit cost rate is defined as the ratio of the total expected monthly term insurance payments over the total amount of expected monthly term insurance benefit coverage, where coverage is expressed per thousand dollars. In this report, term insurance benefit means the basic benefit less the 10% per year reduction applicable from age 61 and less the $5,000 paid-up death benefit applicable from age 65. The projected monthly cost for plan year 2023 is 14.2 cents. The projected monthly cost at the last valuation for the same plan year was 14.7 cents.
4.4 Legislated contribution rates
The aggregate amount of death benefit payments projected for plan year 2023 is $37.3 million, which is made up of $29.6 million in respect of the term insurance and $7.7 million in respect of the paid‑up insurance. In this report, term insurance means the basic coverage (two times salary rounded to next $250) less the 10% per year reduction applicable from age 61 and less the $5,000 paid-up insurance applicable from age 65.
4.4.1 Paid-up insurance
For plan year 2023, the estimated single premium at age 65 for each $5,000 of paid-up insured benefit and the corresponding legislated contribution rates are shown in Table 5 below.
| blank | Single premium at age 65 ($) | Legislated contribution ($) |
|---|---|---|
| Male officer | 2,577 | 310 |
| Male other rank | 2,829 | 310 |
| Female | 2,514 | 291 |
The legislated contributions are determined on the basis of the original $500 of paid-up insured benefit and were not readjusted on 5 October 1992 when Part II of the CFSA was amended to increase the paid‑up insured benefit from $500 to $5,000.
The assumed improvements in longevity cause the projected single premium for the paid‑up death benefit to decrease over time. In addition, the projected ultimate yield of 4.0% is higher than the yield of 3.2% projected for plan year 2023. This has the effect of gradually decreasing the projected single premium over the years.
The net effect of longevity improvements and increasing projected yields result in a decrease in the projected single premium at age 65 for each $5,000 of paid-up insured benefit over time.
The projected single premium for plan years 2023 and 2047 are shown in Table 6 below.
| blank | Plan year 2023 ($) | Plan year 2047 ($) |
|---|---|---|
| Male officer | 2,577 | 2,259 |
| Male other rank | 2,829 | 2,400 |
| Female | 2,514 | 2,057 |
4.4.2 Term insurance
The total amount of term insurance proceeds projected to be payable during plan year 2023 is $29.6 million. Given that the total amount of term insurance projected to be in force for plan year 2023 is $17,352 million, the benefit cost rate projected for plan year 2023 is 14.2 cents per month per $1,000 of term insurance.
Non‑elective participants and elective participants in receipt of an immediate annuity are required to contribute monthly 20 cents per $1,000 of salary or 9.96Footnote 2 cents per $1,000 of term insurance As a minimum, the government contribution credited monthly to the RFDB Account is equal to one‑twelfth of the total amount of term insurance proceeds payable during the month. Table 7 presents the monthly contribution and the cost rates for plan year 2023. It shows that contributions are 3.04 cents less than the monthly cost.
| Contribution | Total cost | ||
|---|---|---|---|
| Participant | Government | Total | |
| 9.96 | 1.20 | 11.16 | 14.20 |
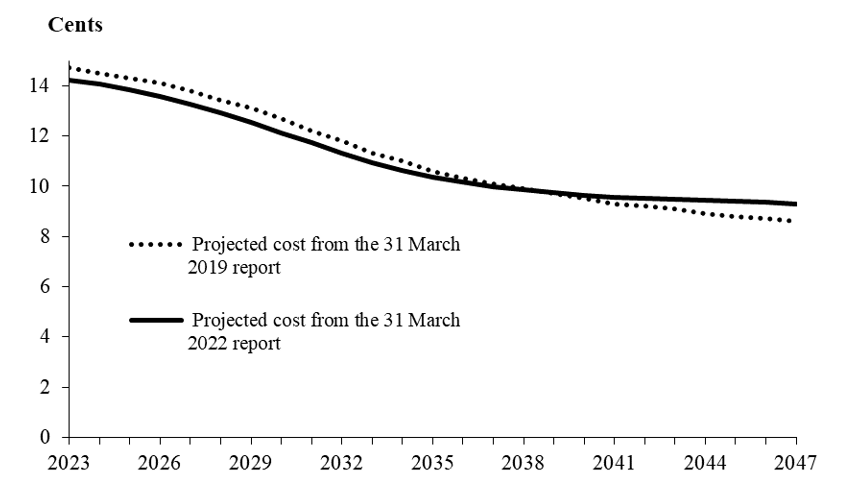
As shown in Figure 1, the monthly cost per $1,000 of term insurance is projected at 14.2 cents in plan year 2023.Thereafter the monthly cost is projected to decrease gradually to reach 9.3 cents by plan year 2047. In comparison, the combined contribution rate in 2047 is projected to be 10.74 cents (i.e. 9.96 cents for participants plus 0.78 cents for the government).
(Cents per $1,000 of term insurance)
Text description - Projected monthly cost
Line graphs comparing the projected monthly costs over time between the current and previous valuation report. Y-axis represents the monthly cost in cents per thousand dollar of term insurance. X-axis represents the plan year, starting in plan year 2023 and ending in 2047.
The projected monthly cost for plan year 2023 is 14.2 cents per thousand dollar of term insurance compared to 14.7 cents in the previous report. The projected monthly cost decreases over time. As a result, by plan year 2047 the projected monthly cost is 9.3 cents per thousand dollars of term insurance representing an increase of of 0.7 cents from the 8.6 cents projected in the previous report.
| Plan year | Projected cost from the 31 March 2019 report | Projected cost from the 31 March 2022 report |
|---|---|---|
| 2023 | 14.7 | 14.2 |
| 2024 | 14.5 | 14.0 |
| 2025 | 14.3 | 13.8 |
| 2026 | 14.1 | 13.6 |
| 2027 | 13.8 | 13.3 |
| 2028 | 13.4 | 12.9 |
| 2029 | 13.1 | 12.5 |
| 2030 | 12.7 | 12.1 |
| 2031 | 12.2 | 11.7 |
| 2032 | 11.8 | 11.3 |
| 2033 | 11.3 | 10.9 |
| 2034 | 11.0 | 10.6 |
| 2035 | 10.6 | 10.4 |
| 2036 | 10.3 | 10.1 |
| 2037 | 10.1 | 10.0 |
| 2038 | 9.9 | 9.8 |
| 2039 | 9.7 | 9.7 |
| 2040 | 9.5 | 9.6 |
| 2041 | 9.3 | 9.6 |
| 2042 | 9.2 | 9.5 |
| 2043 | 9.1 | 9.5 |
| 2044 | 8.9 | 9.4 |
| 2045 | 8.8 | 9.4 |
| 2046 | 8.7 | 9.4 |
| 2047 | 8.6 | 9.3 |
The following table illustrates the projected monthly costs per $1,000 of term insurance for selected plan years and by participant type.
| Participants | 2023 | 2026 | 2032 | 2037 | 2042 | 2047 |
|---|---|---|---|---|---|---|
| Non-elective | 6.5 | 6.2 | 5.8 | 5.5 | 5.3 | 5.1 |
| Elective | 28.9 | 28.8 | 25.4 | 22.2 | 21.0 | 20.7 |
| All | 14.2 | 13.6 | 11.3 | 10.0 | 9.5 | 9.3 |
For non‑elective and elective participants, the monthly cost projected for plan year 2047 is respectively 78% and 72% of the monthly cost estimated for plan year 2023. For all plan participants in aggregate, the monthly cost projected for plan year 2047 is 65% of the monthly cost projected for plan year 2023.
This results mainly from the following two factors:
- There is a reduction in cost due to the assumed lower mortality for plan year 2047 in accordance with the longevity improvement factors shown in Table 36 applied to the current mortality rates shown in Table 33.
- There is a reduction in cost due to higher proportion of female participants for plan year 2047 compared to plan year 2023.
- For non-elective, this is due to female participants having lower mortality rates than male.
- The proportion of female non-elective participants is higher than the proportion of female elective participants for plan year 2023. As time goes by, the proportion of female elective participants increases as the female non-elective participants become elective participants.
4.5 Reconciliation of results with the previous report
Table 9 illustrates the impact of the updated assumptions, intervaluation economic experience and population changes since the last valuation report as at 31 March 2019. The projected monthly cost for plan year 2023 fell 0.5 cents from 14.7 cents as at 31 March 2019 to 14.2 cents as at 31 March 2022.
| Element of reconciliation | Monthly cost by $1,000 of term insurance |
|---|---|
| Previous valuation as at 31 March 2019 for plan year 2023 | 14.7 |
| Change in the valuation system | (0.5) |
| Retroactive data correction | (0.1) |
| Demographic changes | 0.1 |
| Revision of economic assumptions | 0.0 |
| Revision of demographic assumptions | 0.0 |
| Valuation as at 31 March 2022 | 14.2 |
The revisions of economic and demographic assumptions have minimal impact to the monthly cost for plan year 2023.
4.6 Sensitivity of valuation results to variations in key assumptions
The following supplementary estimates indicate the degree to which the valuation results depend on some of the key assumptions. These resulting differences can also serve as a basis for approximating the effect of other numerical variations in a key assumption to the extent that such effects are indeed linear.
| blank | Actuarial liability ($ million) |
Effect | Actuarial excess to benefit payments in plan year (ratio) |
Effect |
|---|---|---|---|---|
| Valuation basis | 148.5 | n/a | 0.6 | n/a |
| Projected interest yields | ||||
| +1% | 136.3 | (12.2) | 0.9 | 0.3 |
| -1% | 162.7 | 14.2 | 0.2 | (0.4) |
| Longevity improvement | ||||
| 0% | 150.6 | 2.1 | 0.5 | (0.1) |
4.6.1 Projected interest yields
As a measure of sensitivity, an increment of one percentage point in the projected yields would change from 2024 to 2026 the plan year during which the actuarial excess is projected to become an actuarial shortfall. With such additional interest credit, the RFDB Account is projected to reduce significantly but is not expected to become exhausted over the projection period.
Similarly, a decrease of one percentage point in the projected yields would change from 2024 to 2023 the plan year during which the actuarial excess is projected to become an actuarial shortfall, and the RFDB Account is projected to become exhausted by plan year 2048.
4.6.2 Mortality
If the assumed improvements in longevity after the 2023 plan year were disregarded, then the monthly benefit cost rate of 9.3 cents projected for 2047 would climb to 11.9 cents, an increase of 27%. The RFDB Account would become exhausted by plan year 2039.
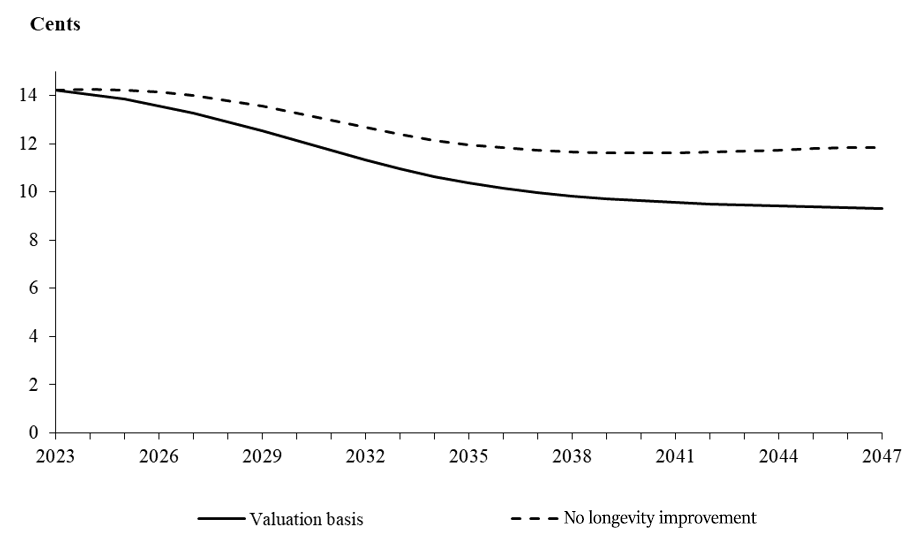
Text description - Sensitivity of projected monthly cost to variation in selected mortality assumptions
Line graphs comparing two curves of monthly cost over time. The difference in the curves show the impact of disregarding longevity improvement assumptions on the monthly cost. Y-axis represents the monthly cost in cents per thousand dollars of term insurance. X-axis represents the plan year, starting in 2023 and ending in 2047.
The dotted line shows the increase in the monthly cost when longevity improvement is disregarded. If there was no improvement in the longevity, by plan year 2047, the projected monthly cost would be 11.9 cents per thousand dollars of term insurance compared to 9.3 in the current valuation.
| Plan year | Valuation basis | No longevity improvement |
|---|---|---|
| 2023 | 14.2 | 14.2 |
| 2024 | 14.0 | 14.2 |
| 2025 | 13.8 | 14.2 |
| 2026 | 13.6 | 14.1 |
| 2027 | 13.3 | 14.0 |
| 2028 | 12.9 | 13.8 |
| 2029 | 12.5 | 13.5 |
| 2030 | 12.1 | 13.3 |
| 2031 | 11.7 | 13.0 |
| 2032 | 11.3 | 12.7 |
| 2033 | 10.9 | 12.4 |
| 2034 | 10.6 | 12.1 |
| 2035 | 10.4 | 12.0 |
| 2036 | 10.1 | 11.8 |
| 2037 | 10.0 | 11.7 |
| 2038 | 9.8 | 11.7 |
| 2039 | 9.7 | 11.6 |
| 2040 | 9.6 | 11.6 |
| 2041 | 9.6 | 11.6 |
| 2042 | 9.5 | 11.6 |
| 2043 | 9.5 | 11.7 |
| 2044 | 9.4 | 11.7 |
| 2045 | 9.4 | 11.8 |
| 2046 | 9.4 | 11.8 |
| 2047 | 9.3 | 11.9 |
5. Actuarial opinion
In our opinion, considering that this report was prepared pursuant to the Public Pensions Reporting Act per Section 72 of the Canadian Forces Superannuation Act,
- the valuation data on which the valuation is based are sufficient and reliable for the purposes of the valuation;
- the assumptions used are individually reasonable and appropriate in aggregate for the purposes of the valuation; and
- the methods employed are appropriate for the purposes of the valuation.
This report has been prepared, and our opinion given, in accordance with accepted actuarial practice in Canada. In particular, this report was prepared in accordance with the Standards of Practice (Standard of Practice – General Standards) published by the Canadian Institute of Actuaries.
To the best of our knowledge, after discussion with the Department of National Defence, there were no events between the valuation date and the date of this report that would have a material impact on the results of this valuation.
Yann Bernard, FCIA, FSA
Senior Actuary
Assia Billig, FCIA, FSA
Chief Actuary
John Kmetic, FCIA, FSA
Senior Actuary
Ottawa, Canada
29 September 2023
Appendix A ― Summary of plan provisions
Following is a summary description of the main provisions of the Supplementary Death Benefit (SDB) plan established for the members of the Regular Force under Part II - Supplementary Death Benefits of the Canadian Forces Superannuation Act (CFSA). This plan supplements benefits payable under the pension plan by providing a lump-sum benefit upon the death of a plan participant.
The legislation shall prevail if there is a discrepancy between it and this summary.
A.1 Plan participants
A.1.1 Non-elective participants
The term non-elective participant means a member of the Regular Force, or a member of the Reserve Force who is, with the approval of the Chief of the Defence Staff, on full-time service in a position in a Regular Force establishment or as a supernumerary to a Regular Force establishment.
A.1.2 Elective participants
The term elective participant means all previously non-elective participants who have ceased to be employed in the Canadian Forces by reason of retirement or disability. A retired member entitled to an immediate annuity, 3A disability annuity (i.e. on medical grounds, being disabled and unfit to perform any duties), or 3B disability annuity (i.e. on medical grounds, being disabled and unfit to perform his own duties in his present trade or employment, and not otherwise advantageously employable under existing service policy) may opt to continue their coverage under the SDB plan. Such right is limited to members who, at the time they cease to be employed in the Canadian Forces, have completed at least five years of continuous service in the Canadian Forces or five years of membership in the SDB plan.
Elective participants entitled to a deferred annuity under the CFSA upon cessation of employment may elect to continue their coverage in the SDB plan; otherwise their membership and coverage are discontinued. This election must be made within the 13-month period running from one year before to the 30th day following cessation of employment. The basic benefit is extended for 30 days after the date of cessation whether or not a participant exercises the right of election for continuous coverage.
An elective participant who becomes a participant in the SDB plan established under Part II of the Public Service Superannuation Act (PSSA) automatically ceases to be a participant in the SDB plan established under the CFSA. Any such person, who subsequently ceases to be a participant in the SDB plan under the PSSA, without entitlement to an immediate annuity under the PSSA, is deemed thereupon to regain the status of elective participant in the SDB plan established under the CFSA.
A.2 RFDB Account balance
The plan is financed through the RFDB Account, which forms part of the Accounts of Canada. The RFDB Account is credited with all contributions made by the participants and the government, and debited with all benefit payments as they become due. The RFDB Account is also credited with interest earnings based on interest rates applying to the Superannuation Accounts.
A.3 Contributions
A.3.1 Non-elective participants, and elective participants in receipt of an immediate annuity
For non-elective participants as well as elective participants in receipt of an immediate annuity (disability or retirement) under Part I of the CFSA or the Defence Services Pension Continuation Act, the legislated contribution rate is 5 cents per month for each $250 of salary (for this purpose the salary is in practice rounded to the next lower multiple of $250 if not already equal to such a multiple). When these participants attain age 65, their contribution is reduced by 50 cents per month in recognition of the fact that $5,000 of basic benefit becomes paid-up (by the government) for the remaining lifetime of the participant.
A.3.2 Elective participants entitled to a deferred annuity
For elective participants entitled to a deferred annuity, the contribution rate is set by regulation and varies in accordance with the attained age of the participant, and the corresponding contributions become chargeable on the 30th day immediately following cessation of employment. The contribution rates for selected ages are shown in the following table:
| Age | Annual ($) | Monthly ($) |
|---|---|---|
| 25 | 9.70 | 0.82 |
| 30 | 11.42 | 0.97 |
| 35 | 13.58 | 1.15 |
| 40 | 16.29 | 1.39 |
| 45 | 19.72 | 1.67 |
| 50 | 24.11 | 2.05 |
| 55 | 29.80 | 2.53 |
| 60 | 37.65 | 3.20 |
A.3.3 Government
The government credits monthly to the RFDB Account an amount equal to one‑twelfth of the total amount of term insurance death benefits paid in the month.
When a participant, other than one entitled to a deferred annuity, reaches age 65, the government credits to the RFDB Account a single premium for the $5,000 paid‑up insured benefit in respect of which contributions are no longer required from the participant.
The legislated amount of single premium for each such $5,000 paid‑up insured benefit is shown in the following table and corresponds to one-tenth of $5,000 times the single premium rate for each dollar of death benefit, computed on the basis of the Life Tables, Canada, 1950-1952 and interest at 4% per annum.
| Age | Male ($) | Female ($) |
|---|---|---|
| 65 | 310 | 291 |
| 66 | 316 | 298 |
| 67 | 323 | 306 |
| 68 | 329 | 313 |
| 69 | 336 | 320 |
Under the statutes, if for whatever reason the RFDB Account were to become exhausted, the Government would then credit special contributions to the RFDB Account in an amount at least equal to the basic benefits then due but not paid by reason of such shortfall.
A.4 Amount of basic benefit
Subject to the applicable reductions described below, the lump-sum benefit payable upon the death of a participant is equal to twice the participant's current salary, the result being rounded to the next higher multiple of $250 if not already equal to such a multiple. For this purpose, the current salary of an elective participant is defined as the annual rate of pay at the time of cessation of employment in the Canadian Forces.
The amount of basic benefit described above is reduced by 10% per year starting at age 61 until it would normally vanish at age 70. However, the amount of basic benefit cannot at any time be reduced below the paid-up benefit value of $5,000 subject to the following exceptions:
- For those elective participants who had, upon cessation of employment prior to 5 October 1992, made an election to reduce their basic benefit to $500 and further had made a second election prior to 5 October 1993, to keep their basic benefit at $500, the paid-up benefit is $500 instead of $5,000. Such election is irrevocable. The plan administrator has advised OSFI that all members who have opted to reduce their paid‑up coverage to $500 will nonetheless be receiving a minimum death benefit of $5,000 upon death.
- For elective participants entitled to a deferred annuity, there is no coverage past age 70.
Upon ceasing to be employed in the Canadian Forces, elective participants in receipt of an immediate annuity under Part I of the CFSA or the Defence Services Pension Continuation Act may opt to reduce their amount of basic benefit to $5,000.
Appendix B ― RFDB Account balance available for benefits
B.1 Regular Force Death Benefit Account
The plan is entirely financed through the RFDB Account, which forms part of the Accounts of Canada. The Account records the transactions for the plan, meaning that no formal debt instrument has been issued to the RFDB Account by the government in recognition of the amounts therein. The RFDB Account is:
- credited with all contributions made by participants and the government;
- credited with interest earnings every three months on the basis of the actual average yield for the same period on the combined Superannuation Accounts of the Public Service, Canadian Forces and Royal Canadian Mounted Police pension plans. These accounts generate interest earnings as though net cash flows were invested quarterly in 20‑year Government of Canada bonds issued at prescribed interest rates and held to maturity; and
- debited with annual benefit payments when they become due.
Table 13 shows the reconciliation of the balance of the RFDB Account from the last valuation date to the current valuation date. Since the last valuation, the RFDB Account balance has decreased by $9.9 million. As at 31 March 2022, the Account balance is reported at $169.6 million. The net reduction in the Account balance is due to actual death benefit payments exceeding the total of contributions and interest earnings over the intervaluation period.
| blank | 2020 | 2021 | 2022 | 2020-2022 |
|---|---|---|---|---|
| Opening balance | 179.5 | 172.2 | 170.9 | 179.5 |
| Income | ||||
| Employee contributions | 19.1 | 20.0 | 20.0 | 59.1 |
| Employer contributions | ||||
| Term insurance | 2.3 | 2.0 | 2.0 | 6.3 |
| Paid-up insurance | 0.0 | 1.5 | 0.7 | 2.2 |
| Interest earnings | 6.7 | 5.9 | 5.6 | 18.2 |
| Subtotal | 28.1 | 29.4 | 28.3 | 85.8 |
| Expenditure | ||||
| Benefits claims | 35.4 | 30.7 | 29.6 | 95.7 |
| Closing balance | 172.2 | 170.9 | 169.6 | 169.6 |
B.2 Rates of interest
As per the Canadian Forces Superannuation Regulations, the following effective rates of interest on the RFDB Account by plan year were calculated using the foregoing entries.
| Plan year | Interest |
|---|---|
| 2020 | 3.88% |
| 2021 | 3.50% |
| 2022 | 3.34% |
B.3 Sources of financial data
The Account entries shown previously were taken from the Public Accounts of Canada.
B.4 Account and liabilities projection
The following table shows a projection of the RFDB Account and liabilities over 25 years commencing 1 April 2022.
| Plan year | Account | LiabilitiesTable 15 footnote b | Actuarial excess | Ratio of projected actuarial excess at the end of the plan year to annual benefit payments projected for the following plan year |
|---|---|---|---|---|
| 2022 | 169.6Table 15 footnote a | 148.5 | 21.1 | 0.6 |
| 2023 | 161.5 | 152.1 | 9.4 | 0.2 |
| 2024 | 153.0 | 155.5 | (2.5) | 0- |
| 2025 | 144.5 | 159.1 | (14.6) | 0- |
| 2026 | 135.9 | 162.9 | (27.0) | 0- |
| 2027 | 127.6 | 167.8 | (40.2) | 0- |
| 2028 | 119.5 | 172.4 | (52.9) | 0- |
| 2029 | 111.7 | 176.3 | (64.6) | 0- |
| 2030 | 104.3 | 179.2 | (74.9) | 0- |
| 2031 | 97.2 | 180.5 | (83.3) | 0- |
| 2032 | 90.6 | 180.9 | (90.3) | 0- |
| 2033 | 84.6 | 181.4 | (96.8) | 0- |
| 2034 | 79.2 | 181.4 | (102.2) | 0- |
| 2035 | 74.1 | 180.9 | (106.8) | 0- |
| 2036 | 69.4 | 180.4 | (111.0) | 0- |
| 2037 | 64.9 | 179.7 | (114.8) | 0- |
| 2038 | 60.7 | 178.4 | (117.7) | 0- |
| 2039 | 56.8 | 176.7 | (119.9) | 0- |
| 2040 | 53.0 | 175.1 | (122.1) | 0- |
| 2041 | 49.5 | 173.7 | (124.2) | 0- |
| 2042 | 46.1 | 172.7 | (126.6) | 0- |
| 2043 | 42.8 | 171.8 | (129.0) | 0- |
| 2044 | 39.5 | 171.0 | (131.5) | 0- |
| 2045 | 36.3 | 170.2 | (133.9) | 0- |
| 2046 | 33.1 | 169.3 | (136.2) | 0- |
| 2047 | 30.0 | 168.4 | (138.4) | 0- |
|
Table 15 footnotes
|
||||
B.5 Income and expenditure projection
The following table shows a projection of the income and expenditure which served as the basis of the projection of the RFDB Account over 25 years commencing with plan year 2023.
| Plan year | Contributions | Benefit payments | Interest credits | Net credits | |||||
|---|---|---|---|---|---|---|---|---|---|
| Participants | Government | Total | |||||||
| Term | Paid-up | Term | Paid-up | Total | |||||
| 2023 | 20.7 | 2.5 | 0.8 | 24.0 | 29.6 | 7.7 | 37.3 | 5.2 | (8.1) |
| 2024 | 21.2 | 2.5 | 0.8 | 24.5 | 29.8 | 7.8 | 37.6 | 4.8 | (8.3) |
| 2025 | 21.5 | 2.5 | 0.9 | 24.9 | 29.9 | 7.9 | 37.8 | 4.4 | (8.5) |
| 2026 | 21.9 | 2.5 | 0.9 | 25.3 | 29.9 | 8.0 | 37.9 | 4.0 | (8.6) |
| 2027 | 22.3 | 2.5 | 1.0 | 25.8 | 29.7 | 8.1 | 37.8 | 3.8 | (8.2) |
| 2028 | 22.7 | 2.5 | 1.0 | 26.2 | 29.5 | 8.2 | 37.7 | 3.4 | (8.1) |
| 2029 | 23.2 | 2.4 | 1.0 | 26.6 | 29.1 | 8.3 | 37.4 | 3.1 | (7.7) |
| 2030 | 23.6 | 2.4 | 0.9 | 26.9 | 28.8 | 8.4 | 37.2 | 2.9 | (7.4) |
| 2031 | 24.1 | 2.4 | 0.8 | 27.3 | 28.3 | 8.5 | 36.8 | 2.6 | (6.9) |
| 2032 | 24.6 | 2.3 | 0.7 | 27.6 | 27.9 | 8.6 | 36.5 | 2.3 | (6.6) |
| 2033 | 25.1 | 2.3 | 0.6 | 28.0 | 27.6 | 8.7 | 36.3 | 2.2 | (6.1) |
| 2034 | 25.7 | 2.3 | 0.6 | 28.6 | 27.4 | 8.8 | 36.2 | 2.1 | (5.5) |
| 2035 | 26.3 | 2.3 | 0.6 | 29.2 | 27.4 | 8.8 | 36.2 | 2.0 | (5.0) |
| 2036 | 27.0 | 2.3 | 0.5 | 29.8 | 27.5 | 8.9 | 36.4 | 1.8 | (4.8) |
| 2037 | 27.7 | 2.3 | 0.5 | 30.5 | 27.8 | 9.0 | 36.8 | 1.8 | (4.5) |
| 2038 | 28.5 | 2.3 | 0.5 | 31.3 | 28.1 | 9.1 | 37.2 | 1.7 | (4.2) |
| 2039 | 29.3 | 2.4 | 0.4 | 32.1 | 28.6 | 9.2 | 37.8 | 1.7 | (4.0) |
| 2040 | 30.1 | 2.4 | 0.4 | 32.9 | 29.1 | 9.3 | 38.4 | 1.7 | (3.8) |
| 2041 | 30.9 | 2.5 | 0.5 | 33.9 | 29.7 | 9.4 | 39.1 | 1.7 | (3.5) |
| 2042 | 31.7 | 2.5 | 0.5 | 34.7 | 30.3 | 9.5 | 39.8 | 1.6 | (3.5) |
| 2043 | 32.6 | 2.6 | 0.5 | 35.7 | 31.0 | 9.6 | 40.6 | 1.6 | (3.3) |
| 2044 | 33.5 | 2.6 | 0.5 | 36.6 | 31.7 | 9.7 | 41.4 | 1.5 | (3.3) |
| 2045 | 34.4 | 2.7 | 0.5 | 37.6 | 32.4 | 9.8 | 42.2 | 1.4 | (3.2) |
| 2046 | 35.3 | 2.8 | 0.5 | 38.6 | 33.1 | 9.9 | 43.0 | 1.3 | (3.1) |
| 2047 | 36.2 | 2.8 | 0.5 | 39.5 | 33.8 | 10.1 | 43.9 | 1.2 | (3.2) |
Appendix C ― Participant data
C.1 Source of participant data
The Department of National Defence (DND) no longer provide data in respect to non-elective and elective participants of the SDB plan. Instead, data were extracted from the master computer files maintained by the Public Services and Procurement Canada (PSPC) which covers the period from 1 April 2009 to 31 March 2022.
Consistency tests were therefore performed to ensure that a status could be established for each member as of 31 March of each year and to ensure consistency between PSPC data and DND data that was used in the previous report. Consistency tests were also performed on all other information required to value member benefits. In some cases, adjustments were made to the raw data, after consulting with the PSPC, based on the omissions and discrepancies identified by the various consistency tests. More details can be found in Appendix the Actuarial Report on the Pension Plans for the Canadian Forces – Regular Force and Reserve Force as at 31 March 2022 published by the Office of the Chief Actuary.
C.2 Participant data summary
Table 17 to Table 27 show the detailed participant data upon which this valuation is based.
| blank | Male | Female | Grand total | ||||
|---|---|---|---|---|---|---|---|
| Officer | Other rank | Total | Officer | Other rank | Total | ||
| As at 31 March 2019 | 14,076 | 43,645 | 57,721 | 3,344 | 7,205 | 10,549 | 68,270 |
| Data corrections | (218) | 216 | (2) | (47) | 62 | 15 | 13 |
| New contributors | |||||||
| New entrants | 2,150 | 8,628 | 10,778 | 701 | 1,702 | 2,403 | 13,181 |
| Rehired/Cash-out | 26 | 172 | 198 | 6 | 17 | 23 | 221 |
| Rehired/Pensioners | 40 | 77 | 117 | 2 | 7 | 9 | 126 |
| Subtotal | 2,216 | 8,877 | 11,093 | 709 | 1,726 | 2,435 | 13,528 |
| Changes of | |||||||
| Officers/other ranks | 667 | (667) | Not applicable- | 139 | (139) | Not applicable- | Not applicable- |
| Subtotal | 667 | (667) | Not applicable- | 139 | (139) | Not applicable- | Not applicable- |
| Terminations | |||||||
| Return of contribution | (112) | (767) | (879) | (54) | (144) | (198) | (1,077) |
| Transfer value | (236) | (1,609) | (1,845) | (46) | (213) | (259) | (2,104) |
| Pending | (199) | (1,203) | (1,402) | (48) | (163) | (211) | (1,613) |
| Transfer from reserve force | 52 | 407 | 459 | 26 | 105 | 131 | 590 |
| To non-participants | (536) | (2,069) | (2,605) | (113) | (399) | (512) | (3,117) |
| Subtotal | (1,031) | (5,241) | (6,272) | (235) | (814) | (1,049) | (7,321) |
| Pensionable terminations | |||||||
| Disability (3A) | (1) | (4) | (5) | (1) | (2) | (3) | (8) |
| Disability (3B) | (526) | (3,265) | (3,791) | (194) | (804) | (998) | (4,789) |
| Other retirement | (1,222) | (2,215) | (3,437) | (168) | (217) | (385) | (3,822) |
| Deceased | (18) | (97) | (115) | (6) | (12) | (18) | (133) |
| Subtotal | (1,767) | (5,581) | (7,348) | (369) | (1,035) | (1,404) | (8,752) |
| As at 31 March 2022 | 13,943 | 41,249 | 55,192 | 3,541 | 7,005 | 10,546 | 65,738 |
| blank | Male | Female | Grand total | ||||
|---|---|---|---|---|---|---|---|
| Officer | Other rank | Total | Officer | Other rank | Total | ||
| Retirement pensioners | |||||||
| As at 31 March 2019 | 13,942 | 39,456 | 53,398 | 968 | 2,782 | 3,750 | 57,148 |
| Data corrections | 31 | (230) | (199) | (10) | (25) | (35) | (234) |
| New pensioners | 992 | 1,529 | 2,521 | 126 | 127 | 253 | 2,774 |
| Rehired/Pensioners | (37) | (33) | (70) | (4) | (2) | (6) | (76) |
| Deceased | (962) | (3,303) | (4,265) | (27) | (45) | (72) | (4,337) |
| To non-participants | (344) | (766) | (1,110) | (41) | (69) | (110) | (1,220) |
| As at 31 March 2022 | 13,622 | 36,653 | 50,275 | 1,012 | 2,768 | 3,780 | 54,055 |
| Disability pensioners (3A) | |||||||
| As at 31 March 2019 | 39 | 343 | 382 | 13 | 55 | 68 | 450 |
| Data corrections | 4 | (9) | (5) | Not applicable- | 4 | 4 | (1) |
| New pensioners | 2 | 5 | 7 | 1 | 1 | 2 | 9 |
| Rehired/Pensioners | Not applicable- | Not applicable- | Not applicable- | Not applicable- | Not applicable- | Not applicable- | Not applicable- |
| Deceased | (7) | (60) | (67) | (1) | (1) | (2) | (69) |
| To non-participants | Not applicable- | Not applicable- | Not applicable- | Not applicable- | Not applicable- | Not applicable- | Not applicable- |
| As at 31 March 2022 | 38 | 279 | 317 | 13 | 59 | 72 | 389 |
| Disability pensioners (3B) | |||||||
| As at 31 March 2019 | 1,770 | 15,270 | 17,040 | 453 | 2,750 | 3,203 | 20,243 |
| Data corrections | 17 | 119 | 136 | 1 | 31 | 32 | 168 |
| New pensioners | 488 | 3,207 | 3,695 | 180 | 739 | 919 | 4,614 |
| Rehired/Pensioners | Not applicable- | Not applicable- | Not applicable- | Not applicable- | Not applicable- | Not applicable- | Not applicable- |
| Deceased | (41) | (449) | (490) | (4) | (32) | (36) | (526) |
| To non-participants | (84) | (405) | (489) | (22) | (89) | (111) | (600) |
| As at 31 March 2022 | 2,150 | 17,742 | 19,892 | 608 | 3,399 | 4,007 | 23,899 |
| AgeTable 19 footnote a | Number | Basic benefit ($ thousands) | ||||
|---|---|---|---|---|---|---|
| Male | Female | Total | Male | Female | Grand total | |
| 15 to 19 | 362 | 152 | 514 | 22,227 | 9,145 | 31,373 |
| 20 to 24 | 1,409 | 375 | 1,784 | 139,560 | 36,965 | 176,525 |
| 25 to 29 | 2,015 | 541 | 2,556 | 344,275 | 95,085 | 439,360 |
| 30 to 34 | 2,375 | 670 | 3,045 | 503,374 | 143,706 | 647,080 |
| 35 to 39 | 2,308 | 662 | 2,970 | 546,471 | 158,319 | 704,791 |
| 40 to 44 | 1,975 | 520 | 2,495 | 517,156 | 133,552 | 650,708 |
| 45 to 49 | 1,570 | 321 | 1,891 | 440,480 | 86,636 | 527,116 |
| 50 to 54 | 1,218 | 211 | 1,429 | 353,965 | 60,397 | 414,362 |
| 55 to 59 | 642 | 87 | 729 | 186,416 | 26,995 | 213,411 |
| 60 to 64 | 69 | 2 | 71 | 19,534 | 594 | 20,128 |
| Total | 13,943 | 3,541 | 17,484 | 3,073,460 | 751,393 | 3,824,852 |
|
Table 19 footnotes
|
||||||
| blank | Average | Male | Female | Total |
|---|---|---|---|---|
| As at 31 March 2019 | Age | 37.3 | 35.6 | 37.0 |
| Service | 14.2 | 12.2 | 13.8 | |
| Basic benefit ($) | 189,864 | 184,642 | 188,862 | |
| As at 31 March 2022 | Age | 37.4 | 35.7 | 37.0 |
| Service | 14.1 | 12.0 | 13.7 | |
| Basic benefit ($) | 220,430 | 212,198 | 218,763 |
| AgeTable 21 footnote a | Number | Basic benefit ($ thousands) | ||||
|---|---|---|---|---|---|---|
| Male | Female | Total | Male | Female | Grand total | |
| 15 to 19 | 754 | 87 | 841 | 63,368 | 7,558 | 70,926 |
| 20 to 24 | 5,694 | 694 | 6,388 | 649,582 | 79,448 | 729,031 |
| 25 to 29 | 8,248 | 1,312 | 9,560 | 1,126,028 | 173,165 | 1,299,193 |
| 30 to 34 | 8,512 | 1,423 | 9,935 | 1,283,643 | 201,867 | 1,485,509 |
| 35 to 39 | 6,974 | 1,202 | 8,176 | 1,123,921 | 179,737 | 1,303,658 |
| 40 to 44 | 4,924 | 1,005 | 5,929 | 832,295 | 159,040 | 991,335 |
| 45 to 49 | 3,090 | 631 | 3,721 | 544,848 | 102,997 | 647,845 |
| 50 to 54 | 2,015 | 451 | 2,466 | 366,623 | 75,471 | 442,094 |
| 55 to 59 | 973 | 185 | 1,158 | 173,489 | 30,676 | 204,165 |
| 60 to 64 | 64 | 15 | 79 | 10,880 | 2,447 | 13,327 |
| 65 to 69 | 1 | 0 | 1 | 6 | 0 | 6 |
| Total | 41,249 | 7,005 | 48,254 | 6,174,684 | 1,012,405 | 7,187,089 |
|
Table 21 footnotes
|
||||||
| blank | Average | Male | Female | Total |
|---|---|---|---|---|
| As at 31 March 2019 | Age | 34.3 | 36.0 | 34.6 |
| Service | 11.2 | 10.3 | 11.1 | |
| Basic benefit ($) | 130,406 | 126,190 | 129,809 | |
| As at 31 March 2022 | Age | 34.6 | 36.0 | 34.8 |
| Service | 11.3 | 10.2 | 11.2 | |
| Basic benefit ($) | 149,693 | 144,526 | 148,943 |
| AgeTable 23 footnote a | Number | Term and paid-up insurance ($ thousands) | ||||
|---|---|---|---|---|---|---|
| Male | Female | Total | Male | Female | Grand total | |
| 35 to 39 | 2 | 0 | 2 | 280 | 0 | 280 |
| 40 to 44 | 0 | 0 | 0 | 0 | 0 | 0 |
| 45 to 49 | 2 | 2 | 4 | 302 | 287 | 589 |
| 50 to 54 | 6 | 6 | 12 | 649 | 694 | 1,342 |
| 55 to 59 | 45 | 15 | 60 | 4,659 | 1,379 | 6,038 |
| 60 to 64 | 50 | 21 | 71 | 3,376 | 1,383 | 4,759 |
| 65 to 69 | 40 | 14 | 54 | 1,200 | 305 | 1,505 |
| 70 to 74 | 32 | 8 | 40 | 160 | 40 | 200 |
| 75 to 79 | 26 | 5 | 31 | 130 | 25 | 155 |
| 80 to 84 | 41 | 0 | 41 | 205 | 0 | 205 |
| 85 to 89 | 47 | 0 | 47 | 235 | 0 | 235 |
| 90 to 94 | 21 | 1 | 22 | 105 | 5 | 110 |
| 95 to 99 | 5 | 0 | 5 | 25 | 0 | 25 |
| Total | 317 | 72 | 389 | 11,326 | 4,117 | 15,443 |
|
Table 23 footnotes
|
||||||
| blank | Average | Male | Female | Total |
|---|---|---|---|---|
| As at 31 March 2019 | Age | 72.6 | 61.0 | 70.8 |
| Term and paid-up insurance ($) | 35,534 | 65,885 | 40,120 | |
| As at 31 March 2022 | Age | 73.1 | 63.7 | 71.4 |
| Term and paid-up insurance ($) | 35,730 | 57,179 | 39,700 |
| AgeTable 25 footnote a | Number | Term and paid-up insurance ($ thousands) | ||||
|---|---|---|---|---|---|---|
| Male | Female | Total | Male | Female | Grand total | |
| 25 to 29 | 11 | 2 | 13 | 1,498 | 361 | 1,858 |
| 30 to 34 | 410 | 61 | 471 | 57,861 | 9,002 | 66,863 |
| 35 to 39 | 1,263 | 199 | 1,462 | 180,405 | 29,346 | 209,751 |
| 40 to 44 | 2,061 | 474 | 2,535 | 319,552 | 77,652 | 397,204 |
| 45 to 49 | 3,027 | 628 | 3,655 | 491,114 | 108,873 | 599,986 |
| 50 to 54 | 6,288 | 1,102 | 7,390 | 983,072 | 168,749 | 1,151,821 |
| 55 to 59 | 11,286 | 1,817 | 13,103 | 1,682,985 | 258,163 | 1,941,148 |
| 60 to 64 | 12,735 | 1,862 | 14,597 | 1,339,349 | 177,645 | 1,516,993 |
| 65 to 69 | 8,201 | 956 | 9,157 | 289,069 | 31,978 | 321,047 |
| 70 to 74 | 7,052 | 426 | 7,478 | 35,260 | 2,130 | 37,390 |
| 75 to 79 | 6,678 | 123 | 6,801 | 33,390 | 615 | 34,005 |
| 80 to 84 | 5,841 | 86 | 5,927 | 29,205 | 430 | 29,635 |
| 85 to 89 | 3,688 | 30 | 3,718 | 18,440 | 150 | 18,590 |
| 90 to 94 | 1,320 | 13 | 1,333 | 6,600 | 65 | 6,665 |
| 95 to 99 | 274 | 6 | 280 | 1,370 | 30 | 1,400 |
| 100+ | 32 | 2 | 34 | 160 | 10 | 170 |
| Total | 70,167 | 7,787 | 77,954 | 5,469,329 | 865,197 | 6,334,526 |
|
Table 25 footnotes
|
||||||
| blank | Average | Male | Female | Total |
|---|---|---|---|---|
| As at 31 March 2019 | Age | 65.2 | 57.1 | 64.4 |
| Term and paid-up insurance ($) | 76,753 | 112,151 | 79,933 | |
| As at 31 March 2022 | Age | 65.7 | 58.4 | 64.9 |
| Term and paid-up insurance ($) | 77,947 | 111,108 | 81,260 |
| Number | Term insurance benefit ($ thousands) |
|---|---|
| 3 | 221 |
|
Table 27 footnotes
|
|
Appendix D ― Methodology
D.1 RFDB Account balance
The RFDB account balance available for benefits of the plan forms part of the Accounts of Canada. The account records the transactions for the plan, meaning that no debt instrument has been issued to the RFDB Account by the government in recognition of the amounts therein. The recorded balance is shown at the book value of the underlying notional bond portfolio described in Appendix A.
The RFDB Account balance corresponds to the cumulative historical excess of contributions and interest credits over past benefit payments. The RFDB Account balance is projected to the end of a given plan year by adding to the RFDB Account balance at the beginning of that plan year the net income (i.e. the excess of contributions and interest credits over benefits) projected as described below for that plan year. Administration expenses are ignored because they are not debited from the RFDB Account.
D.2 Contributions
D.2.1 Participants
Participants' annual contributions are projected for a given plan year by multiplying
- the legislated annual contribution rate of 60 cents per $250 of salary (equivalent to the monthly rate of 5 cents per $250 of salary)
by
- the projected participants' rounded salaries for that plan year on an open-group basis, reduced by 10% per year from age 61, if applicable, (the legislation expresses the annual reduction of 10% per year on the total amount of coverage)
less
- $6.00 annually corresponding to the $5,000 paid-up coverage after age 65, if applicable (i.e. death benefit coverage of $5,000 corresponds to an annual salary of $2,500, hence an annual contribution of 60 cents per $250 of salary would produce a contribution of $6.00 annually).
Non-elective participants' salaries are projected for a given plan year using the assumed rates of increase described in Appendix F and by the assumed seniority and promotional salary increases given in Table 29. Elective participants' salaries are frozen at time of retirement or disability and are not subject to further increases.
D.2.2 Government
The government's annual contribution is projected for a given plan year as the sum of
- one-twelfth of the amount of term insurance death benefits projected to be paid during that plan year, and
- the legislated single premiums in respect of relevant participants 65 years of age.
D.3 Discount rates
The rates used to calculate the present value of benefits in respect of paid-up death benefit are the same as the yields described and shown in Appendix E.
D.4 Interest credits
Annual interest credits are projected for a given plan year as the product of the yield projected for that plan year (Appendix E) and the projected average RFDB Account balance in that plan year.
D.5 Benefit payments
The total amount of annual benefits (term and paid-up insurance) for a given plan year is projected as the sum of the participant annual benefits in force during that plan year multiplied by the mortality rates applicable to each participant during that plan year. The amount of annual benefit in force depends on the salary projected to time of death. Elective participants' salaries are frozen at time of retirement or disability and are not subject to further increases. Salaries are projected for this purpose using the assumed rates of increase in salaries and the number of participants projected on an open-group basis as described in Appendix F.
D.6 Liabilities
D.6.1 Paid-up reserve
At the end of a given plan year, the liabilities associated with the individual $5,000 paid‑up death benefit in force correspond to the amount which, together with interest at the projected yields, is sufficient to pay for each individual $5,000 paid-up death benefit projected payable on the basis of the assumed mortality rates. With the exception of elective participants entitled to a deferred annuity, this valuation assumes that the paid-up benefit of $5,000 will be paid to all elective participants when it becomes available to them.
D.6.2 IBNR
On the basis of the plan's experience, the reserve at the end of a given plan year for claims incurred but not reported (IBNR) is set equal to one-sixth of the projected annual death benefits paid on average during the six previous plan years.
D.6.3 Outstanding payments
Outstanding payments are liabilities related to death reported, but still unpaid at the end of a given plan year. They are determined by taking the difference between 95% of the expected payments and the payments already disbursed for the deaths that occurred over the period of five years preceding the valuation date. The 95% assumption was developed based on the actual percentage of payments made from prior years according to the data provided.
D.6.4 Extension of coverage
Due to the negligible financial impact of the 30-day extension of the basic benefit upon termination of coverage and to the nature of basic benefit paid on a monthly basis, no explicit liability was calculated in respect of that basic benefit provision.
Appendix E ― Economic assumptions
The following economic assumptions are required for valuation purposes:
E.1 Increases in average earnings
Average earnings are exclusive of seniority and promotional increases, which are considered under a separate demographic assumption. Except for the first three years which were provided by the Department of National Defence, the annual increase in pensionable earnings is assumed to be 0.6% higher than the corresponding increase in CPI. This corresponds to an ultimate increase in average pensionable earnings of 2.6% for plan year 2028 and thereafter (2.7% in the previous valuation for plan year 2026 and thereafter).
The resulting assumed increases in average earnings are shown in Table 28.
E.2 Projected yields on RFDB Account
These yields are required for the long‑term projection of the RFDB Account balance, liabilities and excess or shortfall. The methodology used to determine the projected yields on the Superannuation Account is described in Appendix F of the Report on the Pension Plans for the Canadian Forces- Regular Force and Reserve Force as at 31 March 2022 prepared by Office of the Chief Actuary. The projected yield on the Account is 3.2% in plan year 2023. It is projected to reach a low of 2.5% in 2032 and to reach its ultimate value of 4.0% in 2049.
| Plan year | Economic increase in earningsTable 28 footnote a of non-elective participants | Projected yield |
|---|---|---|
| 2023 | 4.8 | 3.2 |
| 2024 | 3.0 | 3.1 |
| 2025 | 2.3 | 3.0 |
| 2026 | 2.7 | 2.9 |
| 2027 | 2.7 | 2.9 |
| 2028 | 2.6 | 2.8 |
| 2029 | 2.6 | 2.7 |
| 2030 | 2.6 | 2.7 |
| 2031 | 2.6 | 2.6 |
| 2032 | 2.6 | 2.5 |
| 2033 | 2.6 | 2.6 |
| 2034 | 2.6 | 2.6 |
| 2035 | 2.6 | 2.6 |
| 2036 | 2.6 | 2.6 |
| 2037 | 2.6 | 2.7 |
| 2038 | 2.6 | 2.8 |
| 2039 | 2.6 | 2.9 |
| 2040 | 2.6 | 3.1 |
| 2041 | 2.6 | 3.3 |
| 2042 | 2.6 | 3.5 |
| 2043 | 2.6 | 3.7 |
| 2044 | 2.6 | 3.8 |
| 2045 | 2.6 | 3.8 |
| 2046 | 2.6 | 3.9 |
| 2047 | 2.6 | 3.9 |
| 2048 | 2.6 | 3.9 |
| 2049+ | 2.6 | 4.0 |
|
Table 28 footnotes
|
||
Appendix F ― Demographic and other assumptions
F.1 Demographic assumptions
Except where otherwise noted, all demographic assumptions were determined from the Canadian Forces - Regular Force plan's experience as it was done in the past. Where applicable, assumptions of the previous valuation were updated to reflect the intervaluation experience. All references to age and years of qualifying service in this section are based on rounding the exact age and years of qualifying service to the nearest integer. For detailed descriptions on each assumption, please refer to the Actuarial Report on the Pension Plans for Canadian Forces - Regular Force and Reserve Force as at 31 March 2022.
| Years of qualifying service | Officer | Other rank |
|---|---|---|
| 0 | 7.9 | 20.0 |
| 1 | 7.4 | 19.1 |
| 2 | 12.8 | 10.4 |
| 3 | 14.1 | 8.8 |
| 4 | 22.1 | 5.4 |
| 5 | 10.6 | 2.2 |
| 6 | 7.1 | 1.9 |
| 7 | 7.4 | 1.7 |
| 8 | 5.1 | 1.2 |
| 9 | 4.3 | 0.8 |
| 10 | 4.0 | 0.8 |
| 15 | 2.7 | 1.2 |
| 20 | 2.4 | 1.4 |
| 25 | 2.2 | 1.3 |
| 30 | 1.7 | 1.0 |
| 35 and above | 1.1 | 0.5 |
| Years of qualifying service | Officer | Male other rank | Female other rank |
|---|---|---|---|
| 0 | 60 | 100 | 90 |
| 1 | 40 | 50 | 40 |
| 5 | 17.5 | 38 | 22 |
| 10 | 17.5 | 27.5 | 22 |
| 12 | 17.5 | 22.5 | 14 |
| 13 to 19 | 17.5 | 20 | 14 |
| 20 to 24Table 30 footnote a | 18 | 20 | 14 |
| 25 and above | 0 | 0 | 0 |
|
Table 30 footnotes
|
|||
| Years of qualifying service | Male officer | Female officer | Male other rank | Female other rank |
|---|---|---|---|---|
| 20 | 50 | 50 | 80 | 40 |
| 21 | 50 | 75 | 50 | 40 |
| 22 | 50 | 75 | 45 | 40 |
| 23 | 50 | 75 | 43 | 45 |
| 24 | 50 | 75 | 50 | 50 |
| 25 | 100 | 100 | 75 | 55 |
| 26 | 90 | 100 | 75 | 60 |
| 27 | 85 | 100 | 75 | 65 |
| 28 | 85 | 100 | 75 | 70 |
| 29 | 85 | 100 | 75 | 75 |
| 30 | 100 | 150 | 90 | 80 |
| 34 | 250 | 150 | 150 | 150 |
| 35 | 500 | 300 | 400 | 200 |
| 36 | 250 | 200 | 200 | 150 |
| 38 and above | 150 | 150 | 150 | 150 |
| Age | Male officer | Female officer | Male other rank | Female other rank |
|---|---|---|---|---|
| 15 | 0.0 | 0.0 | 0.0 | 0.0 |
| 20 | 3.5 | 8.0 | 3.0 | 7.0 |
| 25 | 3.5 | 8.0 | 6.0 | 10.0 |
| 30 | 3.5 | 8.0 | 17.0 | 22.5 |
| 35 | 6.0 | 8.0 | 29.5 | 35.0 |
| 40 | 11.0 | 31.0 | 42.0 | 52.0 |
| 45 | 16.5 | 33.5 | 54.5 | 72.0 |
| 50 | 24.0 | 36.0 | 61.0 | 92.0 |
| 55 | 59.0 | 95.0 | 115.0 | 142.0 |
| 60 | 300.0 | 450.0 | 500.0 | 500.0 |
| Age | Male officer | Male other rank | Female |
|---|---|---|---|
| 40 | 0.5 | 0.8 | 0.4 |
| 50 | 0.7 | 2.1 | 1.1 |
| 60 | 2.0 | 5.3 | 3.2 |
| 70 | 7.6 | 17.6 | 9.4 |
| 80 | 35.0 | 46.8 | 30.4 |
| 90 | 132.1 | 150.9 | 97.3 |
| 100 | 320.8 | 340.7 | 263.4 |
| 115 | 1000.0 | 1000.0 | 1000.0 |
| Age | Male officer | Male other rank | Female |
|---|---|---|---|
| 40 | 0.9 | 8.6 | 3.6 |
| 50 | 2.4 | 11.5 | 5.8 |
| 60 | 5.9 | 17.3 | 11.0 |
| 70 | 14.6 | 35.9 | 22.7 |
| 80 | 43.7 | 76.2 | 50.3 |
| 90 | 124.5 | 160.5 | 115.4 |
| 100 | 308.0 | 312.4 | 268.9 |
| 115 | 1000.0 | 1000.0 | 1000.0 |
| Age | Male | Female |
|---|---|---|
| Before 60 | 0.0 | 0.0 |
| 60 | 8.2 | 6.1 |
| 70 | 16.9 | 14.7 |
| 80 | 54.1 | 39.2 |
| 90 | 146.0 | 111.4 |
| 100 | 360.6 | 295.7 |
| 115 | 1000.0 | 1000.0 |
| Age | Male at plan year 2024 | Male at plan year 2040 | Female at plan year 2024 | Female at plan year 2040 |
|---|---|---|---|---|
| 40 | 0.59 | 0.80 | 0.79 | 0.80 |
| 50 | 1.38 | 0.80 | 1.30 | 0.80 |
| 60 | 1.79 | 0.80 | 1.58 | 0.80 |
| 70 | 1.71 | 0.80 | 1.30 | 0.80 |
| 80 | 1.59 | 0.80 | 1.06 | 0.80 |
| 90 | 1.53 | 0.62 | 1.38 | 0.62 |
| 100 | 0.69 | 0.28 | 0.77 | 0.28 |
| 110 | 0.00 | 0.00 | 0.00 | 0.00 |
F.2 Other assumptions
F.2.1 New participants
If it were not for the rounding to the next lower multiple of $250 of salary involved in the computation of contributions and the rounding to the next higher multiple of $250 involved in the computation of the amount of death benefit, the legislated contribution rate would be 10 cents (i.e., 20 cents divided by two) instead of 9.96 cents.
F.2.2 Non-elective participants choosing to become elective participants at retirement
The proportion of new retirees choosing to continue their coverage under the SDB plan is assumed to be 80% and is derived from the plan's own recent experience.
F.2.3 Option to reduce coverage to $500
The valuation data indicates that the proportion of elective participants opting to reduce their basic benefit to $500 is negligible. Accordingly, no elective participants were assumed to make such an option.
F.2.4 Administrative expenses
In the projection of the RFDB Account, no assumption was made regarding the expenses incurred for the administration of the plan. These expenses, which are not debited from the RFDB Account, are commingled with all other government charges.
Appendix G ― Acknowledgements
The Public Services and Procurement Canada provided all relevant valuation data on plan participants.
The co-operation and able assistance received from the above-mentioned data provider deserve to be acknowledged.
The following individuals were instrumental in the preparation of this report:
Linda Benjauthrit, ACIA, ASA
Simon Brien, ACIA, ASA
Julie Fortier
Guillaume Lépine-Mathieu, ACIA, ASA
Shufen Lee, ACIA, ASA
Véronique Menard, FCIA, FSA
Kelly Moore
Footnotes
- Footnote 1
-
Any reference to a given plan year in this report should be taken as the 12-month period ending 31 March of the given year.
- Footnote 2
-
If it were not for the rounding to the next lower multiple of $250 of salary involved in the computation of contributions and the rounding to the next higher multiple of $250 involved in the computation of the amount of death benefit, the legislated contribution rate would be 10 cents (i.e., 20 cents divided by two) instead of 9.96 cents.