Domestic Stability Buffer Review - Summary Note - December 2022
Summary
- The Domestic Stability Buffer (DSB) is an adjustable buffer that is applied to Canada’s largest banks, known as Domestic Systemically Important Banks, or D-SIBs. It requires D-SIBs to build capital as vulnerabilities grow so that it can be used to absorb losses and support lending in times of stress.
- Since its introduction in June 2018, the DSB has moved within a range of 0% to 2.5% of D-SIBs’ total risk-weighted assets. After being reduced to 1.0% during the COVID-19 pandemic, it was raised to 2.5% in June 2021 in response to rising systemic vulnerabilities.
- While overall the DSB has been effective in ensuring the stability of the financial system, the risk environment has become increasingly complex since 2018. In addition, both domestic and international vulnerabilities have become more pronounced. As promised in 2021, OSFI has reviewed the design and range of the DSB to ensure it remains effective given these trends.
- As a result of this review, OSFI increased the DSB’s range to 0% – 4% on the premise that DSIBs should be able to absorb losses based on a range of severe but plausible scenarios, while maintaining lending.
- The current design will be maintained to allow the DSB to be responsive to changes in vulnerabilities while acting as a stabilizer - or shock absorber - to absorb losses.
- OSFI has enhanced transparency around the calibration of the DSB through the provision of indicators that contribute to the semi-annual decision. Moreover, supervisory judgment will continue to play a strong role in future DSB decisions.
DSB background
The Domestic Stability Buffer (DSB) is an important macroprudential tool that helps protect the Canadian financial system against vulnerabilities and risks. It applies to all D‑SIBs and takes the form of a usable buffer that is based on a percentage of D‑SIBs’ total risk-weighted assets. In June 2018, OSFI launched the DSB with a range of 0 to 2.5 percent and initially set the level at 1.5 percent. Since then, the DSB’s level has been re-examined and where necessary adjusted twice a year, in June and December, with a special announcement in March 2020 due to the onset of the COVID-19 pandemic being an exception.
The DSB was designed to cover vulnerabilities that are measurable, material, cyclical and systemic. Specific vulnerabilities addressed by the DSB since inception have included: (i) Canadian household indebtedness, e.g debt-to-income ratio (ii) Canadian asset imbalances such as house price-to-income ratios, and (iii) Canadian institutional indebtedness, i.e., the level of debt held by corporations. More recently, OSFI has included geopolitical and external vulnerabilities that potentially have greater spillover effects to the Canadian financial system.
As a result of continued growth in vulnerabilities and increasing complexity in the risk environment, OSFI announced its intention to review the DSB in December 2021 to ensure it remains relevant, appropriate and fit for purpose. This report provides a summary of key findings and decisions of this review. Going forward, OSFI intends to conduct periodic reviews of the DSB to ensure it continues to meet its objectives and contributes to the long-term effectiveness of the capital regime.
Changing vulnerabilities in an uncertain risk environment
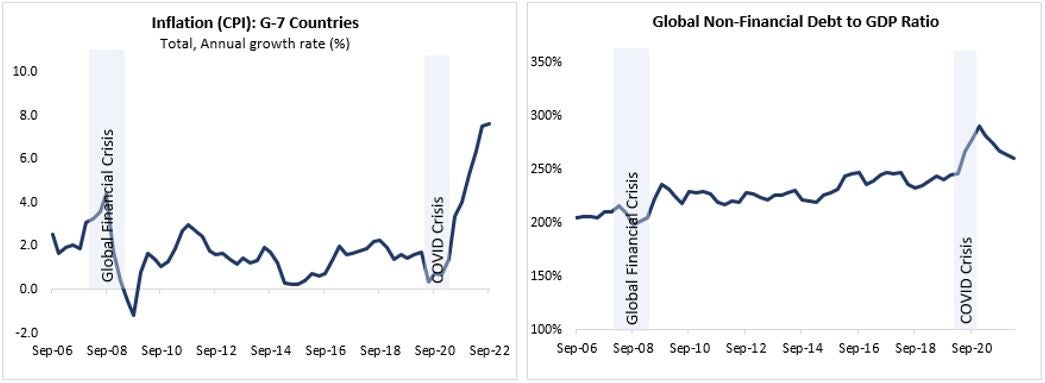
OSFI’s review of the DSB looked at the scope of risks and vulnerabilities. At inception, the DSB primarily covered domestic vulnerabilities as outlined in the previous section. More recently, as noted in OSFI’s 2022-23 Annual Risk Outlook, there has been a shift in the global risk environment given the rising cost of debt and geopolitical tensions against a backdrop of elevated systemic debt levels and inflation and monetary policy tightening. These new considerations along with an increasingly complex risk environment justify an expanded scope for the DSB to account for external systemic vulnerabilities as the fourth category of vulnerabilities covered by the DSB.
In addition, OSFI has used stress-testing – that is, modelling a variety of severe yet plausible scenarios and their possible effects on the Canadian economy and financial system – to evaluate the DSB range. Among the scenarios considered were recent stress tests and sensitivity analysis, including Bank of Canada and IMF top-down stress tests. Results of these stress tests indicate that under certain hypothetical scenarios, capital levels could fall sharply and, in the more severe scenarios, approach or pass beyond the 8% Capital Conservation Buffer threshold, indicating that a wider range for the DSB would be appropriate should vulnerabilities grow, to support lending and absorb potential credit losses in a variety of economic conditionsFootnote 1.
Another consideration is D‑SIBs’ exposure to the systemic vulnerabilities and overall asset growth over time relative to the economy. Total D‑SIB assets to GDP has risen to about 261% as of Q2 2022, up from 237% in 2018 and 186% in 2012, and have generally expanded their international operations and become more complex and exposed to global risks.
In the context of the foregoing, an increased upper limit of the DSB would help to address recent trends and potential for further growth in vulnerabilities to D‑SIBs.
- Review decision #1
- The range of the DSB has been increased to 0 - 4% to account for a potential increase in systemic vulnerabilities and uncertainty in the risk environment, while allowing D‑SIBs to maintain lending and absorb losses across a range of a severe but plausible risk events.
Flexibility to be responsive to changes in vulnerabilities
The DSB is designed to ensure the Canadian financial system remains resilient in the face of a number of possible risk events at any point in time, scaled to OSFI’s assessment of current environment. This approach is consistent with OSFI’s supervisory mandate and provides flexibility to be responsive to changes in vulnerabilities and risks.
Until this review, the DSB’s design involved semi-annual DSB level-setting announcements based on the analysis of a range of vulnerabilities and risks, as well as supervisory judgement by OSFI staff. To date, increases to the DSB level were based on OSFI’s assessment of a trend increase in vulnerabilities. In many cases, this upward trend was set against an environment where risks to DSIBs over the next six months, were seen to be low and/or stable.
Increases to the DSB (to build up capital buffers) have traditionally been accompanied by a phase-in period. This “advance notice” allows DSIBs time to acquire the requisite capital and acknowledges the benefit of predictability and stability in capital requirements, to the extent possible.
Decisions to decrease the DSB level – or, put more accurately, the release of capital preserved through the DSB – take an immediate effect and would be responsive to crises, risk events or adverse economic conditions, the COVID-19 pandemic being the sole example to date.
Such releases, whether in part or whole, are ordered when OSFI believes that risks to the DSIBs and the financial system are important enough to warrant regulatory intervention to ensure that lending to households and businesses is maintained.
In exceptional circumstances, OSFI may make and announce adjustments to the buffer in-between scheduled review dates.
- Review decision #2
- OSFI maintains the existing design of the DSB which provides flexibility to respond to changes in vulnerabilities and risks, while reaffirming the role of supervisory judgment.
Increased transparency supports public confidence in the financial system
OSFI believes that in addition to making any announced change to the DSB, such decisions should be accompanied by a supporting rationale. In the context of OSFI’s refocused mandate of strengthening public confidence in Canada’s financial system, OSFI has enhanced transparency around decisions on the range, design and level of the DSB, while still emphasizing the role that supervisory judgement plays in these decisions.
To further this goal, OSFI has shared some indicators related to vulnerabilities it monitors, as part of every DSB announcement (see Appendix). These indicators provide insight into some of the considerations that inform the calibration of the DSB but should not be taken as an exclusive or exhaustive list of factors as they may evolve as the economic and risk environment changes.
Further, it should be noted that there is no automatic or mechanical link between any indicator and changes to the DSB. These caveats aside, monitoring a set of indicators provides insight into how OSFI sees potential risks to the financial system and, consequently, how it makes adjustments to the DSB.
- Review decision #3
- OSFI has enhanced transparency around the calibration of the DSB through the provision of indicators that contribute to the semi-annual decision. This supports OSFI’s mandate to promote confidence in the Canadian financial system.
Conclusion
On balance, OSFI’s review found that the DSB has performed well as a tool for systemic stability that requires D‑SIBs to build up capital buffers during relatively stable or positive periods in the economic cycle, and ready for release as needed during volatile or negative periods. With the few adjustments identified as a result of OSFI’s 2022 fall review, the DSB’s suitability, functionality and visibility will be enhanced, thus furthering public confidence in Canada’s financial system.
Appendix
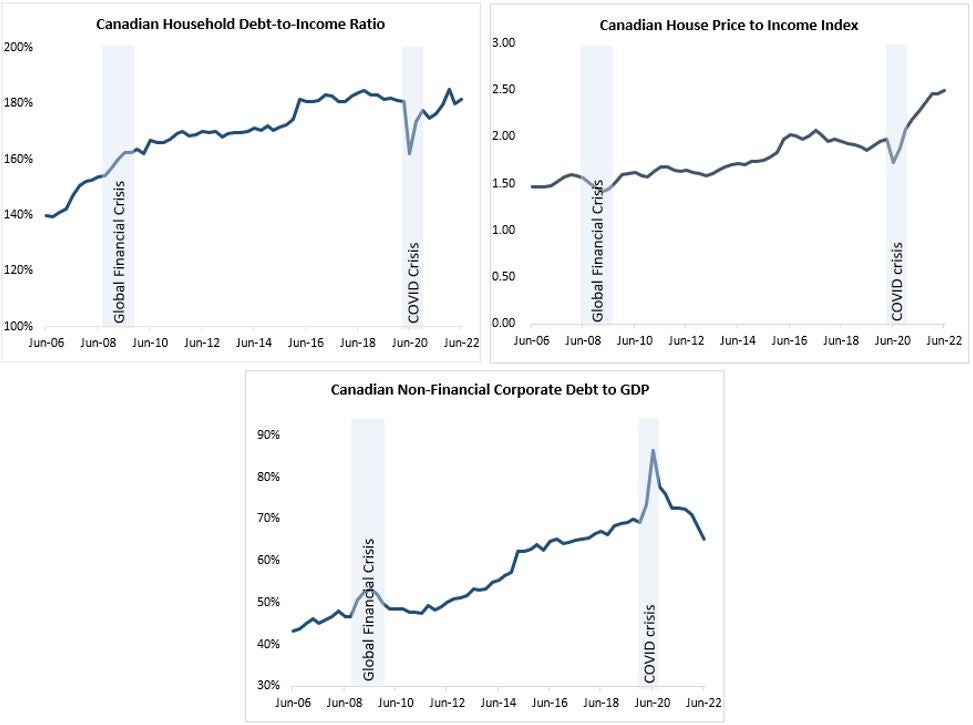
Sources: Statistics Canada; Bank of Canada; BIS
Graph description - Selected indicators related to Canadian vulnerabilities
The periods covered for the Global Financial Crisis (GFC) are from Q3-2008 until Q2-2009. For the Covid crisis, the peak of the crisis was from March to September 2020.
| Date | Debt-to income |
|---|---|
| June 2006 | 140% |
| September 2006 | 139% |
| December 2006 | 141% |
| March 2007 | 142% |
| June 2007 | 147% |
| September 2007 | 151% |
| December 2007 | 152% |
| March 2008 | 153% |
| June 2008 | 154% |
| September 2008 | 154% |
| December 2008 | 157% |
| March 2009 | 160% |
| June 2009 | 162% |
| September 2009 | 162% |
| December 2009 | 164% |
| March 2010 | 162% |
| June 2010 | 167% |
| September 2010 | 166% |
| December 2010 | 166% |
| March 2011 | 167% |
| June 2011 | 169% |
| September 2011 | 170% |
| December 2011 | 168% |
| March 2012 | 169% |
| June 2012 | 170% |
| September 2012 | 170% |
| December 2012 | 170% |
| March 2013 | 168% |
| June 2013 | 169% |
| September 2013 | 170% |
| December 2013 | 170% |
| March 2014 | 170% |
| June 2014 | 171% |
| September 2014 | 170% |
| December 2014 | 172% |
| March 2015 | 170% |
| June 2015 | 171% |
| September 2015 | 172% |
| December 2015 | 175% |
| March 2016 | 181% |
| June 2016 | 181% |
| September 2016 | 181% |
| December 2016 | 181% |
| March 2017 | 183% |
| June 2017 | 182% |
| September 2017 | 181% |
| December 2017 | 181% |
| March 2018 | 183% |
| June 2018 | 184% |
| September 2018 | 185% |
| December 2018 | 183% |
| March 2019 | 183% |
| June 2019 | 181% |
| September 2019 | 182% |
| December 2019 | 181% |
| March 2020 | 181% |
| June 2020 | 162% |
| September 2020 | 173% |
| December 2020 | 177% |
| March 2021 | 175% |
| June 2021 | 176% |
| September 2021 | 179% |
| December 2021 | 185% |
| March 2022 | 180% |
| June 2022 | 182% |
| Date | House Price to Income |
|---|---|
| June 2006 | 1.46 |
| September 2006 | 1.46 |
| December 2006 | 1.46 |
| March 2007 | 1.47 |
| June 2007 | 1.53 |
| September 2007 | 1.57 |
| December 2007 | 1.59 |
| March 2008 | 1.59 |
| June 2008 | 1.56 |
| September 2008 | 1.50 |
| December 2008 | 1.45 |
| March 2009 | 1.42 |
| June 2009 | 1.44 |
| September 2009 | 1.52 |
| December 2009 | 1.60 |
| March 2010 | 1.60 |
| June 2010 | 1.62 |
| September 2010 | 1.58 |
| December 2010 | 1.58 |
| March 2011 | 1.63 |
| June 2011 | 1.68 |
| September 2011 | 1.67 |
| December 2011 | 1.64 |
| March 2012 | 1.63 |
| June 2012 | 1.64 |
| September 2012 | 1.62 |
| December 2012 | 1.60 |
| March 2013 | 1.59 |
| June 2013 | 1.61 |
| September 2013 | 1.64 |
| December 2013 | 1.68 |
| March 2014 | 1.71 |
| June 2014 | 1.71 |
| September 2014 | 1.70 |
| December 2014 | 1.74 |
| March 2015 | 1.73 |
| June 2015 | 1.75 |
| September 2015 | 1.79 |
| December 2015 | 1.83 |
| March 2016 | 1.97 |
| June 2016 | 2.03 |
| September 2016 | 2.01 |
| December 2016 | 1.97 |
| March 2017 | 2.01 |
| June 2017 | 2.07 |
| September 2017 | 2.02 |
| December 2017 | 1.95 |
| March 2018 | 1.97 |
| June 2018 | 1.95 |
| September 2018 | 1.92 |
| December 2018 | 1.91 |
| March 2019 | 1.89 |
| June 2019 | 1.86 |
| September 2019 | 1.90 |
| December 2019 | 1.95 |
| March 2020 | 1.98 |
| June 2020 | 1.72 |
| September 2020 | 1.88 |
| December 2020 | 2.08 |
| March 2021 | 2.19 |
| June 2021 | 2.27 |
| September 2021 | 2.36 |
| December 2021 | 2.46 |
| March 2022 | 2.46 |
| June 2022 | 2.49 |
| Date | Non-Financial Corporate debt to GDP |
|---|---|
| June 2006 | 43.23% |
| September 2006 | 43.72% |
| December 2006 | 44.98% |
| March 2007 | 46.06% |
| June 2007 | 45.02% |
| September 2007 | 45.86% |
| December 2007 | 46.75% |
| March 2008 | 47.86% |
| June 2008 | 46.65% |
| September 2008 | 46.62% |
| December 2008 | 50.51% |
| March 2009 | 52.55% |
| June 2009 | 53.15% |
| September 2009 | 51.95% |
| December 2009 | 49.86% |
| March 2010 | 48.55% |
| June 2010 | 48.41% |
| September 2010 | 48.63% |
| December 2010 | 47.79% |
| March 2011 | 47.84% |
| June 2011 | 47.56% |
| September 2011 | 49.18% |
| December 2011 | 48.12% |
| March 2012 | 49.01% |
| June 2012 | 50.16% |
| September 2012 | 50.95% |
| December 2012 | 51.22% |
| March 2013 | 51.78% |
| June 2013 | 53.26% |
| September 2013 | 52.99% |
| December 2013 | 53.34% |
| March 2014 | 54.83% |
| June 2014 | 55.30% |
| September 2014 | 56.45% |
| December 2014 | 57.27% |
| March 2015 | 62.26% |
| June 2015 | 62.18% |
| September 2015 | 62.86% |
| December 2015 | 63.99% |
| March 2016 | 62.43% |
| June 2016 | 64.68% |
| September 2016 | 65.14% |
| December 2016 | 64.15% |
| March 2017 | 64.49% |
| June 2017 | 64.89% |
| September 2017 | 65.17% |
| December 2017 | 65.59% |
| March 2018 | 66.41% |
| June 2018 | 66.94% |
| September 2018 | 66.31% |
| December 2018 | 68.28% |
| March 2019 | 68.88% |
| June 2019 | 69.18% |
| September 2019 | 69.99% |
| December 2019 | 69.27% |
| March 2020 | 73.33% |
| June 2020 | 86.50% |
| September 2020 | 77.78% |
| December 2020 | 76.02% |
| March 2021 | 72.59% |
| June 2021 | 72.73% |
| September 2021 | 72.28% |
| December 2021 | 71.10% |
| March 2022 | 68.39% |
| June 2022 | 65.19% |
Sources: OECD; BIS
Graph description - Selected external and systemic macro-financial indicators
The periods covered for the Global Financial Crisis (GFC) are from Q3-2008 until Q2-2009. For the Covid crisis, the peak of the crisis was from March to September 2020.
| Date | Inflation (CPI)- G7 |
|---|---|
| September 2006 | 2.53 |
| December 2006 | 1.67 |
| March 2007 | 1.93 |
| June 2007 | 2.07 |
| September 2007 | 1.88 |
| December 2007 | 3.07 |
| March 2008 | 3.27 |
| June 2008 | 3.60 |
| September 2008 | 4.37 |
| December 2008 | 1.78 |
| March 2009 | 0.43 |
| June 2009 | -0.54 |
| September 2009 | -1.16 |
| December 2009 | 0.79 |
| March 2010 | 1.66 |
| June 2010 | 1.40 |
| September 2010 | 1.05 |
| December 2010 | 1.28 |
| March 2011 | 1.89 |
| June 2011 | 2.70 |
| September 2011 | 2.99 |
| December 2011 | 2.72 |
| March 2012 | 2.44 |
| June 2012 | 1.80 |
| September 2012 | 1.59 |
| December 2012 | 1.65 |
| March 2013 | 1.37 |
| June 2013 | 1.19 |
| September 2013 | 1.46 |
| December 2013 | 1.24 |
| March 2014 | 1.32 |
| June 2014 | 1.95 |
| September 2014 | 1.70 |
| December 2014 | 1.24 |
| March 2015 | 0.31 |
| June 2015 | 0.23 |
| September 2015 | 0.23 |
| December 2015 | 0.42 |
| March 2016 | 0.74 |
| June 2016 | 0.64 |
| September 2016 | 0.75 |
| December 2016 | 1.34 |
| March 2017 | 1.99 |
| June 2017 | 1.62 |
| September 2017 | 1.69 |
| December 2017 | 1.78 |
| March 2018 | 1.90 |
| June 2018 | 2.20 |
| September 2018 | 2.29 |
| December 2018 | 1.96 |
| March 2019 | 1.42 |
| June 2019 | 1.61 |
| September 2019 | 1.46 |
| December 2019 | 1.60 |
| March 2020 | 1.71 |
| June 2020 | 0.36 |
| September 2020 | 0.76 |
| December 2020 | 0.67 |
| March 2021 | 1.37 |
| June 2021 | 3.36 |
| September 2021 | 4.00 |
| December 2021 | 5.25 |
| March 2022 | 6.38 |
| June 2022 | 7.50 |
| September 2022 | 7.60 |
| Date | Global Non-Financial Debt to GDP |
|---|---|
| March 2006 | 202% |
| June 2006 | 206% |
| September 2006 | 205% |
| December 2006 | 206% |
| March 2007 | 206% |
| June 2007 | 205% |
| September 2007 | 210% |
| December 2007 | 211% |
| March 2008 | 216% |
| June 2008 | 209% |
| September 2008 | 198% |
| December 2008 | 202% |
| March 2009 | 205% |
| June 2009 | 223% |
| September 2009 | 236% |
| December 2009 | 232% |
| March 2010 | 224% |
| June 2010 | 218% |
| September 2010 | 229% |
| December 2010 | 228% |
| March 2011 | 229% |
| June 2011 | 228% |
| September 2011 | 219% |
| December 2011 | 217% |
| March 2012 | 220% |
| June 2012 | 220% |
| September 2012 | 228% |
| December 2012 | 227% |
| March 2013 | 224% |
| June 2013 | 222% |
| September 2013 | 226% |
| December 2013 | 226% |
| March 2014 | 229% |
| June 2014 | 231% |
| September 2014 | 222% |
| December 2014 | 220% |
| March 2015 | 219% |
| June 2015 | 226% |
| September 2015 | 229% |
| December 2015 | 232% |
| March 2016 | 243% |
| June 2016 | 246% |
| September 2016 | 247% |
| December 2016 | 236% |
| March 2017 | 240% |
| June 2017 | 245% |
| September 2017 | 247% |
| December 2017 | 247% |
| March 2018 | 247% |
| June 2018 | 236% |
| September 2018 | 233% |
| December 2018 | 235% |
| March 2019 | 240% |
| June 2019 | 243% |
| September 2019 | 241% |
| December 2019 | 245% |
| March 2020 | 246% |
| June 2020 | 267% |
| September 2020 | 278% |
| December 2020 | 291% |
| March 2021 | 281% |
| June 2021 | 275% |
| September 2021 | 267% |
| December 2021 | 264% |
| March 2022 | 261% |
| Key Vulnerabilities | Description/ Rationale |
|---|---|
| Canadian Household Indebtedness | High levels of consumer debt reduce the ability of households to withstand stress, and therefore could amplify a downturn by reduced spending. It also makes banks more exposed to defaults and losses in the event of a downturn. |
| Canadian Asset Imbalances | Sharp increases in asset prices, or elevated valuation levels, make the economy vulnerable to a rapid price unwinding which can trigger reduced spending and investment, and reduce the value of banks’ collateral. |
| Canadian Institutional Indebtedness | High levels of institutional debt reduce the ability of businesses and governments to withstand stress scenarios, and therefore is more likely to amplify the downturn with reduced spending and investment. It also makes banks more exposed to defaults and losses in the event of a downturn. |
| External Systemic Vulnerabilities | Global developments that make the Canadian economy, and DSIBs, more vulnerable to an economic downturn. This includes both potential vulnerabilities that are quantifiable as well as those vulnerabilities that are hard to measure, but if triggered, could contribute to macro-economic risk. |
| blank | Current DSB Design and Calibration Features | Updated DSB Design and Calibration Features |
|---|---|---|
| Scope/Core Vulnerabilities |
|
|
| Range |
|
|
| Level |
|
|
| Increase and Release Mechanism |
|
|
Footnotes
- Footnote 1
-
For example, see How well can large banks in Canada withstand a severe economic downturn?