Estimated solvency ratio results (November 2020)
Information
OSFI regularly estimates the solvency ratio for federally regulated pension plans with defined benefit provisions. The Estimated Solvency Ratio (ESR) results help us identify any solvency issues that could affect the security of members' promised pension benefits before a plan file their actuarial report. The ESR results also help identify broader trends.
The ESR results are calculated using the most recent actuarial, financial and membership information filed with OSFI for each plan before the analysis date. Assets are projected based on either the rate of return provided on the Solvency Information Return or an assumed rate of return for the plan. Solvency liabilities are projected using relevant commuted value and annuity proxy rates from the Canadian Institute of Actuaries. Expected contributions, benefit payments, and expenses are taken into account and an ESR, based on the estimated adjusted market value of the fund and estimated liabilities, is then calculated for each plan.
ESR results as at December 31, 2019
The results of OSFIs calculation of the ESR as at December 31, 2019 were determined in March 2020. Given the impact of the crisis on our priorities, we did not publish the InfoPensions in May 2020 as typically scheduled. Nevertheless, although outdated, we thought it still be beneficial to produce, in the November 2020 InfoPensions, the results of this exercise as shown below.
The median ESR for all 348 plans (down from 361 last year) hardly changed (0.95 as at December 31, 2019, up from 0.94 at the end of 2018). Similarly, the liability-weighted average ESR for all plans increased slightly to 1.01 as at December 31, 2019 from 0.98 at the end of 2018. The graph below shows the current and previous ESRs and median ESRs dating back to December 2010.
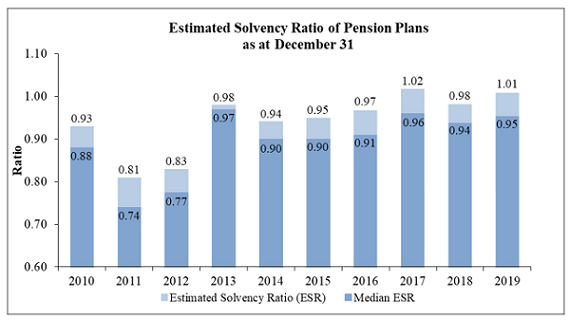
Description of chart 1
| December 31 | Median ESR |
Estimated Solvency Ratio (ESR) |
ESR in excess of Median |
3-Year Estimated Average Solvency Ratio (EASR) |
Estimated Solvency Ratio (ESR) |
Median ESR |
|---|---|---|---|---|---|---|
| 2008 | 0.82 | 0.85 | 0.03 | 0 | 0 | |
| 2009 | 0.88 | 0.90 | 0.02 | 0 | 0 | |
| 2010 | 0.88 | 0.93 | 0.05 | 0 | 0 | |
| 2011 | 0.74 | 0.81 | 0.07 | 0 | 0 | |
| 2012 | 0.77 | 0.83 | 0.06 | 0.84 | 0 | 0 |
| 2013 | 0.97 | 0.98 | 0.01 | 0.89 | 0 | 0 |
| 2014 | 0.90 | 0.94 | 0.04 | 0.93 | 0 | 0 |
| 2015 | 0.90 | 0.95 | 0.05 | 0.96 | 0 | 0 |
| 2016 | 0.91 | 0.97 | 0.06 | 0.96 | 0 | 0 |
| 2017 | 0.96 | 1.02 | 0.06 | 0.97 | 0 | 0 |
| 2018 | 0.94 | 0.98 | 0.04 | 0.98 | 0 | 0 |
| 2019 | 0.95 | 1.01 | 0.05 | 1.00 | 0 | 0 |
The most recent ESR results shows a reduction in the percentage of plans that were underfunded (66% in 2019 versus 74% in 2018) while the number of plans that were significantly underfunded (ESRs below 0.80) did not change markedly (15% in 2019 versus 16% in 2018). The bar graph below illustrates the distribution of the ESR results as at December 31 of each year since 2010. It shows the percentage of plans with ESRs below 0.80, between 0.80 and 0.90, between 0.90 and 1.00, and over 1.00 in each year.
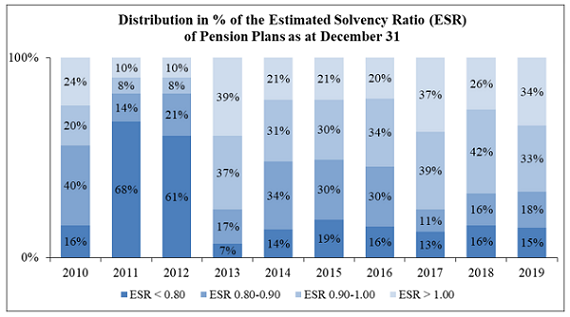
Description of chart 2
Distribution in % of the Estimated Solvency Ratio (ESR) of Pension Plans as at December 31
| 2008 | 2009 | 2010 | 2011 | 2012 | 2013 | 2014 | 2015 | 2016 | 2017 | 2018 | 2019 | |
|---|---|---|---|---|---|---|---|---|---|---|---|---|
| ESR < 0.80 | 43% | 15% | 16% | 68% | 61% | 7% | 14% | 19% | 16% | 13% | 16% | 15% |
| ESR 0.80-0.90 | 26% | 38% | 40% | 14% | 21% | 17% | 34% | 30% | 30% | 11% | 16% | 18% |
| ESR 0.90-1.00 | 14% | 23% | 20% | 8% | 8% | 37% | 31% | 30% | 34% | 39% | 42% | 33% |
| ESR > 1.00 | 17% | 24% | 24% | 10% | 10% | 39% | 21% | 21% | 20% | 37% | 26% | 34% |
| Average ESR | 85% | 90% | 93% | 81% | 83% | 98% | 94% | 95% | 97% | 102% | 98% | 101% |
Impact on ESR since December 31, 2019
In the first quarter of 2020, the COVID-19 pandemic disrupted life around the world. Defined benefit plans felt an impact to both plan assets and liabilities, as the equity market decline reduced asset values and the continued drop in bond yields increased liabilities. Market volatility had a significant effect on the ESR, which reached a low of 0.89 as at March 31, 2020. At the time of writing, equity markets have for the large part recovered, and the ESR has subsequently improved, but has not reached the level it was at on December 31, 2019. Volatility remains elevated and continues to have a significant effect on the solvency ratio of pension plans, which will not crystalize until the end of the year. For the majority of federally regulated defined benefit pension plans (i.e. those that have a December 31 or January 1 year-end), funding requirements will only be impacted in 2021.