Presentation to the Board of Directors of PSP Investments - Actuarial Valuations
Agenda (Slide 2)
Traditional defined benefit pension plans legislative framework
- Private vs federal public sectors
- Funding vs accounting
Update on the most recently filed statutory actuarial valuation
- Pension Plans for the Canadian Forces Regular Force and Reserve Force as at 31 March 2019
Traditional Defined Benefit Pension Plans – Legislative Framework (Slide 3)
Private Sector Pension PlansFootnote 1
- Provincial and federal pension legislations set minimum standards in terms of benefits and funding requirements.
- Going Concern and Solvency valuations
- Income Tax Act (ITA) sets maximum standards in terms of benefits and allowed funding.
- Maximum benefit payable
- Maximum contributions
- Non-permitted surplus to limit tax deferral
Federal Public Sector Pension Plans
- Public sector pension plans are subject to their respective Act
- The Acts
- Define benefits payable
- Reflect ITA limits
- Set funding requirements
- The timing of actuarial valuations is prescribed in the Public Pensions Reporting Act
Purpose of Going-Concern and Solvency Actuarial Valuations is to Determine Funding Requirements (Slide 4)
Going Concern
- Typically performed every three years
- Determine contributions
- Employer special payments if deficit
- Contribution holiday if nonpermitted surplus
- Determination of current service cost contributions
Solvency
- Typically performed every three years
- Determine contributions
- Employer special payments (accelerated funding) required if assets are insufficient should the plan be terminated
- There is no solvency requirement for Public Sector Pension Plans
Accounting
- Performed every year
- Used for financial reporting
- Expense in income statement
- Debt in balance sheet
Going-Concern Actuarial Valuation Assumes the Plan will Continue to Operate Indefinitely (Slide 5)
- Assumptions are determined by the actuary
- Can include margins as per funding objectives
- Implicit (included in assumptions)
- Explicit (Provision for Adverse Deviation)
- The discount rate is typically the expected return on plan assets
- Smoothing of assets permitted
- As per the Standards of Practice of the Canadian Institute of Actuaries (CIA), actuary must certify that assumptions are appropriate for the purposes of the valuation
Solvency Valuation Assumes an Immediate Termination of the Plan and Liquidation of Assets (Slide 6)
- Assumptions and methodology are prescribed by the legislator
- Discount rates
- Mortality
- Usually refers to the Canadian Institute of Actuaries (CIA) standards
- The prescribed discount rates determination methods are based on “marked to market”
- Mortality tables are developed by the CIA
Accounting Standards Provide Guidance for Accounting Valuations (Slide 7)
- Assuming the plan will continue to operate indefinitely
- Assumptions are management’s best estimate with no margins
- The discount rate determination method is prescribed by the accounting standards
- Public sector accounting standards (PS 3250) are different than the mark to market private sector accounting standards (IFRS)
Accounting Standards Provide Guidance for Accounting Valuations (Slide 8)
Going Concern
- As per funding policy, assumptions are Chief Actuary’s best estimate with no margins
- Discount rate:
- Pre April 2000 : Based on Government of Canada expected long-term bond yields
- Post March 2000 : Expected return on plan assets
- Actuarial assumptions are reviewed at each actuarial valuation
- As per the Standards of Practice of the CIA, Chief Actuary must certify that assumptions are appropriate for the purposes of the valuation
Accounting
- Assumptions are government’s best estimate with no margins
- Discount rate:
- Pre April 2000 : Based on Government of Canada
- zero-coupon bond yields at valuation date
- Post March 2000 : Expected return on plan assets
Actuarial Report - Pension Plans for the Canadian Forces Regular Force and Reserve Force as at 31 March 2019
Best-Estimate Economic Assumptions (Slide 10)
All economic assumptions are select and ultimateFootnote 2
| 31 March 2019 | 31 March 2016 | ||
|---|---|---|---|
| Assumed level of inflation | 2.00% | 2.00% | |
| Real increase in pensionable earnings | 0.70% | 0.80% | |
| Real increase in YMPE and MPETable 1 Footnote * | 1.00% | 1.10% | |
| Real rate of return on the Pension Fund | 4.00% | 4.00% | |
| Real rate of return on the Superannuation Account and RCA Account |
2.50% | 2.70% | |
Table 1 Footnotes
|
|||
Financial Positions of the Canadian Forces Pension Plans (Slide 11)
| Regular Force | Reserve Force | |||
|---|---|---|---|---|
| 31 March 2019 | 31 March 2016 | 31 March 2019 | 31 March 2016 | |
| Superannuation Account | ||||
| - Recorded BalanceTable 2 Footnote * | 45.6 | 45.7 | ||
| - Actuarial Liability | 48.1 | 47.4 | ||
| - Actuarial Excess / (ShortfallTable 2 Footnote **) | (2.5) | (1.7) | ||
| Pension Fund | ||||
| - Actuarial Value of Assets | 31.6 | 22.5 | 0.5 | 0.5 |
| - Actuarial Liability | 31.0 | 24.1 | 0.7 | 0.6 |
| - Actuarial Surplus / (DeficitTable 2 Footnote ***) | 0.6 | (1.6) | (0.2) | (0.1) |
| Funded ratio | 102% | 94% | 76% | 91% |
| Current Service Cost (Percentage of pensionable payroll) |
27.70% | 25.86% | 18.71% | 17.48% |
Table 2 Footnotes
|
||||
Evolution of Liabilities of Superannuation Account and Pension Fund over Time – Regular Force (Slide 12)

Chart Description
Bar graph showing the evolution of liabilities related to the Superannuation Account and to the Pension Fund over time. Y-axis represents the expected Superannuation Account and Pension Fund liabilities in billions. X-axis represents the year, starting at March 31 2020 and ending at 31 March 2054.
At 31 March 2020, the Superannuation Account liabilities were approximately $48 billion and the Pension Fund liabilities were approximately $31 billion. The Superannuation Account liabilities are expected to steadily decrease and the Pension Fund liabilities are expected to steadily increase over time. As a result, it is estimated that in 2026 the Pension Fund liabilities of $44 billion will exceed the Superannuation Account liabilities of $42 billion.
From 2026 to 2054, The Superannuation Account liabilities will continue to steadily decrease by an average of $1.2 billion per year resulting in liabilities of $7 billion in 2054. The Pension Fund liabilities will continue to steadily increase, by an average of $3.2 billion each year resulting in liabilities of $135 billion in 2054.
Range of Potential Funding Ratios – Regular Force Post-2000 Service Description of Graph on following Slide (Slide 13)
- Chart illustrates range of funding ratios (actuarial value of assets over liabilities)
- Liabilities based on best estimate assumptions
- Assets returns are modeled using distribution of returns
- Actuarial valuation done every 3 years
- Deficits are covered by additional government contributions
- Legislated non-permitted surplus results in full or partial government contribution holiday
- Will result in lower contribution inflows
- Percentiles of funding ratios
- Median expected funding ratio relatively flat (102% -109%) over projection period
- Percentiles show the distribution of funding ratios for a given projection year
- As the projection period increases, the dispersion of funding ratios also increases
Range of Potential Funding Ratios – Regular Force Post-2000 Service (Slide 14)
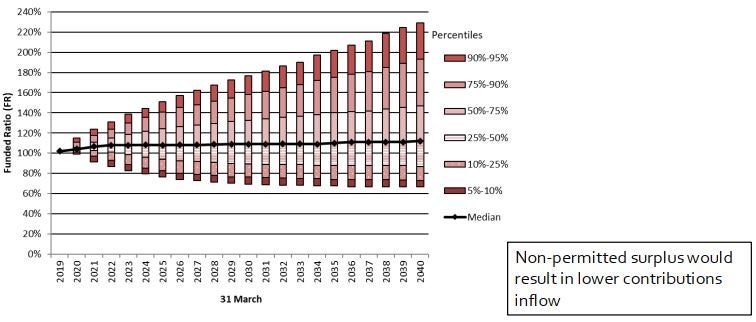
Chart Description
Bar graph showing the range of potential funding ratio of the best-estimate portfolio over time. Y-axis represents the funded ratio. X-axis shows the year, starting at 31 March 2019 and ending at 31 March 2040.
The Pension Fund was fully funded (funding ratio of 102%) at 31 March 2019. The median expected funding ratio is relatively flat (between 102% and 112%) over the projection period. The funding ratio is expected to be between 99% (5th percentile) and 115% (95th percentile) with a median of 104% at 31 March 2020, between 69% (5th percentile) and 177% (95th percentile) with a median of 109% at 31 March 2030 and between 67% (5th percentile) and 229% (95th percentile) with a median of 112% at 31 March in 2040.
Evolution of Cash Flows of the Fund over Time – Regular Force (Slide 15)
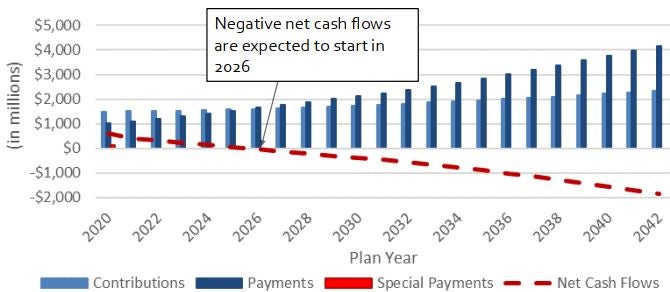
Chart Description
Bar graph showing the evolution of cash flows under the Pension Fund over time. Y-axis represents the expected contributions, payments, special payments, and resulting net cash flows in millions. X-axis represents the plan year, starting in 2020 and ending in 2042.
In plan year 2020, contributions to the Pension Fund are expected to reach $1,497 million, whereas payments and special payments are expected to reach $1,042 million and $145 million, respectively, resulting in net cash flows of $600 million. Both contributions and payments are expected to increase over time, however payments are expected to increase at a higher rate than the contributions. It is expected that the contributions will be higher than the payments until plan year 2025. In 2026, the expected payments of $1,649 million will exceed the estimated contributions of $1,608 million resulting in net cash flows of negative $41 million. From 2026, the Pension Fund is expected to have negative net cash flows. In plan year 2042, contributions to the Pension Fund are expected to reach approximately $2,343 million, whereas payouts are expected to reach approximately $4,174 million resulting in net cash flows of negative $1,831 million.
Conclusion (Slide 16)
The major difference in funding requirements between private and federal public sector pension plans is that solvency valuations are not required
The statutory and accounting actuarial valuations are used for different purposes and performed on different bases
- Contribution requirements vs. financial reporting
There is currently a surplus in the CF Pension Plan Regular Force
The plan is maturing
THANK YOU! (Slide 17)
APPENDICES (Slide 18)
Solvency Valuations (Slide 19)
- Assumptions are prescribed by the legislator
- The discount rates are based on the Canadian Institute of Actuaries (CIA) standards
- Current trend: replacing solvency funding with enhanced going-concern funding
- Quebec – 2016
- Ontario – 2018 (85% threshold)
- British Columbia – 2019 (85% threshold)
- Manitoba – 2020 (85% threshold)
- Municipalities and other public sector employers are not subject to the same risks as the private sector
- Lower risk of insolvency
- Many public sector plan sponsors have been exempted from solvency funding for many years
- The Federal Public Sector Pension Plans are not required to perform solvency valuations
Federal Public Sector Pension Plans - Funding (Slide 20)
- Governed by the Public Pensions Reporting Act and the Funding Policy for the Public Sector Pension Plans
- Current service cost contributions
- Member contributions must not exceed 50% of the total current service cost
- Member contribution rates for the Public Service pension plan are set by the Treasury Board on the recommendation of the President of the Treasury Board
- For the Canadian Forces – Regular Force and the Royal Canadian Mounted Police pension plans, they are set by the Treasury Board on the joint recommendation of the President of the Treasury Board and the Ministers of National Defence and Public Safety and Emergency Preparedness, respectively
- The contribution rates are based on actuarial advice provided by the Chief Actuary
Federal Public Sector Pension Plans - Funding (Slide 21)
- Deficit payments
- The timing and amount of special payments made by the government will be determined by the President of the Treasury BoardFootnote 3
- The normal operating practice will be to amortize a deficit to the Fund in equal annual special
- payments over 15 years.
- Non-permitted surplus is reached when assets are equal to 125% of liabilitiesFootnote 4
- Employer contributions must stop and employee contributions may be reduced
Footnotes
- Footnote 1
-
Also include federal crown corporations and provincial public sectors pension plans
- Footnote 2
-
Initial assumptions in select period reflect current market conditions transitioning to ultimate long-term assumptions.
- Footnote 3
-
A deficit in the Canadian Forces Reserve Force pension plan will be amortized in equal annual special payments over a period of 15 years, as prescribed in the Reserve Force Pension Plan Regulations
- Footnote 4
-
Except for the Canadian Forces Reserve Force pension plan where the non permitted surplus is set at 110% of liabilities