Canada Student Financial Assistance Program - Highlights
Accessibility statement
The Web Content Accessibility Guidelines (WCAG) defines requirements for designers and developers to improve accessibility for people with disabilities. It defines three levels of conformance: Level A, Level AA, and Level AAA. This report is partially conformant with WCAG 2.0 level AA. If you require a compliant version, please contact webmaster@osfi-bsif.gc.ca.
Formerly named Canada Student Loans Program
Actuarial Report as at 31 July 2020
Office of the Superintendent of Financial Institutions
Office of the Chief Actuary
Recent Measures
Temporary
In response to the COVID-19 pandemic and to help students and borrowers during the economic recovery
Suspension of loan repayments and interest accrual (30 March to 30 September 2020)
Removal of student and spousal contributions from the need assessment calculation (2020-2021)
Increase in the weekly loan limit from $210 to $350 (2020-2021)
Waiver of interest accrual on student loans (1 April 2021 to 31 March 2023)*
Doubling of the amounts of grants (2020-2021 and 2021-2023*)
Extension of the top-up grant for eligible adult learners (2021-2023)*
Recent Measures
Permanent
Implementation of an interest-free and payment-free medical or parental leave
Use of current year income for grants eligibility*
Increase in Repayment Assistance Plan (RAP) thresholds starting in 2022-2023*
Impacts
Main impacts of recent measures
Decrease in loans and increase in grants disbursed (temporary)
Decrease in interest revenues (temporary)
Increase in RAP expenses
*Proposed in Budget 2021
Periods are from 1 August to 31 July
Loans & Grants Issued
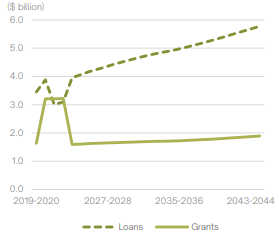
Chart Description
Line graph showing two lines, one for loans and the other one for grants issued. Y axis represents the dollar value in billions. X axis represents the loan year when the loans and grants are issued. The loans are reaching a local maximum of 3.9 billions in 2019-2020 and are decreasing the following year to 3.0 billions before increasing for the remainder of the projection to reach 5.8 billions in 2044-2045. The grants are reaching their maximum value of 3.2 billions between 2020-2021 and 2022-2023. They will decrease back to 1.6 billions in 2023-2024 and slowly increase to reach an ultimate value of 1.9 billions in 2044-2045.
Direct Loans Portfolio Balance
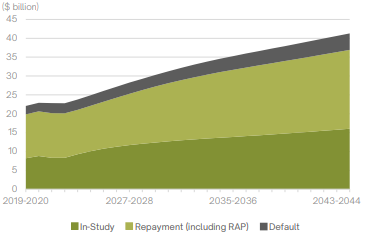
Chart Description
Bar chart showing the net annual cost of the Canada Student Financial Assistance Program. Y axis represents the dollar value in billions. X axis represents the loan year. In 2019-2020, the net annual cost of the program is 2.6 billions; it reaches a maximum of 5.3 billions 3 years later before decreasing for the next two years. For the remainder of the projection the net annual cost will increase to reach 4.8 billions in 2044-2045.
Net Annual Cost of the Program
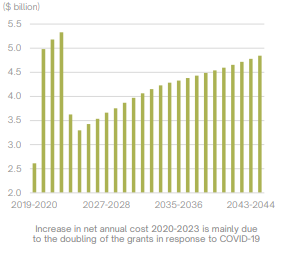
Chart Description
Stacked area chart showing the direct loans portfolio balance in 3 categories: in-study, in repayment (including the RAP) and in default. Y axis represents the dollar value in billions. X axis represents the loan year. The loans in-study in 2019-2020 represents 8.2 billions and increase to their ultimate value of 16 billions in 2044-2045. The loans in repayment (including RAP) in 2019-2020 represents 11.6 billions and increase to their ultimate value of 20.9 billions in 2044-2045. The loans in default in 2019-2020 represents 2.2 billions and increase to their ultimate value of 4.4 billions in 2044-2045. The loans in-study, in repayment and in default represents 38%, 51% and 11% of the total portfolio respectively.
Total Program Expenses in 2019-2020
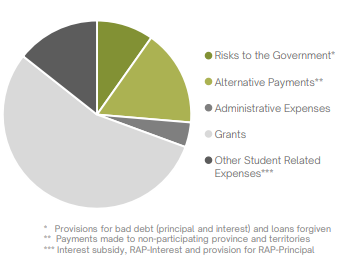
Chart Description
Pie chart showing a total expense of 3 billions for the Canada Student Financial Assistance Program in 2019-2020. The total expenses are split into five categories. The risks to the government category totals 290 millions. The alternative payments category totals 492 millions. The administrative expenses category totals 127 millions. The grants represents 1,635 millions and the other student related expenses category totals 427 millions.