Canada Student Financial Assistance Program as at 31 July 2020
Accessibility statement
The Web Content Accessibility Guidelines (WCAG) defines requirements for designers and developers to improve accessibility for people with disabilities. It defines three levels of conformance: Level A, Level AA, and Level AAA. This report is partially conformant with WCAG 2.0 level AA. If you require a compliant version, please contact webmaster@osfi-bsif.gc.ca.
Office of the Chief Actuary
Office of the Superintendent of Financial Institutions Canada
12th Floor, Kent Square Building
255 Albert Street
Ottawa, Ontario
K1A 0H2
E-mail: oca-bac@osfi-bsif.gc.ca
Web site: www.osfi-bsif.gc.ca
© Her Majesty the Queen in Right of Canada, 2020
Cat. No. IN3-16/27E-PDF
ISSN 2564-1026
6 July 2021
The Honourable Carla Qualtrough
Minister of Employment, Workforce Development and Disability Inclusion
House of Commons
Ottawa, Canada
K1A 0A6
Dear Minister:
In accordance with section 19.1 of the Canada Student Financial Assistance Act, which provides that a report shall be prepared on financial assistance provided under this Act, I am pleased to submit the Actuarial Report on the Canada Student Financial Assistance Program (formerly referred to as Canada Student Loans Program), prepared as at 31 July 2020.
Yours sincerely,
Assia Billig, FCIA, FSA, PhD
Chief Actuary
Office of the Chief Actuary
Table of contents
Index of tables
- Table 1 Demographic and Labour Force Assumptions
- Table 2 Real Wage and Tuition Increases Assumptions
- Table 3 Borrowing Cost
- Table 4 Population and Post-secondary Enrolment of Participating Provinces
- Table 5 Loan Recipients
- Table 6 Student Need
- Table 7 Increase in New Loans Issued
- Table 8 Guaranteed and Risk-Shared Regimes Portfolio
- Table 9 Direct Loan Portfolio and Allowances
- Table 10 Defaulted Loans and Allowance for Bad Debt – Principal
- Table 11 Interest on Defaulted Loans and Allowance for Bad Debt – Interest
- Table 12 Allowance for Repayment Assistance Plan – Principal
- Table 13 Direct Loan Portfolio and Allowances (in millions of 2020 constant dollars)
- Table 14 Aggregate Amount of Outstanding Student Loans
- Table 15 Student Related Expenses
- Table 16 Risks to the Government
- Table 17 Summary of Expenses
- Table 18 Total Revenues
- Table 19 Net Annual Cost of the Program
- Table 20 Net Annual Cost of the Program (in millions of 2020 constant dollars)
- Table 21 Direct Loans Issued and Number of Students
- Table 22 Direct Loans Consolidated
- Table 23 Direct Loans Default Portfolio - Principal
- Table 24 Repayment Assistance Plan
- Table 25 Reconciliation of the Direct Loans Portfolio as at 31 July 2020
- Table 26 Full-time Post-Secondary Enrolment Rate by Labour Force Status
- Table 27 Short-term Increase of Tuition Expenses
- Table 28 Provision Rates for Bad Debt – Interest
- Table 29 RAP-Stage 1 Utilization Rates
- Table 30 RAP-Stage 2 Utilization Rates
- Table 31 RAP-PD Utilization Rates
- Table 32 Administrative Expense
- Table 33 Long-term Sensitivity Test Assumptions
- Table 34 Impact of Loan Limit on Loans Issued
- Table 35 Impact of Indexation of Loan Limit and Grants on Loans Issued
- Table 36 Impact of Indexation of Fixed Student Contribution on Loans Issued
- Table 37 Sensitivity Test Results for the 2044‑2045 Loan Year
Index of charts
1 Purpose and Summary
Main Findings
Grants
- $1,635M disbursed in 2019‑2020
- $3,206M expected in 2020‑2021
New Loans Issued
- $3,449M disbursed in 2019‑2020
- $3,879M expected in 2020‑2021
Direct Loan Portfolio
- $22.1B as at 31 July 2020
- $41.3B expected by 2044‑2045
- $34B limit projected to be reached in 2032‑2033
Program's Net Cost
- $2.6B in 2019‑2020
- $4.8B expected in 2044‑2045
- Grants represent 63% of net cost in 2019‑2020
Defaults (Bad Debt)
- Long-term net default rate is 8.1%
- $2,810M in allowance for bad debt – principal as at 31 July 2020
- $238M in allowance for bad debt – interest as at 31 July 2020
RAP (Repayment Assistance Plan)
- $1,717M in allowance for RAP – principal as at 31 July 2020
Effective 1 August 2000, the Government redesigned the delivery of the Canada Student Financial Assistance ProgramFootnote 1 (CSFA Program, formerly referred to as Canada Student Loans Program) from one delivered by chartered banks to one directly financed by the Government. As part of this redesign, the Office of the Chief Actuary was given the mandate to conduct an actuarial review of the program.
Section 19.1 of the Canada Student Financial Assistance Act defines the mandate given to the Chief Actuary; it states that the Chief Actuary of the Office of the Superintendent of Financial Institutions shall prepare a report on the financial assistance provided under this Act no later than three years apart. This is the seventh statutory Actuarial Report on the CSFA Program, prepared as at 31 July 2020. As provided in subsection 19.1(3), the report includes a forecast of the costs and revenues of the program for the next 25 years (through the 2044‑2045 loan year). The purpose of the actuarial review of the CSFA Program is to provide a valuation of the program's overall financial costs and increase the level of information provided to the Minister of Employment, Workforce Development and Disability Inclusion, Parliament and the public. The next triennial statutory report will be prepared as at 31 July 2023. Interim reports for Employment and Social Development Canada (ESDC) accounting purposes will be prepared as at 31 July 2021 and 31 July 2022.
The report shows estimates of:
- the number of students receiving a loan under the CSFA Program and the amount of new loans issued;
- the portfolio of loans in-study, loans in repayment and loans in default;
- the allowances under the direct loan regime in effect since August 2000; and
- the revenues, the expenses and the net resulting cost by type of regime.
COVID-19 Pandemic
More than one year has passed since the beginning of the COVID-19 pandemic. The situation remains fluid and will likely continue to evolve for some time. Several temporary measures were introduced by the Government within the CSFA Program during the 2019‑2020 and 2020‑2021 loan years to alleviate the impact of the pandemic on students and borrowers. Budget 2021 also proposed to extend some of these measures. These measures and their estimated impacts are reflected in the projections of this report. The final impacts of this health and economic crisis will likely generate some differences in the future.
This valuation report is based on the program provisions as described in Appendix A. The additional appendices provide information on the data used, a reconciliation of the portfolio, a description of assumptions and methodologies, sensitivity tests as well as information on concessionary terms.
2 Main Report
The Canada Student Financial Assistance Program (CSFA Program, formerly referred to as Canada Student Loans Program) has been in effect since 1964; it provides Canadians with financial assistance to pursue a post-secondary education. On 1 August 2000, the Government redesigned the delivery of the program to disburse loans directly to students. The Office of the Chief Actuary was given the mandate to provide an assessment of the current costs of the CSFA Program, a long-term (25 years) forecast of these costs, and a portfolio projection. The results are presented on a loan year basis from 1 August to 31 July.
The following items are considered to determine the net cost of the program:
Expenses
- Canada Student Grants (CSG)
- Interest subsidy on in-study loans and loans in the 6-month non-repayment period
- Interest relief from the Repayment Assitance Plan (RAP)
- Provisions for RAP (principal) and bad debt (principal and interest)
- Alternative payments
- Loan forgiveness expenses
- Administrative expenses
Reduced by Net Interest Revenues
- Interest accrued during the six-month non-repayment period (up to 31 October 2019)
- Student interest payments
- RAP interest payments covered by the Government
- Interest accrued on defaulted loans
2.1 Recent Program Changes
Over the last few years, several changes were made to the CSFA Program. This section summarizes recent changes that were implemented in loan year ending 31 July 2020 or will be implemented in future years. Unless stated otherwise, these measures have been reflected in the projections presented in this report.
| Implementation Date | Description | Source |
|---|---|---|
| 1 August 2019 | Increase the cap on the Canada Student Grant for Services and Equipment for Students with Permanent Disabilities, from $8,000 to $20,000 per year. | Budget 2019 / Approved |
| Expand eligibility for the Severe Permanent Disability Benefit to allow more student borrowers with severe permanent disabilities to qualify for loan forgiveness. | ||
| 1 November 2019 | Lower the floating interest rate, from prime plus 2.5 percentage points to prime. | Budget 2019 / Approved |
| Lower the fixed interest rate, from prime plus 5.0 percentage points to prime plus 2.0 percentage points. | ||
| Cease interest accrual during the six-month non-repayment period. | ||
| 1 January 2020 | Enhance the eligibility for loan rehabilitation for borrowers in default. | Budget 2019 / Approved |
| 1 August 2020 | Remove the restriction which prevent borrowers who have been out of study for five years and have used the RAP for Students with Permanent Disabilities (RAP-PD) to receive further loans and grants until their outstanding loans are fully paid. | Budget 2019 / Approved |
| 1 October 2020 | Implement interest-free and payment-free leave, for a maximum of 18 months, for borrowers taking temporary leave from their studies for medical or parental reasons, including mental health leave. | Budget 2019 / Approved |
| 1 August 2021 (expected) |
Flexibility to use current year's income instead of previous year's income to determine eligibility for Canada Student Grants (three-year pilot project introduced in 2018‑2019 made permanent). | Budget 2021 / Pending Regulatory Approval |
| 2022‑2023 (expected) |
Increase accessibility to the RAP by increasing RAP income thresholds and reducing the maximum affordable payment. | Budget 2021 / Pending Regulatory Approval |
| 2022‑2023 (expected) |
Expand access to supports for students and borrowers with persistent or prolonged disabilities that are not necessarily permanent. | Budget 2021 / Not considered in this report as details are not finalized |
| Start/End Date | Description | Source |
|---|---|---|
| 30 March 2020 to 30 September 2020 | Suspend student loan repayments and interest accrual. | Measures in response to COVID-19 |
| 1 August 2020 to 31 July 2021 | Double the amount for the following CSGs:
|
Measures in response to COVID-19 |
| Change the need assessment so that no fixed student contribution or spousal contribution are considered. This helps students qualify for more financial support. | ||
| Increase the weekly loan limit, from $210 to $350. | ||
| 1 April 2021 to 31 March 2022 | Waiver of interest accrual on student loans. | Bill C-14 / Approved |
| 1 August 2021 to 31 July 2023 (expected) |
Extend the doubling of the grants. | Budget 2021 / Pending Regulatory Approval |
| Extend the top-up grant of $200 per month for eligible adult learners returning to school full-time after being out of secondary school for at least 10 years (extension of the three-year pilot project introduced in loan year 2018‑2019). | ||
| 1 April 2022 to 31 March 2023 (expected) |
Extend the waiver of interest accrual on student loans. | Budget 2021 / Pending Budget Implementation Act Royal Ascent |
2.2 Best-Estimate Assumptions
Several economic and demographic assumptions are needed to determine the future long-term costs of the CSFA Program. The projections included in this report cover a period of 25 years and the assumptions are determined by putting as much emphasis on historical trends as on short-term experience. These assumptions reflect the actuary's best judgment and are referred to as "best-estimate" assumptions. Some of these assumptions are based on the most recent actuarial reports prepared by the Office of the Chief Actuary, adjusted to reflect loan year periods. The assumptions were chosen to be internally consistent.
2.2.1 Assumptions related to Total Loans Issued Projections
Several assumptions are needed to determine the total amount of loans issued. Tables 1 and 2 summarize the main assumptions used. Other economic assumptions used can be found in Table 3.
Table 1 presents the demographic and labour force assumptions while Table 2 presents the real wages and tuition fee increases assumptions. Assumptions shown in Table 1 and the ultimate real wage increase shown in Table 2 are based on the 30th Actuarial Report on the Canada Pension Plan as at 31 December 2018.
| 1 | Total fertility rate for Canada (ultimate) | 1.62 per woman (for 2027+) | |
|---|---|---|---|
| 2 | Mortality | Statistics Canada Life Tables with CPP 30th assumed future improvements | |
| 3 | Net migration rate for Canada (ultimate) | 0.62% of population (for 2021+) | |
| 4 | Youth labour force participation rate (participating provinces/territory, ages 15‑29)Table Footnote 1 |
69.2% | (2020‑2021) |
| 69.7% | (2021‑2022) | ||
| 70.7% | (2022‑2023) | ||
| • | |||
| • | |||
| • | |||
| 72.6% | (2044‑2045) | ||
Table 1 Footnotes
|
|||
| 5 | Real wage increasesTable Footnote 1 | 4.3%Table Footnote 2 | (2020‑2021) |
|---|---|---|---|
| -1.0%Table Footnote 3 | (2021‑2022) | ||
| -1.2% | (2022‑2023) | ||
| -0.7% | (2023‑2024) | ||
| 0.4% | (2024‑2025) | ||
| 1.0% | (2025‑2026)+ | ||
| 6 | Tuition fee increases | 1.8% | (2020‑2021) |
| 1.6% | (2021‑2022) | ||
| 4.1%Table Footnote 4 | (2022‑2023) | ||
| 4.1% | (2023‑2024) | ||
| • | |||
| • | |||
| • | |||
| Inflation + 1.75% | (2028‑2029)+ | ||
Table 2 Footnotes
|
|||
2.2.2 Cost of Borrowing
Table 3 presents the interest rates and inflation assumptions used to calculate the cost of borrowing for the Government and for borrowers. The inflation assumption is also used in the projection of total loans issued.
| Loan Year | Government's Cost of Borrowing (%) |
Inflation (%) |
Government's Real Cost of BorrowingTable Footnote 1 (%) |
Prime Rate (%) |
Student's Cost of Borrowing (%) |
|---|---|---|---|---|---|
| (1) | (2) | (1) - (2) | |||
| 2020‑2021 | 1.1 | 1.6 | -0.5 | 2.5 | 2.5 |
| 2021‑2022 | 1.7 | 2.0 | -0.3 | 2.5 | 2.5 |
| 2022‑2023 | 1.9 | 2.0 | -0.1 | 2.7 | 2.7 |
| 2023‑2024 | 2.2 | 2.0 | 0.2 | 3.0 | 3.0 |
| 2024‑2025 | 2.5 | 2.0 | 0.5 | 3.3 | 3.3 |
| 2025‑2026 | 2.7 | 2.0 | 0.7 | 3.5 | 3.5 |
| 2026‑2027 | 2.8 | 2.0 | 0.8 | 3.6 | 3.6 |
| 2027‑2028 | 3.0 | 2.0 | 1.0 | 3.7 | 3.7 |
| 2028‑2029 | 3.1 | 2.0 | 1.1 | 3.8 | 3.8 |
| 2029‑2030 | 3.3 | 2.0 | 1.3 | 3.9 | 3.9 |
| 2030‑2031 | 3.4 | 2.0 | 1.4 | 4.0 | 4.0 |
| 2031‑2032 | 3.5 | 2.0 | 1.5 | 4.1 | 4.1 |
| 2032‑2033 | 3.6 | 2.0 | 1.6 | 4.2 | 4.2 |
| 2033‑2034+ | 3.7 | 2.0 | 1.7 | 4.3 | 4.3 |
Table 3 Footnotes
|
|||||
The average prime rate for the 2020‑2021 loan year is 2.5%. It is obtained by adding the government's cost of borrowing and an interest rate spread. The short term government's cost of borrowing (until 2024‑2025) is based on the most recent Department of Finance Private Sector Survey and takes into account new actual data released after the publication of the survey. The government's cost of borrowing is expected to increase to reach an ultimate rate of 3.7% in 2033‑2034. The assumption on the interest rate spread is developed based on the analysis of historical data and the expected short term trajectory of interest rates. The spread is expected to decrease gradually from 1.4% in 2020‑2021 to an ultimate value of 0.6% in 2029‑2030, resulting in an ultimate prime rate of 4.3% in 2033‑2034.
2.2.3 Assumptions related to Allowances
Since August 2000, the CSFA Program has been delivered and financed directly by the Government. Three allowances exist to cover future costs: Bad debt – principal, Bad debt – interest and Repayment Assistance Plan (RAP) – principal.
A summary of the assumptions used to determine the allowances is provided below. Additional details can be found in Appendix D.
Long-Term Defaulted Principal Assumptions
Several assumptions are used to determine the expected future amount of defaulted principal that will not be recovered. These assumptions are revised each year. The most recent experience, ending right before the start of the pandemic, shows a slight increase in gross defaults. Over the same period, higher than expected recalls and rehabilitations can also be observed, resulting in an ultimate net default rate that is comparable with the one in the previous actuarial report. The following ultimate assumptions are used:
| Gross Default |
|
|---|---|
| Recalls and Rehabilitations |
|
| Recoveries |
|
| Resulting Net Default |
|
Interest Recovery Assumption
The interest recovery assumption is used to project the future expected non-recoverable interest. It is determined by a distribution that varies according to the time elapsed since the interest defaulted. The recovery rates are based on historical observations. Overall, the recovery rate for future accrued default interest is 56.4%.
Repayment Assistance Plan (RAP) Assumptions
Several assumptions are used to determine the dollar amount of loans that will ultimately be repaid by the Government through the RAP rather than by borrowers. These assumptions are reviewed each year based on new experience available:
| RAP-Stage 2 and RAP-PD Utilization |
|
|---|---|
| Required Payments |
|
| Affordable Payments |
|
2.3 Projection of Total Loans Issued
The following formula illustrates a simplification of the elements considered in the projection of the total amount of loans issued under the CSFA Program:
Total Amount of Loans Issued = Population × Post-Secondary Enrolment Rates × Loan Uptake Rates × Average Loan Size
2.3.1 Projection of the Population
Demographic projections are based on the population projected in the 30th Actuarial Report on the Canada Pension Plan as at 31 December 2018. Subsets of the population ineligible to participate in the CSFA Program are then removed, such that the "population" used corresponds to Canada less Quebec, Northwest Territories, Nunavut, and non-permanent residents.
As shown in Table 4, the population aged 15‑29 is expected to decrease from 4,975,000 in 2019‑2020 to 4,958,000 in 2020‑2021. It is expected to continue to decrease over the following year to reach 4,949,000. After that, it is expected to increase for the remainder of the projection period to reach 5,852,000 in 2044‑2045. Over the 25-year projection period, the population aged 15‑29 is expected to increase by 877,000.
2.3.2 Projection of Post-Secondary Enrolment
Projections of post-secondary enrolment are based on enrolment data from Statistics Canada's Labour Force Survey up to January 2021.
The enrolment rates vary according to the following:
Age Group
- 15 to 19
- 20 to 24
- 25 to 29
- 30 and over
Gender
- Male
- Female
Labour Force Status
- In labour force (individuals who are employed or looking for employment)
- Out of labour force
Educational Institution
- University
- Public college
- Private college
Overall, the aggregate enrolment rate for students aged 15 to 29 is expected to remain between 22% and 24% over the next 25 years.
Table 4 shows the evolution of the number of students enrolled full-time in a post-secondary institution (age group 15‑29 and total). The total number of enrolled students is expected to increase from its current level of 1,257,000 to 1,513,000 at the end of the projection period. Students aged 15‑29 are used for illustrative purposes as they represent more than 85% of the total post-secondary enrolment and better demonstrate the movement of this population across time.
| Loan Year | Population of Canada Less Quebec, Nunavut, and NWT (15‑29)Table Footnote 2 (thousands) |
Students Enrolled Full-Time (15‑29) Table Footnote 3 (thousands) |
All students Enrolled Full-Time (Total)Table Footnote 3 (thousands) |
Increase (thousands) |
Increase (%) |
|---|---|---|---|---|---|
| 2019‑2020 | 4,975 | 1,093 | 1,257Table Footnote 4 | ||
| 2020‑2021 | 4,958 | 1,140 | 1,289 | 32 | 2.5 |
| 2021‑2022 | 4,949 | 1,122 | 1,277 | -12 | -0.9 |
| 2022‑2023 | 4,957 | 1,123 | 1,280 | 3 | 0.2 |
| 2023‑2024 | 4,978 | 1,136 | 1,295 | 15 | 1.1 |
| 2024‑2025 | 5,001 | 1,145 | 1,305 | 10 | 0.8 |
| 2025‑2026 | 5,023 | 1,157 | 1,318 | 13 | 1.1 |
| 2026‑2027 | 5,045 | 1,164 | 1,324 | 6 | 0.4 |
| 2027‑2028 | 5,080 | 1,173 | 1,333 | 9 | 0.7 |
| 2028‑2029 | 5,116 | 1,183 | 1,343 | 10 | 0.7 |
| 2029‑2030 | 5,148 | 1,192 | 1,350 | 7 | 0.6 |
| 2030‑2031 | 5,177 | 1,200 | 1,359 | 9 | 0.6 |
| 2031‑2032 | 5,216 | 1,208 | 1,366 | 7 | 0.6 |
| 2032‑2033 | 5,260 | 1,214 | 1,372 | 6 | 0.4 |
| 2033‑2034 | 5,305 | 1,217 | 1,376 | 4 | 0.3 |
| 2034‑2035 | 5,347 | 1,221 | 1,380 | 4 | 0.3 |
| 2035‑2036 | 5,397 | 1,226 | 1,386 | 6 | 0.4 |
| 2036‑2037 | 5,448 | 1,236 | 1,397 | 11 | 0.8 |
| 2037‑2038 | 5,495 | 1,246 | 1,408 | 11 | 0.8 |
| 2038‑2039 | 5,537 | 1,257 | 1,419 | 11 | 0.8 |
| 2039‑2040 | 5,582 | 1,269 | 1,433 | 14 | 0.9 |
| 2040‑2041 | 5,631 | 1,282 | 1,448 | 15 | 1.0 |
| 2041‑2042 | 5,687 | 1,297 | 1,464 | 16 | 1.1 |
| 2042‑2043 | 5,742 | 1,312 | 1,481 | 17 | 1.1 |
| 2043‑2044 | 5,797 | 1,327 | 1,497 | 16 | 1.1 |
| 2044‑2045 | 5,852 | 1,342 | 1,513 | 16 | 1.1 |
Table 4 Footnotes
|
|||||
2.3.3 Projection of the Number of Students Receiving a Loan
The projection of the loan uptake rates is based on the historical number of students receiving a loan under the CSFA Program according to:
Educational Institution
- University
- Public college
- Private college
The product of the number of students enrolled full-time and the CSFA Program loan uptake rate gives the number of students receiving a loan under the CSFA Program. Table 5 shows that the increasing loan uptake rate, from 48.4% in 2019‑2020 to 54.2% in 2044‑2045, combined with the increase in students enrolled in post-secondary education, results in 212,000 more students in the program (from 608,000 students in 2019‑2020 to 820,000 in 2044‑2045).
The number of students in the CSFA Program shown in Table 5 does not include the small number of students who only receive a CSG since their entire need is covered by the grant (no loans are issued to them). According to the ESDC data file, the total number of students who received a grant in the 2019‑2020 loan year is 528,000. The majority of grant recipients (91%) received both a loan and a grant.
| Loan Year | Students Enrolled Full-Time (thousands) |
Loan Uptake Rate (%) |
Students in CSFATable Footnote 1 (thousands) |
Annual Increase in CSFA Students (thousands) |
Annual Increase in CSFA Students (%) |
|---|---|---|---|---|---|
| (1) | (2) | (1) x (2) | |||
| 2019‑2020 | 1,257 | 48.4 | 608 | ||
| 2020‑2021 | 1,289 | 44.1 | 568 | -40 | -6.5 |
| 2021‑2022 | 1,277 | 46.1 | 588 | 20 | 3.5 |
| 2022‑2023 | 1,280 | 46.2 | 592 | 4 | 0.6 |
| 2023‑2024 | 1,295 | 49.8 | 645 | 53 | 9.0 |
| 2024‑2025 | 1,305 | 50.0 | 653 | 8 | 1.2 |
| 2025‑2026 | 1,318 | 50.2 | 661 | 9 | 1.4 |
| 2026‑2027 | 1,324 | 50.4 | 667 | 6 | 0.8 |
| 2027‑2028 | 1,333 | 50.6 | 674 | 7 | 1.1 |
| 2028‑2029 | 1,343 | 50.8 | 682 | 7 | 1.1 |
| 2029‑2030 | 1,350 | 51.0 | 688 | 7 | 1.0 |
| 2030‑2031 | 1,359 | 51.2 | 695 | 7 | 1.0 |
| 2031‑2032 | 1,366 | 51.4 | 702 | 7 | 1.0 |
| 2032‑2033 | 1,372 | 51.6 | 708 | 6 | 0.9 |
| 2033‑2034 | 1,376 | 51.8 | 713 | 5 | 0.7 |
| 2034‑2035 | 1,380 | 52.0 | 718 | 5 | 0.7 |
| 2035‑2036 | 1,386 | 52.2 | 724 | 6 | 0.8 |
| 2036‑2037 | 1,397 | 52.5 | 733 | 9 | 1.2 |
| 2037‑2038 | 1,408 | 52.7 | 741 | 9 | 1.2 |
| 2038‑2039 | 1,419 | 52.9 | 751 | 9 | 1.3 |
| 2039‑2040 | 1,433 | 53.1 | 761 | 10 | 1.3 |
| 2040‑2041 | 1,448 | 53.3 | 772 | 11 | 1.4 |
| 2041‑2042 | 1,464 | 53.5 | 784 | 12 | 1.5 |
| 2042‑2043 | 1,481 | 53.7 | 796 | 12 | 1.5 |
| 2043‑2044 | 1,497 | 53.9 | 808 | 12 | 1.5 |
| 2044‑2045 | 1,513 | 54.2 | 820 | 12 | 1.5 |
Table 5 Footnotes
|
|||||
2.3.4 Projection of the Average Loan Issued per Borrower
The projection of the average loan issued is based on the projection of the student net need, capped at the maximum weekly loan limit:
Step 1: Determining the student net need
Student NeedFootnote 2 (excess of expenses over resources):
- Expenses: tuition and compulsory fees, books and supplies, living allowance, return transportation, child care and a few other allowable expenses depending on the student's situation.
- Resources: student contributionsFootnote 3 and, when applicable, parental or spousal contributions.
- Projected to increase using economic assumptions.
Grants reduction:
- Grants are the first component that reduce the student need, resulting in the student net need.
- Grants may fulfill the entire student need, in which case no loan is issued.
- Different grants are available (details can be found in Appendix A).
- Grants other than those for disability are projected using inflation indexed thresholds and expected gross annual family income.
Table 6 summarizes the main elements of the student net need calculation. All students who receive a loan are included.
| Loan Year | Resources ($) |
Tuition ($) |
Other Expenses ($) |
Total Expenses ($) |
Average Student Need ($) |
Average Grant for Net Need CalculationTable Footnote 2 ($) |
CSFA Average Student Net Need ($) |
CSFA Average Student Net Need Increase ($) |
|---|---|---|---|---|---|---|---|---|
| (A) | (B) | (C) | (D) = (B) + (C) | (E) = (D) - (A) | (F) | (G) = (E) × 60% - (F) | ||
| 2019‑2020 | 3,100 | 8,400 | 12,700 | 21,100 | 18,000 | 2,300 | 8,500 | |
| 2020‑2021 | 1,700Table Footnote 3 | 8,600 | 12,900 | 21,500 | 19,800 | 4,400Table Footnote 4 | 7,500 | -1,000 |
| 2021‑2022 | 3,300 | 8,700 | 13,100 | 21,800 | 18,500 | 4,400 | 6,700 | -800 |
| 2022‑2023 | 3,300 | 9,100 | 13,400 | 22,500 | 19,200 | 4,400 | 7,100 | 400 |
| 2023‑2024 | 3,300 | 9,500 | 13,700 | 23,200 | 19,900 | 2,100Table Footnote 5 | 9,800 | 2,700 |
| 2024‑2025 | 3,400 | 9,900 | 13,900 | 23,800 | 20,400 | 2,100 | 10,100 | 300 |
| 2025‑2026 | 3,500 | 10,300 | 14,200 | 24,500 | 21,000 | 2,100 | 10,500 | 400 |
| 2026‑2027 | 3,500 | 10,700 | 14,500 | 25,200 | 21,700 | 2,100 | 10,900 | 400 |
| 2027‑2028 | 3,600 | 11,100 | 14,800 | 25,900 | 22,300 | 2,100 | 11,300 | 400 |
| 2028‑2029 | 3,700 | 11,500 | 15,100 | 26,600 | 22,900 | 2,100 | 11,600 | 300 |
| 2029‑2030 | 3,800 | 12,000 | 15,400 | 27,400 | 23,600 | 2,100 | 12,100 | 500 |
| 2030‑2031 | 3,900 | 12,400 | 15,700 | 28,100 | 24,200 | 2,000 | 12,500 | 400 |
| 2031‑2032 | 4,000 | 12,900 | 16,000 | 28,900 | 24,900 | 2,000 | 12,900 | 400 |
| 2032‑2033 | 4,200 | 13,400 | 16,300 | 29,700 | 25,500 | 2,000 | 13,300 | 400 |
| 2033‑2034 | 4,300 | 13,900 | 16,600 | 30,500 | 26,200 | 2,000 | 13,700 | 400 |
| 2034‑2035 | 4,400 | 14,400 | 17,000 | 31,400 | 27,000 | 2,000 | 14,200 | 500 |
| 2035‑2036 | 4,500 | 15,000 | 17,300 | 32,300 | 27,800 | 2,000 | 14,700 | 500 |
| 2036‑2037 | 4,700 | 15,600 | 17,700 | 33,300 | 28,600 | 2,000 | 15,200 | 500 |
| 2037‑2038 | 4,800 | 16,200 | 18,000 | 34,200 | 29,400 | 1,900 | 15,700 | 500 |
| 2038‑2039 | 5,000 | 16,800 | 18,400 | 35,200 | 30,200 | 1,900 | 16,200 | 500 |
| 2039‑2040 | 5,100 | 17,400 | 18,700 | 36,100 | 31,000 | 1,900 | 16,700 | 500 |
| 2040‑2041 | 5,300 | 18,100 | 19,100 | 37,200 | 31,900 | 1,900 | 17,200 | 500 |
| 2041‑2042 | 5,400 | 18,800 | 19,500 | 38,300 | 32,900 | 1,900 | 17,800 | 600 |
| 2042‑2043 | 5,600 | 19,500 | 19,900 | 39,400 | 33,800 | 1,900 | 18,400 | 600 |
| 2043‑2044 | 5,800 | 20,300 | 20,300 | 40,600 | 34,800 | 1,900 | 19,000 | 600 |
| 2044‑2045 | 6,000 | 21,000 | 20,700 | 41,700 | 35,700 | 1,900 | 19,500 | 500 |
Table 6 Footnotes
|
||||||||
Step 2: Adjusting for the loan limit
Loans are capped at a maximum of $210 per weekFootnote 4:
- Projected to remain fixed at $210
The constant loan limit restricts the growth of new loans issued. Over time, more students reach the loan limit without their needs being completely fulfilled. This is shown in Table 7 , where the percentage of students at the loan limit is projected to increase from 43.5% in 2019‑2020 to 87.9% in 2044‑2045.
2.3.5 Total Amount of Loans Issued
Table 7 presents the resulting projection of new amount of loans issued.
| Loan Year | Average Student Need ($) |
Increase (%) |
% of Students at LimitTable Footnote 1 |
New Loans Issued ($ million) |
Increase (%) |
Students in CSFA (thousands) |
Increase (%) |
Average Loan Size ($) |
Increase (%) |
|---|---|---|---|---|---|---|---|---|---|
| (1) | (2) | (3) | (4) | (3) / (4) | |||||
| 2019‑2020 | 18,000 | 43.5 | 3,449 | 608 | 5,674 | ||||
| 2020‑2021 | 19,800 | 10.0Table Footnote 2 | 16.2Table Footnote 3 | 3,879 | 12.5Table Footnote 4 | 568 | -6.5 | 6,827 | 20.3 |
| 2021‑2022 | 18,500 | -6.6 | 33.2Table Footnote 5 | 3,006Table Footnote 6 | ‑22.5 | 588 | 3.5 | 5,110 | ‑25.1 |
| 2022‑2023 | 19,200 | 3.8 | 35.0Table Footnote 5 | 3,096 | 3.0 | 592 | 0.6 | 5,230 | 2.3 |
| 2023‑2024 | 19,900 | 3.6 | 52.2 | 3,956Table Footnote 7 | 27.8 | 645 | 9.0 | 6,133 | 17.3 |
| 2024‑2025 | 20,400 | 2.5 | 54.7 | 4,065 | 2.7 | 653 | 1.2 | 6,228 | 1.5 |
| 2025‑2026 | 21,000 | 2.9 | 57.2 | 4,178 | 2.8 | 661 | 1.4 | 6,316 | 1.4 |
| 2026‑2027 | 21,700 | 3.3 | 59.6 | 4,267 | 2.1 | 667 | 0.8 | 6,397 | 1.3 |
| 2027‑2028 | 22,300 | 2.8 | 62.1 | 4,364 | 2.3 | 674 | 1.1 | 6,472 | 1.2 |
| 2028‑2029 | 22,900 | 2.7 | 64.7 | 4,458 | 2.2 | 682 | 1.1 | 6,540 | 1.1 |
| 2029‑2030 | 23,600 | 3.1 | 67.0 | 4,544 | 1.9 | 688 | 1.0 | 6,602 | 1.0 |
| 2030‑2031 | 24,200 | 2.5 | 69.3 | 4,629 | 1.9 | 695 | 1.0 | 6,659 | 0.9 |
| 2031‑2032 | 24,900 | 2.9 | 72.0 | 4,709 | 1.7 | 702 | 1.0 | 6,710 | 0.8 |
| 2032‑2033 | 25,500 | 2.4 | 74.0 | 4,781 | 1.5 | 708 | 0.9 | 6,755 | 0.7 |
| 2033‑2034 | 26,200 | 2.7 | 75.6 | 4,845 | 1.3 | 713 | 0.7 | 6,795 | 0.6 |
| 2034‑2035 | 27,000 | 3.1 | 77.0 | 4,905 | 1.3 | 718 | 0.7 | 6,832 | 0.5 |
| 2035‑2036 | 27,800 | 3.0 | 78.4 | 4,971 | 1.3 | 724 | 0.8 | 6,865 | 0.5 |
| 2036‑2037 | 28,600 | 2.9 | 79.6 | 5,053 | 1.6 | 733 | 1.2 | 6,896 | 0.4 |
| 2037‑2038 | 29,400 | 2.8 | 80.9 | 5,134 | 1.6 | 741 | 1.2 | 6,924 | 0.4 |
| 2038‑2039 | 30,200 | 2.7 | 82.1 | 5,217 | 1.6 | 751 | 1.3 | 6,949 | 0.4 |
| 2039‑2040 | 31,000 | 2.6 | 83.3 | 5,305 | 1.7 | 761 | 1.3 | 6,972 | 0.3 |
| 2040‑2041 | 31,900 | 2.9 | 84.4 | 5,396 | 1.7 | 772 | 1.4 | 6,991 | 0.3 |
| 2041‑2042 | 32,900 | 3.1 | 85.6 | 5,491 | 1.8 | 784 | 1.5 | 7,008 | 0.2 |
| 2042‑2043 | 33,800 | 2.7 | 86.6 | 5,587 | 1.7 | 796 | 1.5 | 7,022 | 0.2 |
| 2043‑2044 | 34,800 | 3.0 | 87.3 | 5,680 | 1.7 | 808 | 1.5 | 7,034 | 0.2 |
| 2044‑2045 | 35,700 | 2.6 | 87.9 | 5,772 | 1.6 | 820 | 1.5 | 7,043 | 0.1 |
Table 7 Footnotes
|
|||||||||
Table 7 shows the annual increase in new loans issued over the 25-year projection period. Overall, the total new loans issued is expected to increase from $3,449 million in 2019‑2020 to $3,879 million in 2020‑2021. In 2044‑2045, projected new loans issued total $5,772 million, which corresponds to an average annual increase of 2.1%. This average annual increase can be attributed to two factors: an average annual increase in the number of students in the program of 1.2% and an average annual increase in the average loan size of 0.9% over the 25-year projection period. The average loan size is calculated as the ratio of new loans issued over the number of students receiving a loan under the CSFA Program. The growth rate of the average loan size is moderated due to the constant loan limit.
2.4 Portfolio Projections
This section presents projections of the portfolio for all three regimes described in Appendix A, as well as projections of the three allowances under the direct loan regime. The amounts for loans in-study represent loans issued to students who are still in the post-secondary educational system. Interest on loans in-study is fully subsidized by the Government for students in the CSFA Program. Loans in repayment consist of outstanding loans consolidated by students with financial institutions (or the Government).
2.4.1 Guaranteed and Risk-Shared Regimes
The guaranteed and risk-shared regimes apply to loans issued before August 2000. Some loans in these regimes are still outstanding since there are still students under these regimes attending post-secondary institutions or repaying their loans. Table 8 presents the projections of the guaranteed and risk-shared loans owned by financial institutions and by the GovernmentFootnote 5 as well as the loans returned to the Government because of default (principal only). The projection for defaulted loans is shown separately for guaranteed and risk-shared regimes as the latter is necessary to determine when the limit on the aggregate amount of outstanding loans prescribed through the Canada Student Financial Assistance Regulations will be reached, as presented in Table 14 . The guaranteed and risk-shared regimes are gradually being phased out.
At the end of the 2019‑2020 loan year, the sum of all loans coming from the guaranteed and risk-shared regimes that are owned by the Government amounts to approximately $160 million (principal and interest). The Government sets up a separate allowance in the Public Accounts for those loans. This allowance calculation is not included in this report. Expenses related to Guaranteed and Risk-Shared Loans are presented in Table 15 and Table 16 .
| As at July 31 | Loans in Study or Repayment | Loans in Default | Total ($ million) |
||
|---|---|---|---|---|---|
| (with financial institutions)Table Footnote 1 |
(bought back by the Government) |
(Returned to the Government) | |||
| Guaranteed and Risk-Shared ($ million) |
Guaranteed and Risk-Shared ($ million) |
Guaranteed ($ million) |
Risk-Shared ($ million) |
||
| 2020 | 752 | 0 | 50 | 33 | 835 |
| 2021 | 626 | 9 | 39 | 29 | 703 |
| 2022 | 499 | 7 | 28 | 26 | 561 |
| 2023 | 372 | 5 | 19 | 23 | 419 |
| 2024 | 258 | 3 | 12 | 20 | 294 |
| 2025 | 165 | 2 | 7 | 18 | 192 |
| 2026 | 106 | 1 | - | 15 | 123 |
| 2027 | 68 | 1 | - | 13 | 82 |
| 2028 | 44 | 1 | - | 10 | 54 |
| 2029 | 28 | - | - | 7 | 36 |
| 2030 | 18 | - | - | 3 | 22 |
| 2031 | 12 | - | - | 1 | 12 |
| 2032 | 7 | - | - | 0 | 8 |
| 2033 | 0 | - | - | - | 0 |
| 2034 | - | - | - | - | - |
| 2035 | - | - | - | - | - |
Table 8 Footnotes
|
|||||
2.4.2 Direct Loan Regime
The projection of the direct loan portfolio includes the balance of outstanding loans (in-study and in repayment separately) and the balance of loans in default. There are two allowances for bad debt (principal and interest) to cover the risk of future default, net of recoveries, and an allowance for the RAP (principal) to cover the future cost of students benefiting from this program. The projection of the direct loan portfolio and allowances is shown in Table 9 .
| As at July 31 |
Principal only | Allowance for | |||||
|---|---|---|---|---|---|---|---|
| Loans In-Study |
Loans in Repayment |
Defaulted Loans | Total | Bad Debt Principal | Bad Debt Interest | RAP - Principal | |
| ($ million) | ($ million) | ||||||
| 2020 | 8,201 | 11,638 | 2,213 Table Footnote 1 | 22,052 | 2,810 | 238 | 1,717 |
| 2021 | 8,800 | 11,842 | 2,276 | 22,918 | 2,984 | 216 | 2,237 Table Footnote 3 |
| 2022 | 8,299 | 11,878 | 2,649 Table Footnote 2 | 22,826 | 3,105 | 196 | 2,277 |
| 2023 | 8,317 | 11,789 | 2,688 | 22,794 | 3,129 | 153 | 2,300 |
| 2024 | 9,288 | 11,755 | 2,738 | 23,781 | 3,238 | 155 | 2,386 |
| 2025 | 10,068 | 12,033 | 2,778 | 24,879 | 3,351 | 161 | 2,476 |
| 2026 | 10,732 | 12,454 | 2,835 | 26,021 | 3,473 | 174 | 2,578 |
| 2027 | 11,273 | 12,975 | 2,909 | 27,157 | 3,603 | 191 | 2,681 |
| 2028 | 11,695 | 13,600 | 2,951 | 28,246 | 3,692 | 202 | 2,792 |
| 2029 | 12,058 | 14,232 | 2,986 | 29,276 | 3,763 | 210 | 2,890 |
| 2030 | 12,391 | 14,838 | 3,064 | 30,293 | 3,869 | 222 | 2,982 |
| 2031 | 12,683 | 15,418 | 3,154 | 31,255 | 3,980 | 236 | 3,076 |
| 2032 | 12,955 | 15,956 | 3,249 | 32,160 | 4,092 | 250 | 3,171 |
| 2033 | 13,206 | 16,468 | 3,342 | 33,016 | 4,198 | 264 | 3,264 |
| 2034 | 13,434 | 16,950 | 3,433 | 33,817 | 4,300 | 278 | 3,354 |
| 2035 | 13,645 | 17,395 | 3,527 | 34,567 | 4,401 | 292 | 3,441 |
| 2036 | 13,849 | 17,805 | 3,617 | 35,271 | 4,499 | 304 | 3,524 |
| 2037 | 14,062 | 18,189 | 3,704 | 35,955 | 4,594 | 314 | 3,604 |
| 2038 | 14,280 | 18,552 | 3,789 | 36,621 | 4,687 | 323 | 3,679 |
| 2039 | 14,505 | 18,899 | 3,875 | 37,279 | 4,783 | 332 | 3,750 |
| 2040 | 14,738 | 19,234 | 3,964 | 37,936 | 4,883 | 340 | 3,819 |
| 2041 | 14,980 | 19,563 | 4,050 | 38,593 | 4,981 | 348 | 3,886 |
| 2042 | 15,232 | 19,891 | 4,136 | 39,259 | 5,079 | 357 | 3,952 |
| 2043 | 15,492 | 20,223 | 4,219 | 39,934 | 5,176 | 365 | 4,019 |
| 2044 | 15,753 | 20,560 | 4,301 | 40,614 | 5,273 | 372 | 4,086 |
| 2045 | 16,015 | 20,903 | 4,390 | 41,308 | 5,377 | 381 | 4,154 |
Table 9 Footnotes
|
|||||||
The outstanding direct loans portfolio is projected to increase rapidly from $22.1 billion as at 31 July 2020 to $24.9 billion five years later. By the end of the 2044‑2045 loan year, the portfolio is projected to reach $41.3 billion.
As at 31 July 2020, the outstanding direct loan portfolio is $22.1 billion and is retrospectively derived from the experienceFootnote 6 during loan years 2000‑2001 to 2019‑2020 as follow:
| New loans issued | $46.4 billion |
|---|---|
| Plus the interest accrued during the non-repayment periodFootnote 7 | $1.4 billion |
| Minus repaymentsFootnote 8 | $23.6 billion |
| Minus loans forgiven and debt reductions in repaymentFootnote 9 | $0.8 billion |
| Minus defaulted loans written-off | $1.3 billion |
| $22.1 billion |
The remainder of subsection 2.4.2 provides detailed information on the three allowances.
Allowance for Bad Debt – Principal
Table 10 provides the calculation details for the projection of the defaulted loans portfolio and the allowance for bad debt – principal under the direct loan regime.
| Loan Year | Defaulted Loans Portfolio (Principal only) | Allowance for Bad Debt - Principal | |||||||
|---|---|---|---|---|---|---|---|---|---|
| Balance 1 August |
New Defaulted LoansTable Footnote 1 |
Collected Loans | Write-offs | Balance 31 July |
Allowance 1 August |
Write-offs | Allowance 31 July |
Yearly Expense | |
| ($ million) | ($ million) | ||||||||
| (1) | (2) | (3) | (4) | (1+2) - (3+4) | (1) | (2) | (3) | (3) - (1 - 2) | |
| 2019‑2020 | 2,191 | 238 Table Footnote 2 | 78 | 138 | 2,213 | 2,731 | 138 | 2,810 | 217 |
| 2020‑2021 | 2,213 | 268 Table Footnote 2 | 58 | 146 | 2,277 | 2,810 | 146 | 2,984 Table Footnote 3 | 320 |
| 2021‑2022 | 2,276 | 576 Table Footnote 4 | 117 | 87 | 2,648 | 2,984 | 87 | 3,105 | 208 |
| 2022‑2023 | 2,649 | 357 | 129 | 189 | 2,688 | 3,105 | 189 | 3,129 | 213 |
| 2023‑2024 | 2,688 | 343 | 131 | 162 | 2,738 | 3,129 | 162 | 3,238 | 271 |
| 2024‑2025 | 2,738 | 337 | 131 | 165 | 2,779 | 3,238 | 165 | 3,351 | 278 |
| 2025‑2026 | 2,778 | 354 | 133 | 164 | 2,835 | 3,351 | 164 | 3,473 | 286 |
| 2026‑2027 | 2,835 | 370 | 134 | 162 | 2,909 | 3,473 | 162 | 3,603 | 292 |
| 2027‑2028 | 2,909 | 388 | 136 | 210 | 2,951 | 3,603 | 210 | 3,692 | 299 |
| 2028‑2029 | 2,951 | 407 | 138 | 233 | 2,987 | 3,692 | 233 | 3,763 | 304 |
| 2029‑2030 | 2,986 | 426 | 142 | 206 | 3,064 | 3,763 | 206 | 3,869 | 312 |
| 2030‑2031 | 3,064 | 440 | 145 | 205 | 3,154 | 3,869 | 205 | 3,980 | 316 |
| 2031‑2032 | 3,154 | 455 | 150 | 211 | 3,248 | 3,980 | 211 | 4,092 | 323 |
| 2032‑2033 | 3,249 | 468 | 154 | 220 | 3,343 | 4,092 | 220 | 4,198 | 326 |
| 2033‑2034 | 3,342 | 479 | 158 | 230 | 3,433 | 4,198 | 230 | 4,300 | 332 |
| 2034‑2035 | 3,433 | 490 | 163 | 234 | 3,526 | 4,300 | 234 | 4,401 | 335 |
| 2035‑2036 | 3,527 | 500 | 167 | 243 | 3,617 | 4,401 | 243 | 4,499 | 341 |
| 2036‑2037 | 3,617 | 509 | 172 | 250 | 3,704 | 4,499 | 250 | 4,594 | 345 |
| 2037‑2038 | 3,704 | 519 | 176 | 258 | 3,789 | 4,594 | 258 | 4,687 | 351 |
| 2038‑2039 | 3,789 | 528 | 180 | 261 | 3,876 | 4,687 | 261 | 4,783 | 357 |
| 2039‑2040 | 3,875 | 537 | 184 | 264 | 3,964 | 4,783 | 264 | 4,883 | 364 |
| 2040‑2041 | 3,964 | 546 | 188 | 271 | 4,051 | 4,883 | 271 | 4,981 | 369 |
| 2041‑2042 | 4,050 | 555 | 192 | 277 | 4,136 | 4,981 | 277 | 5,079 | 375 |
| 2042‑2043 | 4,136 | 564 | 196 | 286 | 4,218 | 5,079 | 286 | 5,176 | 383 |
| 2043‑2044 | 4,219 | 573 | 199 | 292 | 4,301 | 5,176 | 292 | 5,273 | 389 |
| 2044‑2045 | 4,301 | 583 | 203 | 291 | 4,390 | 5,273 | 291 | 5,377 | 395 |
Table 10 Footnotes
|
|||||||||
The balance of loans in default (principal only) was $2,213 million as at 31 July 2020. The defaulted loans portfolio is projected to reach $4,390 million by the end of the projection period.
As shown in Table 10 , an amount of $138 million was written-off in 2019‑2020. The amount of write-offs in 2020‑2021 is $146 million and includes all the non-recoverable loans that were identified and approved for write-off by ESDC and CRA between July 2019 and June 2020. These write-offs were approved on 30 March 2021, via Royal Assent of Bill C‑26 (Appropriation Act No. 6, 2020‑2021). The decision to write off particular loans is part of a multi-step process inevitably resulting in some volatility in the actual amount written off from year to year.
The allowance for bad debt – principal covers the risk of future defaults, net of recoveries. It is estimated at $2,810 million as at 31 July 2020, which is lower than the $2,829 million projected in the previous report as at 31 July 2019. Projections of the previous report were adjusted to reflect the newest experience available. For the 2019‑2020 loan year, the yearly expense for the allowance for bad debt – principal is $217 million.
The provision rates used to determine the 2020‑2021 allowance are presented below. The ultimate provision rates are presented in Appendix D.
Provision Rates
Allowance as at 31 July 2021
- 6.9% of the outstanding balance of loans in-study;
- 5.2% of the outstanding balance of loans in repayment; and
- 77.4% of the outstanding balance of loans in default.
Allowance for Public Accounts: Provision rates used to determine the allowances for Public Accounts were based on the program's conditions as of 31 March 2021, i.e. without considering any measures announced in Budget 2021.
- 7.0% of the outstanding balance of loans in-study, which is $9,279 million as at 31 March 2021;
- 5.1% of the outstanding balance of loans in repayment, which is $11,958 million as at 31 March 2021; and
- 77.4% of the outstanding balance of loans in default, which is $2,142 million as at 31 March 2021.
- Total allowance as at 31 March 2021: $2,917 million.
Allowance for Bad Debt – Interest
In accordance with the collection practice, interest accrues on defaulted loans until they reach a "non-recoverable" status. A provision is set to cover the risk that such accrued interest will never be recovered. The methodology used is the same as in the previous report. Provision rates are modified to take into account recent experience. The allowance for bad debt – interest is determined using the outstanding interest and a variable provision rate for each year since default. The provision rates are presented in Appendix D (Table 28).
The projection of the balance of interest on defaulted loans is presented in Table 11 .
| Loan Year | Interest on Defaulted Loans | Allowance for Bad Debt - Interest | ||||||||
|---|---|---|---|---|---|---|---|---|---|---|
| Balance August 1 | Interest Transferred in DefaultTable Footnote 1 | Interest Accrued | Interest Collected | Write-offs | Balance July 31 | Allowance August 1 | Write-offs | Allowance July 31 | Yearly expense | |
| ($ million) | ($ million) | |||||||||
| (1) | (2) | (3) | (4) | (5) | (1+2+3) - (4+5) | (1) | (2) | (3) | (3) - (1‑2) | |
| 2019‑2020 | 362 | 10 | 73 Table Footnote 2 | 46 | 41 | 358 | 245 | 41 | 238 | 33 |
| 2020‑2021 | 358 | 5 | 27 Table Footnote 2Table Footnote 3 | 25 | 39 | 325 | 238 | 39 | 216 | 18 |
| 2021‑2022 | 325 | 3 | 0 Table Footnote 3 | 43 | 21 | 265 | 216 | 21 | 196 | 1 |
| 2022‑2023 | 265 | 1 | 21 Table Footnote 3 | 35 | 51 | 200 | 196 | 51 | 153 | 9 |
| 2023‑2024 | 200 | 7 | 72 | 38 | 30 | 212 | 153 | 30 | 155 | 31 |
| 2024‑2025 | 212 | 9 | 80 | 43 | 29 | 229 | 155 | 29 | 161 | 36 |
| 2025‑2026 | 229 | 10 | 87 | 47 | 28 | 251 | 161 | 28 | 174 | 41 |
| 2026‑2027 | 251 | 11 | 91 | 51 | 27 | 274 | 174 | 27 | 191 | 44 |
| 2027‑2028 | 274 | 12 | 94 | 54 | 34 | 292 | 191 | 34 | 202 | 45 |
| 2028‑2029 | 292 | 13 | 98 | 57 | 39 | 307 | 202 | 39 | 210 | 47 |
| 2029‑2030 | 307 | 14 | 104 | 61 | 37 | 327 | 210 | 37 | 222 | 50 |
| 2030‑2031 | 327 | 15 | 110 | 64 | 39 | 348 | 222 | 39 | 236 | 53 |
| 2031‑2032 | 348 | 16 | 117 | 68 | 42 | 370 | 236 | 42 | 250 | 56 |
| 2032‑2033 | 370 | 16 | 123 | 73 | 45 | 392 | 250 | 45 | 264 | 59 |
| 2033‑2034 | 392 | 17 | 130 | 77 | 49 | 413 | 264 | 49 | 278 | 62 |
| 2034‑2035 | 413 | 18 | 134 | 81 | 51 | 433 | 278 | 51 | 292 | 64 |
| 2035‑2036 | 433 | 18 | 137 | 84 | 54 | 450 | 292 | 54 | 304 | 66 |
| 2036‑2037 | 450 | 18 | 140 | 87 | 57 | 465 | 304 | 57 | 314 | 67 |
| 2037‑2038 | 465 | 19 | 144 | 90 | 59 | 479 | 314 | 59 | 323 | 68 |
| 2038‑2039 | 479 | 19 | 147 | 92 | 61 | 491 | 323 | 61 | 332 | 70 |
| 2039‑2040 | 491 | 19 | 150 | 94 | 63 | 503 | 332 | 63 | 340 | 71 |
| 2040‑2041 | 503 | 20 | 153 | 97 | 64 | 515 | 340 | 64 | 348 | 72 |
| 2041‑2042 | 515 | 20 | 156 | 99 | 65 | 527 | 348 | 65 | 357 | 74 |
| 2042‑2043 | 527 | 20 | 159 | 101 | 67 | 538 | 357 | 67 | 365 | 75 |
| 2043‑2044 | 538 | 21 | 162 | 103 | 69 | 549 | 365 | 69 | 372 | 77 |
| 2044‑2045 | 549 | 21 | 165 | 105 | 69 | 561 | 372 | 69 | 381 | 78 |
Table 11 Footnotes
|
||||||||||
When a loan is transferred to the Government after nine months without a payment, it comes with an interest portion that generally represents slightly more than nine months of interest accrued on the defaulted principal transferred. Table 11 shows that $10 million of interest was returned to the Government in the 2019‑2020 loan year, along with the newly defaulted principal portion of the loans. An additional amount of $73 million in interest was accrued during the 2019‑2020 loan year on the principal balance of the recoverable defaulted loans portfolio at the beginning of the loan year.
Once loans are in default, CRA collects money for their repayment on behalf of the program. These collections are first applied to the interest portion of defaulted loans. As such, an amount of $46 million was recovered in the 2019‑2020 loan year.
Finally, when a loan meets certain criteria and has exceeded the six-year limitation period, the interest amounts are also considered for write-off. In the 2019‑2020 loan year, $41 million in interest was written off. As shown in Table 11, the balance of interest in default was $362 million at the beginning of the 2019‑2020 loan year and it decreased to $358 million as at 31 July 2020. The balance of interest in default is projected to increase to $561 million by the end of the projection period.
The allowance for bad debt – interest is estimated at $238 million as at 31 July 2020, which is slightly lower than the $239 million projected in the previous report as at 31 July 2019. Projections of the previous report were adjusted to reflect the newest experience available. For the 2019‑2020 loan year, the yearly expense for the allowance for bad debt – interest is $33 million.
The allowances are determined using provision rates applied to their corresponding outstanding balances of accrued interest according to the year since default. The sets of provision rates for the 2020‑2021 allowances, as well as the ultimate provision rates, are presented in Appendix D. The provision rates used to determine the allowances for Public Accounts were based on the conditions of the program as of 31 March 2021, i.e. without considering any measures announced in Budget 2021. The resulting allowance for Public Accounts as at 31 March 2021 corresponds to $225 million.
Allowance for the Repayment Assistance Plan – Principal
Table 12 provides the calculation details for the projection of the allowance for the Repayment Assistance Plan (RAP) under the direct loan regime.
| Loan Year | Allowance 1 August ($ million) |
RAP Expenses ($ million) |
Allowance 31 July ($ million) |
Yearly Expense ($ million) |
|---|---|---|---|---|
| (1) | (2) | (3) | (3) - (1‑2) | |
| 2019‑2020 | 1,594 | 82 Table Footnote 1 | 1,717 | 205 |
| 2020‑2021 | 1,717 | 149 Table Footnote 1 | 2,237 Table Footnote 2 | 669 |
| 2021‑2022 | 2,237 | 175 | 2,277 | 215 |
| 2022‑2023 | 2,277 | 197 | 2,300 | 220 |
| 2023‑2024 | 2,300 | 193 | 2,386 | 279 |
| 2024‑2025 | 2,386 | 197 | 2,476 | 287 |
| 2025‑2026 | 2,476 | 200 | 2,578 | 302 |
| 2026‑2027 | 2,578 | 208 | 2,681 | 311 |
| 2027‑2028 | 2,681 | 216 | 2,792 | 327 |
| 2028‑2029 | 2,792 | 221 | 2,890 | 319 |
| 2029‑2030 | 2,890 | 226 | 2,982 | 318 |
| 2030‑2031 | 2,982 | 231 | 3,076 | 325 |
| 2031‑2032 | 3,076 | 237 | 3,171 | 332 |
| 2032‑2033 | 3,171 | 245 | 3,264 | 338 |
| 2033‑2034 | 3,264 | 252 | 3,354 | 342 |
| 2034‑2035 | 3,354 | 260 | 3,441 | 347 |
| 2035‑2036 | 3,441 | 269 | 3,524 | 352 |
| 2036‑2037 | 3,524 | 277 | 3,604 | 357 |
| 2037‑2038 | 3,604 | 287 | 3,679 | 362 |
| 2038‑2039 | 3,679 | 297 | 3,750 | 368 |
| 2039‑2040 | 3,750 | 306 | 3,819 | 375 |
| 2040‑2041 | 3,819 | 314 | 3,886 | 381 |
| 2041‑2042 | 3,886 | 321 | 3,952 | 387 |
| 2042‑2043 | 3,952 | 328 | 4,019 | 395 |
| 2043‑2044 | 4,019 | 334 | 4,086 | 401 |
| 2044‑2045 | 4,086 | 340 | 4,154 | 408 |
Table 12 Footnotes
|
||||
Table 12 shows the projection of the allowance for the principal portion of the required payment paid by the Government under Stage 2, including the RAP for borrowers with permanent disabilities (RAP-PD). For the RAP – interest, a provision is determined by ESDC for accounting purposes to take into account the timing of the interest accrued.
As shown in Table 12 , the allowance for the RAP – principal is estimated at $1,717 million as at 31 July 2020, which is higher than the $1,675 million projected in the previous report as at 31 July 2019. The projections of the last report were adjusted to reflect the newest experience available. For the 2019‑2020 loan year, the yearly expense for the allowance for RAP – principal allowance is $205 million.
Budget 2021 proposed to increase the RAP thresholds as well as to decrease the maximum affordable payment, both starting in loan year 2022‑2023. Future assumptions were adjusted to reflect these modifications, which result in more borrowers being eligible for RAP, in addition to a higher share of principal payments to be covered by the Government. Consequently, the 2020‑2021 allowance, which represents future expenses covered by the Government for borrowers in RAP, is projected to increase to $2,237 million as shown in Table 12.
The provision rates used to determine the 2020‑2021 allowance are presented below. The ultimate provision rates are presented in Appendix D.
Provision Rates
Allowance as at 31 July 2021
- 7.1% of the outstanding balance of loans in-study;
- 1.9% of the outstanding balance of loans in repayment (net of loans in the RAP); and
- 34.3% of the outstanding balance of loans in RAP (all stages combined).
Allowance for Public Accounts: Provision rates used to determine the allowances for Public Accounts were based on the program's conditions as of 31 March 2021, i.e. without considering any measures announced in Budget 2021.
- 5.5% of the outstanding balance of loans in-study, which is $9,279 million as at 31 March 2021;
- 1.4% of the outstanding balance of loans in repayment (reduced by loans in the RAP - all stages), which is $7,955 million as at 31 March 2021;
- 28.8% of the outstanding balance of loans in the RAP (all stages), which is $4,003 million as at 31 March 2021.
- Total allowance as at 31 March 2021: $1,775 million.
For comparison purposes, Table 13 shows the direct loan portfolio and allowances in 2020 constant dollars.
| As at July 31 |
Principal only | Allowance for | |||||
|---|---|---|---|---|---|---|---|
| Loans In-study |
Loans in Repayment |
Defaulted Loans | Total | Bad Debt Principal | Bad Debt Interest | RAP - Principal | |
| ($ million) | ($ million) | ||||||
| 2020 | 8,201 | 11,638 | 2,213 | 22,052 | 2,810 | 238 | 1,717 |
| 2021 | 8,664 | 11,658 | 2,241 | 22,563 | 2,938 | 213 | 2,202 |
| 2022 | 8,013 | 11,468 | 2,558 | 22,038 | 2,998 | 189 | 2,198 |
| 2023 | 7,878 | 11,166 | 2,546 | 21,590 | 2,964 | 145 | 2,179 |
| 2024 | 8,634 | 10,927 | 2,545 | 22,106 | 3,010 | 144 | 2,218 |
| 2025 | 9,188 | 10,982 | 2,535 | 22,705 | 3,058 | 147 | 2,260 |
| 2026 | 9,619 | 11,162 | 2,541 | 23,322 | 3,113 | 156 | 2,311 |
| 2027 | 9,926 | 11,424 | 2,561 | 23,911 | 3,172 | 168 | 2,361 |
| 2028 | 10,119 | 11,767 | 2,553 | 24,440 | 3,194 | 175 | 2,416 |
| 2029 | 10,256 | 12,105 | 2,540 | 24,900 | 3,201 | 179 | 2,458 |
| 2030 | 10,363 | 12,409 | 2,562 | 25,334 | 3,236 | 186 | 2,494 |
| 2031 | 10,432 | 12,682 | 2,594 | 25,708 | 3,274 | 194 | 2,530 |
| 2032 | 10,484 | 12,912 | 2,629 | 26,025 | 3,311 | 202 | 2,566 |
| 2033 | 10,516 | 13,114 | 2,661 | 26,292 | 3,343 | 210 | 2,599 |
| 2034 | 10,530 | 13,286 | 2,691 | 26,508 | 3,371 | 218 | 2,629 |
| 2035 | 10,531 | 13,425 | 2,722 | 26,677 | 3,396 | 225 | 2,656 |
| 2036 | 10,526 | 13,532 | 2,749 | 26,807 | 3,419 | 231 | 2,678 |
| 2037 | 10,527 | 13,617 | 2,773 | 26,917 | 3,439 | 235 | 2,698 |
| 2038 | 10,533 | 13,684 | 2,795 | 27,012 | 3,457 | 238 | 2,714 |
| 2039 | 10,543 | 13,737 | 2,817 | 27,097 | 3,477 | 241 | 2,726 |
| 2040 | 10,559 | 13,780 | 2,840 | 27,180 | 3,498 | 244 | 2,736 |
| 2041 | 10,581 | 13,818 | 2,861 | 27,260 | 3,518 | 246 | 2,745 |
| 2042 | 10,609 | 13,854 | 2,881 | 27,344 | 3,538 | 249 | 2,753 |
| 2043 | 10,642 | 13,892 | 2,898 | 27,432 | 3,556 | 251 | 2,761 |
| 2044 | 10,675 | 13,932 | 2,914 | 27,521 | 3,573 | 252 | 2,769 |
| 2045 | 10,707 | 13,975 | 2,935 | 27,617 | 3,595 | 255 | 2,777 |
|
|||||||
2.4.3 Limit on the Aggregate Amount of Outstanding Loans
The Canada Student Financial Assistance Regulations (CSFAR) imposes a limit on the aggregate amount of outstanding loans in the program. The limit was increased from $24 billion to $34 billion in June 2019.
Table 14 presents the projection of the aggregate amount of outstanding loans. It is the sum of :
- Total principal amount of direct loans in study, in repayment and in default;
- Total principal amount of defaulted risk-shared loans returnedFootnote 10 to the Government from financial institutions.
In comparison with Table 8 and Table 9 , which show the projection of the loan portfolio at the end of loan years, Table 14 presents the estimated peak of the portfolio during the loan year. Monthly fluctuations throughout the year cause the aggregate amount of loans to be lower both at the beginning and at the end of the loan year. The peak occurs in the middle of the loan year and is 3% to 5% higher than the aggregate amount at the end of the loan year. Table 9 shows an aggregate amount of outstanding direct loans of $22.1 billion as at 31 July 2020. Table 14 shows that the aggregate amount of outstanding direct loans reached $22.3 billion in January 2020 and $23.9 billion in January 2021.
The projection shows that the $34 billion limit is expected to be reached during the 2032‑2033 loan year if the program's provisions don't change and assumptions materialize.
| Loan Year | Estimated Peak During the Loan Year (January) | Total ($ million) |
|
|---|---|---|---|
| Direct Loans ($ million) |
Risk‑Shared Loans ($ million) |
||
| 2019‑2020 | 22,293 | 35 | 22,328 |
| 2020‑2021 | 23,830 | 31 | 23,861 |
| 2021‑2022 | 23,985 | 28 | 24,013 |
| 2022‑2023 | 24,005 | 24 | 24,029 |
| 2023‑2024 | 24,774 | 21 | 24,795 |
| 2024‑2025 | 25,857 | 19 | 25,876 |
| 2025‑2026 | 27,017 | 16 | 27,033 |
| 2026‑2027 | 28,186 | 14 | 28,200 |
| 2027‑2028 | 29,357 | 11 | 29,368 |
| 2028‑2029 | 30,462 | 8 | 30,470 |
| 2029‑2030 | 31,502 | 5 | 31,507 |
| 2030‑2031 | 32,521 | 2 | 32,523 |
| 2031‑2032 | 33,485 | 0 | 33,485 |
| 2032‑2033 | 34,395 | - | 34,395 |
| 2033‑2034 | 35,252 | - | 35,252 |
| 2034‑2035 | 36,050 | - | 36,050 |
| 2035‑2036 | 36,804 | - | 36,804 |
| 2036‑2037 | 37,531 | - | 37,531 |
| 2037‑2038 | 38,239 | - | 38,239 |
| 2038‑2039 | 38,932 | - | 38,932 |
| 2039‑2040 | 39,622 | - | 39,622 |
| 2040‑2041 | 40,315 | - | 40,315 |
| 2041‑2042 | 41,014 | - | 41,014 |
| 2042‑2043 | 41,722 | - | 41,722 |
| 2043‑2044 | 42,436 | - | 42,436 |
| 2044‑2045 | 43,155 | - | 43,155 |
2.5 Projection of the Net Cost of the Program
2.5.1 Student Related Expenses
The primary expense of the CSFA Program is the cost of supporting students during their study and repayment periods. The student related expenses are presented in Table 15.
| Loan Year | Direct Loan | Risk-Shared and Guaranteed Loans | Canada Student Grants | Total | |||
|---|---|---|---|---|---|---|---|
| Interest Subsidy | RAP - InterestTable Footnote 1 | Provision RAP - Principal | Interest SubsidyTable Footnote 2 | RAP - Interest and Principal | |||
| ($ million) | ($ million) | ($ million) | ($ million) | ||||
| 2019‑2020 | 94.0 | 124.3 | 205.3 | 0.0 | 2.8 | 1,634.8 | 2,061.2 |
| 2020‑2021 | 101.7 Table Footnote 3 | 48.9 Table Footnote 4 | 669.2 | 0.0 | 2.9 | 3,205.5 Table Footnote 5 | 4,028.2 |
| 2021‑2022 | 153.7 | 0.0 Table Footnote 4 | 214.6 | 0.0 | 0.8 | 3,206.7 Table Footnote 5 | 3,575.8 |
| 2022‑2023 | 168.9 | 44.2 Table Footnote 4 | 219.9 | - | 1.5 | 3,219.4 Table Footnote 5 | 3,653.9 |
| 2023‑2024 | 213.1 | 147.8 | 279.9 | - | 2.5 | 1,595.8 | 2,239.1 |
| 2024‑2025 | 263.8 | 164.1 | 287.2 | - | 1.7 | 1,609.0 | 2,325.8 |
| 2025‑2026 | 304.5 | 179.2 | 301.6 | - | 1.1 | 1,627.4 | 2,413.8 |
| 2026‑2027 | 332.7 | 191.1 | 311.6 | - | 0.7 | 1,636.1 | 2,472.2 |
| 2027‑2028 | 370.9 | 204.6 | 326.7 | - | 0.5 | 1,648.8 | 2,551.5 |
| 2028‑2029 | 395.7 | 218.7 | 319.6 | - | 0.3 | 1,661.4 | 2,595.7 |
| 2029‑2030 | 433.1 | 233.2 | 317.0 | - | 0.2 | 1,671.8 | 2,655.3 |
| 2030‑2031 | 457.2 | 248.0 | 324.9 | - | 0.1 | 1,682.9 | 2,713.1 |
| 2031‑2032 | 480.9 | 262.9 | 331.7 | - | 0.0 | 1,693.9 | 2,769.4 |
| 2032‑2033 | 504.4 | 277.8 | 337.4 | - | 0.0 | 1,702.4 | 2,822.0 |
| 2033‑2034 | 527.6 | 292.5 | 342.9 | - | 0.0 | 1,709.1 | 2,872.1 |
| 2034‑2035 | 536.1 | 300.1 | 347.1 | - | - | 1,715.0 | 2,898.3 |
| 2035‑2036 | 544.2 | 307.1 | 351.4 | - | - | 1,723.2 | 2,925.9 |
| 2036‑2037 | 552.5 | 313.8 | 356.9 | - | - | 1,738.2 | 2,961.4 |
| 2037‑2038 | 561.1 | 320.1 | 362.7 | - | - | 1,752.8 | 2,996.7 |
| 2038‑2039 | 569.9 | 326.2 | 368.7 | - | - | 1,768.6 | 3,033.4 |
| 2039‑2040 | 579.0 | 332.0 | 374.8 | - | - | 1,786.1 | 3,071.9 |
| 2040‑2041 | 588.5 | 337.7 | 381.2 | - | - | 1,805.6 | 3,113.0 |
| 2041‑2042 | 598.3 | 343.4 | 387.8 | - | - | 1,826.8 | 3,156.3 |
| 2042‑2043 | 608.5 | 349.1 | 394.5 | - | - | 1,849.3 | 3,201.4 |
| 2043‑2044 | 618.8 | 354.9 | 401.1 | - | - | 1,871.1 | 3,245.9 |
| 2044‑2045 | 629.1 | 360.8 | 407.5 | - | - | 1,893.4 | 3,290.8 |
Table 15 Footnotes
|
|||||||
In the 2019‑2020 loan year, a total of $1,635 million of CSGs were disbursed. It is projected to increase to approximately $3,200 million from 2020‑2021 and 2022‑2023 due to measures announced. Monthly grant amounts are set in the Canada Student Financial Assistance Regulations and are assumed to remain constant for the remaining projection period for the purpose of this evaluation.
2.5.2 Program Risk Expenses
Another expense for the Government corresponds to the risk that loans will never be repaid. This includes the risk of loan default and the risk of loans being forgiven upon a student's death or severe permanent disability. Loans forgiven for family physicians and nurses practicing in under-served rural or remote communities are also included in Table 16 below.
| Loan Year | Direct Loan | Risk-Shared | Guaranteed | Loans Forgiven |
Total | |
|---|---|---|---|---|---|---|
| Provision for Bad Debt | Risk Premium, Put-Backs & Refunds to FIs | Claims for Defaulted Loans | ||||
| Principal | Interest | |||||
| ($ million) | ($ million) | ($ million) | ($ million) | ($ million) | ||
| 2019‑2020 | 217.0 | 33.7 | 0.7 | 0.4 | 38.3 | 290.1 |
| 2020‑2021 | 319.9 | 18.2 | 0.7 | 0.0 | 42.7 | 381.5 |
| 2021‑2022 | 208.0 | 0.7 | 0.6 | 0.0 | 42.7 | 252.0 |
| 2022‑2023 | 213.2 | 8.6 | 0.6 | 0.0 | 40.6 | 263.0 |
| 2023‑2024 | 271.3 | 31.3 | 0.5 | 0.0 | 41.0 | 344.1 |
| 2024‑2025 | 278.1 | 36.3 | 0.4 | 0.0 | 41.8 | 356.6 |
| 2025‑2026 | 285.8 | 40.7 | 0.3 | - | 42.5 | 369.3 |
| 2026‑2027 | 291.9 | 44.3 | 0.3 | - | 43.5 | 380.0 |
| 2027‑2028 | 298.5 | 45.4 | 0.2 | - | 44.5 | 388.6 |
| 2028‑2029 | 305.0 | 47.1 | 0.2 | - | 45.7 | 398.0 |
| 2029‑2030 | 310.9 | 49.9 | 0.1 | - | 46.9 | 407.8 |
| 2030‑2031 | 316.7 | 53.0 | - | - | 48.0 | 417.8 |
| 2031‑2032 | 322.2 | 56.3 | - | - | 49.1 | 427.6 |
| 2032‑2033 | 327.1 | 59.4 | - | - | 50.1 | 436.6 |
| 2033‑2034 | 331.4 | 62.5 | - | - | 51.1 | 445.0 |
| 2034‑2035 | 335.6 | 64.1 | - | - | 52.1 | 451.8 |
| 2035‑2036 | 340.1 | 65.5 | - | - | 53.0 | 458.6 |
| 2036‑2037 | 345.7 | 66.9 | - | - | 53.9 | 466.5 |
| 2037‑2038 | 351.2 | 68.3 | - | - | 54.7 | 474.2 |
| 2038‑2039 | 356.9 | 69.6 | - | - | 55.5 | 482.0 |
| 2039‑2040 | 362.9 | 70.9 | - | - | 56.2 | 490.0 |
| 2040‑2041 | 369.2 | 72.4 | - | - | 57.0 | 498.6 |
| 2041‑2042 | 375.7 | 73.8 | - | - | 57.7 | 507.2 |
| 2042‑2043 | 382.2 | 75.2 | - | - | 58.5 | 515.9 |
| 2043‑2044 | 388.6 | 76.6 | - | - | 59.3 | 524.5 |
| 2044‑2045 | 394.9 | 78.0 | - | - | 60.1 | 533.0 |
Details on the risks to the Government are provided below:
| Direct Loans | Provision for bad debts (principal and interest): Cost of the default risk assumed by the Government in directly disbursing loans to students. |
|---|---|
| Risk-Shared | Risk premium: Amount paid to lending institutions by the Government based on the value of loans consolidating in a year. |
Put-backs and Refunds to financial institutions:
|
|
| Guaranteed | Claims for defaulted loans: the Government bears the entire risk of defaulted loans. |
| Loans Forgiven | Due to death: during the period of study, repayment or after the loan has defaulted. |
| Due to severe permanent disability: As of August 2009, limited to borrowers who, due to their severe permanent disability, are unable to pay their loans and will never be able to repay them. | |
| For doctors and nurses: Portion of loans for family physicians and nurses who practice in under-served rural or remote communities. |
2.5.3 Other Expenses
Alternative payments are made directly to Quebec, the Northwest Territories, and Nunavut, as they do not participate in the CSFA Program. The calculation of alternative payments is based on expenses and revenues for a given loan year and the payment is accounted for in the following loan year.
COVID-19 Pandemic
The alternative payments for loan years 2021‑2022 to 2023‑2024 are significantly higher compared to the prior year mostly due to the doubling of grants as the results of COVID-19 measures implemented to help students.
The administrative expenses include fees paid to the participating provinces and to the Yukon Territory as well as general administrative fees. Fees are paid to the participating provinces and to the Yukon Territory to administer certain aspects of the CSFA Program. Budget 2019 announced increased compensation to participating provinces and territory by $4.0 million per year, starting in 2019‑2020, to compensate for the partner's costs stemming from Budget 2019's proposed changes. The general administrative fees represent the expenses incurred by the departments involved and fees paid to the National Student Loans Service Centre (NSLSC), which is responsible for the administration of student loans and grants. The NSLSC is run by a private entity contracted by the Government. The short-term projection of the administrative fees were provided by ESDC. All collection activities on defaulted loans are fulfilled by CRA and a cost is included in the projected general administrative fees for this purpose.
As shown in Table 17, total expenses associated with the program increase from $3.0 billion in 2019‑2020 to $5.1 billion in 2044‑2045. On average, total expenses are projected to increase at an annual rate of 2.2%.
| Loan Year | Student Related Expenses | Risks to the Government | Alternative PaymentsTable Footnote 1 | Administrative Expenses | Total Expenses |
|
|---|---|---|---|---|---|---|
| Fees Paid to Provinces | General | |||||
| ($ million) | ($ million) | ($ million) | ($ million) | ($ million) | ||
| 2019‑2020 | 2,061.2 | 290.1 | 492.3 | 34.7 | 92.1 | 2,970.4 |
| 2020‑2021 | 4,028.2 | 381.5 | 487.2 | 36.5 | 92.1 | 5,025.5 |
| 2021‑2022 | 3,575.8 | 252.0 | 967.7 | 36.8 | 106.8 | 4,939.1 |
| 2022‑2023 | 3,653.9 | 263.0 | 1,084.6 | 37.1 | 117.9 | 5,156.5 |
| 2023‑2024 | 2,239.1 | 344.1 | 1,028.0 | 37.5 | 118.6 | 3,767.3 |
| 2024‑2025 | 2,325.8 | 356.6 | 600.3 | 38.4 | 120.0 | 3,441.1 |
| 2025‑2026 | 2,413.8 | 369.3 | 628.1 | 39.6 | 126.1 | 3,576.9 |
| 2026‑2027 | 2,472.2 | 380.0 | 661.0 | 40.8 | 136.6 | 3,690.6 |
| 2027‑2028 | 2,551.5 | 388.6 | 689.1 | 42.0 | 140.8 | 3,812.0 |
| 2028‑2029 | 2,595.7 | 398.0 | 725.6 | 43.3 | 145.0 | 3,907.6 |
| 2029‑2030 | 2,655.3 | 407.8 | 755.3 | 44.6 | 149.4 | 4,012.4 |
| 2030‑2031 | 2,713.1 | 417.8 | 792.1 | 45.9 | 153.9 | 4,122.8 |
| 2031‑2032 | 2,769.4 | 427.6 | 818.5 | 47.3 | 158.6 | 4,221.4 |
| 2032‑2033 | 2,822.0 | 436.6 | 843.2 | 48.7 | 163.3 | 4,313.8 |
| 2033‑2034 | 2,872.1 | 445.0 | 864.9 | 50.2 | 168.3 | 4,400.5 |
| 2034‑2035 | 2,898.3 | 451.8 | 883.7 | 51.7 | 173.4 | 4,458.9 |
| 2035‑2036 | 2,925.9 | 458.6 | 892.4 | 53.3 | 178.6 | 4,508.8 |
| 2036‑2037 | 2,961.4 | 466.5 | 897.9 | 54.9 | 184.0 | 4,564.7 |
| 2037‑2038 | 2,996.7 | 474.2 | 902.0 | 56.5 | 189.5 | 4,618.9 |
| 2038‑2039 | 3,033.4 | 482.0 | 907.7 | 58.3 | 195.3 | 4,676.7 |
| 2039‑2040 | 3,071.9 | 490.0 | 910.9 | 60.0 | 201.2 | 4,734.0 |
| 2040‑2041 | 3,113.0 | 498.6 | 913.0 | 61.8 | 207.2 | 4,793.6 |
| 2041‑2042 | 3,156.3 | 507.2 | 915.4 | 63.7 | 213.5 | 4,856.1 |
| 2042‑2043 | 3,201.4 | 515.9 | 918.4 | 65.6 | 219.9 | 4,921.2 |
| 2043‑2044 | 3,245.9 | 524.5 | 924.1 | 67.6 | 226.6 | 4,988.7 |
| 2044‑2045 | 3,290.8 | 533.0 | 930.8 | 69.6 | 233.4 | 5,057.6 |
Table 17 Footnotes
|
||||||
2.5.4 Total Revenue
Interest revenues from the direct loan regime (shown in Table 18 ) include:
- Interest earned from student loans in repayment;
- Interest accrued on defaulted loans; and
- Interest portion of the RAP.
These interest revenues are net of interest on loans forgiven. They are also reduced by the Government's cost of borrowing for loans in repayment and in default (only for the interest accrued expected to be recovered). The difference results in net interest revenues. It is worth noting that the interest on defaulted direct loans is accrued until the status of the loans becomes "non-recoverable".
Under the guaranteed and risk-shared regimes, revenues mainly come from recoveries of principal and interest from defaulted loans owned by the Government. A small portion of revenues are coming from good-standing loans in repayment that were bought back from financial institutions in loan year 2020‑2021.
Total revenues are projected to decrease at an average rate of 2.1% per year over the remaining 25 years of the projection.
| Loan Year | Direct Loan | Risk-SharedTable Footnote 1 | Guaranteed | Total Revenues | ||
|---|---|---|---|---|---|---|
| Interest Revenues | Borrowing Cost | Net Interest Revenues | Principal and Interest from Recovery | Principal and Interest from Recovery | ||
| ($ million) | ($ million) | ($ million) | ($ million) | ($ million) | ||
| 2019‑2020 | 483.1 Table Footnote 2 | -129.8 | 353.3 | 2.3 | 3.7 | 359.3 |
| 2020‑2021 | 188.3 Table Footnote 3,Table Footnote 4 | -149.1 | 39.2 | 2.9 | 3.0 | 45.1 |
| 2021‑2022 | 0.0 Table Footnote 4 | -241.6 | -241.6 | 2.5 | 1.6 | -237.5 |
| 2022‑2023 | 126.7 Table Footnote 4 | -300.3 | -173.6 | 2.2 | 1.1 | -170.3 |
| 2023‑2024 | 421.5 | -284.6 | 136.9 | 2.0 | 0.4 | 139.3 |
| 2024‑2025 | 470.3 | -327.7 | 142.7 | 1.8 | 0.2 | 144.7 |
| 2025‑2026 | 513.3 | -364.4 | 148.9 | 1.5 | 0.0 | 150.4 |
| 2026‑2027 | 547.4 | -392.2 | 155.2 | 1.3 | 0.0 | 156.5 |
| 2027‑2028 | 584.2 | -437.7 | 146.5 | 1.1 | 0.0 | 147.6 |
| 2028‑2029 | 624.7 | -472.3 | 152.4 | 0.8 | - | 153.2 |
| 2029‑2030 | 666.2 | -524.2 | 142.0 | 0.6 | - | 142.6 |
| 2030‑2031 | 711.9 | -561.4 | 150.5 | 0.3 | - | 150.8 |
| 2031‑2032 | 755.1 | -598.6 | 156.5 | 0.0 | - | 156.5 |
| 2032‑2033 | 799.5 | -636.1 | 163.4 | - | - | 163.4 |
| 2033‑2034 | 843.5 | -673.5 | 170.0 | - | - | 170.0 |
| 2034‑2035 | 866.6 | -692.0 | 174.6 | - | - | 174.6 |
| 2035‑2036 | 887.9 | -709.0 | 178.9 | - | - | 178.9 |
| 2036‑2037 | 907.9 | -724.9 | 183.0 | - | - | 183.0 |
| 2037‑2038 | 926.8 | -739.9 | 186.9 | - | - | 186.9 |
| 2038‑2039 | 945.0 | -754.3 | 190.7 | - | - | 190.7 |
| 2039‑2040 | 962.6 | -768.1 | 194.5 | - | - | 194.5 |
| 2040‑2041 | 979.4 | -781.6 | 197.8 | - | - | 197.8 |
| 2041‑2042 | 996.8 | -795.0 | 201.8 | - | - | 201.8 |
| 2042‑2043 | 1,014.0 | -808.5 | 205.4 | - | - | 205.4 |
| 2043‑2044 | 1,031.2 | -822.2 | 209.0 | - | - | 209.0 |
| 2044‑2045 | 1,048.7 | -836.0 | 212.7 | - | - | 212.7 |
Table 18 Footnotes
|
||||||
2.5.5 Net Cost of the Program
Table 19 shows projected total expenses, total revenues, and the total net cost of the program in current dollars for the 25-year projection period, while Table 20 shows the same information expressed in 2020 constant dollars. The expenses and revenues shown correspond to values presented earlier in this report.
| Loan Year | All Regimes | Net Cost of the Program | ||||
|---|---|---|---|---|---|---|
| Total Expenses | Total Revenues | Total Net Cost of the Program |
Changes | Direct Loan | Risk-Shared & Guaranteed | |
| ($ million) | ($ million) | (%) | ($ million) | |||
| 2019‑2020 | 2,970.4 | 359.3 | 2,611.1 | 2,612.3 | -1.3 | |
| 2020‑2021 | 5,025.5 | 45.1 | 4,980.4 | 90.7% | 4,982.3 | -1.8 |
| 2021‑2022 | 4,939.1 | -237.5 | 5,176.6 | 3.9% | 5,179.0 | -2.3 |
| 2022‑2023 | 5,156.5 | -170.3 | 5,326.8 | 2.9% | 5,327.6 | -1.1 |
| 2023‑2024 | 3,767.3 | 139.3 | 3,628.0 | -31.9% | 3,627.2 | 0.7 |
| 2024‑2025 | 3,441.1 | 144.7 | 3,296.4 | -9.1% | 3,296.2 | 0.2 |
| 2025‑2026 | 3,576.9 | 150.4 | 3,426.5 | 3.9% | 3,426.5 | 0.0 |
| 2026‑2027 | 3,690.6 | 156.5 | 3,534.1 | 3.1% | 3,534.4 | -0.3 |
| 2027‑2028 | 3,812.0 | 147.6 | 3,664.4 | 3.7% | 3,664.8 | -0.4 |
| 2028‑2029 | 3,907.6 | 153.2 | 3,754.4 | 2.5% | 3,754.8 | -0.4 |
| 2029‑2030 | 4,012.4 | 142.6 | 3,869.8 | 3.1% | 3,870.0 | -0.3 |
| 2030‑2031 | 4,122.8 | 150.8 | 3,972.0 | 2.6% | 3,972.1 | -0.1 |
| 2031‑2032 | 4,221.4 | 156.5 | 4,064.9 | 2.3% | 4,064.9 | 0.0 |
| 2032‑2033 | 4,313.8 | 163.4 | 4,150.4 | 2.1% | 4,150.4 | 0.0 |
| 2033‑2034 | 4,400.5 | 170.0 | 4,230.5 | 1.9% | 4,230.5 | 0.0 |
| 2034‑2035 | 4,458.9 | 174.6 | 4,284.3 | 1.3% | 4,284.2 | 0.0 |
| 2035‑2036 | 4,508.8 | 178.9 | 4,329.9 | 1.1% | 4,329.9 | - |
| 2036‑2037 | 4,564.7 | 183.0 | 4,381.7 | 1.2% | 4,381.6 | - |
| 2037‑2038 | 4,618.9 | 186.9 | 4,432.0 | 1.1% | 4,432.0 | - |
| 2038‑2039 | 4,676.7 | 190.7 | 4,486.0 | 1.2% | 4,485.8 | - |
| 2039‑2040 | 4,734.0 | 194.5 | 4,539.5 | 1.2% | 4,539.6 | - |
| 2040‑2041 | 4,793.6 | 197.8 | 4,595.8 | 1.2% | 4,595.9 | - |
| 2041‑2042 | 4,856.1 | 201.8 | 4,654.3 | 1.3% | 4,654.4 | - |
| 2042‑2043 | 4,921.2 | 205.4 | 4,715.8 | 1.3% | 4,715.9 | - |
| 2043‑2044 | 4,988.7 | 209.0 | 4,779.7 | 1.4% | 4,779.6 | - |
| 2044‑2045 | 5,057.6 | 212.7 | 4,844.9 | 1.4% | 4,845.0 | - |
As shown in Table 19 , the initial net annual cost for the direct loan regime is $2.6 billion for the 2019‑2020 loan year and is projected to increase to $4.8 billion in the 2044‑2045 loan year. This represents an annual average increase of 2.5% over the entire projection period.
It is important to specify that this net cost includes the amount of CSGs disbursed. The amount of grants disbursed is $1,635 million in 2019‑2020, representing 63% of the net cost in that loan year. It increases from 2020‑2021 to 2022‑2023 due to the doubling of the CSGs announced by the Government in response to COVID-19. Moreover, the net cost also includes yearly expenses to account for provisions that recognize in advance the risk of future losses associated with student loans.
In 2020 constant dollars (Table 20 ), the cost of the direct loan regime increases on average by 0.86% per year, from $2.6 billion at the beginning of the projection period to $3.2 billion at the end of it.
| Loan Year | All Regimes | Net Cost of the Program | |||
|---|---|---|---|---|---|
| Total Expenses | Total Revenues | Total Net Cost of the Program |
Direct Loan | Risk-Shared & Guaranteed | |
| ($ million) | ($ million) | ($ million) | |||
| 2019‑2020 | 2,970.4 | 359.3 | 2,611.1 | 2,612.3 | -1.3 |
| 2020‑2021 | 4,947.6 | 44.4 | 4,903.2 | 4,905.1 | -1.8 |
| 2021‑2022 | 4,768.6 | -229.3 | 4,997.9 | 5,000.2 | -2.2 |
| 2022‑2023 | 4,884.2 | -161.3 | 5,045.5 | 5,046.3 | -1.0 |
| 2023‑2024 | 3,502.0 | 129.5 | 3,372.5 | 3,371.8 | 0.7 |
| 2024‑2025 | 3,140.4 | 132.1 | 3,008.4 | 3,008.2 | 0.2 |
| 2025‑2026 | 3,205.8 | 134.8 | 3,071.0 | 3,071.0 | 0.0 |
| 2026‑2027 | 3,249.5 | 137.8 | 3,111.7 | 3,112.0 | -0.3 |
| 2027‑2028 | 3,298.3 | 127.7 | 3,170.6 | 3,170.9 | -0.3 |
| 2028‑2029 | 3,323.5 | 130.3 | 3,193.2 | 3,193.5 | -0.3 |
| 2029‑2030 | 3,355.6 | 119.3 | 3,236.3 | 3,236.5 | -0.3 |
| 2030‑2031 | 3,391.2 | 124.0 | 3,267.1 | 3,267.2 | -0.1 |
| 2031‑2032 | 3,416.1 | 126.6 | 3,289.4 | 3,289.4 | 0.0 |
| 2032‑2033 | 3,435.2 | 130.1 | 3,305.1 | 3,305.1 | 0.0 |
| 2033‑2034 | 3,449.3 | 133.3 | 3,316.1 | 3,316.1 | 0.0 |
| 2034‑2035 | 3,441.2 | 134.7 | 3,306.4 | 3,306.4 | 0.0 |
| 2035‑2036 | 3,426.8 | 136.0 | 3,290.8 | 3,290.8 | 0.0 |
| 2036‑2037 | 3,417.3 | 137.0 | 3,280.3 | 3,280.3 | - |
| 2037‑2038 | 3,406.9 | 137.9 | 3,269.0 | 3,269.0 | - |
| 2038‑2039 | 3,399.4 | 138.6 | 3,260.8 | 3,260.6 | - |
| 2039‑2040 | 3,391.7 | 139.4 | 3,252.4 | 3,252.4 | - |
| 2040‑2041 | 3,385.9 | 139.7 | 3,246.2 | 3,246.3 | - |
| 2041‑2042 | 3,382.3 | 140.6 | 3,241.7 | 3,241.8 | - |
| 2042‑2043 | 3,380.5 | 141.1 | 3,239.4 | 3,239.5 | - |
| 2043‑2044 | 3,380.5 | 141.6 | 3,238.8 | 3,238.8 | - |
| 2044‑2045 | 3,381.3 | 142.2 | 3,239.1 | 3,239.2 | - |
Table 20 Footnotes
|
|||||
3 Conclusion
The Canada Student Financial Assistance Program (CSFA Program, formerly referred to as Canada Student Loans Program) promotes accessibility to post-secondary education for those who demonstrate financial need by providing grants and loans, thereby encouraging successful and timely completion of post-secondary education. In accordance with section 19.1 of the Canada Student Financial Assistance Act (CSFAA), the Chief Actuary of the Office of the Superintendent of Financial Institutions shall prepare a report on the financial assistance provided under this Act no later than three years apart. The previous statutory Actuarial Report was prepared as at 31 July 2017. This statutory report is prepared as at 31 July 2020.
During the 2019‑2020 loan year, 528,000 students received a Canada Student Grant (CSG) for a total of $1,635 million. Total CSGs are expected to increase to $1,893 million in 2044‑2045.
During the 2019‑2020 loan year, 608,000 students received a loan for a total amount of new loans issued of $3,449 million. The amount of new loans issued is projected to increase to $3,879 million in 2020‑2021. The amount of loans issued is projected to reach $5,772 million in 2044‑2045.
The direct loan portfolio is projected to increase from $22.1 billion as at 31 July 2020 to $41.3 billion in 25 years. According to the projections, the aggregate amount of outstanding student loans is expected to exceed the $34 billion limit in 2032‑2033. The total net cost of the Government's involvement in the CSFA Program, which is the difference between expenses and revenues, is expected to grow from $2.6 billion in 2019‑2020 to $4.8 billion by the end of the projection period.
| Bad Debt – Principal: | $2,917 million |
|---|---|
| Bad Debt – Interest: | $225 million |
| RAP – Principal: | $1,775 million |
COVID-19 Pandemic
More than one year has passed since the beginning of the COVID-19 pandemic. The situation remains fluid and will likely continue to evolve for some time. Several temporary measures were introduced by the Government within the CSFA Program during the 2019‑2020 and 2020‑2021 loan years to alleviate the impact of the pandemic on students and borrowers. Budget 2021 also proposed to extend some of these measures. These measures and their estimated impacts are reflected in the projections of this report. The final impacts of this health and economic crisis will likely generate some differences in the future.
4 Actuarial Opinion
In our opinion, considering that this Actuarial Report on the Canada Student Financial Assistance Program (formerly referred to as Canada Student Loans Program) was prepared pursuant to the Canada Student Financial Assistance Act:
- the data on which this report is based are sufficient and reliable for the purposes of this report;
- the assumptions used are, individually and in aggregate, reasonable and appropriate for the purposes of this report; and
- the methods employed are appropriate for the purposes of this report.
This report has been prepared, and our opinion given, in accordance with accepted actuarial practice in Canada, in particular, the General Standards of the Standards of Practice of the Canadian Institute of Actuaries.
Subsequent events occurred after the valuation date. They consist of upcoming temporary and permanent changes to the program proposed in Budget 2021 and described in Section 2.1. In order to provide projections based on up-to-date information, the changes for which sufficient details were known were considered in this report. However, the allowances determined for Public Accounts as at 31 March 2021 were based on the existing program's conditions as of that date.
Assia Billig, FCIA, FSA
Chief Actuary
Annie St-Jacques, FCIA, FSA
Thierry Truong, FCIA, FSA
Ottawa, Canada
6 July 2021
Appendix A - Summary of Program Provisions
The Canada Student Financial Assistance Program (CSFA Program, formerly referred to as Canada Student Loans Program) came into force on 28 July 1964 to provide Canadians equal opportunity to study beyond the secondary level and to encourage successful and timely completion of post-secondary education. The CSFA Program is meant to supplement resources available to students from their own earnings, their families', and other student awards.
Historically, two successive acts were established to assist qualifying students. The Canada Student Loans Act (CSLA) applied to loan years preceding August 1995 while the subsequent Canada Student Financial Assistance Act (CSFAA) applies to loan years starting after July 1995.
A.1 Eligibility Criteria
In order to be eligible for financial assistance, a student must be a Canadian citizen, permanent resident, protected person within the meaning of the Immigration and Refugee Protection Act or a person registered as an Indian under the Indian Act, and must demonstrate the need for financial assistance, which is determined by the Need Assessment Process under the program. The assessed need is the difference between the student's costs and the student's resources. A student must also fulfill a series of criteria (scholastic standard and financial) to be considered for financial assistance. Each year, upon application with their province of residence, financial assistance is available to full-time students regardless of age, and since 1983, financial assistance is also available to part-time students.
A multi-year student financial assistance agreement was implemented in all jurisdictions starting in the 2013‑2014 loan year. It is referred to as the Master Student Financial Assistance Agreement (MSFAA) and replaces the former single-year student loan agreement. By signing an MSFAA, a borrower agrees to repayment terms that will apply to their loans when they leave their studies.
Since the 2016‑2017 loan year, the value of student-owned vehicles has been eliminated from the student's total resources in the need assessment process in all jurisdictions to better reflect the needs of students who commute or work while studying.
Starting in the 2017‑2018 loan year, the student's resources definition was modified to consider only the student contribution as well as the parental or spousal contribution, if applicable. The student contribution is comprised of the fixed student contribution, merit-based scholarships, need-based bursaries, and targeted resources.
The fixed student contribution depends on the borrower's previous year's gross annual family income, family size and the number of weeks of study. Students with gross family income from the previous year equal to or below a low-income threshold will contribute up to $1,500 per academic year. Students with gross family income from the previous year above a low-income threshold will contribute $1,500 plus an additional 15% of income above the threshold up to a maximum total contribution of $3,000 per academic year. The low-income thresholds vary depending on the student's family size. The previous year's gross family income is defined by the applicable student category. For independent students and single parent, family income is comprised of the student's income only. For dependent students, family income is comprised of the student's parental income only. In the case of a married or common-law student, family income is comprised of the student's and the spouse's or partner's income. Indigenous learners, students with permanent disabilities, students with dependants, and current or former Crown wards, are exempted from the fixed student contribution.
The expected contribution from merit-based scholarships and need-based bursaries is equivalent to the combined assessed actual amount less an exemption of $1,800 per loan year.
Targeted resources are those provided to help with specific educational costs and may include funds received from municipal, provincial, or federal governments (e.g. training allowances from the skills portion of Employment Insurance benefits), or from the private sector (e.g. room and board provided by an employer while a full-time student). They are assessed at 100%.
Parents of single dependent students are expected to contribute to their children's education. The amount of parental contribution depends on family income and size, but do not depend on the living situation of the student.
The spouses and partners of married or common-law students are expected to make a spousal contribution equal to 10% of their gross family income exceeding the low-income thresholds. Spouses and partners at or below the low-income threshold, as well as those who are themselves full-time students, are not expected to make any spousal contribution.
For loan year 2020‑2021, students are not required to make their fixed contribution; no spousal contribution is required either. This temporary measure was introduced by the Government in response to the COVID-19 pandemic.
Partnerships
Since the program's inception in 1964, the Minister entered into an agreement with the participating provinces/territory regarding their powers, duties and functions related to the administration of the program. The participating provinces have their own student financial assistance programs that complement the CSFA Program. On behalf of the Government of Canada, the provinces and territory determine whether students require financial assistance as well as their eligibility for the CSFA Program. Provincial/territorial authorities determine the students' required financial needs based on the difference between their expected expenses and available resources. In general, for each school year, the CSFA Program covers around 60% of the assessed need up to a maximum of $210 per week. For loan year 2020‑2021, this maximum was temporarily increased to $350 per week to help alleviate the effects of the COVID-19 pandemic. The participating provinces and territory complement the CSFA Program by providing additional financial assistance up to established maximum amounts. The amount of money students may borrow depends on their individual circumstances.
The National Student Loans Service Centre (NSLSC) was established on 1 March 2001 and is responsible for the administration of student loans and grants. The NSLSC processes all applicable documentation from loans' disbursement to their consolidation and repayment for the federal portion of the loans, as well as for the provincial portion of integrated loans. It keeps students informed of all available options to assist in repaying their loans. The NSLSC is run by a private entity contracted by the government.
The type of financial arrangement has changed through time and legislation. The following describes the different arrangements and explains who bears the risk associated with default.
- Guaranteed Loan Regime: Student loans provided by lenders (financial institutions) under the Canada Student Loans Act prior to August 1995 were fully guaranteed by the Government to the lenders. The Government reimbursed lenders for the outstanding principal, accrued interest, and costs in the event of default or death of the borrower. Therefore, the Government bore all the risk involved with guaranteed loans.
- Risk-Shared Loan Regime: Between August 1995 and July 2000, student loans continued to be disbursed, serviced and collected by financial institutions; however, the loans were no longer fully guaranteed by the Government. Instead, the Canada Student Financial Assistance Act permitted the Government to pay financial institutions a risk premium of five per cent of the value of loans that consolidated in each loan year. Under this financial arrangement, the Government was not at risk except for the payment of the risk premium. Financial institutions could also decide to sell a certain amount of defaulted loans and the Government had to pay a put-back fee of five cents on the dollar for these loans. Finally, the agreement provided that part of the recoveries be shared with financial institutions.
- Direct Loan Regime: The direct loan arrangement came into force, effective 1 August 2000, following the restructuring of the delivery of the program and the amendments made to the Canada Student Financial Assistance Act and Regulations. Under this regime, the Government issues loans directly to students and bears all the risk involved.
The Government of Canada currently has integration agreements in place with five provinces: Ontario (August 2001), Saskatchewan (August 2001), Newfoundland and Labrador (April 2004), New Brunswick (May 2005), and British Columbia (August 2011). Students in integrated provinces benefit from having one single loan administered through the NSLSC instead of managing two separate loans (federal and provincial).
A.2 Canada Student Grants
Canada Study Grants were introduced in 1995 as non-repayable grants administered by the participating provinces on behalf of the Federal Government. These grants were taxable and assisted students with permanent disabilities, high-need part-time students, women pursuing certain doctoral studies, and students with dependants. Canada Access Grants were then introduced in the 2005‑2006 loan year and included grants for students from low-income families as well as grants for students with permanent disabilities.
The Canada Student Grants (CSGs), implemented in August 2009, provide non-repayable assistance to targeted groups of students, including students from low- and middle-income families, students with permanent disabilities, and students with children under the age of 12. These grants are not taxable.
The CSGs include:
- CSG-FT: a grant of up to $375 per month of study for full-time university undergraduate or college students who fall below the maximum threshold based on family size and income. To be eligible, a student's academic program must be at least two years (60 weeks) in duration.
- CSG-PD: a grant of $2,000 per school year for students with permanent disabilities.
- CSG-PDSE: a grant of up to $20,000 per school year to help cover exceptional education-related costs associated with a student's permanent disability.
- CSG-FTDEP: a grant of up to $200 per month of full-time study based on family size and income, for every dependent child under the age of 12.
- CSG-PT: a grant of up to $1,800 per school year for part-time students who fall below the maximum threshold based on family size and income.
- CSG-PTDEP: a grant of up to $40 per week of study for part-time students with one or two children under 12 years of age and up to $60 per week of study for students with three or more children under 12 years of age, up to a maximum of $1,920 per year. The exact amount payable for each week depends on family size and income.
Grants' amounts are stated in the Canada Student Financial Assistance Regulations. The thresholds and phase-out rates for CSG-FT, CSG-FTDEP, CSG-PT and CSG-PTDEP are based on family size and income and are set out in Schedule 4 of the Regulations.
Starting in the 2018‑2019 loan year, a three-year pilot project provides an additional $200 per month, or $1,600 per standard 8-month academic year, in grants to eligible adult learners returning to school full-time after 10 years have passed since leaving secondary school. This pilot project also makes it easier for students to qualify for grants. Budget 2021 proposed to extend the top-up grant for two additional loan years, up to July 2023, and to make permanent the CSG assessment flexibility that was introduced with the pilot project (i.e. flexibility to use current year's income instead of previous year's income to determine eligibility for CSGs).
In response to the COVID-19 pandemic, the Government announced on 22 April 2020, that the maximum amount for the following grants would be doubled for loan year 2020‑2021: CSG-FT, CSG-PD, CSG-FTDEP, CSG-PT and CSG-PTDEP. Budget 2021 proposed to extend the doubling of the grants for loan years 2021‑2022 and 2022‑2023.
A.3 Loan Benefit
A.3.1 In-study Interest Subsidy
The CSFA Program provides an interest-free loan during the borrower's study period and during the six-month non-repayment period. The benefit takes the form of an in-study interest subsidy. During this period, the Government pays interest (Government's cost of borrowing) on the loan and no payment on the principal is required. Because this interest-free period ends at consolidation and the remaining loan's lifetime is repaid with interest, loans under the CSFA Program are currently not considered as having significant concessionary terms according to the Directive on Accounting Standards (GC 3050 Loans Receivable). This could change in the future if the repayment terms and conditions for student loans changed. Appendix F presents more details.
Since June 2008, members of the Reserve Force who interrupt their program of study to serve on a designated operation are considered full-time students until the last day of the month in which their service ends and, as such, benefit from an extended in-study interest-free period.
As of 1 January 2012, part-time students do not accrue interest on their loans while they are studying. This change occurred to align part-time and full-time loans.
A.3.2 Loan Consolidation
During the first six months following the end of the study period (six-month non-repayment period), all loans previously received by a student are added together and consolidated. No payment is required and, effective on 1 November 2019, student loans no longer accrue interest during this period. With the implementation of the MSFAA, the Canada Student Financial Assistance Regulations were amended to remove the regulatory requirement that borrowers sign a consolidation agreement. Repayment terms are part of the MSFAA and a repayment letter is sent to borrowers upon leaving their studies. The letter provides information on their loans balance, repayment options and available repayment assistance measures. Starting on 1 November 2019, the floating interest rate is lowered to prime, from its previous rate of prime plus 2.5 percentage points. This is the rate chosen by approximately 99 per cent of CSFA Program borrowers. At the same time, the fixed interest rate is lowered to prime (at the time of consolidation) plus 2.0 percentage points, from its previous rate of prime plus 5.0 percentage points.
Students must provide their financial institution or the NSLSC with a proof of enrolment for each study period in which they are enrolled even if they are not applying for a new loan. This prevents an automatic consolidation from occurring while they are still in school and it prevents interest from accruing on the loan.
Budget 2019 also proposed more flexibility for borrowers who take a temporary leave from their studies for medical or parental reasons, including mental health leaves. Borrowers will be eligible for an interest-free and payment-free leave for a maximum of 18 months. This change was implemented on 1 October 2020.
On 18 March 2020, the Government announced that due to the COVID-19 pandemic, loan repayments would be suspended and interest would cease to accumulate between 30 March 2020 and 30 September 2020. In addition, Bill C-14 waived the interest accrual on student loans for fiscal year 2021‑2022 and Budget 2021 proposed to extend this waiver for one more year, up to 31 March 2023.
A.3.3 Repayment Assistance
In 1983, the Government introduced a repayment assistance measure in the form of an Interest Relief to assist students experiencing financial difficulty repaying their loan. The Government assumed the responsibility for making interest payments on the outstanding loan and no principal payments were required. This measure was improved over time. Between 1998 and 2009, a borrower in financial difficulty could be awarded a total of 30 months of Interest Relief during the repayment period. If the borrower was still within five years from the end of studies when the 30 months ended, he could be awarded an additional 24 months of Interest Relief. In determining eligibility for Interest Relief, a borrower's monthly family income had to fall below an established income threshold in relation to the loan's required monthly payment.
In 1998, the Government introduced the Debt Reduction in Repayment (DRR) measure to help students who remained in financial difficulty after all possible Interest Relief measures had been exhausted. Between 2005 and 2009, the principal loan reductions corresponded to two reductions of up to $10,000 each and a third reduction of up to $6,000. To determine whether the previous reduction had resulted in a manageable debt level, twelve months had to have elapsed between each reduction.
Starting in loan year 2009‑2010, the Repayment Assistance Plan (RAP) replaced the Interest Relief and DRR measures. The RAP is designed to make it easier for borrowers to manage their debt by calculating affordable payments ($0 for those under the established minimum income threshold, or from 1% to 20% of family income for those above the established minimum income threshold) based on family income and family size. Therefore, the affordable payment formula ensures no borrower pays more than 20% of their gross income towards their student loan debt. Borrowers are deemed eligible for the RAP for a six-month period if their affordable payment is less than their required monthly payment. The RAP is composed of two stages to help borrowers fully repay their loan within a maximum of 15 years of leaving school (or 10 years for borrowers with a permanent disability).
At the beginning of loan year 2016‑2017, the RAP income thresholds were increased to ensure that students would not be required to repay their student loan until they earned at least $25,000 per year ($25,000 being the threshold for a single student with no dependants, which scales up based on family size).
Under Stage 1, the required monthly payment is determined by amortizing a borrower's outstanding principal amount over a period that ends 120 months after leaving school. The borrower's monthly affordable payment, if any, goes directly towards the loan principal first, and then the interest, while the Government covers any interest amount not covered by the affordable payment. The principal portion of the loan not covered by the affordable payment is deferred. Stage 1 can last for a maximum of five years in cumulative six-month periods.
Stage 2 is available to borrowers who continue to experience financial difficulty after Stage 1 has been exhausted and to those whose loan has been in repayment for more than 10 years. Under Stage 2, the required payment is calculated by amortizing the outstanding principal between the start date of Stage 2 and the date corresponding to 15 years after the borrower left school (10 years for borrowers with a permanent disability). The Government covers both the required principal amount and the interest amount not covered by the borrower's affordable payment such that the student loan is repaid in full within 15 years (10 years for borrowers with a permanent disability) of the borrower leaving school.
Budget 2019 proposed to expand the eligibility for loan rehabilitation after a borrower defaults on their student loan. This change is effective on 1 January 2020. Financially vulnerable borrowers in default could access support such as the Repayment Assistance Plan and begin making affordable payments on their outstanding debt again.
Borrowers with a permanent disability who are not eligible for the Severe Permanent Disability Benefit have access to the RAP-PD. Additional expenses related to costs faced by permanently disabled borrowers are taken into account in the income calculation when they apply for RAP-PD. Similar to all borrowers in RAP Stage 2, additional student loans or grants are not available under RAP-PD until existing loans are paid in full. However, interest-free status may be available for existing loans if the borrower returns to school.
Budget 2019 proposed to remove the existing restriction that states that borrowers with a permanent disability are no longer eligible for additional loans and grants if they have been out of study for five years and have used the Repayment Assistance Plan. This modification took effect in the 2020‑2021 loan year.
Budget 2021 proposed to increase the thresholds for the RAP starting in loan year 2022‑2023. The threshold for borrowers living alone will increase to $40,000 while thresholds for borrowers from larger households will be modified to match the Canada Student Grants thresholds, which increase with inflation. Additionally, the cap on monthly RAP student loan payments will be reduced from 20 per cent of household income to 10 per cent.
A.3.4 Loan Forgiveness
The Minister has the authority, upon application and qualification, to forgive a loan in the event of a borrower's severe permanent disability or death while in school or during the repayment period. Effective 1 August 2009, in order for a borrower's loan to be forgiven due to a permanent disability, the Minister must be satisfied that the borrower's condition respects the definition of "severe permanent disability", is unable to repay the student loan, and will never be able to repay it.
Effective 1 January 2013, a portion of student loans allocated to family physicians (including residents in family medicine programs), nurses and nurse practitioners who work during a year in an under-served rural or remote community can be forgiven for that year. Qualifying family physicians are eligible for up to $8,000 of loan forgiveness per year to a maximum of $40,000 over five years. Qualifying nurses are eligible for up to $4,000 (of loan forgiveness) per year to a maximum of $20,000 over five years. Qualifying participants who started their current employment in under-served communities on or after 1 July 2011, and who complete a year of work (starting on or after 1 April 2012), are eligible for loan forgiveness.
Budget 2019 proposed to expand the eligibility for the Severe Permanent Disability Benefit making it possible for more student borrowers with severe permanent disabilities to qualify for loan forgiveness. This modification took effect in the 2019‑2020 loan year.
Appendix B - Data
The input data required with respect to direct loans were extracted from data files provided by Employment and Social Development Canada (ESDC).
B.1 Direct Loans Issued
Table 21 presents information extracted from ESDC's data files on the amount of direct loans issued and the number of students for loan years 2000‑2001 to 2019‑2020. According to the Monthly Financial Information Schedule (MFIS), the total amount of loans issued in 2019‑2020 rounded to the million was $3,449, which is identical to the value calculated using the data file. These data were found to be complete.
| Loan Year | Amount of Loans Issued ($ million) |
Number of Students |
|---|---|---|
| 2000‑2001 | 1,573 | 343,746 |
| 2001‑2002 | 1,507 | 328,671 |
| 2002‑2003 | 1,549 | 331,042 |
| 2003‑2004 | 1,648 | 342,264 |
| 2004‑2005 | 1,633 | 339,204 |
| 2005‑2006 | 1,936 | 345,549 |
| 2006‑2007 | 1,916 | 344,214 |
| 2007‑2008 | 2,004 | 353,548 |
| 2008‑2009 | 2,071 | 366,145 |
| 2009‑2010 | 2,088 | 403,566 |
| 2010‑2011 | 2,225 | 427,054 |
| 2011‑2012 | 2,412 | 450,246 |
| 2012‑2013 | 2,583 | 477,394 |
| 2013‑2014 | 2,721 | 497,636 |
| 2014‑2015 | 2,723 | 495,297 |
| 2015‑2016 | 2,722 | 496,998 |
| 2016‑2017 | 2,627 | 497,045 |
| 2017‑2018 | 3,352 | 592,091 |
| 2018‑2019 | 3,575 | 625,135 |
| 2019‑2020 | 3,449 | 607,861 |
B.2 Direct Loans Consolidated
Table 22 presents the amount of consolidated direct loans, the amounts that were reversed due to students returning to school and the accrued interest during the six-month non-repayment period according to the MFIS. These data closely match consolidations from individual data for the most recent years. It was observed that reversals (students returning to school) generally occur in the same loan year as consolidation or the year after.
| Loan Year | Amounts from the MFIS | |||
|---|---|---|---|---|
| Consolidations | Reversal | Interest Accrued | Total Amount ConsolidatedTable footnote 1 | |
| ($ million) | ||||
| (1) | (2) | (3) | (1) - (2) + (3) | |
| 2000‑2001 | 65.7 | 4.1 | 0.7 | 62.2 |
| 2001‑2002 | 901.0 | 154.9 | 26.0 | 772.2 |
| 2002‑2003 | 1,211.9 | 262.7 | 39.6 | 988.8 |
| 2003‑2004 | 1,434.3 | 326.6 | 43.7 | 1,151.4 |
| 2004‑2005 | 1,632.6 | 388.4 | 52.6 | 1,296.7 |
| 2005‑2006 | 1,720.0 | 435.4 | 61.8 | 1,346.4 |
| 2006‑2007 | 1,936.3 | 499.8 | 82.7 | 1,519.3 |
| 2007‑2008 | 2,100.8 | 571.8 | 90.4 | 1,619.3 |
| 2008‑2009 | 2,187.5 | 638.2 | 74.8 | 1,624.0 |
| 2009‑2010 | 2,302.3 | 703.3 | 54.9 | 1,654.0 |
| 2010‑2011 | 2,464.8 | 762.0 | 65.3 | 1,768.1 |
| 2011‑2012 | 2,580.8 | 799.9 | 72.1 | 1,852.9 |
| 2012‑2013 | 2,684.9 | 801.3 | 75.0 | 1,958.6 |
| 2013‑2014 | 2,797.6 | 788.3 | 78.8 | 2,088.2 |
| 2014‑2015 | 2,909.9 | 797.6 | 82.0 | 2,194.3 |
| 2015‑2016 | 3,034.1 | 852.6 | 81.7 | 2,263.2 |
| 2016‑2017 | 3,082.9 | 904.2 | 83.6 | 2,262.2 |
| 2017‑2018 | 3,072.5 | 963.8 | 88.3 | 2,197.0 |
| 2018‑2019 | 3,396.2 | 966.0 | 110.0 | 2,540.2 |
| 2019‑2020 | 3,723.7 | 983.5 | 85.7 Table footnote 2 | 2,825.9 |
Table Footnotes
|
||||
B.3 Defaults and Recoveries for Direct Loans
Table 23 shows the main items of the defaulted loans portfolio (principal only). This information is extracted from ESDC's data files.
- Defaults: amount of loans transferred to the Government in each loan year after nine months without a payment;
- Account adjustments: loans recalled and financial adjustments made by ESDC;
- Rehabilitations: amount of loans rehabilitated under certain criteria;
- Recoveries: payments recovered by the CRA from borrowers in default;
- Write-offs: amounts approved for write-off when a loan meets certain criteria and has exceeded the limitation period.
Adjustments, rehabilitations, recoveries and write-offs shown in Table 23 represent the amounts recorded in each loan year, regardless of the time of default. For example, in the 2019‑2020 loan year, there were $78.3 million in recoveries. This amount includes recoveries for loans that could have been transferred in default in any loan year between 2000‑2001 and now.
Table 23 shows that the balance of the portfolio in default is $2,213.0 million as at 31 July 2020 based on the information extracted from the data file. There is a difference between the balance determined in the DARS data file received and the balance shown in the "Detailed Age Analysis by Account Status" table provided by ESDC. As at 31 March 2021, this difference is about $4.8 million ($2,146.8 million in DARS and $2,142.0 million in the "Detailed Age Analysis" table), which represents 0.2%.
| Loan Year | Defaults | Account Adjustments | Rehabilitated | Net Defaults | Recoveries | Write-Offs | Balance |
|---|---|---|---|---|---|---|---|
| ($ million) | ($ million) | ($ million) | |||||
| (1) | (2) | (3) | (4)=(1)-(2)-(3) | (5) | (6) | (7) = Previous year's balance + (4)-(5)-(6) | |
| 2000‑2001 | 5.3 | - | - | 5.3 | 0.3 | - | 5.0 |
| 2001‑2002 | 5.0 | - | 0.1 | 4.9 | 0.7 | - | 9.1 |
| 2002‑2003 | 244.3 | 0.6 | 17.5 | 226.2 | 23.8 | - | 211.6 |
| 2003‑2004 | 265.9 | 12.4 | 3.1 | 250.4 | 48.8 | - | 413.1 |
| 2004‑2005 | 364.4 | 19.0 | 2.2 | 343.2 | 83.0 | - | 673.3 |
| 2005‑2006 | 275.6 | 12.3 | 7.8 | 255.5 | 85.6 | - | 843.2 |
| 2006‑2007 | 257.7 | 8.7 | 5.8 | 243.2 | 83.7 | 0.2 | 1,002.5 |
| 2007‑2008 | 303.4 | 11.1 | 5.0 | 287.4 | 91.8 | 0.3 | 1,197.8 |
| 2008‑2009 | 308.3 | 8.7 | 7.0 | 292.6 | 85.4 | - | 1,404.9 |
| 2009‑2010 | 301.2 | 6.1 | 10.9 | 284.3 | 81.1 | - | 1,608.2 |
| 2010‑2011 | 335.2 | 6.4 | 18.0 | 310.8 | 92.8 | - | 1,826.2 |
| 2011‑2012 | 382.8 | 6.9 | 34.9 | 341.0 | 99.3 | 220.9 | 1,847.0 |
| 2012‑2013 | 353.4 | 5.9 | 31.4 | 316.1 | 105.0 | 167.6 | 1,890.5 |
| 2013‑2014 | 372.9 | 12.5 | 39.0 | 321.3 | 113.0 | - | 2,098.8 |
| 2014‑2015 | 357.6 | 6.3 | 39.3 | 312.0 | 120.2 | 218.0 | 2,072.6 |
| 2015‑2016 | 346.0 | 2.0 | 40.9 | 303.1 | 118.5 | 131.7 | 2,125.9 |
| 2016‑2017 | 350.4 | 2.6 | 73.8 | 274.1 | 114.8 | 136.1 | 2,149.1 |
| 2017‑2018 | 340.6 | -0.9 | 73.6 | 267.9 | 113.7 | 155.1 | 2,148.3 |
| 2018‑2019 | 353.1 | 2.1 | 67.7 | 283.3 | 114.5 | 126.1 | 2,191.0 |
| 2019‑2020 | 306.3 | 1.9 | 65.9 | 238.5 | 78.3 | 138.2 | 2,213.0 |
B.4 Repayment Assistance Plan
The Repayment Assistance Plan (RAP) was implemented in August 2009. Detailed data files by applicant are available. The data files received were found to be complete and have been used to update the assumptions for the utilization rates (both entrance and continuation) for each stage. Table 24 presents the RAP expenses split by stage as found in the MFIS as well as the totals calculated from the data files. Those expenses correspond to the portion of the monthly payments covered by the Government for all borrowers in the RAP.
| Loan Year | Principal Payments | ||||
|---|---|---|---|---|---|
| MFIS | Data Files | ||||
| Stage 2 | PD | Total | Total | ||
| ($ million) | ($ million) | ||||
| 2009‑2010 | 3.3 Table footnote 1 | 1.2 | 4.4 Table footnote 1 | 2.8 | |
| 2010‑2011 | 2.9 | 6.1 | 8.9 | 10.2 | |
| 2011‑2012 | 6.3 | 11.7 | 18.1 | 17.1 | |
| 2012‑2013 | 11.1 | 12.9 | 24.0 | 24.3 | |
| 2013‑2014 | 16.7 | 15.5 | 32.2 | 32.7 | |
| 2014‑2015 | 25.5 | 20.2 | 45.7 | 44.1 | |
| 2015‑2016 | 33.8 | 23.4 | 57.2 | 56.2 | |
| 2016‑2017 | 45.8 | 28.9 | 74.7 | 73.3 | |
| 2017‑2018 | 59.0 | 31.4 | 90.4 | 90.0 | |
| 2018‑2019 | 70.1 | 34.5 | 104.5 | 103.9 | |
| 2019‑2020 | 56.6 | 25.6 | 82.2 | 81.6 | |
| Loan Year | Interest Payments | ||||
| MFIS | Data Files | ||||
| Stage 1 | Stage 2 | PD | Total | Total | |
| ($ million) | ($ million) | ||||
| 2009‑2010 | 67.5 Table footnote 2 | 0.5 | 0.7 | 68.7 (2) | 73.7 |
| 2010‑2011 | 82.7 | 1.8 | 3.0 | 87.5 | 87.6 |
| 2011‑2012 | 94.1 | 3.9 | 5.8 | 103.8 | 101.9 |
| 2012‑2013 | 106.1 | 6.5 | 6.1 | 118.7 | 119.3 |
| 2013‑2014 | 119.2 | 9.3 | 6.8 | 135.3 | 139.1 |
| 2014‑2015 | 131.3 | 12.9 | 8.5 | 152.7 | 153.9 |
| 2015‑2016 | 137.8 | 15.4 | 9.3 | 162.5 | 164.0 |
| 2016‑2017 | 154.3 | 19.2 | 11.1 | 184.7 | 182.3 |
| 2017‑2018 | 182.2 | 27.0 | 13.6 | 222.8 | 219.4 |
| 2018‑2019 | 199.3 | 34.6 | 16.6 | 250.5 | 245.3 |
| 2019‑2020 | 96.8 | 18.9 | 8.6 | 124.3 | 125.3 |
Table Footnotes
|
|||||
Appendix C - Portfolio Reconciliation
In the previous statutory Actuarial Report prepared as at 31 July 2017 (AR 2017), the expected total direct loans portfolio as at 31 July 2020 was projected at $21.6 billion. The actual portfolio as at 31 July 2020 is close to what was previously expected and corresponds to $22.1 billion. Table 25 shows a reconciliation of the loan portfolio by loan status.
| Effect on the Portfolio | ||
|---|---|---|
| Loans In Study | ($ million) | |
| Expected Loans In Study as at 31 July 2020 (AR 2017) | 8,430 | |
| Experience in loan years 2017‑2018 to 2019‑2020 compared with projections | ||
| Higher Loans Issued | + | 281 |
| Higher Loans Consolidated | - | 268 |
| Higher Prepayments | - | 242 |
| Total Effect | - | 229 |
| Actual Loans In Study as at 31 July 2020 (AR 2020) | 8,201 | |
| Loans In Repayment | ||
| Expected Loans In Repayment as at 31 July 2020 (AR 2017) | 10,987 | |
| Experience in loan years 2017‑2018 to 2019‑2020 compared with projections | ||
| Higher Loans Consolidated | + | 268 |
| Lower Interest Capitalized During the non-repayment period Table footnote 1 | - | 8 |
| Lower Repayments from Students Table footnote 2 | + | 266 |
| Lower Defaults | + | 99 |
| Lower RAP-Stage 2 Payments Table footnote 2 | + | 32 |
| Higher Loans Forgiven | - | 6 |
| Total Effect | + | 651 |
| Actual Loans In Repayment as at 31 July 2020 (AR 2020) | 11,638 | |
| Loans In Default | ||
| Expected Loans In Default as at 31 July 2020 (AR 2017) | 2,219 | |
| Experience in loan years 2017‑2018 to 2019‑2020 compared with projections | ||
| Lower Defaults | - | 99 |
| Lower Principal Recoveries Table footnote 2 | + | 20 |
| Lower Write-Offs Table footnote 2 | + | 73 |
| Total Effect | - | 6 |
| Actual Loans In Default as at 31 July 2020 (AR 2020) | 2,213 | |
| Total Expected Portfolio as at 31 July 2020 (AR 2017) | 21,636 | |
| Total Actual Portfolio as at 31 July 2020 (AR 2020) | 22,052 | |
Table Footnotes
|
||
The actual total portfolio as at 31 July 2020 is 2% higher than expected in the previous statutory report. This increase is due to higher than expected new loans issued for loan years between 2017‑2018 and 2019‑2020 as well as lower than expected repayments, recoveries and write-offs resulting from the six-month pause measure in response to COVID-19. It was partially offset by higher than expected prepayments.
Appendix D - Assumptions and Methodology
D.1 Growth of Total Loans Issued
The growth of total loans issued varies based on the number of students receiving a loan through the CSFA Program, the evolution of students' needs and the loan limit.
D.1.1 Evolution of Number of Students Receiving a Loan
The number of students in the CSFA Program is affected by the demographic evolution of the population, the post-secondary enrolment and the loan uptake rate.
D.1.1.1 Demographic Projections
Demographic projections are based on the population projected in the 30th Actuarial Report on the Canada Pension Plan as at 31 December 2018. More specifically, it starts with the Canadian and Québec populations on 1 July 2018, to which future fertility, mortality and migration assumptions are applied. The Canadian population is adjusted to exclude the non-participating province of Québec as well as the Northwest Territories, Nunavut, and non-permanent residents. The CPP population projections are essential in determining the future number of students expected to pursue a post-secondary education.
D.1.1.2 Post-secondary Enrolment
The number of students enrolled full-time in post-secondary institutions is separated by labour force status (in or not in the labour force), age group, gender and institution type (whether students attend university, a public college or a private college). Since international students are not eligible to participate in the CSFA Program, they are excluded from the enrolment numbers.
For each sub-group, historical enrolment data and recent enrolment trends are analyzed. From these, expected future enrolment rates are determined. The future enrolment rates are then multiplied with the corresponding population subset (in or not in the labour force) to determine the expected number of students enrolled full-time.
Table 26 presents full-time post-secondary enrolment rates by age group, separated according to their labour force status, for loan years 2019‑2020, 2029‑2030 and 2044‑2045. In 2019‑2020, 47% of students aged 15 to 29 who were enrolled full-time in post-secondary institutions were also participating in the labour force while 53% of them were not participating in the labour force.
| 2019‑2020 | 2029‑2030 | Change in Enrolment | 2044‑2045 | Change in Enrolment | ||
|---|---|---|---|---|---|---|
| (1) | (2) | (2)/(1)-1 | (3) | (3)/(1)-1 | ||
| (%) | (%) | (%) | (%) | (%) | ||
| In Labour Force (Represents 47% of total enrolment 15‑29 in 2019‑2020) |
15-19Table footnote 1 | 18.7 | 22.7 | 21.6 | 22.7 | 21.6 |
| 20‑24 | 24.4 | 25.8 | 5.9 | 25.8 | 5.7 | |
| 25‑29 | 4.9 | 4.9 | -0.2 | 4.9 | -0.1 | |
| 15‑29 | 14.7 | 16.4 | 12.1 | 16.5 | 12.6 | |
| Not In Labour Force (Represents 53% of total enrolment 15‑29 in 2019‑2020) |
15-19Table footnote 1 | 24.5 | 27.1 | 10.3 | 27.1 | 10.2 |
| 20‑24 | 78.4 | 72.2 | -8.0 | 72.1 | -8.1 | |
| 25‑29 | 24.5 | 24.7 | 0.7 | 24.7 | 0.8 | |
| 15‑29 | 39.1 | 39.2 | 0.2 | 39.1 | 0.1 | |
| Total Enrolment Over Population 15‑29 | 15-19Table footnote 1 | 21.7 | 24.9 | 14.6 | 24.8 | 14.2 |
| 20‑24 | 37.7 | 37.3 | -1.2 | 36.7 | ‑2.6 | |
| 25‑29 | 7.9 | 7.7 | -3.1 | 7.4 | -6.6 | |
| 15‑29 | 22.0 | 23.1 | 5.4 | 22.9 | 4.4 | |
Table Footnote
|
||||||
Over the projection period, the enrolment rate for students in the labour force is expected to increase more than the enrolment rate for students not in the labour force.
D.1.1.3 Loan Uptake Rate
The loan uptake is projected based on the type of educational institution (university, public college or private college). A trend is defined for each group based on historical data, current socio-economic conditions and the future expected mix of the student population.
The number of students in the CSFA Program is determined by multiplying the number of students enrolled full-time by the loan uptake.
D.1.2 Evolution of Student Need
ESDC provided CSFA Program need assessment data for loan year 2018‑2019. The CSFA Program generally provides 60% of the total assessed need, while the participating province or territory of residence provides the remaining 40%. If a student is eligible for a grant, the amount received as a grant reduces the calculated need, resulting in a net need. The projected annual net need increases come from the projected increases in expenses (tuition, compulsory fees and other expenses) partially offset by the projected increases in resources and grants. These net need increases are calculated separately for each group (university, public college and private college students) over the 25-year projection period.
D.1.2.1 Tuition
Tuition fees are, in part, determined by government policies. Thus, they are projected using provincial and/or university budgets, along with recent and historical experience of tuition fee increases. The short-term projected increases in tuition fees are shown in Table 27.
| Province | Weight (%) |
2020‑2021Table footnote 1 (%) |
2021‑2022Table footnote 2 (%) |
2022‑2023Table footnote 3 (%) |
2023‑2024Table footnote 3 (%) |
|---|---|---|---|---|---|
| Newfoundland | 1.2 | 2.1 | 0.0 | 4.0 | 4.0 |
| Prince Edward Island | 0.4 | 1.9 | 1.0 | 2.0 | 2.0 |
| Nova Scotia | 4.1 | 3.3 | 3.0 | 3.0 | 3.0 |
| New Brunswick | 2.4 | 3.1 | 3.0 | 3.0 | 3.0 |
| Ontario | 61.5 | 0.1 | 0.0 | 4.0 | 4.0 |
| Manitoba | 2.1 | 4.6 | 3.8 | 3.8 | 3.8 |
| Saskatchewan | 2.9 | 5.7 | 4.0 | 4.0 | 4.0 |
| Alberta | 14.4 | 7.0 | 7.0 | 7.0 | 7.0 |
| British Columbia | 11.0 | 2.0 | 2.0 | 2.0 | 2.0 |
| Weighted Average | 1.8 | 1.6 | 4.1 | 4.1 | |
Table Footnotes
|
|||||
Long-term estimates of tuition are based on past increases in tuition relative to increases in inflation. Loan year 2019‑2020 represented an outlier point in terms of tuition increase due to the 10% decrease in tuition enacted by the Ontario Government. Therefore, it was excluded in the calculations of historical average increases. Over the 10 year period ending in 2018‑2019, tuition increases have been, on average, close to inflation plus 1.9%, while over the 15 year period ending in 2018‑2019, they have been close to inflation plus 1.6%. Therefore, the 4.1% tuition increase for 2023‑2024 is graded to reach the inflation increase plus 1.75% by 2028‑2029.
The starting point for the 2018‑2019 tuition fees is calculated from the need assessment data file and represents the average tuition fees for students who received a loan. Tuition fees were calculated for each of the three student groups (university, public college and private college) and a weighted average was determined based on the number of students in each group. This calculation resulted in a tuition fee estimate of $8,800 for loan year 2018‑2019. The estimated weighted average tuition fees (including compulsory fees) for 2019‑2020 are $8,400 based on an annual tuition decrease of 5.2%.
D.1.2.2 Other Expenses
Other expenses are considered to be any student expense other than tuition fees. These expenses include books, shelter, food, clothing and transportation and are assessed by the participating provinces and territory. The average expense is calculated from the need assessment data file and represents the average expenses for students who receive a loan. The estimated average for other expenses is $12,500 for loan year 2018‑2019; it increases to $12,700 in loan year 2019‑2020 based on an inflation increase of 1.3%.
D.1.2.3 Student Resources
Student resources include student, parental and spousal contributions. Increased resources reduce the maximum loan available to students through the need analysis. Student need is summarized in Table 6 of the Main Report.
The starting point for average resources in 2018‑2019 is calculated from the need assessment data file and represents the average resources for students who received a loan. The salary portion of average resources is then projected using the wage increase assumption, while the standard of living used to determine the parental contribution is projected using the inflation assumption. As such, the estimated student average resources is $3,200 for 2019‑2020. This amount decreases to $1,700 in loan year 2020‑2021 due to the removal of the fixed student contribution and of the spousal contribution for that year. In loan year 2021‑2022, it increases back to $3,400.
D.2 Consolidation
Under the direct loan regime, loans are assumed to consolidate according to the distribution of consolidation by year shown in Chart 1 over a period of fifteen years after a loan is issued. This distribution is built using the experience of direct loan consolidations.
Each year, some borrowers having previously consolidated their student loans choose to return to school. For projection purposes, the consolidated loan amounts in each future loan year are calculated net of loans for borrowers who returned to school. Hence, the students only consolidate once for modeling purposes.
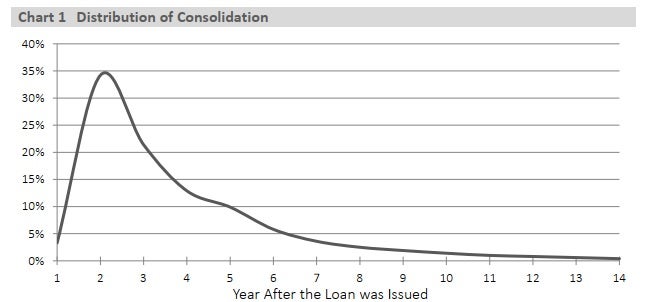
Chart 1 Description – Distribution of Consolidation
Line graph showing the consolidation distribution for the Canada Student Financial Assistance Program. Y axis represents the percentage of loans consolidated. X axis represents the number of years since the loans are issued. One year after the loans are issued, the percentage consolidated is 3.3%; it reaches a maximum of 34.2% 2 years after the loans are issued before decreasing to a value of 0.3% 15 years after the loans are issued.
D.3 Allowance for Bad Debt – Principal
The calculation of the allowance for bad debt – principal is based on a number of assumptions, namely the gross default rate, the loans rehabilitations and recalls, the loans recoveries, and the prepayments. These assumptions are based on historical observations and the actuary's best estimates.
D.3.1 Gross Default Rate
A default rate is determined for each consolidation cohort. Consolidation cohorts 2025‑2026 and onwards are assumed to have the same ultimate gross default rate of 15%. This rate represents the proportion of loans consolidated in a year that are expected to default at some point before they are completely repaid. As shown in Chart 2, the largest proportion of loans goes into default within three years of consolidation. In the short-term, gross default rates were adjusted upward to reflect recent experience.
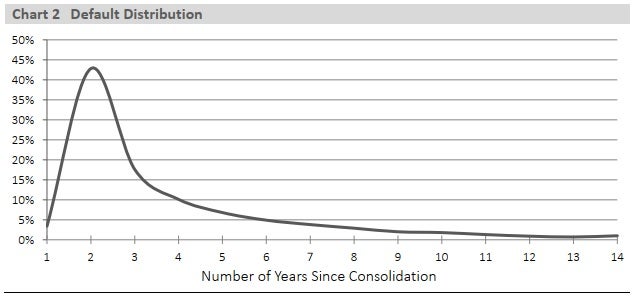
Chart 2 Description – Default Distribution
Line graph showing the default distribution for the Canada Student Financial Assistance Program. Y axis represents the percentage of defaults. X axis represents the number of years since consolidation. During the first year following consolidation, the percentage of loans that defaults is 3.4%; this percentage increases significantly during the second year to reach its maximum of 42.8%. Afterwards, the percentage decreases for the remainder of the projection to reach 1.0% 14 years after consolidation.
D.3.2 Recalls and Rehabilitations Rate
For different reasons, loans can be mistakenly transferred in default. When they are brought back in good standing, the transaction is referred to as a recall. In addition, borrowers who find themselves legitimately in default have the ability to bring their loans back in good standing by performing what is called a rehabilitation. Prior to January 2020, borrowers had to pay all outstanding interest and the equivalent of two monthly payments to rehabilitate their loan. Since January 2020, borrowers also have the option to meet the rehabilitation criteria by making two monthly payments and capitalizing the remaining interest on their loan.
Another incentive for borrowers to rehabilitate their loans came with the introduction of the RAP in loan year 2009‑2010, since to be eligible for the RAP, borrowers first needed to have a loan in good standing.
Consolidation cohorts 2025‑2026 and onwards are assumed to have the same ultimate recalls/rehabilitations rate of 13.5%. In the short-term, this rate was adjusted upward to reflect recent experience.
Chart 3 shows the recalls and rehabilitations distribution once a loan is transferred in default.
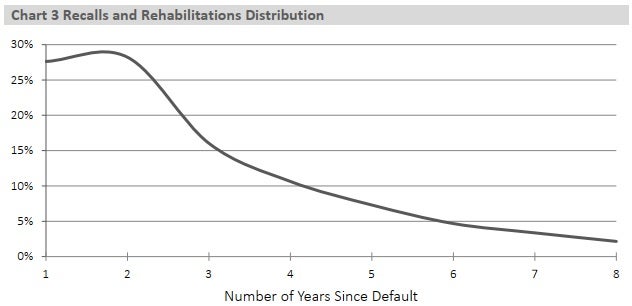
Chart 3 Description – Recalls and Rehabilitations Distribution
Line graph showing the recalls and rehabilitations distribution for the Canada Student Financial Assistance Program. Y axis represents the percentage of defaulted loans recalled or rehabilitated. X axis represents the number of years since default. One year following the default, the percentage of defaulted loans recalled or rehabilitated is 27.6%; it reaches a maximum of 28.2% 2 years after default before decreasing to a value of 2.2% 8 years after default.
D.3.3 Recovery Rate
Recoveries represent monies the program is able to recuperate after loans have defaulted. CRA is responsible for collecting this money on behalf of the program. Recoveries are analysed based on the default year after consolidation. The long-term recovery rate for a default cohort is assumed to be 32.8%. Chart 4 shows the recovery distribution once a loan is transferred in default. Most recoveries are received in the first five years after default.
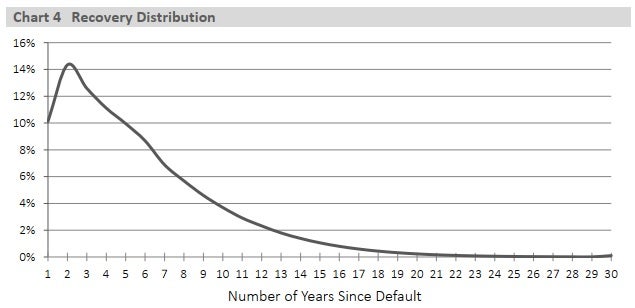
Chart 4 Description – Recovery Distribution
Line graph showing the recovery distribution for the Canada Student Financial Assistance Program. Y axis represents the percentage of defaulted loans recovered. X axis represents the number of years since default. One year following the default, the percentage of defaulted loans recovered is 10.1%; it reaches a maximum of 14.3% 2 years after default before decreasing to a value of 0.1% 30 years after default.
D.3.4 Net Default Rate
The net default rate represents the proportion of consolidated loans that will eventually be written off for each future consolidation cohort. The long-term net default rate corresponds to:
Gross Default Rate × (1 – Recalls and Rehabilitation Rate – Recovery Rate) = 15.0% × (1 – 13.5% – 32.8%) = 8.1%
The amount of loans to be written-offFootnote 11 each year is determined using the assumed distribution presented in Chart 5, which was updated from the last statutory report based on recent experience data.
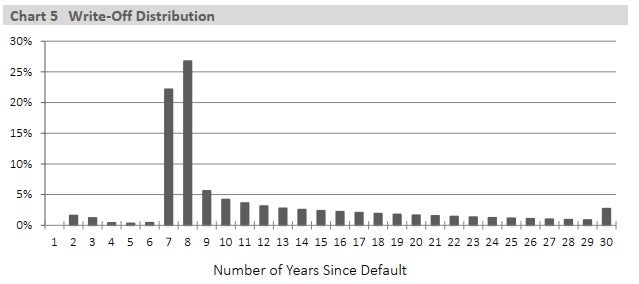
Chart 5 Description – Write-Off Distribution
Line graph showing the write-off distribution for the Canada Student Financial Assistance Program. Y axis represents the percentage of defaulted loans written-off. X axis represents the number of years since default. The average yearly percentage of defaulted loans written-off in the first six years after default is 0.7%. It increases to 22.2% after seven years and 26.7% after eight years. It decreases to 5.6% after nine years, continues decreasing to a value of 0.9% after 29 years, and then increases to 2.7% 30 years after default.
D.3.5 Bad Debt Provision - Principal
The allowance for bad debt – principal is based on a prospective approach that uses a snapshot of the portfolio at a specific point in time to determine the amount of the allowance at that time. The calculation of the allowance is separated into three components according to the status of the loan; that is whether the loan is in-study, in repayment (according to the number of years since consolidation) or in default (according to the number of years since default).
D.3.5.1 Allowance for loans in study
This allowance corresponds to the net default rate adjusted to account for prepayments (payments received from students prior to consolidation). Based on experience, prepayments amount to approximately 15.0%. This results in a long-term provision rate for loans in study of:
[(Net Default Rate) × (1 – Prepayments)] = [(8.1% ) × (1 – 15.0%)] = 6.8%
D.3.5.2 Allowance for loans in repayment
This allowance is determined using projected future defaults according to the number of years since consolidation. The recovery rate assumption is then applied to determine the portion of projected defaulted loans that will not be recovered. This result corresponds to the allowance on the balance of loans in repayment. As mentioned previously, the long-term recovery rate for each gross default cohort is expected to be 32.8%; hence, it is assumed that 67.2% (1 – 32.8%) of the projected gross defaulted loans will not be recovered. This results in a provision rate on outstanding loans in repayment of 4.2% in the long-term. The provision rate of 4.2% for loans in repayment is lower than the provision rate of 6.8% for loans in-study since the portfolio in repayment includes cohorts of loans for which some defaults and partial reimbursements have already occurred, resulting in a lower inherent risk of loss for the remaining loans.
The spread between the provision rate as at 31 July 2021 presented in section 2.4.2 of the main report (5.2%) and the long-term provision rate (4.2%) is mostly due to the six-month repayment pause measure, which delayed a significant part of expected defaults from loan years 2019‑2020 and 2020‑2021 to loan year 2021‑2022. As such, the in repayment outstanding balance as at 31 July 2021 holds a higher share of expected future defaults than usual.
D.3.5.3 Allowance for loans in default
The last allowance component is the one on the balance of loans in default that will not be recovered. The long-term rate is equal to 77.9%. This rate is higher than the non-recovery rate of 67.2% (1 – 32.8%) since the portfolio in default includes cohorts of loans that have been transferred in default for a certain number of years and for which some recoveries have already occurred. Thus, the remaining loans have aged and have an increased risk of loss.
The provision rates used for the projected allowance as at 31 July 2021Footnote 12 shown in this report are:
- 6.9% for loans in-study;
- 5.2% for loans in repayment;
- 77.4% for loans in default
The ultimate provision rates used in this report are:
- 6.8% for loans in-study;
- 4.2% for loans in repayment;
- 77.9% for loans in default
The level of the total allowance is determined at the end of the loan year. The annual expense for bad debt – principal is equal to the difference between the total allowance at the end of a year and the total allowance at the end of the previous year net of write-offs that have occurred during the year.
D.4 Allowance for Bad Debt - Interest
The methodology for the calculation of the provision for bad debt – interest takes into account the number of years since default. Interest on defaulted loans is accrued until the loan reaches the "non-recoverable" status. A loan reaches this status when the collection of either principal or interest is not reasonably assured. For projection purposes, a loan becomes "non-recoverable" according to a 30-year distribution and is then gradually written off.
The interest accrued on defaulted loans is considered a revenue until the loan reaches the "non-recoverable" status. To lessen the effect of changing this revenue to a loss, an allowance is created based on the outstanding interest at the end of each year. The methodology involves the calculation of:
- Accrued interest on defaulted loans in each loan year
- Projected outstanding interest at the end of each loan year based on non-recoverable and recovery rates, applied to outstanding interest at the beginning of the year
- Projected allowance at the end of each year (obtained by adding the products of outstanding interest accounts with the corresponding provision rate for each year since default.)
The annual expense for bad debt – interest in a year is equal to the difference between the total allowance (on recoverable and non-recoverable accounts) at the end of a year and the total allowance at the end of the previous year net of write-offs that have occurred during the year. A set of provision rates that vary according to the number of years since default was established for the projection. The long-term provision rate is 29.5% of interest accrued in the first year after loans are transferred into default. It increases in each of the five subsequent years before decreasing in the seventh and eighth years (when a large portion of interest is transferred to the "non-recoverable" status because of the six-year limitation period – statute of limitations). After that, the provision rates increase each year to reach 100% in the 20th year. This reflects the increasing difficulty of recovering defaults as time passes. Table 28 shows the provision rates for bad debt – interest, which remain constant throughout the projection period.
| Year Since Default | Provision Rates (%) - Loan Year 2020‑2021 | Provision Rates (%) - Long-Term | Provision Rates (%) - Public Accounts as at 31 March 2021Table footnote 2 |
|---|---|---|---|
| 1st | 29.4 | 29.5 | 30.1 |
| 2nd | 38.0 | 38.8 | 38.5 |
| 3rd | 47.2 | 47.7 | 47.8 |
| 4th | 57.2 | 57.6 | 57.9 |
| 5th | 67.5 | 68.2 | 68.5 |
| 6th | 74.9 | 78.1 | 76.2 |
| 7th | 74.1 | 77.9 | 75.1 |
| 8th | 63.6 | 69.3 | 65.0 |
| 9th | 67.7 | 71.8 | 69.3 |
| 10th | 70.5 | 73.4 | 72.1 |
| 11th | 72.2 | 75.2 | 73.8 |
| 12th | 73.6 | 76.8 | 75.3 |
| 13th | 75.3 | 78.7 | 77.2 |
| 14th | 76.2 | 80.6 | 78.0 |
| 15th | 79.1 | 83.5 | 80.8 |
| 16th | 84.1 | 87.6 | 85.3 |
| 17th | 90.9 | 91.5 | 91.3 |
| 18th | 95.4 | 95.2 | 95.3 |
| 19th | 98.3 | 98.2 | 98.3 |
| 20th+ | 100.0 | 100.0 | 100.0 |
Table Footnotes
|
|||
D.5 Allowance for the Repayment Assistance Plan (RAP)
As explained in Appendix A, the two stages of RAP are aimed to help student borrowers, who apply and meet the eligibility criteria, to fully repay their student loan within fifteen years (or ten years for borrowers with permanent disabilities). During Stage 1, the Government covers the monthly interest amount owed that the borrower's affordable payment does not cover. Stage 2 begins once the borrower has completed five years in Stage 1, or has been in repayment for ten years following the end of the study period. The Government continues to cover the interest, as in Stage 1, but also begins to cover a portion of the student loan's principal amount (i.e. the difference between the required and affordable payment). Borrowers with a permanent disability can elect to apply for either RAP Stage 2 or RAP-PD, on approval of their RAP-PD application.
The methodology used to calculate the allowance for the RAP consists of evaluating the dollar proportion of consolidated loans expected to enter each stage, and then remain there, during each year after consolidation. The assumptions are based on the analysis of the historical data available for each cohort of consolidation.
RAP – Stage 1
Table 29 shows the long-term utilization rate assumptions used for RAP–Stage 1. These rates are applied to the consolidated loans amounts for cohorts 2020‑2021 onwards. Many borrowers complete their RAP–Stage 1 over a period longer than five years, hence the utilization rates do not always include the same borrowers from year to year, and some borrowers may be in the plan for only part of a year. The model takes all of this into account by incorporating the average time spent in RAP–Stage 1 in a loan year.
The first year in RAP–Stage 1 (first row of Table 29 ) generally consists of a partial loan year since most borrowers do not enter the RAP on August 1st. However, if borrowers remain in the RAP for a greater amount of time in the second year, then the utilization rate can be higher than the preceding year.
| RAP1 Loan Year |
Start Year after Consolidation | |||||||
|---|---|---|---|---|---|---|---|---|
| 1 | 2 | 3 | 4 | 5 | 6 | 7 | 8 | |
| 1 | 28.8% | 3.1% | 0.8% | 0.5% | 0.3% | 0.2% | 0.1% | 0.1% |
| 2 | 31.9% | 2.5% | 0.8% | 0.4% | 0.2% | 0.2% | 0.1% | 0.1% |
| 3 | 21.2% | 1.7% | 0.5% | 0.3% | 0.1% | 0.1% | 0.1% | 0.0% |
| 4 | 16.4% | 1.3% | 0.4% | 0.2% | 0.1% | 0.1% | 0.0% | 0.0% |
| 5 | 13.4% | 1.0% | 0.3% | 0.2% | 0.1% | 0.0% | 0.0% | |
| 6 | 7.1% | 0.5% | 0.2% | 0.1% | 0.0% | 0.0% | ||
| 7 | 1.8% | 0.2% | 0.1% | 0.0% | 0.0% | |||
| 8 | 0.9% | 0.1% | 0.0% | 0.0% | ||||
| 9 | 0.6% | 0.1% | 0.0% | |||||
| 10 | 0.4% | 0.0% | ||||||
| 11 | 0.1% | |||||||
Table Footnote
|
||||||||
RAP –Stage 2
The methodology used to calculate the amount of dollars in RAP–Stage 2 assumes that as borrowers become eligible for RAP–Stage 2 (five years after entering RAP–Stage 1), they immediately enter RAP–Stage 2. This means that a borrower could enter RAP–Stage 2 from the 6th year after consolidation until the 11th year after consolidation.
Table 30 shows the resulting long-term utilization rate assumptions used for RAP–Stage 2.
| RAP2 Loan Year |
Start Year after Consolidation | |||||
|---|---|---|---|---|---|---|
| 6 | 7 | 8 | 9 | 10 | 11 | |
| 6 | 4.0% | 1.1% | 0.4% | 0.2% | 0.2% | 0.3% |
| 7 | 6.1% | 1.1% | 0.4% | 0.2% | 0.2% | 0.2% |
| 8 | 4.9% | 0.9% | 0.3% | 0.2% | 0.1% | 0.1% |
| 9 | 4.0% | 0.7% | 0.2% | 0.1% | 0.1% | 0.1% |
| 10 | 3.2% | 0.5% | 0.2% | 0.1% | 0.1% | 0.0% |
| 11 | 2.5% | 0.4% | 0.1% | 0.0% | 0.0% | |
| 12 | 1.8% | 0.3% | 0.1% | 0.0% | ||
| 13 | 1.3% | 0.2% | 0.0% | |||
| 14 | 0.8% | 0.1% | ||||
| 15 | 0.3% | |||||
Table Footnote
|
||||||
RAP–PD
RAP–PD is available for borrowers with a permanent disability. A borrower who had a RAP–PD application approved is eligible to start in the RAP–PD as soon as his loan consolidates and can remain in the plan for a period of 9.5 years, when the loan is expected to have been repaid in full.
Table 31 shows the long-term utilization rate assumptions used for RAP–PD.
| RAP-PD Loan Year |
Start Year after Consolidation | ||||||
|---|---|---|---|---|---|---|---|
| 1 | 2 | 3 | 4 | 5 | 6 | 7 | |
| 1 | 2.53% | 0.22% | 0.09% | 0.05% | 0.03% | 0.03% | 0.02% |
| 2 | 2.81% | 0.20% | 0.09% | 0.05% | 0.04% | 0.04% | 0.02% |
| 3 | 1.85% | 0.13% | 0.06% | 0.03% | 0.02% | 0.02% | 0.01% |
| 4 | 1.39% | 0.10% | 0.04% | 0.03% | 0.02% | 0.01% | 0.00% |
| 5 | 1.04% | 0.07% | 0.03% | 0.02% | 0.01% | 0.00% | 0.00% |
| 6 | 0.81% | 0.05% | 0.02% | 0.01% | 0.00% | 0.00% | |
| 7 | 0.60% | 0.04% | 0.01% | 0.00% | 0.00% | ||
| 8 | 0.43% | 0.02% | 0.00% | 0.00% | |||
| 9 | 0.25% | 0.01% | 0.00% | ||||
| 10 | 0.10% | 0.00% | |||||
| 11 | 0.00% | ||||||
Table footnote
|
|||||||
Provisions for RAP–Principal (Stage 2 and PD)
The RAP – principal provision covers future costs related to RAP-Stage 2 and RAP-PD, which corresponds to the portion of the loan principal paid off by the Government.
As with the provision for bad debt – principal, the methodology to determine the provision rates and allowance for the RAP – principal is based on a prospective approach that uses a snapshot of the portfolio at a particular point in time to determine the amount of the allowance at that time. The calculation of the allowance is separated into three components according to the status of the loan; that is whether the loan is in-study, in repayment (excluding loans in the RAP) or in the RAP (considering the current stage). The provision rates are based on current and long-term RAP utilization rates at each stage. Three distinct provision rates, depending on the status of the loan at a given time, will be used to determine the required allowance.
The provision rates used for the projected allowance as at 31 July 2021Footnote 13 shown in this report are:
- 7.1% for loans in-study;
- 1.9% for loans in repayment (net of loans in the RAP), and
- 34.3% for loans in the RAP (all stages combined).
The ultimate provision rates used in this report are:
- 7.1% for loans in-study
- 2.0% for loans in repayment (net of loans in the RAP), and
- 33.2% for loans in the RAP (all stages combined).
The lowest provision rate is for the portfolio of loans in repayment. This portfolio includes cohorts of loans for which partial reimbursements have already occurred, as well as some defaults and utilization of the RAP, resulting in a lower risk for the remaining loans, and consequently a lower required provision rate than the one for loans in study.
The highest provision rate is for the portfolio of loans already in the RAP. Having already entered the plan by meeting the eligibility criteria, there is a greater chance that these loans will remain eligible and consequently remain in the plan.
The annual expense for the RAP – principal provision is equal to the difference between the total allowance at the end of a year and the total allowance at the end of the previous year net of the current year's expenses.
The RAP is a plan that was introduced in 2009 and thus, has limited experience. Since students using RAP – Stage 2 repay their loan over a period of 15 years after consolidation, it takes 15 years for a cohort to fully develop its experience. Hence, the first cohort to have full experience will be the 2009 consolidation cohort when it reaches year 2024. The related projection of costs and underlying assumptions will be revised in the future as experience emerges, and the provision rates will be updated accordingly. As with the former Interest Relief measure, a modest provision for the RAP – interest is determined by ESDC for accounting purposes to take into account the timing of the interest accrued.
D.6 Other Assumptions
D.6.1 Prepayments and Accelerated Payments for Direct Loans
The analysis of principal payments made by students revealed that some payments are received while the student is still in school or during the non-repayment period (prepayments) and some payments are received in excess of the scheduled payments during the repayment period (accelerated payments).
D.6.1.1 Prepayments
Prepayments correspond to payments applied to principal during the period of study and during the six-month non-repayment period after the period of study end date. The amount of prepayments for 2019‑2020 was $425 million. Around 30% of this amount is received during the period of study and the remaining 70% is received during the non-repayment period. Over the long-term, it is assumed that around 15% of loans issued are prepaid.
D.6.1.2 Accelerated Payments
Normal principal payments received from students are calculated based on a standard 114-month repayment period. However, some students decide to pay more than the required monthly payments during the amortization period. In addition, loans with an outstanding balance smaller than $7,000 are actually amortized over a shorter period of time as per ESDC's guidelines. In both situations, the payment made by the student is greater than their calculated normal payment. The additional amounts paid represent the accelerated payments. Over the long-term, it is assumed that these payments add up to approximately 17% of the sum of normal payments for each loan year.
D.6.2 Alternative Payments
Alternative payments are made directly to the province and territories that do not participate in the CSFA Program, namely Québec, the Northwest Territories, and Nunavut. These payments are projected by multiplying the net cost of the program by the ratio of the population aged 18‑24 residing in the non-participating province and territories to the population aged 18‑24 residing in the participating provinces and territory.
The expenses included in the calculation are: interest subsidies, RAP – interest expenses for risk-shared and guaranteed regimes, loans forgiven, service providers' costs, CSG, claims, RAP-Stage 2 payments, risk premiums, put-backs, refunds to financial institutions, direct loans' borrowing costs for loans in good standing and default amounts for the direct loan regime. The revenues include: student interest payments, and principal and interest from recoveries. The cost of alternative payments is $492 million for 2019‑2020 based on expenses and revenue of 2018‑2019 and $487 million for 2020‑2021 based on expenses and revenue of 2019‑2020.
D.6.3 Administrative Expenses
ESDC provided estimates of the administrative expenses to support the CSFA Program for the short-term. The costs have been converted to a loan year basis and the extrapolation of future years was done using wage increases. Administrative expenses include ESDC salary and non-salary resources related to the program as well as expenses for service providers and collection costs.
| Loan Year | Administrative Expenses($ million) |
|---|---|
| 2019‑2020 | 92.1 |
| 2020‑2021 | 92.1 |
| 2021‑2022 | 106.8 |
| 2022‑2023 | 117.9 |
| 2023‑2024 | 118.6 |
| 2024‑2025 | 120.0 |
| 2025‑2026 | 126.1 |
| 2026‑2027 | 136.6 |
| 2027‑2028+ | Increases with wages |
D.6.4 Administrative Fees Paid to Provinces
For loan year 2019‑2020, the administrative fees paid to the participating provinces and territory were $34.7 million. Future years were projected using wage increases.
D.6.5 Canada Student Grants
For the 2019‑2020 loan year, the actual cost of Canada Student Grants (CSGs) was $1,635 million. The total amount of grants disbursed under the CSG is projected to increase over the projection period based on the number of students receiving a loan and includes the doubling of grants for loan years 2020‑2021 to 2022‑2023 due to the COVID-19 pandemic measures.
D.6.6 Loans Forgiven
There are two categories of loans forgiven: those forgiven for severe permanent disability and death, and those forgiven for family physicians, nurses and nurse practitioners who work in an under-served rural or remote community.
Long-term rates of loans forgiven for severe permanent disability and death correspond to 0.024% of loans in study and 0.14% of loans in repayment. The long-term rate of loans forgiven while in repayment was increased to reflect recent loans forgiven while in default. In the future, they are expected to directly be forgiven while in repayment instead of defaulting first. In 2019‑2020, $8.7 million of loans were forgiven while in default.
Loan forgiveness for family physicians, nurses and nurse practitioners is a program accessible to borrowers who began to work in an under-served rural or remote community on or after 1 July 2011 as a family physician, nurse or nurse practitioner. To be eligible for forgiveness, borrowers must have been employed for a full year (12 months) in a designated community and provided in-person services for a minimum of 400 hours (or 50 days) in that community. However, in the case of family medicine residents, the full 12 month period of service is not required for eligibility. Family doctors and family medicine residents are eligible for forgiveness of $8,000 per year to a maximum of $40,000 over five years while nurse practitioners and nurses may be eligible for forgiveness of $4,000 per year to a maximum of $20,000 over five years. The amount forgiven is projected based on the expected new number of doctors and nurses who received student loans during their studies and are expected to work in an under-served rural or remote community after graduation.
Appendix E - Sensitivity Tests
This actuarial valuation involves the projection of the CSFA Program's revenues and expenses. The information presented in section A of the Main Report was derived using "best-estimate" assumptions. Because of the length of the projection period and the number of assumptions required, it is unlikely that actual future experience will develop precisely in accordance with the best-estimate assumptions. Sensitivity tests were performed using alternative assumptions to project the program's financial results.
For each sensitivity test, one key assumption was changed while the others remained at their best-estimate levels. The alternative assumptions were selected to represent a reasonable range of potential long-term experience. They do not however exclude the possibility of actual experience falling outside the range studied.
Each test performed was labeled as either "low-cost" or "high-cost". In the "low-cost" scenarios, the alternative assumptions reduce the annual cost of the program, while in the "high-cost" scenarios, they increase it.
Table 33 below summarizes the alternative assumptions that were used in the sensitivity tests; a brief discussion of each assumption subsequently follows.
| Assumption | Low-cost | Best-estimate (B-E) | High-cost | |
|---|---|---|---|---|
| 1. | Loan Limit | Frozen | Indexed to inflation | |
| 2. | Loan Limit and Grants | - | Frozen | Indexed to inflation |
| 3. | Fixed Student Contribution | Indexed to inflation | Frozen | - |
| 4. | Real Wage Increases | 0.5% | 1.0% | 1.5% |
| 5. | Inflation | 1.0% | 2.0% | 3.0% |
| 6. | Post‑secondary Enrolment Rate – 2044‑2045 (Canada less Québec, Northwest Territories and Nunavut) |
23.8% | 25.9% | 27.9% |
| 7. | Tuition Cost | Inflation | Inflation + 1.75% | Inflation + 3.5% |
| 8. | Interest Rates: | |||
| Government's Cost of Borrowing | 1.7% | 3.7% | 5.7% | |
| Student's Cost of Borrowing | 2.3% | 4.3% | 6.3% | |
| 9. | RAP-Stage 1 Entrance Rates | -30% | - | +30% |
| 10. | Net Defaults | 4.9% | 8.1% | 11.7% |
E.1 Indexation of the Loan Limit
For this test, the $210 weekly loan limit is indexed annually to inflation starting in the 2021‑2022 loan year, thereby showing the effect of many small annual increases on the loan limit. The direct effects are a decrease in the proportion of students at the loan limit and an increase in the total amount of loans issued. The impact on loans issued increases gradually from 1% in 2021‑2022 to 54% at the end of the projection period, as shown in Table 34.
| Loan Year | Limit frozen at $210 | Indexed to Inflation Starting in 2021‑2022 | ||||||
|---|---|---|---|---|---|---|---|---|
| Limit | % of Students at the Limit | Loans Issued Total | Limit | % of Students at the Limit | Loans Issued | |||
| Total | Increase Over Frozen | |||||||
| ($) | (%) | ($ million) | ($) | (%) | ($ million) | ($ million) | (%) | |
| 2019‑2020 | 210 | 43.5% | 3,449 | 210 | 43.5% | 3,449 | - | - |
| 2020‑2021 | 350 | 16.2% | 3,879 | 350 | 16.2% | 3,879 | - | - |
| 2021‑2022 | 210 | 33.2% | 3,006 | 214 | 32.3% | 3,039 | 33 | 1 |
| 2024‑2025 | 210 | 54.7% | 4,065 | 227 | 49.7% | 4,289 | 225 | 6 |
| 2029‑2030 | 210 | 67.0% | 4,544 | 251 | 55.8% | 5,192 | 648 | 14 |
| 2034‑2035 | 210 | 77.0% | 4,905 | 277 | 61.8% | 6,156 | 1,251 | 25 |
| 2039‑2040 | 210 | 83.3% | 5,305 | 306 | 67.8% | 7,357 | 2,052 | 39 |
| 2044‑2045 | 210 | 87.9% | 5,772 | 338 | 72.6% | 8,880 | 3,108 | 54 |
E.2 Indexation of Loan Limit and Grants
For this test, both the loan limit and grants are indexed annually to inflation. The grants increases lessen the effect of the loan limit increases. Consequently, the impact on total loans issued is smaller than in the first sensitivity test. Table 35 and Chart 6 show the impact of indexing the loan limit and grants.
| Loan Year | Limit frozen at $210 | Limit and Grants Indexed to Inflation Starting in 2021‑2022 | |||||||
|---|---|---|---|---|---|---|---|---|---|
| % of Students at the Limit (%) |
Loans Issued Total ($ million) |
Grants Total ($ million) |
Limit ($) |
% of Students at the Limit (%) |
Loans Issued Total ($ million) |
Increase over Frozen (%) |
Grants Total ($ million) |
Increase over Frozen (%) |
|
| 2019‑2020 | 43.5% | 3,449 | 1,635 | 210 | 43.5% | 3,449 | - | 1,635 | - |
| 2020‑2021 | 16.2% | 3,879 | 3,205 | 350 | 16.2% | 3,879 | - | 3,205 | - |
| 2021‑2022 | 33.2% | 3,006 | 3,207 | 214 | 32.0% | 3,021 | 1 | 3,270 | 2 |
| 2024‑2025 | 54.7% | 4,065 | 1,609 | 227 | 48.1% | 4,234 | 4 | 1,739 | 8 |
| 2029‑2030 | 67.0% | 4,544 | 1,672 | 251 | 52.2% | 5,074 | 12 | 1,992 | 19 |
| 2034‑2035 | 77.0% | 4,905 | 1,715 | 277 | 56.2% | 5,989 | 22 | 2,254 | 31 |
| 2039‑2040 | 83.3% | 5,305 | 1,786 | 306 | 61.2% | 7,159 | 35 | 2,589 | 45 |
| 2044‑2045 | 87.9% | 5,772 | 1,893 | 338 | 66.1% | 8,667 | 50 | 3,027 | 60 |
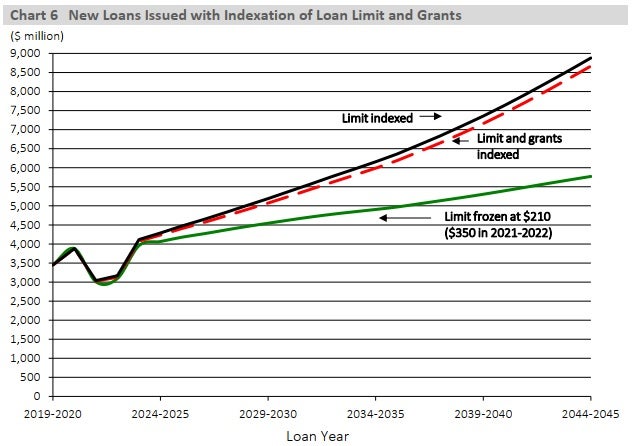
Chart 6 Description – New Loans Issued with Indexation of Loan Limit and Grants
Line graph showing the loans issued for the Canada Student Financial Assistance Program under three scenarios: “limit indexed”, “limit and grants indexed” and “limit frozen at $210”. Y axis represents the dollar value of loans issued in millions. X axis represents the loan year when the loans are issued. Between loan years 2019-2020 and 2022-2023, all three scenarios results in similar loans issued. Starting in loan year 2023-2024, results begin to diverge. In loan year 2044-2045, loans issued under “limit indexed” reaches $8,880 millions, loans issued under “limit and grants indexed” reaches $8,667 millions and loans issued under “limit frozen at $210” reaches $5,772 millions.
E.3 Indexation of the Fixed Student Contribution
The fixed student contribution is used in the projection of a student's resources in the need assessment process.
For this test, the fixed student contribution (between $1,500 and $3,000) is indexed annually to inflation starting in loan year 2021‑2022. Increasing the fixed student contribution slightly decreases the proportion of students at the loan limit and the total amount of loans issued. The impact on loans issued is stable over the projection period, as shown in Table 36.
| No Change to Fixed Student Contribution | Fixed Student Contribution Indexed to Inflation Starting in 2021‑2022 | ||||
|---|---|---|---|---|---|
| % of Students at the Limit | Loans Issued Total ($ millions) |
% of Students at the Limit | Loans Issued Total ($ millions) |
Increase (%) |
|
| 2019‑2020 | 43.5% | 3,449 | 43.5% | 3,449 | - |
| 2020‑2021 | 16.2% | 3,879 | 16.2% | 3,879 | - |
| 2021‑2022 | 33.2% | 3,006 | 33.1% | 3,002 | -0.1 |
| 2024‑2025 | 54.7% | 4,065 | 54.0% | 4,045 | -0.5 |
| 2029‑2030 | 67.0% | 4,544 | 65.5% | 4,511 | -0.7 |
| 2034‑2035 | 77.0% | 4,905 | 75.5% | 4,872 | -0.7 |
| 2039‑2040 | 83.3% | 5,305 | 81.4% | 5,273 | -0.6 |
| 2044‑2045 | 87.9% | 5,772 | 86.7% | 5,752 | -0.4 |
E.4 Real Wage Increase
Real wage increases are used in the projection of a student's resources in the need assessment process and in the projection of the program's administrative expenses.
Under the best-estimate assumption, an ultimate real wage increase of 1.0% is assumed starting in loan year 2025‑2026. Combined with the best-estimate inflation assumption of 2.0%, it results in a nominal annual ultimate wage increase of 3.0%.
The sensitivity tests show the impact of a 50 basis points change in the annual real wage increase, either decreasing the ultimate real wage increase to 0.5% or increasing it to 1.5%. These sensitivity tests have a small impact on the net cost of the program since the total portfolio and the administrative expenses vary in opposite directions when applying a wage variation.
E.5 Inflation
Under the best-estimate assumptions, an ultimate annual inflation rate of 2.0% is assumed to be reached in loan year 2021‑2022. The inflation rate affects the growth of a student's expenses, the program's expenditures and the student resources. It also affects the Government's cost of borrowing, as well as the repayment rate charged to students. Under the low-cost scenario, the ultimate annual inflation rate is assumed to decrease to 1.0% in 2021‑2022, whereas under the high-cost scenario it is assumed to increase to 3.0%.
E.6 Post-secondary Enrolment Rate
The number of students enrolled full-time in a post-secondary institution is projected separately for students participating in the labour force and for students who are not part of the labour force. As shown in Table 4, the 2044‑2045 post-secondary enrolment is 1,513,000 and the population aged 15‑29 is 5,852,000, resulting in an overall post-secondary enrolment rate of 25.9%. The sensitivity tests show the variation in results based on an increase or decrease of students pursuing a post-secondary education.
In the low-cost scenario, post-secondary enrolment rates decrease by 8% throughout the projection period, which results in a rate of 23.8% in 2044‑2045. Such a decrease could be experienced if youths were to participate in higher numbers in the labour force.
In the high-cost scenario, post-secondary enrolment rates increase by 8% throughout the projection period, which results in a rate of 27.9% in 2044‑2045. Such an increase could be experienced if unemployment rates rose.
The amount of loans issued is directly correlated to the enrolment rate so having 8% more students enrolled in a post-secondary institution results in 8% more loans issued.
E.7 Tuition Cost
The long-term estimate of tuition increases is based on past tuition increases relative to inflation. Over the ten year period ending in 2018‑2019 (2009‑2010 to 2018‑2019), yearly tuition increases have, on average, corresponded toincreases ininflation plus approximately 1.9%, while over the 15 year period ending in 2018‑2019, they have been close to inflation plus 1.6%. Inflation plus 1.75% is used as the best-estimate ultimate growth rate.
In the low-cost scenario, the ultimate tuition increase is expected to be equal to increases in inflation. This result is more in line with increases of other goods and services.
In the high-cost scenario, the ultimate tuition increase is expected to correspond to increases in inflation plus 3.5%. With the aging of the population, budgetary pressures can be anticipated, which could lead to higher tuition increases.
E.8 Interest Rates
The rate of borrowing has an impact on the cost of the interest subsidy for students in school, on the cost of providing RAP (interest portion) to students in need and on the Government's cost of borrowing. This assumption also affects the student rate of borrowing, which is used to calculate interest revenue. The low-cost scenario reduces the interest rates by 200 basis points and the high-cost scenario increases them by 200 basis points. Each of these scenarios is plausible based on historical rates.
E.9 Repayment Assistance Plan (RAP)
The utilization of the RAP can vary according to the existing economic situation and students' awareness of this repayment assistance. In addition, the thresholds reduction proposed in Budget 2021 and starting in loan year 2022‑2023 will significantly affect RAP utilization. For loan years 2022‑2023 and after, the low-cost scenario reduces the entrance rates of RAP-Stage 1 by 30% while the high-cost scenario increases them by 30%. Because borrowers move from RAP-Stage 1 to RAP-Stage 2, any change in the entrance rates of RAP-Stage 1 affects RAP-Stage 2.
E.10 Net Defaults
One of the risks for the Government of being involved in the CSFA Program is the amount of loans that may not be recovered due to defaults. The assumed future net default rate on consolidated loans is 8.1% which corresponds to a default rate of 15.0%, a rehabilitations and recalls rate of 13.5% and a recovery rate of 32.8% [8.1% = 15.0% × (1 – 13.5% – 32.8%)].
In the low-cost scenario, the future default rate is reduced by 500 basis points, to 10%, while the future recovery rate is increased by 500 basis points to 37.8%. This results in a net default rate of 4.9% [10% × (1 – 13.5% – 37.8%)].
In the high-cost scenario, the future default rate is increased by 500 basis points, to 20%, while the future recovery rate is reduced by 500 basis points, to 27.8%. This results in a net default rate of 11.7% [20% × (1 – 13.5% – 27.8%)]. Both of these tests affect the provision rates for bad debt – principal.
Table 37 below summarizes the results of each of the sensitivity tests at the end of the projection period.
| Assumption | Scenario | Loans Issued ($ million) |
Increase (%) |
Average Growth Rate (%) |
Portfolio July ($ million) |
Increase (%) |
Net Cost ($ million) |
Increase (%) |
|
|---|---|---|---|---|---|---|---|---|---|
| Base Scenario | Best-estimate | 5,772 | - | 1.7 | 41,308 | - | 4,845 | - | |
| Sensitivity Tests | |||||||||
| 1 - Index the Limit to Inflation | High-cost | 8,880 | 53.8 | 3.5 | 57,955 | 40.3 | 5,825 | 20.2 | |
| 2 - Index Loan Limit and Grants to Inflation | High-cost | 8,667 | 50.2 | 3.4 | 56,474 | 36.7 | 7,161 | 47.8 | |
| 3 - Index Student's Contribution to Inflation | Low-cost | 5,752 | (0.4) | 1.7 | 41,091 | (0.5) | 4,836 | (0.2) | |
| 4a - Real Wage | -50 bps | Low-cost | 5,815 | 0.7 | 1.7 | 41,576 | 0.6 | 4,827 | (0.4) |
| 4b - Real Wage | +50 bps | High-cost | 5,742 | (0.5) | 1.6 | 41,111 | (0.5) | 4,870 | 0.5 |
| 5a - Inflation | -100 bps | Low-cost | 5,640 | (2.3) | 1.6 | 39,933 | (3.3) | 4,427 | (8.6) |
| 5b - Inflation | +100 bps | High-cost | 5,823 | 0.9 | 1.7 | 42,086 | 1.9 | 5,257 | 8.5 |
| 6a - Enrolment Rate | -8% | Low-cost | 5,309 | (8.0) | 1.3 | 38,000 | (8.0) | 4,489 | (7.3) |
| 6b - Enrolment Rate | +8% | High-cost | 6,235 | 8.0 | 2.0 | 44,617 | 8.0 | 5,201 | 7.3 |
| 7a - Tuition | Inflation | Low-cost | 5,692 | (1.4) | 1.6 | 40,582 | (1.8) | 4,811 | (0.7) |
| 7b - Tuition | Inflation +3.5% | High-cost | 5,842 | 1.2 | 1.7 | 41,893 | 1.4 | 4,872 | 0.6 |
| 8a - Interest Rates | ‑200 bps | Low-cost | 5,772 | - | 1.7 | 40,838 | (1.1) | 4,219 | (12.9) |
| 8b - Interest Rates | +200 bps | High-cost | 5,772 | - | 1.7 | 41,773 | 1.1 | 5,467 | 12.8 |
| 9a - RAP-Stage 1 Entrance Rates | -30% | Low-cost | 5,772 | - | 1.7 | 40,389 | (2.2) | 4,584 | (5.4) |
| 9b - RAP-Stage 1 Entrance Rates | +30% | High-cost | 5,772 | - | 1.7 | 42,209 | 2.2 | 5,106 | 5.4 |
| 10a - Net Default Rate | down to 4.9% | Low-cost | 5,772 | - | 1.7 | 40,505 | (1.9) | 4,647 | (4.1) |
| 10b - Net Default Rate | up to 11.7% | High-cost | 5,772 | - | 1.7 | 42,251 | 2.3 | 5,072 | 4.7 |
Appendix F - Concessionary Terms
Section PS3050 (Loans Receivable) of the Public Sector Accounting Standards of the Chartered Professional Accountants Canada states that loans with significant concessionary terms should be accounted for based on the substance of the transaction. The Directive on Accounting Standards (GC 3050 Loans Receivable) in effect at the valuation date specifies that only loans with a concessionary portion greater than 25 per cent of the face value of the loan shall be considered as having significant concessionary terms.
The following items were used to calculate the concessionary terms on new loans issued:
- Discount rate of 1.47%, which is the yield equivalent to a zero-coupon yield curve (determined by reference to market yields as at 31 March 2021 on Government of Canada Bonds and treasury bills) applied to expected cash flows. The higher the discount rate, the more likely it is to have significant concessionary terms;
- Student interest rates presented in Table 3 during the repayment period. Interests start to accrue 6 months after the end of the study period. The student interest rate is higher than the discount rate and is expected to remain higher in the future. The lower the student interest rate, the more likely it is to have significant concessionary terms; and
- Expected repayment cash flows based on historical experience and expected long-term assumptions.
As mentioned in Appendix A of this report, loans under the CSFA Program are currently not considered as having significant concessionary terms according to the Directive on Accounting Standards.
Four alternate scenarios were tested and each would still result in no significant concessionary terms (below 25 per cent of the face value):
- Doubling the discount rate; or
- Reducing the student interest rate to 0%; or
- Increasing the in-study interest free period to 10 years (from the current average of three years); or
- Having students fully repay their loans immediately after consolidation.
Appendix G - Acknowledgements
We would like to thank the staff of the Canada Student Loans Directorate of Employment and Social Development Canada who provided the relevant data used in this report. Without their useful assistance, we would not have been able to produce this report.
The following people assisted in the preparation of this report:
Adam Kearney
Alice Chiu, ACIA, ASA
Maxime L. Delisle, FICA, FSA, CERA
Myriam Demers, ACIA, ASA
Pascale Jomphe, ACIA, ASA
Kelly Moore
Footnotes
- Footnote 1
-
The change of the program’s name to the Canada Student Financial Assistance Program was announced in Budget 2021 and confirmed by ESDC.
- Footnote 2
-
The loan issued by the federal government covers 60% of the assessed need. In this report, it is calculated based on expenses and resources found in the financial assistance need assessment data for loan year 2018‑2019 provided by ESDC.
- Footnote 3
-
A portion of the student’s contributions comes from the fixed student contribution set at a maximum of $3,000 per loan year.
- Footnote 4
-
Except for loan year 2020‑2021, where the weekly loan limit was increased to $350 in response to the COVID-19 pandemic.
- Footnote 5
-
In the loan year 2020‑2021, the Government bought back a part of the good-standing guaranteed and risk-shared loans owned by financial institutions.
- Footnote 6
-
According to the Monthly Financial Information Schedule and the Departmental Account Receivable System.
- Footnote 7
-
Effective on 1 November 2019, student loans no longer accumulate interest during the six-month non-repayment period after a student loan borrower leaves school.
- Footnote 8
-
Either prepayments while in-study, normal and accelerated payments while in repayment, affordable payments while in RAP, or recoveries while in default.
- Footnote 9
-
Under the former Debt Reduction in Repayment (DRR) or the Repayment Assistance Plan (RAP) measures.
- Footnote 10
-
Loans purchased under an agreement made pursuant to the Canada Student Financial Assistance Act are considered. Good-standing loans purchased in loan year 2020‑2021 shown in Table 8 are excluded.
- Footnote 11
-
Includes write-offs of defaulted loans that exceed the six-year limitation period as stated in section 16.1 of the Canada Student Financial Assistance Act, as well as small balances of defaulted loans.
- Footnote 12
-
The provision rates used for the Public Accounts as at 31 March 2021 are presented in section 2.4.2 of the main report and do not include changes proposed in Budget 2021.
- Footnote 13
-
The provision rates used for the Public Accounts as at 31 March 2021 are presented in section 2.4.2 of the main report and do not include changes proposed in Budget 2021.