Canada Student Financial Assistance Program as at 31 July 2021 - Highlights
Accessibility statement
The Web Content Accessibility Guidelines (WCAG) defines requirements for designers and developers to improve accessibility for people with disabilities. It defines three levels of conformance: Level A, Level AA, and Level AAA. This report is partially conformant with WCAG 2.0 level AA. If you require a compliant version, please contact webmaster@osfi-bsif.gc.ca.
Message from the Actuary
We reflected the impacts of the COVID-19 pandemic on the economic assumptions used in this report. The pandemic is a very fluid situation that will continue to evolve for some time. The final impacts will be reflected in future reports.
The $34B limit on the loan portfolio is projected to be reached in 2035-2036.
Quick facts
Higher loans in 2020-2021 and higher grants until 2022-2023 due to temporary measures
542,000 grant recipients in 2020-2021 ($3,188 million)
576,000 loan recipients in 2020-2021 ($3,969 million)
Recent measuresFootnote 1
Temporary
Waiver of interest accrual on student loans (April 2021 to March 2023)
Doubling of the amounts of grants (August 2020 to July 2023)Footnote 2
Extension of the top-up grant for eligible adult learners (August 2021 to July 2023)
Permanent
Use of current year income for grants eligibility
Increase in Repayment Assistance Plan (RAP) thresholds starting in 2022-2023
Increase by 50% forgivable loans amount for doctors and nurses
Expand the definition of disability
The periods shown in the following charts are from 1 August to 31 July
Proportion of grants
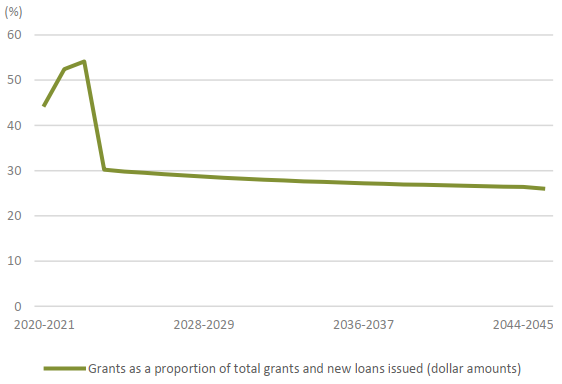
Proportion of grants - Table
| 2020‑2021 | 2021‑2022 | 2022‑2023 | 2023‑2024 | 2024‑2025 | 2025‑2026 | 2026‑2027 | 2027‑2028 | 2028‑2029 | 2029‑2030 | 2030‑2031 | 2031‑2032 | 2032‑2033 | 2033‑2034 | 2034‑2035 | 2035‑2036 | 2036‑2037 | 2037‑2038 | 2038‑2039 | 2039‑2040 | 2040‑2041 | 2041‑2042 | 2042‑2043 | 2043‑2044 | 2044‑2045 | 2045‑2046 | |
|---|---|---|---|---|---|---|---|---|---|---|---|---|---|---|---|---|---|---|---|---|---|---|---|---|---|---|
| % | 44.5 | 52.4 | 54.1 | 30.2 | 29.8 | 29.5 | 29.2 | 28.9 | 28.7 | 28.4 | 28.2 | 28.0 | 27.8 | 27.6 | 27.5 | 27.3 | 27.2 | 27.1 | 27.0 | 26.9 | 26.7 | 26.6 | 26.6 | 26.5 | 26.4 | 26.0 |
Loans portfolio balance
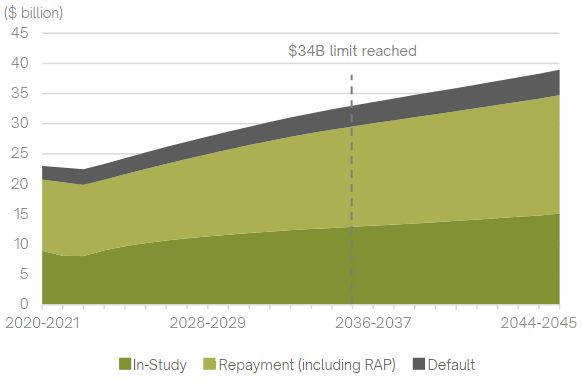
Loans portfolio balance - Table
| 2020‑2021 | 2021‑2022 | 2022‑2023 | 2023‑2024 | 2024‑2025 | 2025‑2026 | 2026‑2027 | 2027‑2028 | 2028‑2029 | 2029‑2030 | 2030‑2031 | 2031‑2032 | 2032‑2033 | 2033‑2034 | 2034‑2035 | 2035‑2036 | 2036‑2037 | 2037‑2038 | 2038‑2039 | 2039‑2040 | 2040‑2041 | 2041‑2042 | 2042‑2043 | 2043‑2044 | 2044‑2045 | 2045‑2046 | |
|---|---|---|---|---|---|---|---|---|---|---|---|---|---|---|---|---|---|---|---|---|---|---|---|---|---|---|
| In-Study | 9.0 | 8.1 | 8.1 | 9.0 | 9.7 | 10.2 | 10.6 | 11.0 | 11.3 | 11.6 | 11.9 | 12.1 | 12.4 | 12.6 | 12.7 | 12.9 | 13.1 | 13.3 | 13.5 | 13.7 | 13.9 | 14.1 | 14.4 | 14.6 | 14.8 | 15.1 |
| Repayment (including RAP) | 11.8 | 12.2 | 11.8 | 11.7 | 11.9 | 12.3 | 12.7 | 13.2 | 13.6 | 14.1 | 14.6 | 15.0 | 15.5 | 15.9 | 16.3 | 16.6 | 17.0 | 17.3 | 17.6 | 17.9 | 18.2 | 18.5 | 18.7 | 19.0 | 19.3 | 19.6 |
| Default | 2.3 | 2.4 | 2.6 | 2.6 | 2.7 | 2.7 | 2.8 | 2.9 | 2.9 | 3.0 | 3.0 | 3.1 | 3.2 | 3.3 | 3.4 | 3.5 | 3.5 | 3.6 | 3.7 | 3.8 | 3.8 | 3.9 | 4.0 | 4.1 | 4.1 | 4.2 |
Net annual cost of the Program
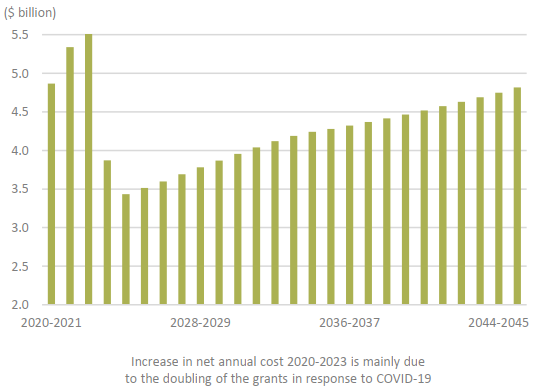
Net annual cost of the Program - Table
| 2020‑2021 | 2021‑2022 | 2022‑2023 | 2023‑2024 | 2024‑2025 | 2025‑2026 | 2026‑2027 | 2027‑2028 | 2028‑2029 | 2029‑2030 | 2030‑2031 | 2031‑2032 | 2032‑2033 | 2033‑2034 | 2034‑2035 | 2035‑2036 | 2036‑2037 | 2037‑2038 | 2038‑2039 | 2039‑2040 | 2040‑2041 | 2041‑2042 | 2042‑2043 | 2043‑2044 | 2044‑2045 | 2045‑2046 | |
|---|---|---|---|---|---|---|---|---|---|---|---|---|---|---|---|---|---|---|---|---|---|---|---|---|---|---|
| ($ billion) | 4.87 | 5.34 | 5.62 | 3.87 | 3.43 | 3.51 | 3.60 | 3.69 | 3.78 | 3.87 | 3.96 | 4.04 | 4.12 | 4.19 | 4.24 | 4.28 | 4.32 | 4.37 | 4.42 | 4.47 | 4.52 | 4.57 | 4.63 | 4.69 | 4.75 | 4.82 |
Total program expenses 2020-2021 and 2024-2025
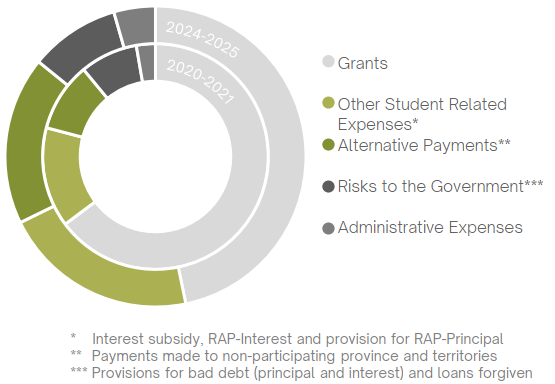
Total program expenses 2020-2021 and 2024-2025 - Table
| 2020‑2021 | 2024‑2025 | |
|---|---|---|
| Grants | 3,188 | 1,668 |
| Other Student Related ExpensesTable Footnote * | 706 | 749 |
| Alternative PaymentsTable Footnote ** | 487 | 645 |
| Risks to the GovernmentTable Footnote *** | 406 | 345 |
| Administrative Expenses | 134 | 159 |
|
Table Footnotes
|
||
Footnotes
- Footnote 1
-
A comprehensive list is presented in the report
- Footnote 2
-
Excluding Skills Boost top-up grant and grant for services and equipment for students with disabilities