Actuarial Report (19th) on the Pension Plan for the Public Service of Canada as at 31 March 2020 - Highlights
Accessibility statement
The Web Content Accessibility Guidelines (WCAG) defines requirements for designers and developers to improve accessibility for people with disabilities. It defines three levels of conformance: Level A, Level AA, and Level AAA. This report is partially conformant with WCAG 2.0 level AA. If you require a compliant version, please contact webmaster@osfi-bsif.gc.ca.
Office of the Superintendent of Financial Institutions
Office of the Chief Actuary
Main Findings
| Financial Position ($ millions) |
AccountFootnote 1 | Fund |
|---|---|---|
| Recorded Balance/Actuarial Value of Assets | 91,537 | 125,409 |
| Liabilities | 98,837 | 110,909 |
| Surplus (ShortfallFootnote 2) | (7,300) | 14,500 |
| Funding Ratio | 92.6% | 113.1% |
| Member Contribution Rates Calendar Year 2022 |
Group 1 | Group 2 |
|---|---|---|
| Below YMPEFootnote * | 9.36% | 7.95% |
| Above YMPE | 12.48% | 11.82% |
Message from the Chief Actuary
- The current service cost is shared equally between the employees and the employer. The current service cost is expected to decrease due to the increasing weight of Group 2 members.
- Contributions are expected to exceed Fund expenditures until 2031.
- We reflected the impacts of the COVID-19 pandemic on the economic assumptions used in this report. The pandemic is a very fluid situation that will continue to evolve for some time. The final impacts will be reflected in future reports
Key Assumptions
| Discount Rate | Current | Previous |
|---|---|---|
| Ultimate real rate on the Account | 2.1% | 2.7% |
| Equivalent flat real rate on the Fund | 3.6% | 3.7% |
| Life expectancy at age 65 (in years) | 2020 | 2036 |
|---|---|---|
| Male | 22.9 | 23.9 |
| Female | 24.6 | 25.5 |
Current Service Cost
(% of pensionable payroll, by calendar year)
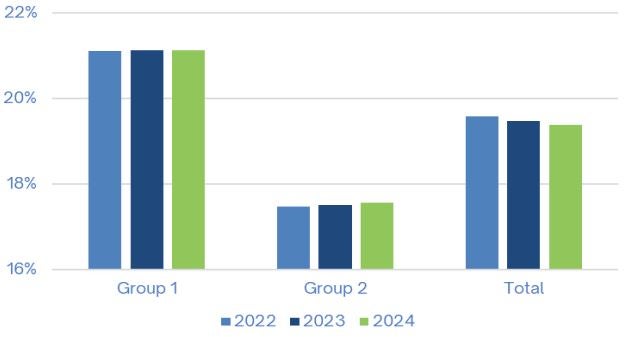
Graphic description - Current Service Cost
| Calendar Year | Group 1 | Group 2 | Total |
|---|---|---|---|
| 2022 | 21.11% | 17.46% | 19.58% |
| 2023 | 21.12% | 17.50% | 19.47% |
| 2024 | 21.12% | 17.56% | 19.38% |
| Number | Average Age | |
|---|---|---|
| Contributors | 331,406 | 44.4 |
| Pensioners | 258,537 | 68.4 |
| Surviving Spouses | 47,677 | 79.6 |
| Surviving Children | 1,159 | 13.3 |
| Total Membership | 638,779 |
Account and Fund Projection
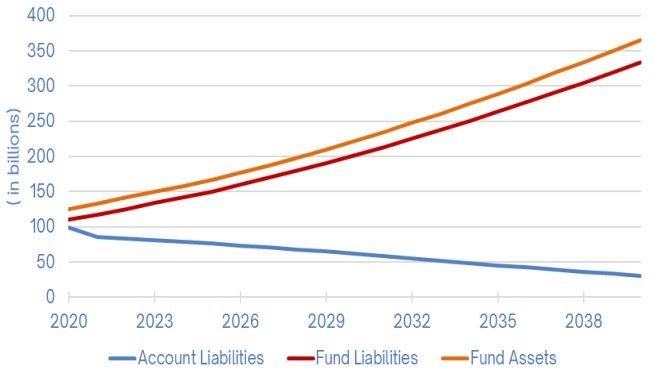
Graphic description - Account and Fund Projection
| As of 31 March | Account Liabilities | Fund Liabilities | Fund Assets |
|---|---|---|---|
| 2020 | 99 | 111 | 125 |
| 2023 | 82 | 133 | 151 |
| 2026 | 74 | 160 | 180 |
| 2029 | 65 | 191 | 212 |
| 2032 | 55 | 225 | 248 |
| 2035 | 45 | 264 | 289 |
| 2038 | 36 | 305 | 334 |
Evolution of Cash Flows over Time
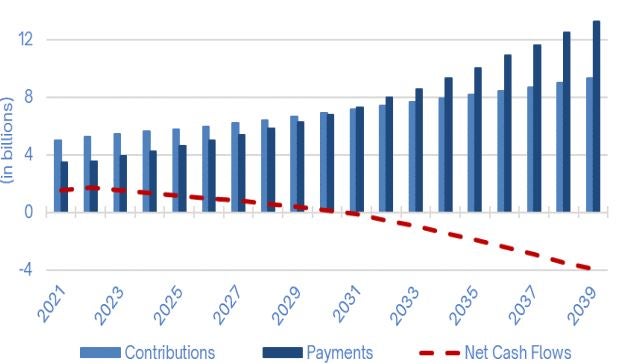
Graphic description - Evolution of Cash Flows over Time
Bar graph showing the evolution of cash flows under the Pension Fund over time. Y-axis represents the expected contributions, payments and resulting net cash flows in millions. X-axis represents the plan year, starting in 2021 and ending in 2039.
In plan year 2021, contributions to the Pension Fund are $5,018 million, whereas payments are $3,493 million, resulting in net cash flows of $1,525 million. Both contributions and payments are increasing over time, however payments are increasing at a higher rate than the contributions. Payments will be higher than contributions starting plan year 2031.
In 2031, the chart shows payments of $7,279 million exceeding contributions of $7,145 million and resulting in net cash flows of negative $134 million. From 2031, the Pension Fund experiences negative net cash flows. In plan year 2039, contributions to the Pension Fund reach $9,292 million, whereas payouts reach $13,252 million resulting in net cash flows of negative $3,960 million.
Footnotes
- Footnote 1
-
The Account tracks the liability for service prior to 1 April 2000.
- Footnote 2
-
It is expected that a special credit of $7,805 million in 2022 will eliminate the Account shortfall including accrued interest.
- Footnote *
-
The actual 2021 YMPE is $61,600. It is projected to increase to $65,300 in 2022.