Office of the Superintendent of Financial Institutions’ 2023-2024 Departmental results report
On this page
Copyright information
© His Majesty the King in Right of Canada, as represented by the Minister of Finance and National Revenue, 2025, ISSN 2561-0716
From the Superintendent

On behalf of the Office of the Superintendent of Financial Institutions (OSFI), I am proud to present our Departmental Results Report for fiscal year 2023-24.
This past year has been pivotal for OSFI. Not only have we navigated a complex risk environment, but we have also made great strides in reinforcing resilience in Canada's financial system through our initiatives.
As you will see in our report, we had several remarkable achievements this year. In June 2023, our mandate was expanded to include integrity, security, and foreign interference in our supervisory and regulatory functions. This has resulted in the development and implementation of appropriate guidance to the financial institutions that we supervise. This expanded mandate is very significant for us, as over the last year, it has become more evident that non-financial risks can effectively become financial risks if left unchecked.
We have updated our Supervisory Framework to reflect our new risk appetite, better respond to new financial and non-financial risks and give broader flexibility to our supervisors in their decision-making processes. We have also continued work on the Data Collection Modernization (DCM) initiative that was launched alongside the Bank of Canada and the Canada Deposit Insurance Corporation. Finally, the Office of the Chief Actuary (OCA) continued to meet its mandate by providing independent actuarial services and advice to ensure the stability and sustainability of Canada's social programs, public sector pension plans, and insurance arrangements.
OSFI's 2022-25 Strategic Plan responds to our heightened risk environment as well as sets out our goals and priorities. It also establishes concrete actions that we will take to ensure that we continue to contribute to confidence in Canada's financial system.
As always, OSFI will keep taking a balanced approach that protects depositors, policyholders, creditors, and pension plan beneficiaries while respecting financial institutions' responsibility to compete and take risks.
I take pride in the work described in this report as it will allow us to keep delivering on our promise to protect the safety and soundness of our financial system.
Peter Routledge
Superintendent
Results – what we achieved
Core responsibilities and internal services
Core responsibility 1: Financial Institution and Pension Plan Regulation and Supervision
In this section
Description
The Office of the Superintendent of Financial Institutions (OSFI) advances a regulatory framework designed to control and manage risk to federally regulated financial institutions (FRFIs) and private pension plans (FRPPs) and evaluates system-wide or sectoral developments that may have a negative impact on their financial condition. It also supervises financial institutions and pension plans to determine whether they are in sound financial condition and meeting regulatory and supervisory requirements. The Office promptly advises financial institutions and pension plan administrators if there are material deficiencies, and takes corrective measures or requires that they be taken to expeditiously address the situation. It acts to protect the rights and interests of depositors, policyholders, financial institution creditors and pension plan beneficiaries, while having due regard for the need to allow financial institutions to compete effectively and take reasonable risks.
Progress on results
This section presents details on how the department performed to achieve results and meet targets for Financial Institution and Pension Plan Regulation and Supervision. Details are presented by departmental result.
Table 1: Targets and results for Financial Institution and Pension Plan Regulation and Supervision
Table 1 provides a summary of the target and actual results for each indicator associated with the results under Financial Institution and Pension Plan Regulation and Supervision.
| Departmental Result Indicators | Target | Date to achieve target | Actual results |
|---|---|---|---|
| % of financial institutions with a Composite Risk Rating of low or moderate. | At least 80% | March 31, 2024 |
|
| Number of financial institutions for which the supervisory rating (i.e., risk level) has increased by two or more levels within a three-month period. | 1 or less | March 31, 2024 |
|
| Number of pension plans for which the supervisory rating (i.e., risk level) has increased by two or more levels within a three-month period. | 1 or less | March 31, 2024 |
|
|
Table 1.1 Footnotes
|
|||
| Departmental Result Indicators | Target | Date to achieve target | Actual results |
|---|---|---|---|
| The Office of the Superintendent of Financial Institutions' level of compliance with the International Monetary Fund's Financial Sector Assessment Program core principles. | 100% | March 31, 2024 |
|
| The Office of the Superintendent of Financial Institutions’ level of compliance with Basel standards as assessed by the Regulatory Consistency Assessment Programme of the Bank for International Settlements. | 90% | March 31, 2024 |
|
|
Table 1.2 Footnotes
|
|||
Additional information on the detailed results and performance information for OSFI's program inventory is available on GC InfoBase.
Details on results
The following section describes the results for Financial Institution and Pension Plan Regulation and Supervision in 2023–24 compared with the planned results set out in OSFI's departmental plan for the year.
The government introduced an expanded mandate to OSFI in Budget 2023 to ensure that institutions manage risks to their integrity and security responsibly. We now supervise financial institutions in two key areas – sound financial conditions and integrity and security, including foreign interference. In 2023-24, we began to implement the expanded mandate, which included the development and issuance of guidance, such as the first Security and Integrity Guideline. Since the establishment of the National Security Sector in 2023-24, key milestones include the formulation of a detailed workplan and the finalization of the sector's vision and mandate.
Strategic Stakeholder and Partner Engagement
In 2023–24, we developed a proactive and coordinated approach to strategic stakeholder management, and leveraged partner and stakeholder engagement plans as part of our strategic risk response. This allowed us to integrate and align with key stakeholders and partners inside and outside of the Government of Canada to ensure the safety and soundness of the financial system.
Results achieved
- Built a Stakeholder Affairs function, with coordinating roles, responsibilities, processes, and tools defined.
- Developed a variety of tools, templates, strategies, communications and engagement plans, best practices, governance, and processes, including a Stakeholder Relationship Management system used to track and report on OSFI's engagements, communication and engagement planning templates to support stakeholder and partner engagement, and a stakeholder mapping and internal partner continuum model.
- Fielded the biennial Financial Institutions Survey, which collects feedback from financial institutions on their engagement experience with OSFI. The results of the survey were positive overall, and we use the feedback to identify and address gaps in stakeholder and partner engagement on an ongoing basis.
- Explored opportunities to measure engagement, including key performance indicators and how to establish baselines.
- Deepened integration and coordination with internal partners and external stakeholders such as the Financial Institutions Supervisory Committee (FISC), the Financial Stability Board (FSB), and the Basel Committee for Banking Supervision (BCBS).Footnote 1
Policy Innovation
In 2023–24, we focused our policy work related to top risk areas including housing, digital innovation, climate, and integrity and security, which was part of OSFI's expanded mandate announced in Budget 2023. We aimed to become a global leader in prudential supervision by making policy to support operational and financial resilience of our regulated entities in the face of key financial and non-financial risks. In order to refocus our efforts on the newly introduced mandate, we intentionally reduced and eliminated work on commitments related to Policy Architecture Renewal and the Digital Innovation Roadmap.
Results achieved
- Regulatory Notice on residential real estate secured lending (RESL), reinforcing risk management expectations, and complementing Guideline B-20.
- Final Guideline B-10 (Third-Party Risk).
- Intelligence-led Cyber Resilience Testing (I-CRT) Framework.
- Draft revised Guideline E-21 (Operational Risk and Resilience).
- Draft Culture and Behaviour Risk Guideline.
- Final Guideline B-13 (Technology and Cyber Risk) and Guideline B-10 (Third-Party Risk).
- Final Guideline B-15 (Climate) and Climate Risk Data Return Instructions.
- Interim Regulatory Capital and Liquidity Treatment of Crypto Asset Exposures, and Joint Statement on Crypto-Asset Activities with the Financial Consumer Agency of Canada and the Canada Deposit Insurance Corporation.
Supervision Renewal
In 2023–24, we redesigned and launched a new Supervisory Framework to reflect our new risk appetite statement and support our ability to take early corrective action when problems arise.
As part of our supervisory renewal efforts, we enhanced various functions to enable our supervisors to more effectively and efficiently manage their portfolios of regulated institutions and pension plans through increased capacity, a collective responsibility for risk assessments and management, and enhanced use of data and analytics.
Results achieved
- Launched and supported the implementation of a new Supervisory Framework for institutions and pension plans, which came into effect on April 1, 2024. With the redesign, we can:
- better respond to risks, including both financial and non-financial risks
- leverage data analytics to create insights and provide timely signals of changes in risk levels
- apply and ensure alignment with our risk appetite
- Developed and launched Vu 2.0, our supervisory system of record, to ensure simplification, streamlining, and alignment with the new Supervisory Framework.
- Established a Supervision Institute responsible for a new onboarding program for supervisors and training to support staff in their supervisory roles.
- Modernized risk monitoring tools and piloted the use of advanced analytics to enable data-driven, risk-based supervisory decisions and financial risk assessment.
- Approved a supervision interaction model, making enhancements to the model throughout the year.
- Created the Insurance Risk and Capital and Pension Risk team to respond to heightened risks in our regulated insurers and pension plans, while aligning with the International Association of Insurance Supervisors and their core principles.
- Provided support to supervisors through continuous improvement activities, such as risk rating panels and quality assurance reviews.
Other Regulation and Supervision Priorities
Results achieved
- To ensure institutions' financial and risk measures, including our capital and liquidity regimes, remain appropriate in stress scenarios, in 2023–24, we:
- Performed quarterly reviews of life insurance capital adequacy test (LICAT) and minimum capital test (MCT) results that reflected implementation of International Financial Reporting Standard (IFRS) 17 for insurance contracts.
- Performed a capital sensitivity test to understand LICAT volatility post IFRS 17 implementation.
- Focused on the new segregated fund guarantee capital approach, limiting other major policy reviews and changes due to reprioritization.
- Published a revised Capital Adequacy Requirements guideline for banks, effective fiscal Q1 2024.
- Along with the insurance industry in Canada, we successfully transitioned to the new IFRS 17, which included significant training activities for supervisors.
- Published our public consultation on institutions' public disclosure of crypto-asset disclosures through an industry letter.
- Issued final amendments to the Pillar 3 Disclosure Guidelines, which incorporate the Market Risk and Credit Valuation Adjustments disclosure requirements.
- Assessed overall risk management practices at institutions to determine alignment with the evolving risk environment that they operate in, particularly related to residential mortgage activities, commercial real estate, and corporate lending. In doing so, we:
- Conducted 38 supervisory reviews of credit risk management at institutions and issued over 100 recommendations.
- Assessed 139 submissions with evidence of closure for outstanding recommendations.
- Issued industry letters and published regulatory notices for residential secured lending (RESL) and commercial real estate.
- Implemented the Model Vulnerability Dashboard, providing a consolidated view of systemically important banks' model risk.
- Reviewed and announced decisions on the minimum qualifying rate (MQR) in December 2023.
- Launched a directed consultation (Quantitative Impact Study #7) on the new segregated fund guarantee capital framework, with the final guidance expected to be published in November 2024, which will come into effect in January 2025.
- Assisted in the rollout of phase 2 of the third-party data call to identify and monitor third-party exposures and vulnerabilities. We were also involved in the Basel Committee on Banking Supervision's workstream to develop principles for sound management of third-party risk.
- Supported OSFI representation on intergovernmental initiatives, including payment modernization at Payments Canada, open banking and artificial intelligence during related institution discussions.
- Assessed systemic risks and vulnerabilities in the financial services sector to support the domestic stability buffer (DSB) June 2023 and December 2023 decisions.
- Supported the development of the draft Pension Plan Risk Management Guideline. The Canadian Association of Pension Supervisory Authorities (CAPSA) published the draft guideline, which included guidance on investments and cyber risk, for a 90-day consultation period. We continue to work alongside other CAPSA members to revise the draft guideline based on comments received during the consultation process. The final guideline is expected to be issued by CAPSA in 2024–25.
- Released our Annual Risk Outlook (ARO) and semi-annual update for 2023–24. The ARO is a publication that outlines what OSFI sees as the most significant risks facing Canada's financial system in the upcoming year. The ARO also informs Canadians about the actions OSFI will take in response to these risks.
Resources required to achieve results
Table 2 provides a summary of the planned and actual spending and full-time equivalents (FTEs) required to achieve results.
| Resource | Planned | Actual |
|---|---|---|
| Spending | 142,174,356 | 162,579,294 |
| Full-time equivalents | 696 | 779 |
Complete financial and human resources information for OSFI's program inventory is available on GC InfoBase.
Related government-wide priorities
United Nations 2030 Agenda for Sustainable Development and the Sustainable Development Goals
In 2023–24, we developed and tabled our first Departmental Sustainable Development Strategy (DSDS), supporting the 2022–26 Federal Sustainable Development Strategy (FSDS). The DSDS discusses our strategies to support UN Sustainable Development Goals (SDGs) and we will be releasing our first progress report on our 2024–27 DSDS in the fall of 2024.
More information on OSFI's contributions to Canada's Federal Implementation Plan on the 2030 Agenda and the Federal Sustainable Development Strategy can be found in our Departmental Sustainable Development Strategy.
Innovation
In 2023–24, we were agile as part of our transformation agenda and prepared to shift activities to account for changing priorities and operational needs should financial system conditions change. We completed a Stop-Rethink-Reimagine exercise, which aimed to stop activities that are no longer fit for purpose and to rethink and reimagine work to drive innovation and efficiencies. As a result, we eliminated a number of low value manual work processes such as an outdated time recording system. We developed a single work flow system that could be used for all planning activities including program management, replacing a number of individual efforts. Together with other initiatives, the exercise strengthened our agility in reprioritization.
Program inventory
Financial Institution and Pension Plan Regulation and Supervision is supported by the following programs:
- Risk Assessment and Intervention – Federally Regulated Financial Institutions
- Regulation and Guidance of Federally Regulated Financial Institutions
- Regulatory Approvals and Legislative Precedents
- Federally Regulated Private Pension Plans
Additional information related to the program inventory for Financial Institution and Pension Plan Regulation and Supervision is available on the Results page on GC InfoBase.
Core responsibility 2: Actuarial Services to Federal Government Organizations
In this section
Description
The Office of the Chief Actuary (OCA) provides a range of actuarial services, including statutory actuarial valuations required by legislation and checks and balances on the future costs of programs for the Canada Pension Plan, Old Age Security, Employment Insurance and Canada Student Loans programs, as well as pension and benefits plans covering the Federal Public Service, the Canadian Forces, the Royal Canadian Mounted Police, federally appointed judges, and Members of Parliament.
Progress on results
This section presents details on how the department performed to achieve results and meet targets for Actuarial Services to Federal Government Organizations. Details are presented by departmental result.
Table 3 provides a summary of the target and actual results for each indicator associated with the results under Actuarial Services to Federal Government Organizations.
Stakeholders receive accurate and high quality actuarial information on the cost of public programs and government pension and benefit plans.
| Departmental Result Indicators | Target | Date to achieve target | Actual results |
|---|---|---|---|
| % of members of a panel of Canadian peer actuaries that deem the Canada Pension Plan actuarial valuation accurate and of high quality. | 100% Agreement among all three members of peer review panel | March 31, 2024 |
|
| % of public pension and insurance plan valuations that are deemed accurate and high quality. | 100% | March 31, 2024 |
|
|
Table 3 Footnotes
|
|||
Additional information on the detailed results and performance information for OSFI's program inventory is available on GC InfoBase.
Details on results
The following section describes the results for Actuarial Services to Federal Government Organizations in 2023–24 compared with the planned results set out in OSFI's departmental plan for the year.
Actuarial Valuation and Advice
The OCA contributes to financial system oversight by helping to ensure that social programs and public sector pension and insurance arrangements remain sound and sustainable for Canadians. In 2023–24, the OCA continued to meet its mandate by providing high-quality actuarial information on the cost of public programs and government pension and benefit plans.
Results achieved:
- Performed an assessment of the current financing model to identify its associated risks and recommend next steps.
- Submitted the following actuarial reports to the President of Treasury Board for tabling before Parliament in 2023–24:
- Actuarial Report on the Pension Plan for the Federally Appointed Judges as at 31 March 2022 – tabled on November 24, 2023.
- Actuarial Report on the Pension Plan for the Members of Parliament as at 31 March 2022 – tabled on November 24, 2023.
- Actuarial Report on the Pension Plans for the Canadian Forces (Regular Force and Reserve Force) as at 31 March 2022 – tabled on November 24, 2023.
- Actuarial Report on the Regular Force Death Benefit Account as at 31 March 2022 – tabled on November 24, 2023.
- Published the 2024 Actuarial Report on the Employment Insurance Premium Rate to the Canada Employment Insurance Commission on September 14, 2023.
- Submitted the Actuarial Report on the Old Age Security Program as at 31 December 2021, tabled on November 3, 2023.
- Submitted various actuarial reports for the purpose of Public Accounts of Canada, presenting the obligations and costs, as at March 31, 2023, associated with federal public sector pension and benefit plans, including future benefits to veterans.
- Commissioned an independent peer review of the Canada Pension Plan (CPP) 31 report, the ninth review of its kind, with results released on June 29, 2023. Their findings confirm that the work performed by the OCA on the report meets professional standards of practice and statutory requirements, and that the assumptions and methods used are reasonable.
- Prepared and published the Actuarial Report on the Canada Student Financial Assistance Program as at 31 July 2022 on June 23, 2023.
- Conducted an actuarial study on climate change and how it may affect the plans and programs under the OCA's responsibility, expected to be published in 2024–25.
- Collaborated in a joint study conducted by the International Actuarial Association and the International Social Security Association (ISSA) on actuarial considerations around climate-related risks on social security, expected to be published in 2024.
- Presented on climate change impacts at several different events, which included:
- 21st ISSA Conference of Social Security Actuaries, Statisticians and Investment Specialists.
- Canadian Institute of Actuaries (CIA) General Conference, Halifax June 2023.
- Article in Seeing Beyond the Risk, Reflecting Climate Change in the Canada Pension Plan and CIA Podcast.
- As part of its ongoing provision of sound actuarial advice, aided federal government departments with actuarial advice, including the Department of Finance, Employment and Social Development Canada, Treasury Board Secretariat, Veterans Affairs Canada, National Defence, Royal Canadian Mounted Police, the Department of Justice, and Public Services and Procurement Canada.
- Supported ad-hoc requests for actuarial advice for Immigration, Refugees and Citizenship Canada and Health Canada.
Resources required to achieve results
Table 4 provides a summary of the planned and actual spending and full-time equivalents (FTEs) required to achieve results.
| Resource | Planned | Actual |
|---|---|---|
| Spending | 11,891,119 | 11,745,076 |
| Full-time equivalents | 56 | 51 |
Complete financial and human resources information for OSFI's program inventory is available on GC InfoBase.
Program inventory
Actuarial Services to Federal Government Organizations is supported by the following programs:
- Actuarial Valuation and Advice
Additional information related to the program inventory for Actuarial Services to Federal Government Organizations is available on the Results page on GC InfoBase.
Internal services
In this section
Description
Internal services are the services that are provided within a department so that it can meet its corporate obligations and deliver its programs. There are 10 categories of internal services:
- management and oversight services
- communications services
- legal services
- human resources management services
- financial management services
- information management services
- information technology services
- real property management services
- materiel management services
- acquisition management services
Progress on results
This section presents details on how the department performed to achieve results and meet targets for internal services.
Culture and Enabler Initiatives
In 2023–24, we strived to advance a workplace where curious, diverse, high-integrity colleagues are safe to bring their true and best selves to work everyday and are safe to fail and then adapt. Key activities included the launch of various culture and information management/information technology (IM/IT) initiatives. Our work to nurture a workplace where our desired values and culture thrive included the following:
- Articulated our three critical success factors of grit, urgency, and integrity across our organization.
- We continued work on a new Human Capital Strategy to replace the previous one.
- Reviewed management and leadership development programs, with new and enhanced programs developed for people leaders and executives.
- Launched the Harvard ManageMentor (HMM) Program and established a peer network to support this cohort of managers.
- Embedded the newly released Promises and Commitments into our 2023–24 Performance Management Cycle, forming the basis of behavioural expectations of employees.
- Updated the talent management program for REX-level employees, and reviewed talent management results for RE-level employees to determine potential program options.
- Launched the Official Languages (OL) Strategy, alongside the two-year OL Action Plan.
- Advanced the 2022–2025 Diversity, Equity and Inclusion Action Plan by:
- Progressing on the implementation of an Accessibility Plan.
- Reviewing employment systems, policies, and practices to develop recommendations that we can undertake for inclusivity.
- Establishing a Pay Equity Committee, who developed an OSFI-specific job evaluation tool.
- Launching a sponsorship program for employment equity designated groups.
We continued to implement strategies to support transformation efforts, prioritizing efficiency over process and promoting a change mindset through the following activities:
- Completion of the Stop-Rethink-Reimagine exercise, with proposals for activities to be adjusted for reprioritization across different sectors of our organization.
- Piloted a revised contract request process to improve the overall client experience with procurement and contracting services, which included simplified forms and templates.
- Continued collaboration with partners across the organization on workstreams, and participated in an Enterprise Risk Management (ERM) risk cascade, developing key risk indicators with partners.
- Progressed on the implementation of a dedicated Enterprise Change Management function through the build-up of change management and change leadership capacity, while also supporting transformation and infrastructure initiatives across our organization.
We continued advancing IM/IT initiatives including seeking central agency approvals for a a new Human Resources Management System (HRMS), which were obtained in June 2024. We also carried out the approved IM/IT Strategy and roadmap aligned to IM/IT strategic objectives, which included transformation, data accessibility, and talent.
Risk, Strategy and Governance
As an organization, we make risk-intelligent decisions every day that reflect our transparent and stated risk appetite through leadership and governance that delegates decision-making, from the top to the leaders best positioned to make decisions. This included enhancing environmental scanning tools to advance our assessment of risks and trends and implementing a risk appetite and framework to ensure risk-based decision making. In doing so, we:
- Developed and implemented an enterprise-wide risk appetite framework (RAF) that defines the risks we are willing to take in pursuit of our mandate. The RAF is used as the foundation of our governance.
- Developed an ERM framework, policy, and ERM methodologies to be socialized across the organization in the future.
- Re-launched an OSFI-wide planning and reporting forum with a group of financial and business representatives to strengthen development of tools, products, collaboration, and best practices.
- Implemented a mature governance structure with various committees to support supervision, policy, risk management and operational oversight for the organization.
- Initiated work on a technology solution and supporting procedures to automate risk management processes and tools, risk data assessment, and risk analytics.
- Developed a new 2024-27 Strategic Plan along with related Sector Plans and an Operational Plan, and progressed on integrated key performance and risk indicators.
- Advanced stress testing capabilities by completing an independent validation of the Risk Scenario Assessment Tool, conducting 2023 Macro Stress Test.
- Designed and executed an Artificial Intelligence and Quantum Computing questionnaire in partnership with the Financial Consumer Agency of Canada.
- Published nine research reports on topics such as new and evolving risks arising from geopolitics and non-bank financial institutions through Horizon Risk Research.
- Developed eight regular risk reports and published a variety of ad hoc reports related to ongoing events and topical explainers through Industry Surveillance, contributing to broader risk sensitive decision making across various groups at OSFI.
- Completed the build and rollout of risk-related dashboards, which covered risks such as DSB vulnerability and risk indicators, corporate and commercial credit, and combined loan plan - home equity line of credit analysis.
- Developed growth-at-risk metrics and a new group of leading indicators to assess the broader economic environment.
- Developed, monitored, and reported on key risk indicators for risks such as third-party risk, cyber risk, and market risk.
Data Management and Analytics
Our data platform enables analytical research and insight-generation while at the same time eliminating most ad hoc data requests made to regulated entities. Key activities included establishing our next data strategy, "Vision 2030," and making data and analytics an integral part of our operations and decision making.
In 2023–24, we built on our current data strategy to establish our "Vision 2030" Data Strategy, a medium- to long-term plan for transforming the use of data and analytics. This following work was done:
- Conducted research and internal consultation and developed a strategy for Vision 2030.
- Established a three-year work plan and high-level roadmap to 2030 for implementation.
- Embedded advanced data and analytics tools such as OpenAI in the new Technology Exploration Space (TES) release.
We also advanced a business case on the Data Collection Modernization initiative by Financial Information Committee (FIC)Footnote 2 agencies, with work started on key workstreams including procurement and data.
As part of aligning data and analytics into our culture, we established a data analytics community of practice on Microsoft Teams, along with a data analytics collaboration group. We developed a data literacy strategy and foundational training, with future integration into the HCS planned. We drafted Initial materials, and identified potential members for an external analytics advisory committee.
Hybrid work environment
We're continuing to make upgrades to our offices, digital infrastructure, and communications practices as our hybrid environment evolves. We established onsite location capacity to meet our expectations for onsite presence and released the first version of a metric to assess and monitor the effectiveness of our hybrid model. To that effort, in 2023-24 we opened our Vancouver office.
We also introduced new technology to enable a hybrid environment, rolling out Cloud and digital adoption that focuses on modernizing work practices and moving applications to the Cloud. With this, we migrated our information management software system (eSpace) to the Cloud, leveraging SharePoint Online software. We ensured alignment between eSpace, and various applications used within the organization, as well as support for our supervisory system (Vu 2.0) interdependencies. Additionally, IM/IT worked in collaboration with the three lines to establish governance, processes, and functions aligned with our IM/IT Risk Management Framework to identify and assess, respond, monitor, and report on risks and opportunities.
Innovation
We rely on data analysis to measure risk, identify trends, and make evidence-based decisions. As a result, the IM/IT group added advanced analytics tools within the new TES release and launched the Advanced Data Analytics Platform and Technologies, providing accessibility to all data and tools in one space.
Resources required to achieve results
Table 5 provides a summary of the planned and actual spending and full-time equivalents (FTEs) required to achieve results.
| Resource | Planned | Actual |
|---|---|---|
| Spending | 140,660,512 | 137,147,391 |
| Full-time equivalents | 369 | 485 |
The complete financial and human resources information for OSFI's program inventory is available on GC InfoBase.
Contracts awarded to Indigenous businesses
Government of Canada departments are to meet a target of awarding at least 5% of the total value of contracts to Indigenous businesses each year. This commitment is to be fully implemented by the end of 2024–25.
OSFI's result for 2023–24
As shown in the Table 6, OSFI awarded 8.5% of the total value of all contracts to Indigenous businesses for the fiscal year.
| Contracting performance indicators | 2023–24 Results |
|---|---|
| Total value of contracts awarded to Indigenous businessesTable 6 Footnote 2 (A) | $3,645,691 |
| Total value of contracts awarded to Indigenous and non‑Indigenous businessesTable 6 Footnote 3 (B) | $42,558,605 |
| Value of exceptions approved by deputy head (C) | $0 |
| Proportion of contracts awarded to Indigenous businesses [A ÷ (B−C) × 100] | 8.57% |
|
Table 6 Footnotes
|
|
We surpassed the minimum 5% target through the procurement of IT professional services, IT hardware, and furniture. We ensure that purchases of IT hardware and furniture requirements are made using mandatory standing offers and supply arrangements when feasible, with emphasis on the use of qualified Indigenous suppliers, to the greatest extent possible. Similarly, the procurement of IT professional services uses mandatory supply arrangements, where possible, extending the invitation to bid to qualified Indigenous suppliers and using voluntary or conditional set-asides where capacity is deemed to exist.
In our 2024–25 Departmental Plan, we forecasted that, by the end of 2023–24, we would award 5% of the total value of our contracts to Indigenous businesses.
Spending and human resources
In this section
Spending
This section presents an overview of the department's actual and planned expenditures from 2021–22 to 2026–27.
Budgetary performance summary
Table 7 presents how much money OSFI spent over the past three years to carry out its core responsibilities and for internal services.
| Core responsibilities and internal services | 2023–24 Main Estimates | 2023–24 total authorities available for use | Actual spending over three years (authorities used) |
|---|---|---|---|
| Financial Institution and Pension Plan Regulation and Supervision | 142,174,356 | 158,920,129 |
|
| Actuarial Services to Federal Government Organizations | 11,891,119 | 11,891,119 |
|
| Subtotal | 154,065,475 | 170,811,248 | 174,324,369 |
| Internal services | 140,660,512 | 140,660,512 |
|
| Total | 294,725,987 | 311,471,760 | 311,471,760 |
Analysis of the past three years of spending
Overall spending increases of 15.5% in 2022-23 and 29.9% in 2023-24 are largely driven by the implementation of OSFI's Blueprint and the 2022-2025 Strategic Plan. Additional information on the increase in planned spending can be found in OSFI's 2023-24 Departmental Plan.
Total spending for 2023-24 of $311.5M exceeds the planned spending outlined in the 2023-24 Departmental Plan ($294.7M) by $16.8M. This variance is primarily due to economic adjustments for collective agreements and spending related to OSFI's new mandate, offset by savings realized as part of refocusing government spending announced in Budget 2023. The reductions were achieved through savings in travel, hospitality and discretionary professional services. Planned spending for these items was not included in the 2023-24 Departmental Plan.
Economic adjustments related to collective agreements included within the 2023-24 Departmental Plan were based on a compounded 1.5% rate adjustment; however, the compounded rate increases recently negotiated by various public service bargaining groups were higher (4.75% in 2022-23 and 3.5% in 2023-24). These increases are non-discretionary and a normal course of operational budget growth.
OSFI's new mandate was announced in Budget 2023 to ensure FRFIs manage risks to their integrity and security responsibly. Implementation of the new mandate, including the development and issuance of guidance, commenced in 2023-24 to position OSFI to have required elements in place for January 1, 2024.
More financial information from previous years is available on the Finances section of GC Infobase.
Table 8 presents how much money OSFI plans to spend over the next three years to carry out its core responsibilities and for internal services.
| Core responsibilities and internal services | 2024–25 planned spending | 2025–26 planned spending | 2026–27 planned spending |
|---|---|---|---|
| Financial Institution and Pension Plan Regulation and Supervision | 185,309,931 | 197,343,671 | 199,147,413 |
| Actuarial Services to Federal Government Organizations | 12,530,230 | 13,535,414 | 13,690,292 |
| Subtotal | 197,840,161 | 210,879,085 | 212,837,705 |
| Internal services | 124,097,700 | 123,151,724 | 124,584,147 |
| Total | 321,937,861 | 334,030,809 | 337,421,852 |
Analysis of the next three years of spending
Planned spending for 2024-25, 2025-26, and 2026-27 of $321.9M, $334.0M and $337.4M, respectively, represent annual increases of $10.5M (3.4%), $12.1M (3.8%) and $3.4M (1.0%).
The increase in spending relates primarily to requirements related to the operationalization of OSFI's new integrity and security mandate, Data Collection Modernization (DCM) project, and economic increases to cover collective bargaining increases for employees.
In particular, OSFI's new mandate will require additional investments in 2024-25 to 2026-27 to create capacity and enable operations with other Government of Canada security partners by creating secure physical and digital infrastructure.
The DCM project is a tri-agency initiative alongside the Bank of Canada and the Canada Deposit Insurance Corporation to modernize regulatory data collection for FRFIs and FRPPs.
These increases are offset in part by reductions to be realized as part of refocusing government spending announced in Budget 2023 that amount to $4.6M in 2024-25, $6.3M in 2025-26 and $8.8M in 2026-27.
More detailed financial information from previous years is available on the Finances section of GC Infobase.
Funding
This section provides an overview of the department's voted and statutory funding for its core responsibilities and for internal services. For further information on funding authorities, consult the Government of Canada budgets and expenditures.
Graph 1 summarizes the department's approved voted and statutory funding from 2021–22 to 2026–27.
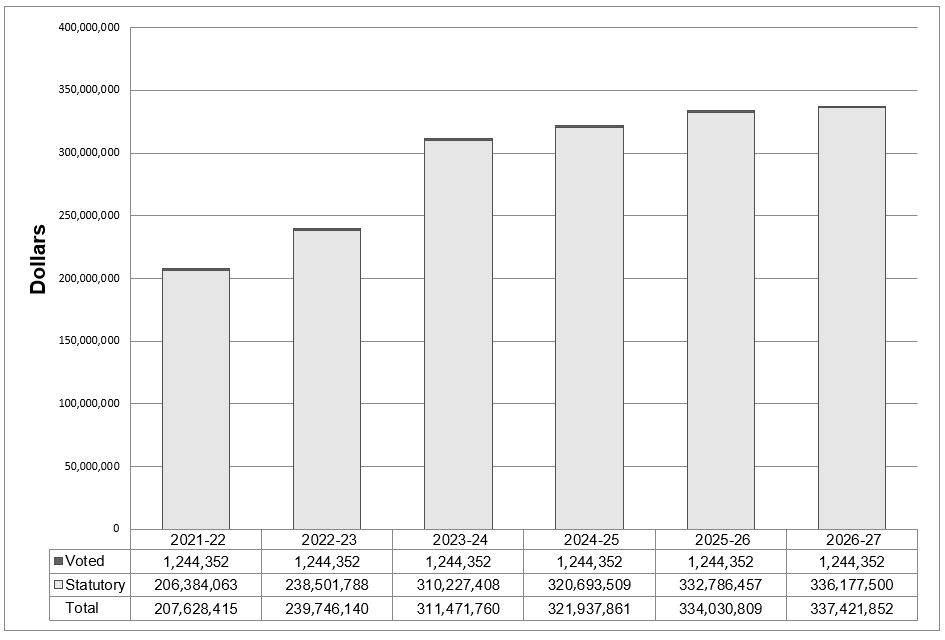
Text version of graph 1
| Spending | 2021-22 | 2022-23 | 2023-24 | 2024-25 | 2025-26 | 2026-27 |
|---|---|---|---|---|---|---|
| Voted | 1,244,352 | 1,244,352 | 1,244,352 | 1,244,352 | 1,244,352 | 1,244,352 |
| Statutory | 206,384,063 | 238,501,788 | 310,227,408 | 320,693,509 | 332,786,457 | 336,177,500 |
| Total | 207,628,415 | 239,746,140 | 311,471,760 | 321,937,861 | 334,030,809 | 337,421,852 |
Analysis of voted and statutory funding over a six-year period
The graph above represents OSFI's actual spending for 2021-22, 2022-23 and 2023-24, and current planned spending thereafter. Statutory expenditures, which are recovered from respendable revenue, represent over 99% of total expenditures. The remainder of OSFI's spending is funded from a parliamentary appropriation for actuarial services related to federal public sector pension and benefit plans.
The increase in 2022-23 and 2023-24 reflects the implementation of OSFI's Blueprint and the 2022-25 Strategic Plan. Starting in 2023-24, OSFI began implementation of its new mandate, as well as work on the DCM project. Incremental spending for the new mandate and DCM are further reflected in fiscal years 2024-25 to 2026-27. Increased spending also reflects the impact of economic increases for collective bargaining, offset by the reductions for refocusing government spending initiative.
For further information on OSFI's departmental voted and statutory expenditures, consult the Public Accounts of Canada.
Financial statement highlights
OSFI's complete financial statements (audited) for the year ended March 31, 2024, are available online.
Table 9.1 summarizes the expenses and revenues for 2023–24 which net to the cost of operations before government funding and transfers.
| Financial information | 2023–24 actual results | 2023–24 planned results | Difference (actual results minus planned) |
|---|---|---|---|
| Total expenses | 311,721,750 | 294,400,000 | 17,321,750 |
| Total revenues | 310,477,398 | 293,155,648 | 17,321,750 |
| Net cost of operations before government funding and transfers | 1,244,352 | 1,244,352 | 0 |
The 2023–24 planned results information is provided in OSFI's Future-Oriented Statement of Operations and Notes 2023–24.
Table 9.2 summarizes actual expenses and revenues which net to the cost of operations before government funding and transfers.
| Financial information | 2023–24 actual results | 2022–23 actual results | Difference (2023-24 minus 2022-23) |
|---|---|---|---|
| Total expenses | 311,721,750 | 242,795,705 | 68,926,045 |
| Total revenues | 310,477,398 | 241,551,353 | 68,926,045 |
| Net cost of operations before government funding and transfers | 1,244,352 | 1,244,352 | 0 |
Table 10 provides a brief snapshot of the department's liabilities (what it owes) and assets (what the department owns), which helps to indicate its ability to carry out programs and services.
| Financial information | Actual fiscal year (2023–24) | Previous fiscal year (2022–23) | Difference (2023–24 minus 2022–23) |
|---|---|---|---|
| Total net liabilities | 88,691,000 | 73,319,000 | 15,372,000 |
| Total net financial assets | 97,225,000 | 82,989,000 | 14,236,000 |
| Departmental net debt | 8,534,000 | 9,670,000 | -1,136,000 |
| Total non-financial assets | 17,146,000 | 16,010,000 | 1,136,000 |
| Departmental net financial position | 25,680,000 | 25,680,000 | 0 |
Human resources
This section presents an overview of the department's actual and planned human resources from 2021–22 to 2026–27.
Table 11 shows a summary of human resources, in full-time equivalents (FTEs), for OSFI's core responsibilities and for its internal services for the previous three fiscal years.
| Core responsibilities and internal services | 2021–22 actual FTEs | 2022–23 actual FTEs | 2023–24 actual FTEs |
|---|---|---|---|
| Financial Institution and Pension Plan Regulation and Supervision | 583 | 621 | 779 |
| Actuarial Services to Federal Government Organizations | 40 | 45 | 51 |
| Subtotal | 623 | 666 | 830 |
| Internal services | 297 | 358 | 485 |
| Total | 920 | 1,024 | 1,315 |
Analysis of human resources over the last three years
The growth in FTEs is mainly due to the implementation of OSFI's 2022-25 Strategic Plan, which entails FTE increases across OSFI.
Table 12 shows information on human resources, in full-time equivalents (FTEs), for each of OSFI's core responsibilities and for its internal services planned for the next three years. Human resources for the current fiscal year are forecasted based on year to date.
| Core responsibilities and internal services | 2024–25 planned FTEs | 2025–26 planned FTEs | 2026–27 planned FTEs |
|---|---|---|---|
| Financial Institution and Pension Plan Regulation and Supervision | 811 | 809 | 809 |
| Actuarial Services to Federal Government Organizations | 57 | 58 | 58 |
| Subtotal | 868 | 867 | 867 |
| Internal services | 430 | 436 | 431 |
| Total | 1,298 | 1,303 | 1,298 |
Analysis of human resources for the next three years
FTEs are forecast to remain stable over the next 3 years at levels slightly below that of 2023-24.
Corporate information
Departmental profile
Appropriate minister(s): The Honourable François-Philippe Champagne, P.C., M.P.
Institutional head: Peter Routledge
Ministerial portfolio: Finance
Enabling instrument(s): Office of the Superintendent of Financial Institutions Act (OSFI Act)
Year of incorporation / commencement: 1987
Departmental contact information
Mailing address:
Office of the Superintendent of Financial Institutions
255 Albert Street
Ottawa, Ontario K1A 0H2
Telephone: 1-800-385-8647
TTY: 1-800-465-7735
Fax: 1-613-990-5591
Email: webmaster@osfi-bsif.gc.ca
Website(s): https://www.osfi-bsif.gc.ca
Supplementary information tables
The following supplementary information tables are available on OSFI's website:
Federal tax expenditures
The tax system can be used to achieve public policy objectives through the application of special measures such as low tax rates, exemptions, deductions, deferrals and credits. The Department of Finance Canada publishes cost estimates and projections for these measures each year in the Report on Federal Tax Expenditures. This report also provides detailed background information on tax expenditures, including descriptions, objectives, historical information and references to related federal spending programs as well as evaluations and GBA Plus of tax expenditures.
Definitions
List of terms
- appropriation (crédit)
- Any authority of Parliament to pay money out of the Consolidated Revenue Fund.
- budgetary expenditures (dépenses budgétaires)
- Operating and capital expenditures; transfer payments to other levels of government, departments or individuals; and payments to Crown corporations.
- core responsibility (responsabilité essentielle)
- An enduring function or role performed by a department. The intentions of the department with respect to a core responsibility are reflected in one or more related departmental results that the department seeks to contribute to or influence.
- Departmental Plan (plan ministériel)
- A report on the plans and expected performance of an appropriated department over a 3 year period. Departmental Plans are usually tabled in Parliament each spring.
- departmental priority (priorité)
- A plan or project that a department has chosen to focus and report on during the planning period. Priorities represent the things that are most important or what must be done first to support the achievement of the desired departmental results.
- departmental result (résultat ministériel)
- A consequence or outcome that a department seeks to achieve. A departmental result is often outside departments’ immediate control, but it should be influenced by program-level outcomes.
- departmental result indicator (indicateur de résultat ministériel)
- A quantitative measure of progress on a departmental result.
- departmental results framework (cadre ministériel des résultats)
- A framework that connects the department's core responsibilities to its departmental results and departmental result indicators.
- Departmental Results Report (rapport sur les résultats ministériels)
- A report on a department’s actual accomplishments against the plans, priorities and expected results set out in the corresponding Departmental Plan.
- full-time equivalent (équivalent temps plein)
- A measure of the extent to which an employee represents a full person-year charge against a departmental budget. For a particular position, the full-time equivalent figure is the ratio of number of hours the person actually works divided by the standard number of hours set out in the person’s collective agreement.
- gender-based analysis plus (GBA Plus) (analyse comparative entre les sexes plus [ACS Plus])
- An analytical tool used to assess support the development of responsive and inclusive how different groups of women, men and gender-diverse people experience policies, programs and policies, programs, and other initiatives. GBA Plus is a process for understanding who is impacted by the issue or opportunity being addressed by the initiative; identifying how the initiative could be tailored to meet diverse needs of the people most impacted; and anticipating and mitigating any barriers to accessing or benefitting from the initiative. GBA Plus is an intersectional analysis that goes beyond biological (sex) and socio-cultural (gender) differences to consider other factors, such as age, disability, education, ethnicity, economic status, geography (including rurality), language, race, religion, and sexual orientation.
- government-wide priorities (priorités pangouvernementales)
- For the purpose of the 2023–24 Departmental Results Report, government-wide priorities are the high-level themes outlining the government's agenda in the November 23, 2021, Speech from the Throne: building a healthier today and tomorrow; growing a more resilient economy; bolder climate action; fight harder for safer communities; standing up for diversity and inclusion; moving faster on the path to reconciliation; and fighting for a secure, just and equitable world.
- horizontal initiative (initiative horizontale)
- An initiative where two or more federal departments are given funding to pursue a shared outcome, often linked to a government priority.
- non-budgetary expenditures (dépenses non budgétaires)
- Net outlays and receipts related to loans, investments and advances, which change the composition of the financial assets of the Government of Canada.
- performance (rendement)
- What a department did with its resources to achieve its results, how well those results compare to what the department intended to achieve, and how well lessons learned have been identified.
- performance indicator (indicateur de rendement)
- A qualitative or quantitative means of measuring an output or outcome, with the intention of gauging the performance of an department, program, policy or initiative respecting expected results.
- plan (plan)
- The articulation of strategic choices, which provides information on how a department intends to achieve its priorities and associated results. Generally, a plan will explain the logic behind the strategies chosen and tend to focus on actions that lead to the expected result.
- planned spending (dépenses prévues)
-
For Departmental Plans and Departmental Results Reports, planned spending refers to those amounts presented in Main Estimates.
A department is expected to be aware of the authorities that it has sought and received. The determination of planned spending is a departmental responsibility, and departments must be able to defend the expenditure and accrual numbers presented in their Departmental Plans and Departmental Results Reports.
- program (programme)
- Individual or groups of services, activities or combinations thereof that are managed together within the department and focus on a specific set of outputs, outcomes or service levels.
- program inventory (répertoire des programmes)
- Identifies all the department's programs and describes how resources are organized to contribute to the department's core responsibilities and results.
- result (résultat)
- A consequence attributed, in part, to an department, policy, program or initiative. Results are not within the control of a single department, policy, program or initiative; instead they are within the area of the department’s influence.
- Indigenous business (entreprise autochtones)
- For the purpose of the Directive on the Management of Procurement Appendix E: Mandatory Procedures for Contracts Awarded to Indigenous Businesses and the Government of Canada's commitment that a mandatory minimum target of 5% of the total value of contracts is awarded to Indigenous businesses, a department that meets the definition and requirements as defined by the Indigenous Business Directory.
- statutory expenditures (dépenses législatives)
- Expenditures that Parliament has approved through legislation other than appropriation acts. The legislation sets out the purpose of the expenditures and the terms and conditions under which they may be made.
- target (cible)
- A measurable performance or success level that a department, program or initiative plans to achieve within a specified time period. Targets can be either quantitative or qualitative.
- voted expenditures (dépenses votées)
- Expenditures that Parliament approves annually through an appropriation act. The vote wording becomes the governing conditions under which these expenditures may be made.