Benchmarking Canadian Bank Capital Ratios to International Peers – Technical Note – February 2026
Table of contents
Executive Summary
This note presents a benchmarking analysis of Canadian Systemically Important Banks’ (SIBsFootnote 1) capital ratios, risk weights and profitability measures, based on publicly available data and staff analysis. It seeks to provide insights into the overall resilience and competitiveness of Canada’s banking system and OSFI’s supervisory expectations and contribute to public dialogue in these areas. Key findings include:
-
Canadian SIBs are well-capitalized and have strengthened in recent years. Capital surpluses have risen recently and continue to be well above OSFI supervisory expectations despite a challenging risk environment.Footnote 2 Since the 2008-09 global financial crisis, SIB capital ratios have increased significantly. This reflects a combination of capital growth, post-crisis Basel reforms, the introduction of the Domestic Stability Buffer (DSB), and a gradual decline in risk-weighted asset (RWA) density driven by long-term trends in portfolio mix, credit quality and performance.
-
OSFI’s capital supervisory expectations are broadly consistent with international peers, notwithstanding lower binding requirements.Footnote 3 In Canada, the DSB is a relatively large and usable (non-binding) Pillar 2 buffer, while other jurisdictions tend to combine (binding) Pillar 1 and (binding and non-binding) Pillar 2 add-ons that result in a similar or more constraining capital stack as reported. Selected peers include 19 Globally Systemically Important Banks (G-SIBs) as well as six other large and systemically important banks from US, Europe, UK and Australia.
-
Canadian SIB capital ratios and risk weights are in line with international peer ranges with certain exceptions. Risk-based ratios are close to the peer median while leverage ratios are somewhat lower in Canada, partly due to a significant concentration in real estate secured lending (RESL). Lower risk weights for RESL and retail segments reflect a history of strong credit performance and structural factors such as sovereign-backed mortgage insurance.
-
Canadian SIBs have strong profitability compared to international peers, reporting the highest return on equity (ROE), on average, in recent years. Historically, Canadian banks have exhibited solid performance over a sustained period including past business and financial cycles. Moreover, Canadian SIB domestic banking ROEs and risk-adjusted returns on capital have significantly exceeded those of their international banking segments based on public disclosures.
1. Background and Scope
OSFI periodically conducts benchmarking exercises of SIBs’ capital and profitability metrics as part of its mandate to assess both the resilience and competitiveness of the Canadian banking system. In this note, we focus on large, diversified banks in advanced economies that operate under broadly comparable regulatory, legal and accounting frameworks, to provide a meaningful comparison with Canadian SIBs. As such, the primary peer group consists of 25 international peers (19 G-SIBs and six other systemically important banks) from across US, Europe, UK and Australia.Footnote 4 An expanded peer group is also included in the appendix to consider additional jurisdictions for some of the analyses.
A number of factors have contributed to rising capital ratios in Canada over the past decade (Figure 1). The introduction of the DSB in mid-2018 and its subsequent increases contributed to this trend, alongside other influences that are harder to isolate, such as evolving SIB business models, shifts in risk appetite and a sustained decline in RWA density. In addition, OSFI has been a leader in implementing international capital standards, including the latest Basel III reforms.Footnote 5 However, given uncertainty around the timeline for full Basel III implementation in other jurisdictions, OSFI indefinitely deferred further increases to the standardized output floor in February 2025.
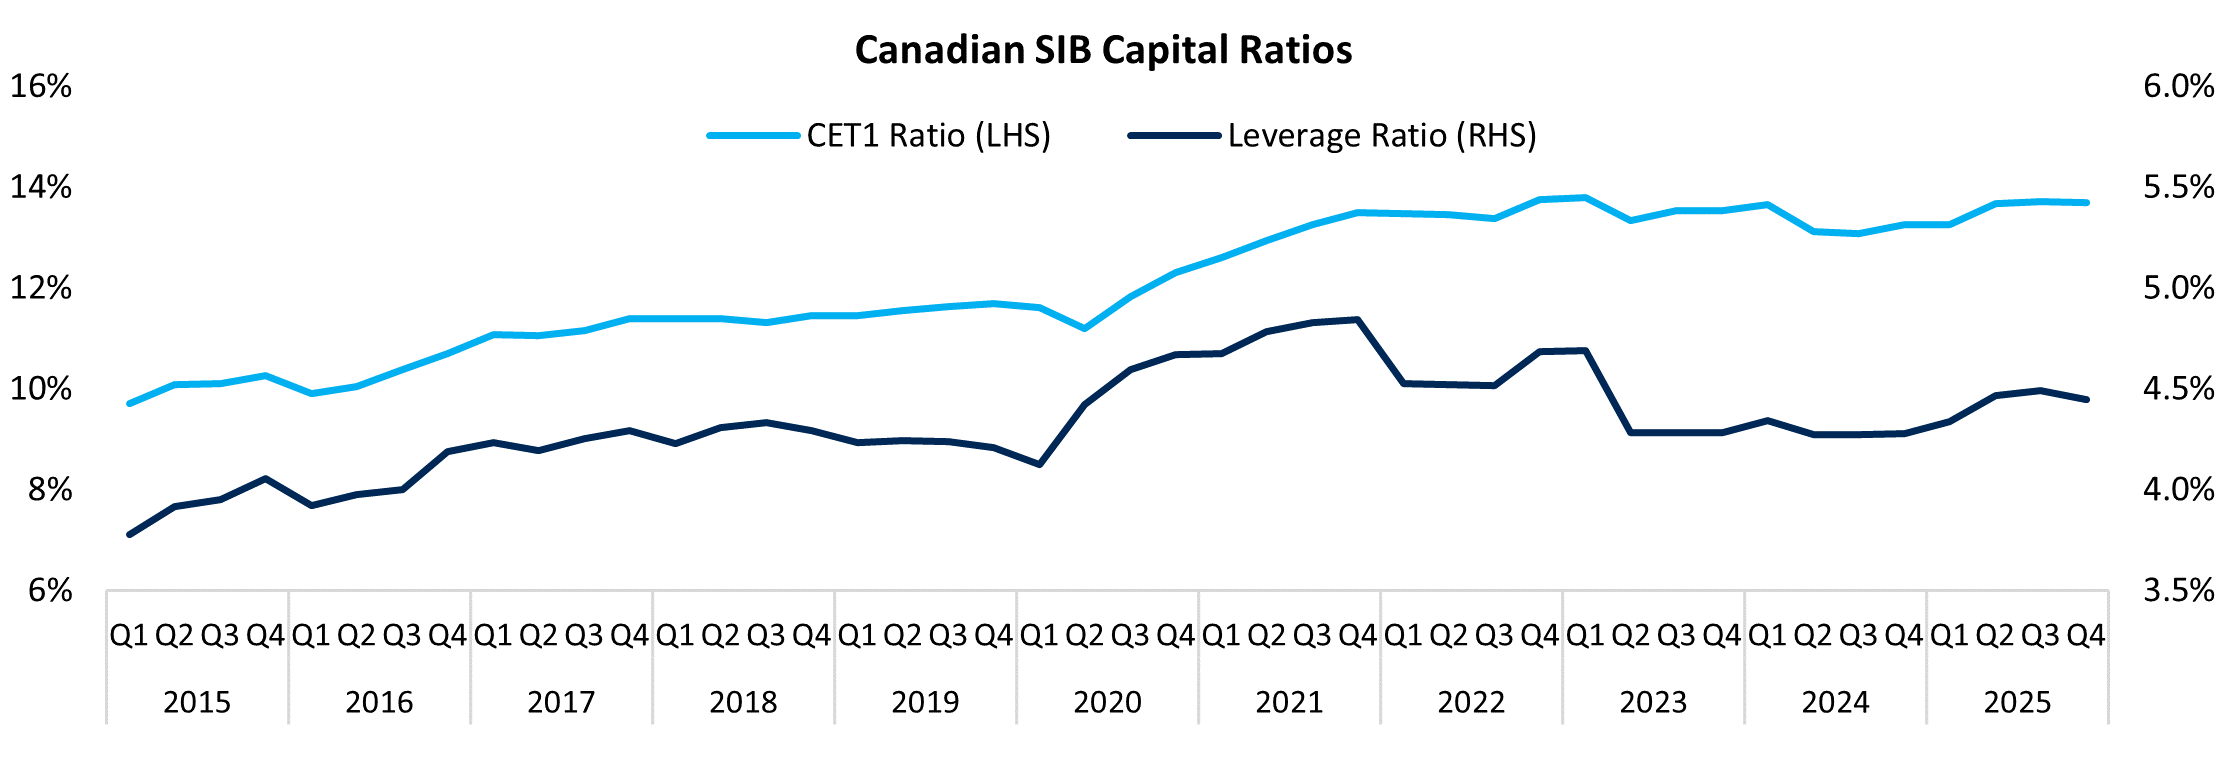
Figure 1 - Text version
| Year | Quarter | CET1 Ratio (LHS) | Leverage Ratio (RHS) |
|---|---|---|---|
| 2015 | Q1 | 9.7% | 3.8% |
| 2015 | Q2 | 10.1% | 3.9% |
| 2015 | Q3 | 10.1% | 4.0% |
| 2015 | Q4 | 10.3% | 4.1% |
| 2016 | Q1 | 9.9% | 3.9% |
| 2016 | Q2 | 10.0% | 4.0% |
| 2016 | Q3 | 10.4% | 4.0% |
| 2016 | Q4 | 10.7% | 4.2% |
| 2017 | Q1 | 11.1% | 4.2% |
| 2017 | Q2 | 11.0% | 4.2% |
| 2017 | Q3 | 11.1% | 4.3% |
| 2017 | Q4 | 11.4% | 4.3% |
| 2018 | Q1 | 11.4% | 4.2% |
| 2018 | Q2 | 11.4% | 4.3% |
| 2018 | Q3 | 11.3% | 4.3% |
| 2018 | Q4 | 11.5% | 4.3% |
| 2019 | Q1 | 11.4% | 4.2% |
| 2019 | Q2 | 11.5% | 4.2% |
| 2019 | Q3 | 11.6% | 4.2% |
| 2019 | Q4 | 11.7% | 4.2% |
| 2020 | Q1 | 11.6% | 4.1% |
| 2020 | Q2 | 11.2% | 4.4% |
| 2020 | Q3 | 11.8% | 4.6% |
| 2020 | Q4 | 12.3% | 4.7% |
| 2021 | Q1 | 12.6% | 4.7% |
| 2021 | Q2 | 12.9% | 4.8% |
| 2021 | Q3 | 13.3% | 4.8% |
| 2021 | Q4 | 13.5% | 4.8% |
| 2022 | Q1 | 13.5% | 4.5% |
| 2022 | Q2 | 13.5% | 4.5% |
| 2022 | Q3 | 13.4% | 4.5% |
| 2022 | Q4 | 13.8% | 4.7% |
| 2023 | Q1 | 13.8% | 4.7% |
| 2023 | Q2 | 13.3% | 4.3% |
| 2023 | Q3 | 13.5% | 4.3% |
| 2023 | Q4 | 13.5% | 4.3% |
| 2024 | Q1 | 13.7% | 4.3% |
| 2024 | Q2 | 13.1% | 4.3% |
| 2024 | Q3 | 13.1% | 4.3% |
| 2024 | Q4 | 13.3% | 4.3% |
| 2025 | Q1 | 13.2% | 4.3% |
| 2025 | Q2 | 13.7% | 4.5% |
| 2025 | Q3 | 13.7% | 4.5% |
| 2025 | Q4 | 13.7% | 4.4% |
Note: Figures represent aggregate capital ratios for the Canadian SIBs.
Sources: SIB public disclosures, OSFI calculations
2. International Capital Expectations and Capital Ratios
Comparing bank capital ratios across various jurisdictions is challenging due to differences in regulatory frameworks, the use of internal models or prescribed floors, and other factors. This is an important caveat to keep in mind when interpreting the predominately as-reported capital measures in the figures below.
A unique feature of the Canadian regime is that a large portion of the SIBs’ capital stack is non-binding due to OSFI’s more flexible principles-based approach to the DSB. A breach of the DSB – a usable pillar 2 buffer – would not lead to automatic constraints on capital distributions, unlike international buffers such as the Countercyclical Capital Buffer (CCyB) or Stress Capital Buffer (SCB).Footnote 6 All else equal, this allows Canadian SIBs to operate with smaller operating buffers above supervisory expectations compared to peers that are subject to more binding requirements.
Figure 2 compares actual CET1 ratios and supervisory expectations (‘capital stacks’) for Canadian SIBs and global peers. On an as-reported basis, Canadian SIBs’ aggregate CET1 ratio of 13.7% at Q4-2025 and supervisory expectation of 11.5% are broadly in line with peers. However, Canadian SIBs operate with more than 550 bps above the binding 8% requirement – a surplus far exceeding international peers – and at over 200 bps above the DSB. This capital excess may reflect factors such as macroeconomic and geopolitical uncertainty, evolving risk appetite, capital deployment strategies, and investor or rating agency expectations.
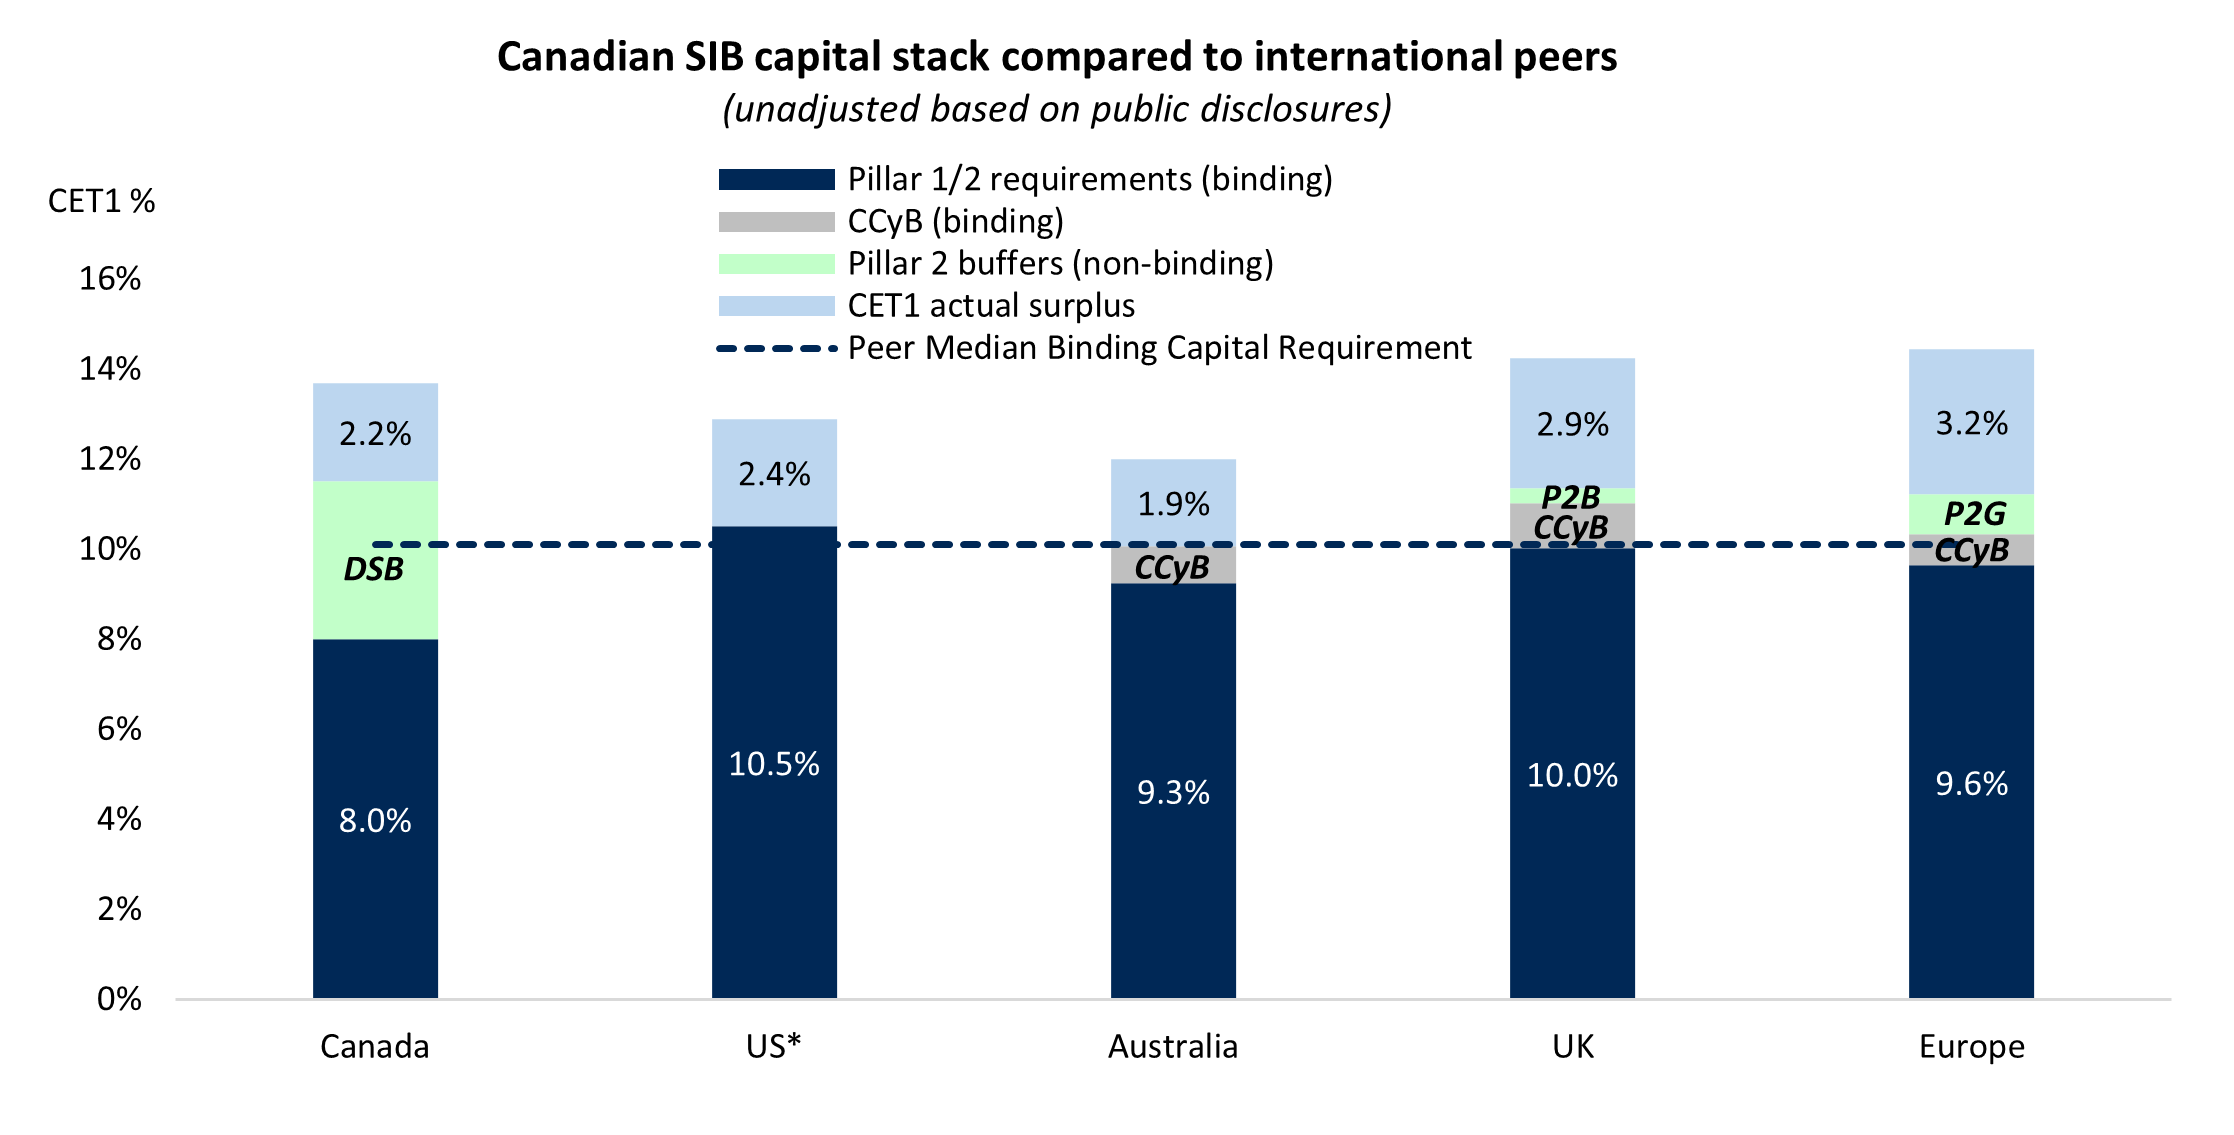
Figure 2 - Text version
| Pillar 1/2 requirements (binding) | CCyB (binding) | Pillar 2 buffers (non-binding) | Peer Median Binding Capital Requirement | CET1 actual surplus | |
|---|---|---|---|---|---|
| Canada | 8.0% | 0.0% | 3.5% (DSB) | 10.1% | 2.2% |
| US* | 10.5% | 0.0% | 0.0% | 10.1% | 2.4% |
| Australia | 9.3% | 0.8% | 0.0% | 10.1% | 1.9% |
| UK | 10.1% | 1.0% | Approx. 0.4% (P2B) | 10.1% | 2.9% |
| Europe | 9.6% | 0.7% | Approx. 0.9% (P2G) | 10.1% | 3.2% |
Notes:
- Bars represent aggregate CET1 ratios and supervisory expectations publicly disclosed as of Q3-Q4 2025 weighted by RWA in each jurisdiction.
- Peer group consists of six Canadian banks and 25 international peers including US/European G-SIBs and UK/Australian SIBs and large banks.
- The line represents the median of the Pillar 1/2 binding requirements (including CCyB) across 31 banks.
- IRB approach except US (*) where the standardized approach is the commonly constraining requirement.
- "Binding requirements" defined as thresholds resulting in automatic distribution restrictions if breached.
- CCyB is split out from other binding requirements as it is explicitly designed to absorb losses in systemic stress.
- Pillar 2 non-binding buffers based on publicly available data and staff estimates. UK Pillar 2 Buffer (P2B) approximated based on recent Prudential Regulation Authority (PRA) report covering the 14 largest UK banks. Europe Pillar 2 Guidance (P2G) approximated based on recent Supervisory Review and Evaluation Process (SREP) report covering European G-SIBs supervised by the European Central Bank.
Sources: Bank public filings and regulatory disclosures, supervisory reporting, OSFI staff calculations and estimates.
Figure 3 expands the focus to two additional measures of capital adequacy: (1) “standardized CET1 ratios” (based on public filings) and (2) leverage ratios. Overall, Canadian SIBs exhibit internal ratings-based (IRB) capital ratios that are very close to international peer medians, and somewhat lower on a standardized and leverage ratio basis. However, it is important to note that methodologies to calculate capital ratios are not fully comparable across countries, even “standardized” approaches. For example, it is widely recognized that the US has incorporated certain “gold-plating” elements in its standardized calculation beyond Basel requirements.Footnote 7 While the US capital framework is currently under review and expected to change, there is uncertainty regarding both the content and timing of future changes.
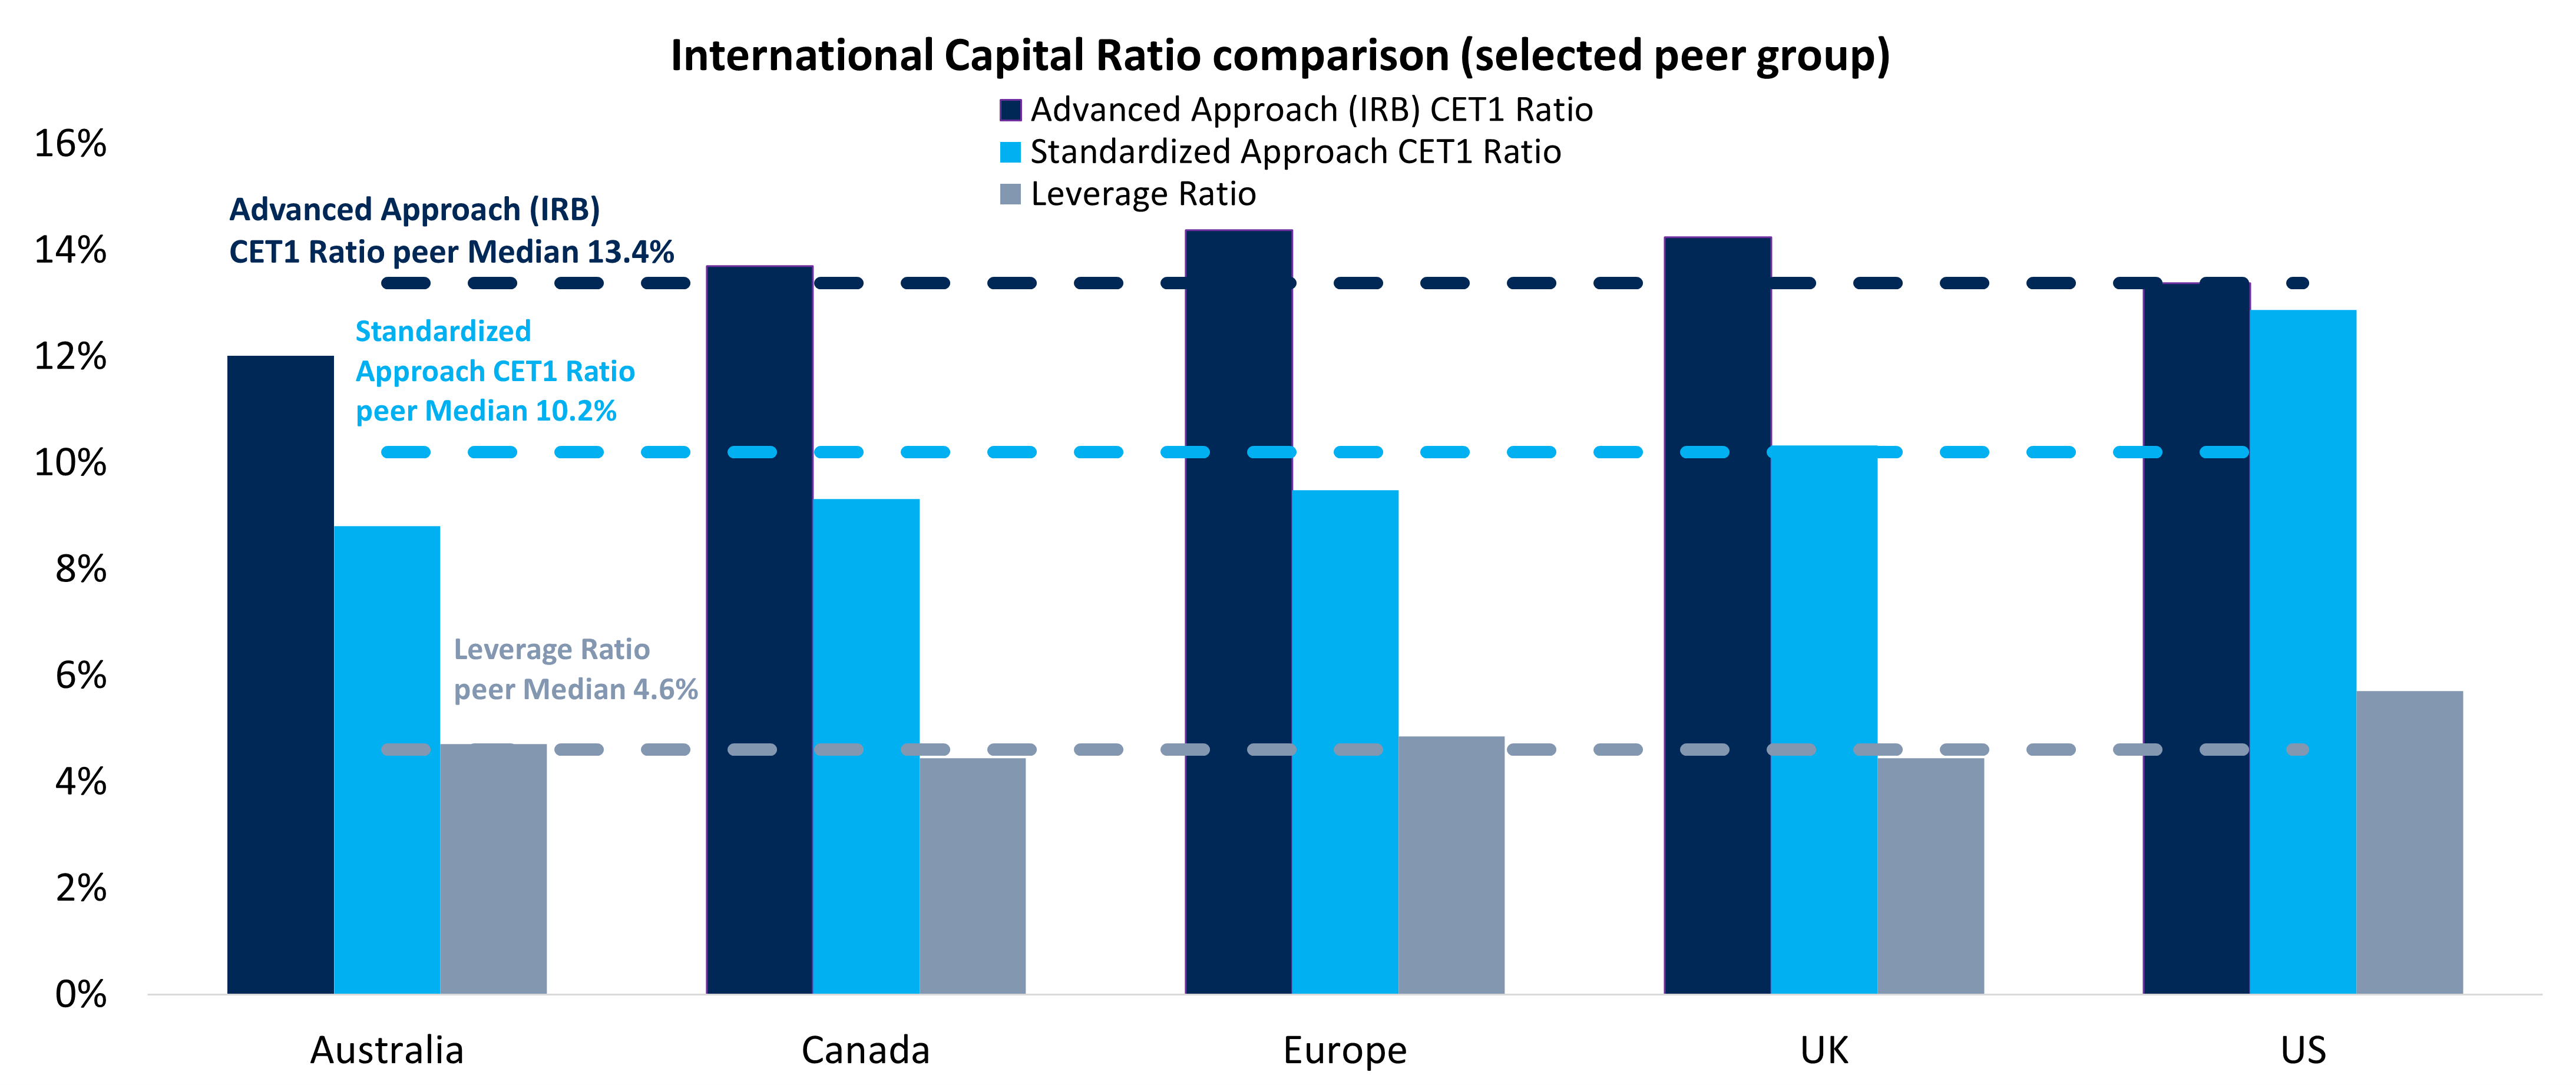
Figure 3 - Text version
International Capital Ratio comparison (selected peer group)
- Advanced Approach (IRB) CET1 Ratio peer Median: 13.4%
- Standardized Approach CET1 Ratio peer Median: 10.2%
- Leverage Ratio peer Median: 4.6%
| Advanced Approach (IRB) CET1 Ratio | Standardized Approach CET1 Ratio | Leverage Ratio | |
|---|---|---|---|
| Australia | 12.0% | 8.8% | 4.7% |
| Canada | 13.7% | 9.3% | 4.4% |
| Europe | 14.4% | 9.5% | 4.9% |
| UK | 14.3% | Approx. 10.3% | 4.4% |
| US | 13.4% | 12.9% | 5.7% |
Notes:
- Bars represent aggregate capital ratios of banks within each jurisdiction representing 25 peer banks and six Canadian SIBs.
- Dashed lines represent the median of capital ratios across 31 banks within the selected peer group.
- Methodologies differ across jurisdictions and are not directly comparable across Advanced Approach, Standardized Approach and Leverage Ratio; figures shown on “as-reported” basis in each jurisdiction as of Q3-Q4 2025 based on public reporting.
- Standardized Approach CET1 ratios calculated as CET1 capital divided by RWA on a standardized basis reflecting each jurisdiction’s unique implementation. For UK banks, standardized RWA was approximated by grossing-up the reported advanced approach RWA.
- Leverage ratios reflect Basel III methodology or comparable approach where there are multiple leverage ratios.
Sources: Latest available pillar 3 disclosures for the selected peer group (Q3-Q4 2025), OSFI calculations.
3. Risk‑Weighted Assets Benchmarking
Figure 4 takes a more granular view by comparing risk weights as a key driver of risk-based capital ratios (both by segment and in aggregate) across jurisdictions. In aggregate, we assess Canadian SIBs’ risk weights to be lower than peers driven mainly by retail and mortgage portfolios. Based on available data, Canadian corporate risk weights (excluding bank and sovereign) are close to peer medians, however, retail and mortgage risk weights are near the lower end of the peer group. This in part may reflect the historically strong credit performance of Canadian mortgage and retail segments, along with structural factors such as sovereign-backed mortgage insurance for high loan-to-value mortgages.
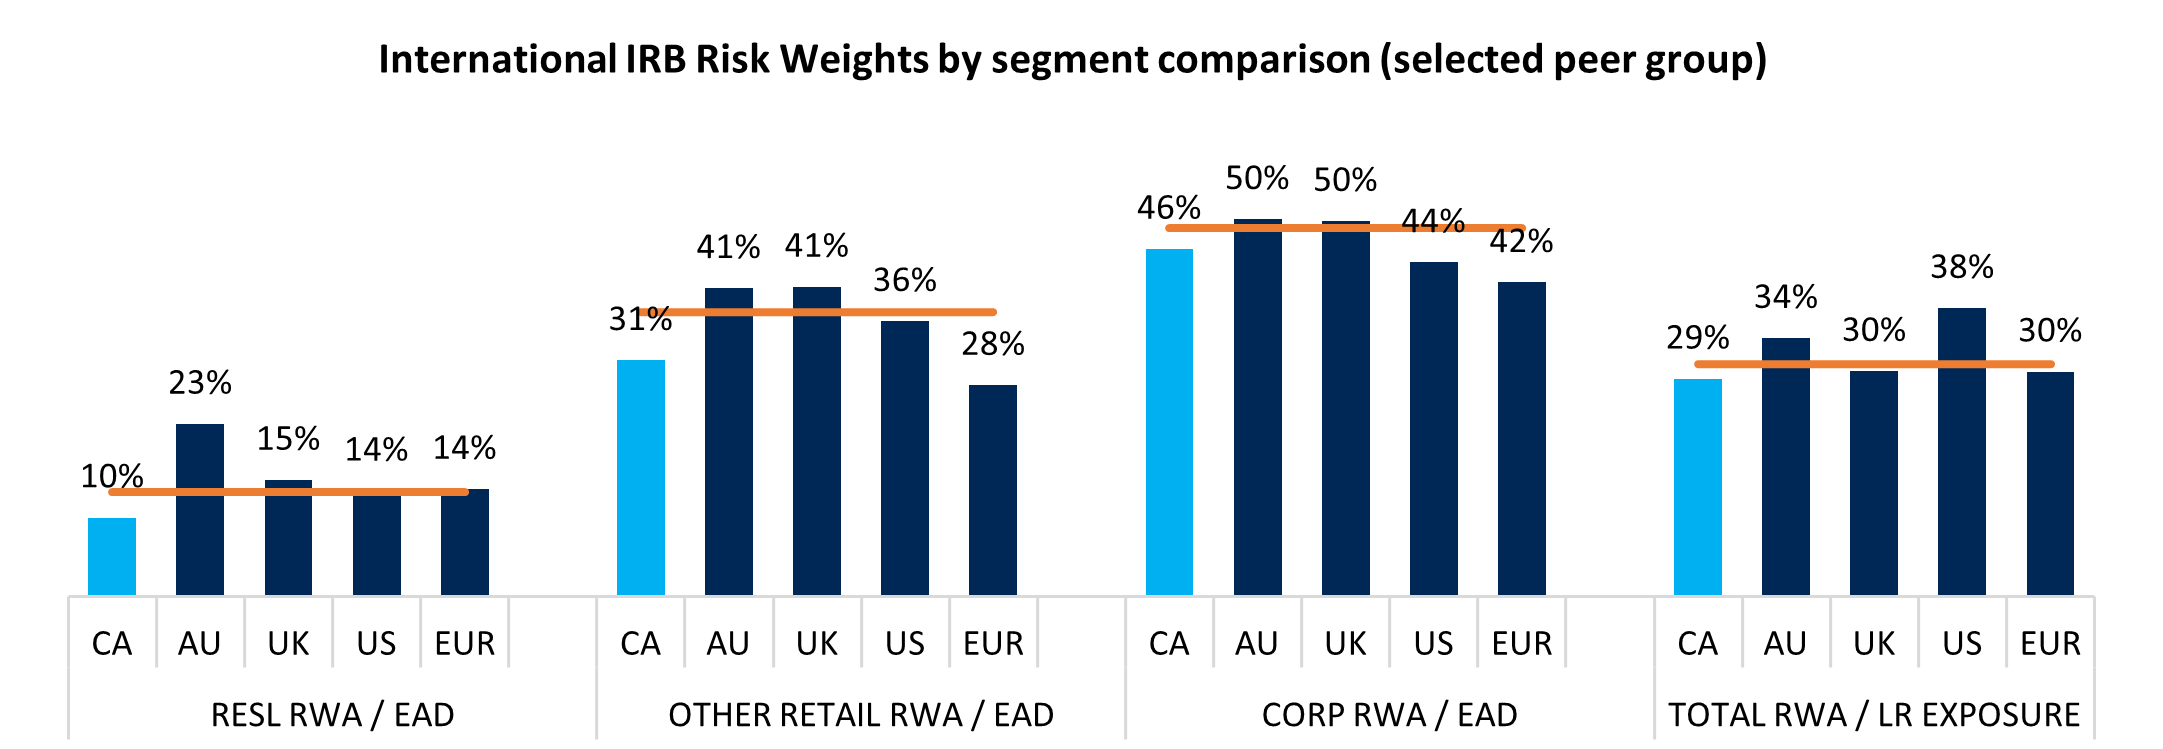
Figure 4 - Text version
| CA | AU | UK | US | EUR | Median | |
|---|---|---|---|---|---|---|
| RESL RWA / EAD | 10% | 23% | 15% | 14% | 14% | 14% |
| Other Retail RWA / EAD | 31% | 41% | 41% | 36% | 28% | 38% |
| Corp RWA / EAD | 46% | 50% | 50% | 44% | 42% | 49% |
| Total RWA / LR Exposure | 29% | 34% | 30% | 38% | 30% | 31% |
Notes:
- Bars represent segment IRB and advanced approach risk weights across six Canadian SIBs and 25 international peers as of Q3-Q4 2025, calculated as RWA divided by Exposure at Default (EAD) for a given segment or total RWA by Leverage Ratio Exposure.
- Lines represent the medians of risk weights across 31 banks within the selected peer group.
- RESL RWA / EAD includes retail residential mortgages and HELOC where data is publicly disclosed. For Canadian SIBs, represents domestic residential insured and uninsured RESL where publicly disclosed. Definitions vary somewhat across the peer group.
- Other Retail RWA / EAD includes qualifying revolving retail and other non-RESL retail segments.
- Corporate RWA / EAD definitions vary materially across jurisdictions, proxies used in cases where fully aligned segment is unavailable, e.g. US “Corporate” is an aggregate of three wholesale segments (Corporate, IPRE, HVCRE) and excludes split-out Repo and Derivatives.
- Total RWA / Leverage Ratio (LR) Exposure calculated as aggregated RWA under the advanced approach divided by Leverage Exposure.
Sources: Latest available pillar 3 disclosures, OSFI calculations.
4. Profitability (Return on Equity) Benchmarking
Historically, Canadian banks have exhibited high ROE compared to most international peers including in recent years, reflecting strong capital generation and higher leverage (Figure 5). Moreover, for Canadian banks that report regional breakdowns, Canadian banking segment ROE tends to be materially higher than US/International segments. Note that comparability is influenced by factors such as business mix, leverage and regulatory definitions which may vary across jurisdictions.
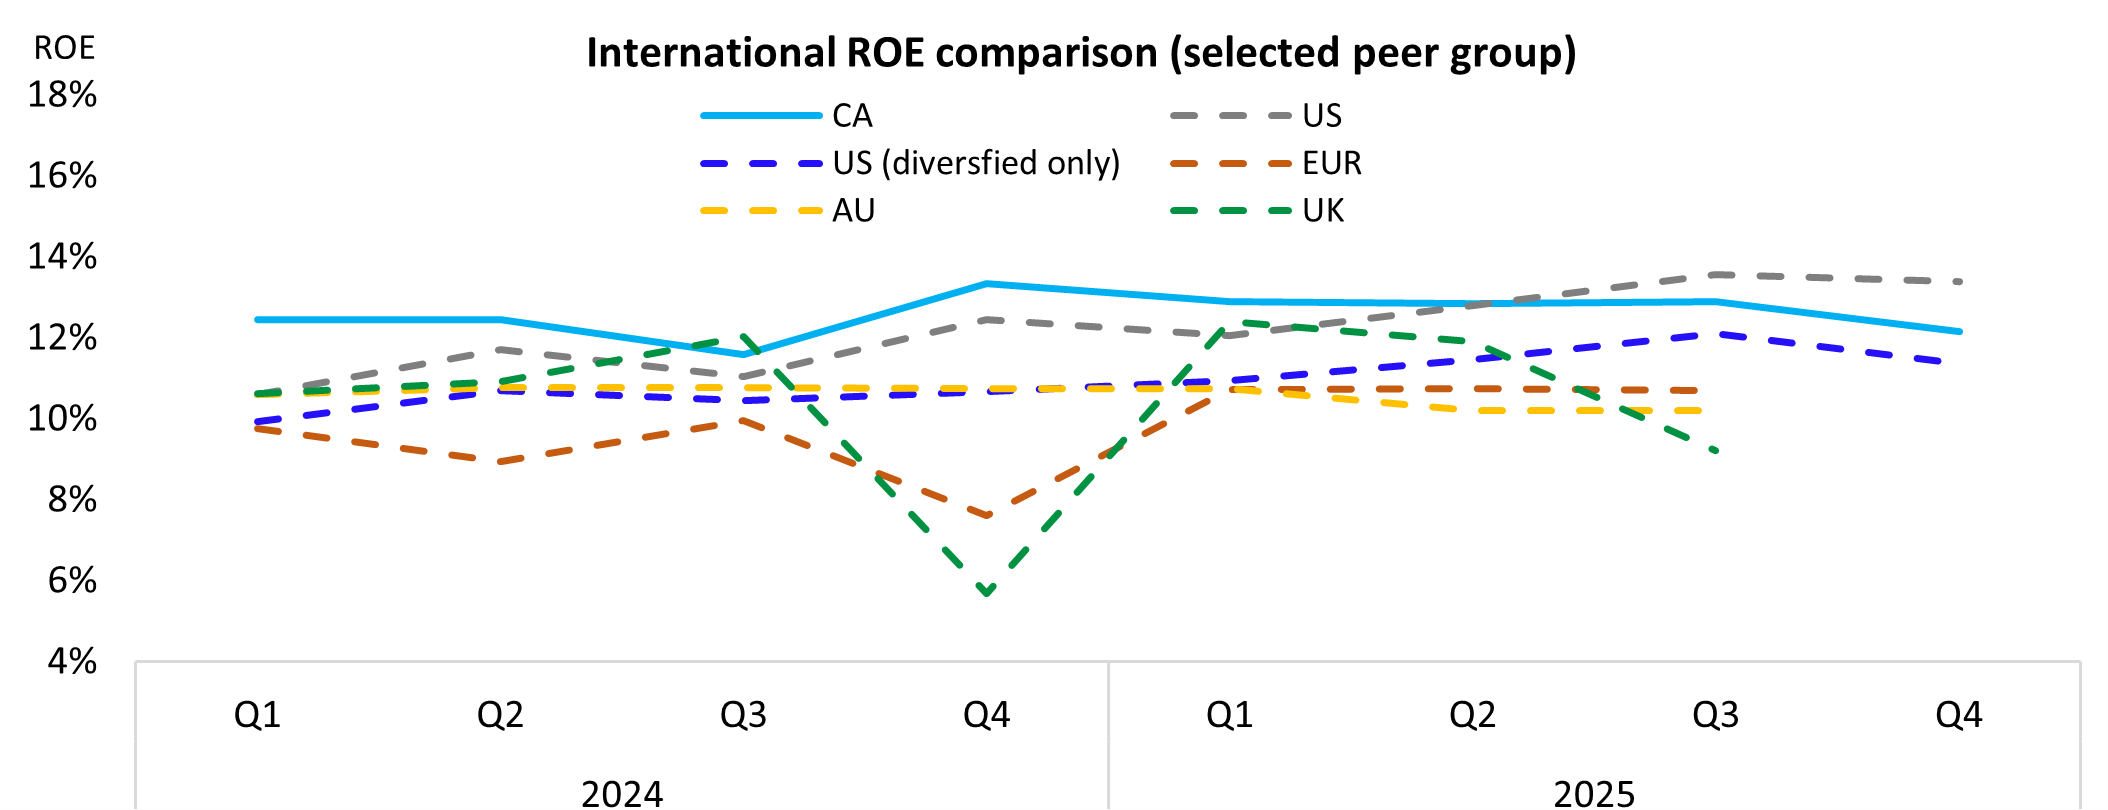
Figure 5 - Text version
| Year | Quarter | CA | US | US (diversified only) | AU | UK | EUR |
|---|---|---|---|---|---|---|---|
| 2024 | Q1 | 12.5% | 10.6% | 9.9% | 10.6% | 10.6% | 9.8% |
| 2024 | Q2 | 12.5% | 11.7% | 10.7% | 10.8% | 10.9% | 9.0% |
| 2024 | Q3 | 11.6% | 11.1% | 10.5% | 10.8% | 12.0% | 10.0% |
| 2024 | Q4 | 13.4% | 12.5% | 10.7% | 10.8% | 5.7% | 7.6% |
| 2025 | Q1 | 12.9% | 12.1% | 10.9% | 10.8% | 12.4% | 10.7% |
| 2025 | Q2 | 12.9% | 12.8% | 11.5% | 10.2% | 11.9% | 10.8% |
| 2025 | Q3 | 12.9% | 13.6% | 12.1% | 10.2% | 9.2% | 10.7% |
| 2025 | Q4 | 12.2% | 13.4% | 11.4% | NULL | NULL | NULL |
Notes:
- Reflects the unadjusted median return on common equity in each jurisdiction aligned to calendar periods on an annualized basis.
- “US (diversified only)” represents G-SIBs with similar diversified universal banking models as Canadian SIBs (JPM, BofA, Citi, Wells).
- European bank figures include six G-SIBs and excludes Credit Agricole and Groupe BPCE given data limitations.
- Australian bank figures estimated based on semi-annual disclosures by assuming constant quarterly ROE during the reporting period.
Sources: public filings (quarterly or half-year as available), OSFI calculations.
5. Conclusion
Canadian SIBs are in a robust financial position, maintaining capital levels well above binding supervisory expectations and broadly aligned with international peers. This resilience reflects regulatory enhancements such as Basel reforms and the Domestic Stability Buffer, and structural factors supporting credit quality and profitability. In addition, the extra usability within the Canadian capital stack supports flexibility in the event of unexpected economic shocks. Finally, standardized international benchmarking indicates that Canada’s capital regime is proportionate when viewed globally, supporting the overall competitiveness and long-term resilience of the Canadian financial system.
Appendix I: Selected Peer Group Overview and Capital Stack
The selected peer group as presented in this report includes the six Canadian SIBs, 19 international G-SIBs, and six SIB or Other Systemically Important Institutions (O-SII).
| Jurisdiction | Bank Name | G-SIB | D-SIB / O-SII |
|---|---|---|---|
| Canada (CA) | Bank of Montreal | No | Yes |
| Bank of Nova Scotia | No | Yes | |
| Canadian Imperial Bank of Commerce | No | Yes | |
| National Bank of Canada | No | Yes | |
| Royal Bank of Canada | Yes | No | |
| Toronto-Dominion Bank | Yes | No | |
| United States (US) | Bank of America | Yes | No |
| Bank of New York Mellon | Yes | No | |
| Citigroup | Yes | No | |
| Goldman Sachs | Yes | No | |
| JP Morgan Chase | Yes | No | |
| Morgan Stanley | Yes | No | |
| State Street | Yes | No | |
| Wells Fargo | Yes | No | |
| Australia (AU) | Commonwealth Bank of Australia | No | Yes |
| Westpac Banking Corporation | No | Yes | |
| National Australia Bank | No | Yes | |
| Australia and New Zealand Banking Group | No | Yes | |
| United Kingdom (UK) | HSBC | Yes | No |
| NatWest Group | No | Yes | |
| Barclays | Yes | No | |
| Lloyds | No | Yes | |
| Standard Chartered | Yes | No | |
| Europe (EU) | BNP Paribas | Yes | No |
| Crédit Agricole | Yes | No | |
| Banco Santander | Yes | No | |
| Deutsche Bank | Yes | No | |
| ING | Yes | No | |
| Groupe BPCE | Yes | No | |
| Société Générale | Yes | No | |
| UBS | Yes | No | |
| Total | 21 | 10 |
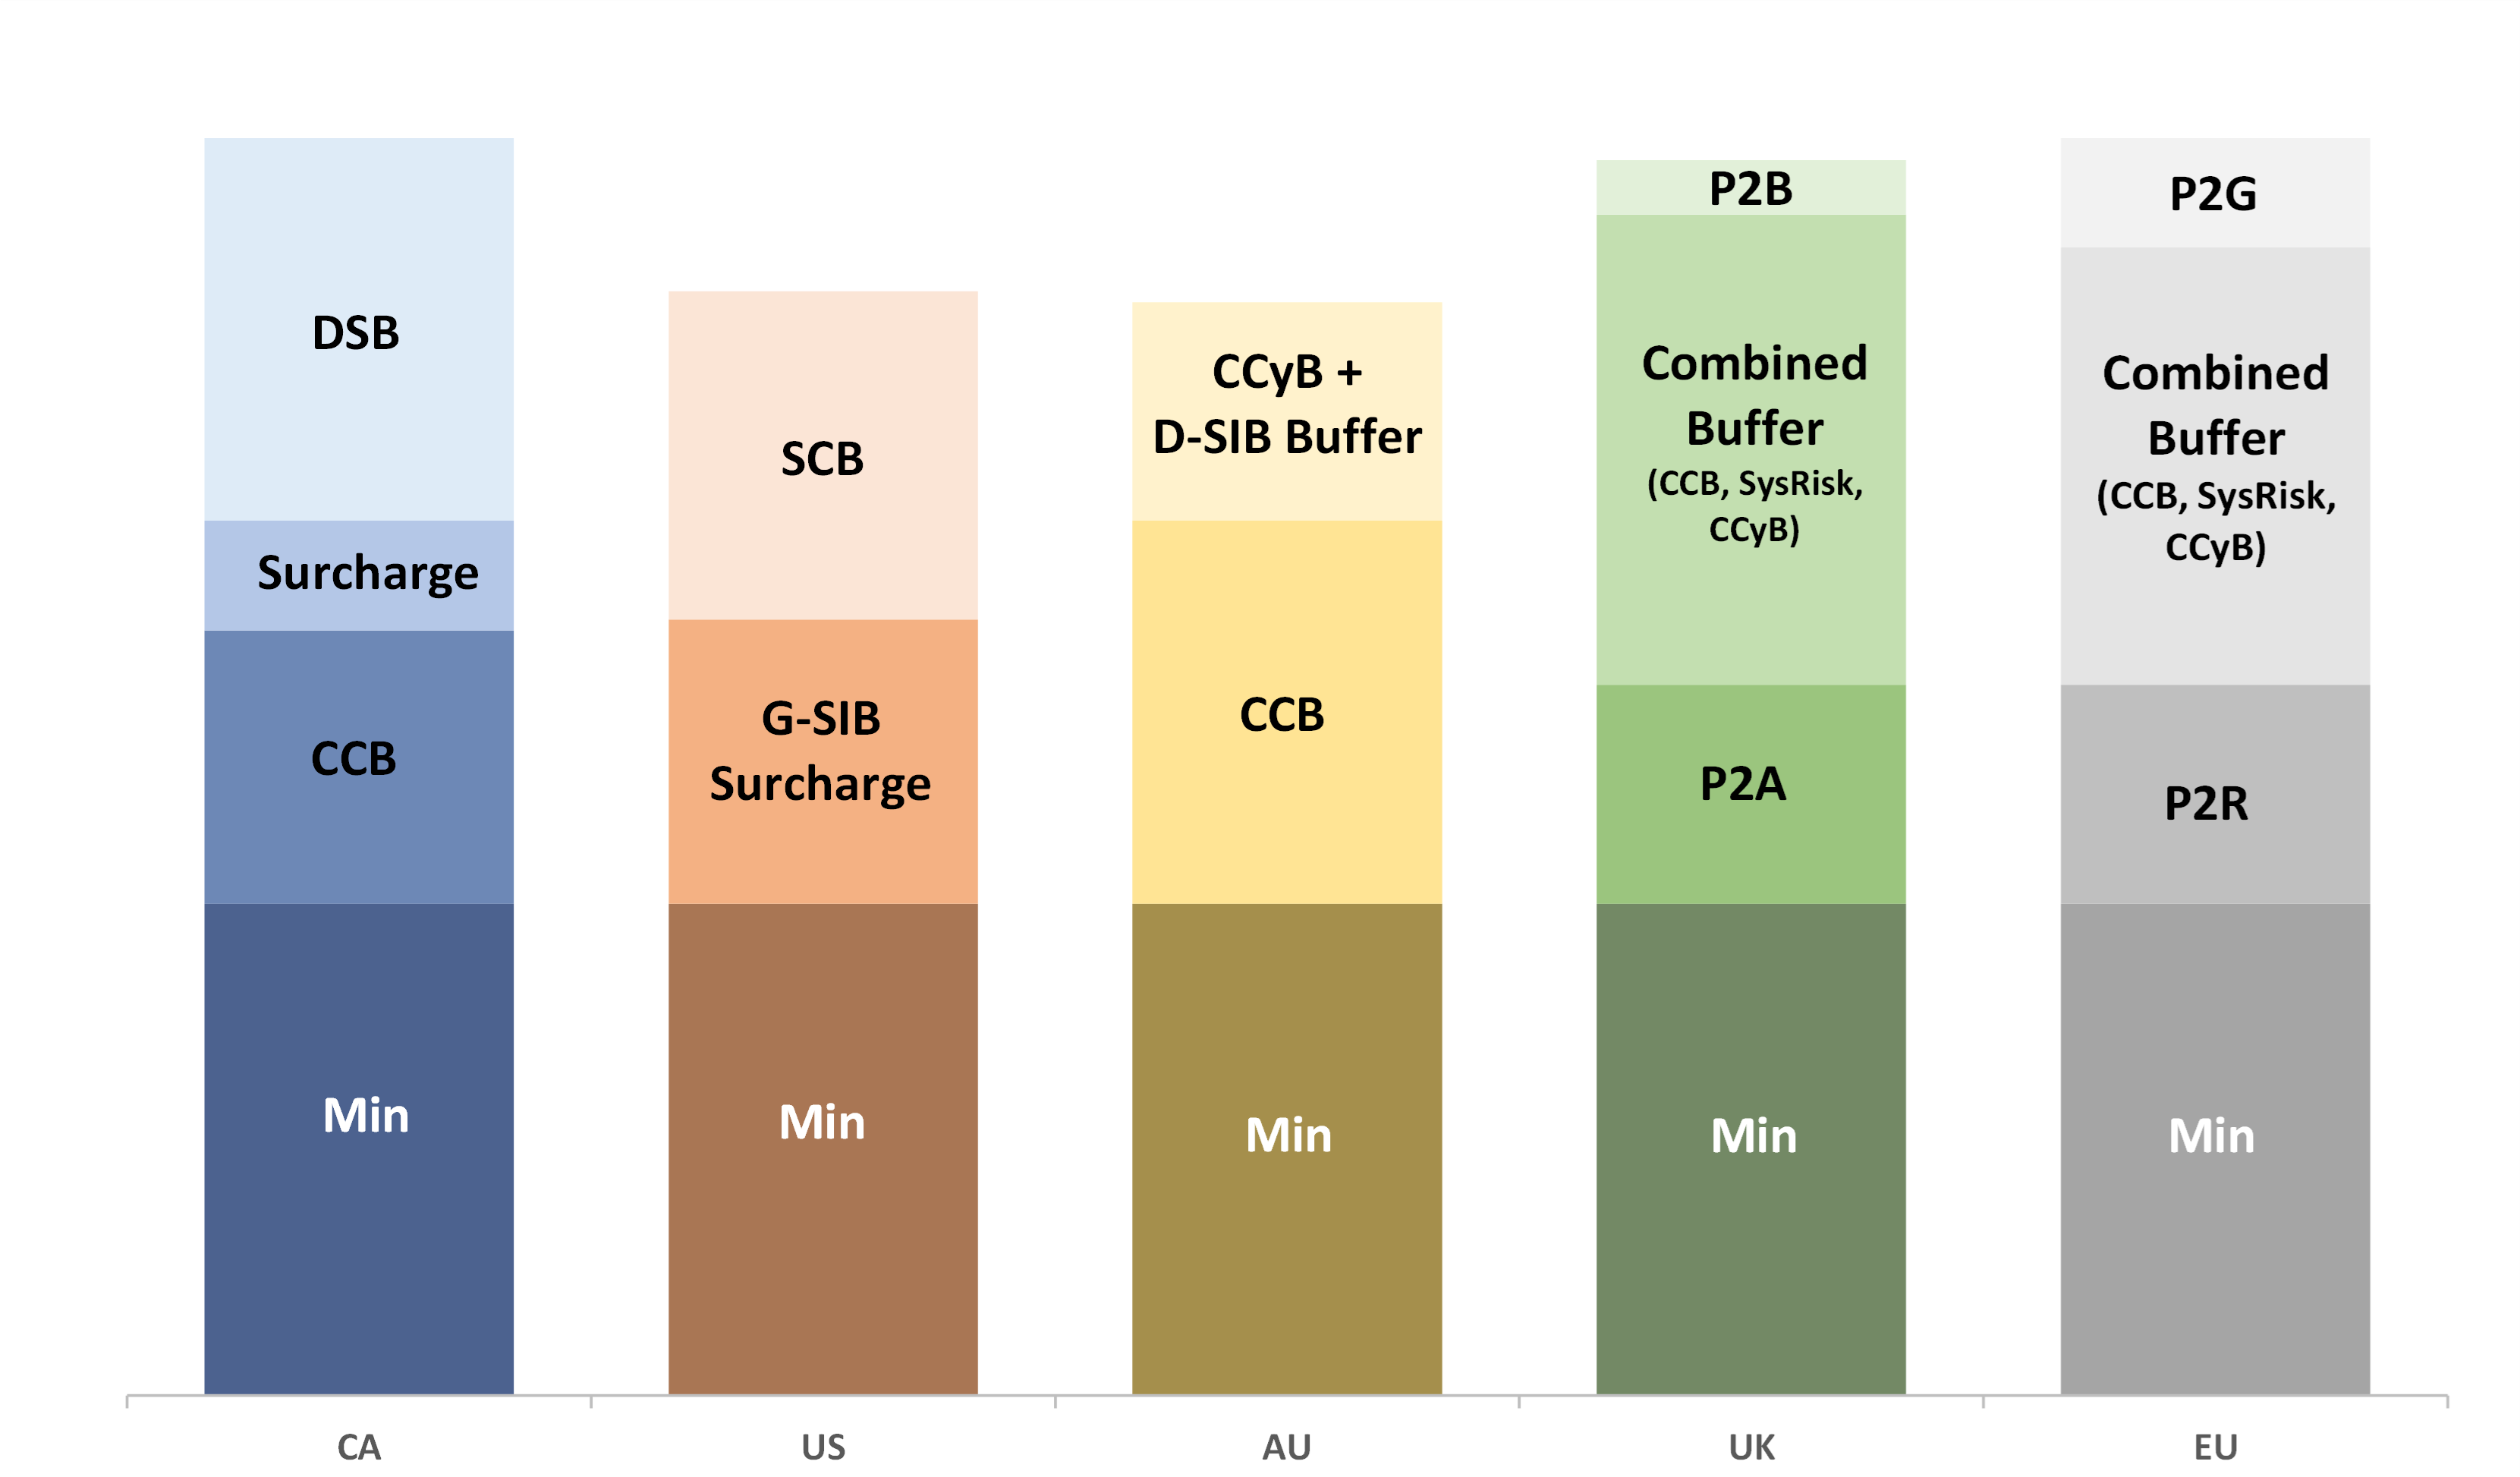
Figure I-A - Text version
This is a stylized representation of different capital stacks across jurisdictions with selected components broken out.
- Canada: Min, CCB, Surcharge, DSB
- US: Min, G-SIB Surcharge, SCB
- AU: Min, CCB, CCyB + D-SIB Buffer
- UK: Min, P2A, Combined Buffer (CCB, SysRisk, CCyB), P2B Buffer
- EU: Min, P2R, Combined Buffer (CCB, SysRisk, CCyB), P2G
Note: The sizes of the boxes are for illustrative purposes only and do not represent the actual size of supervisory expectations across each jurisdiction. In this figure, EU represents the capital stack in the EBA that applies to European Union G-SIBs noted in this report except for UBS regulated by the Swiss Financial Market Supervisory Authority (FINMA). Sources: OSFI, Federal Reserve Bank (PDF), European Central Bank, Prudential Regulation Authority (PDF) and Australian Prudential Regulation Authority.
Appendix II: Supplementary Analysis
SIB surplus capital above DSB has risen recently but generally within historical norms.
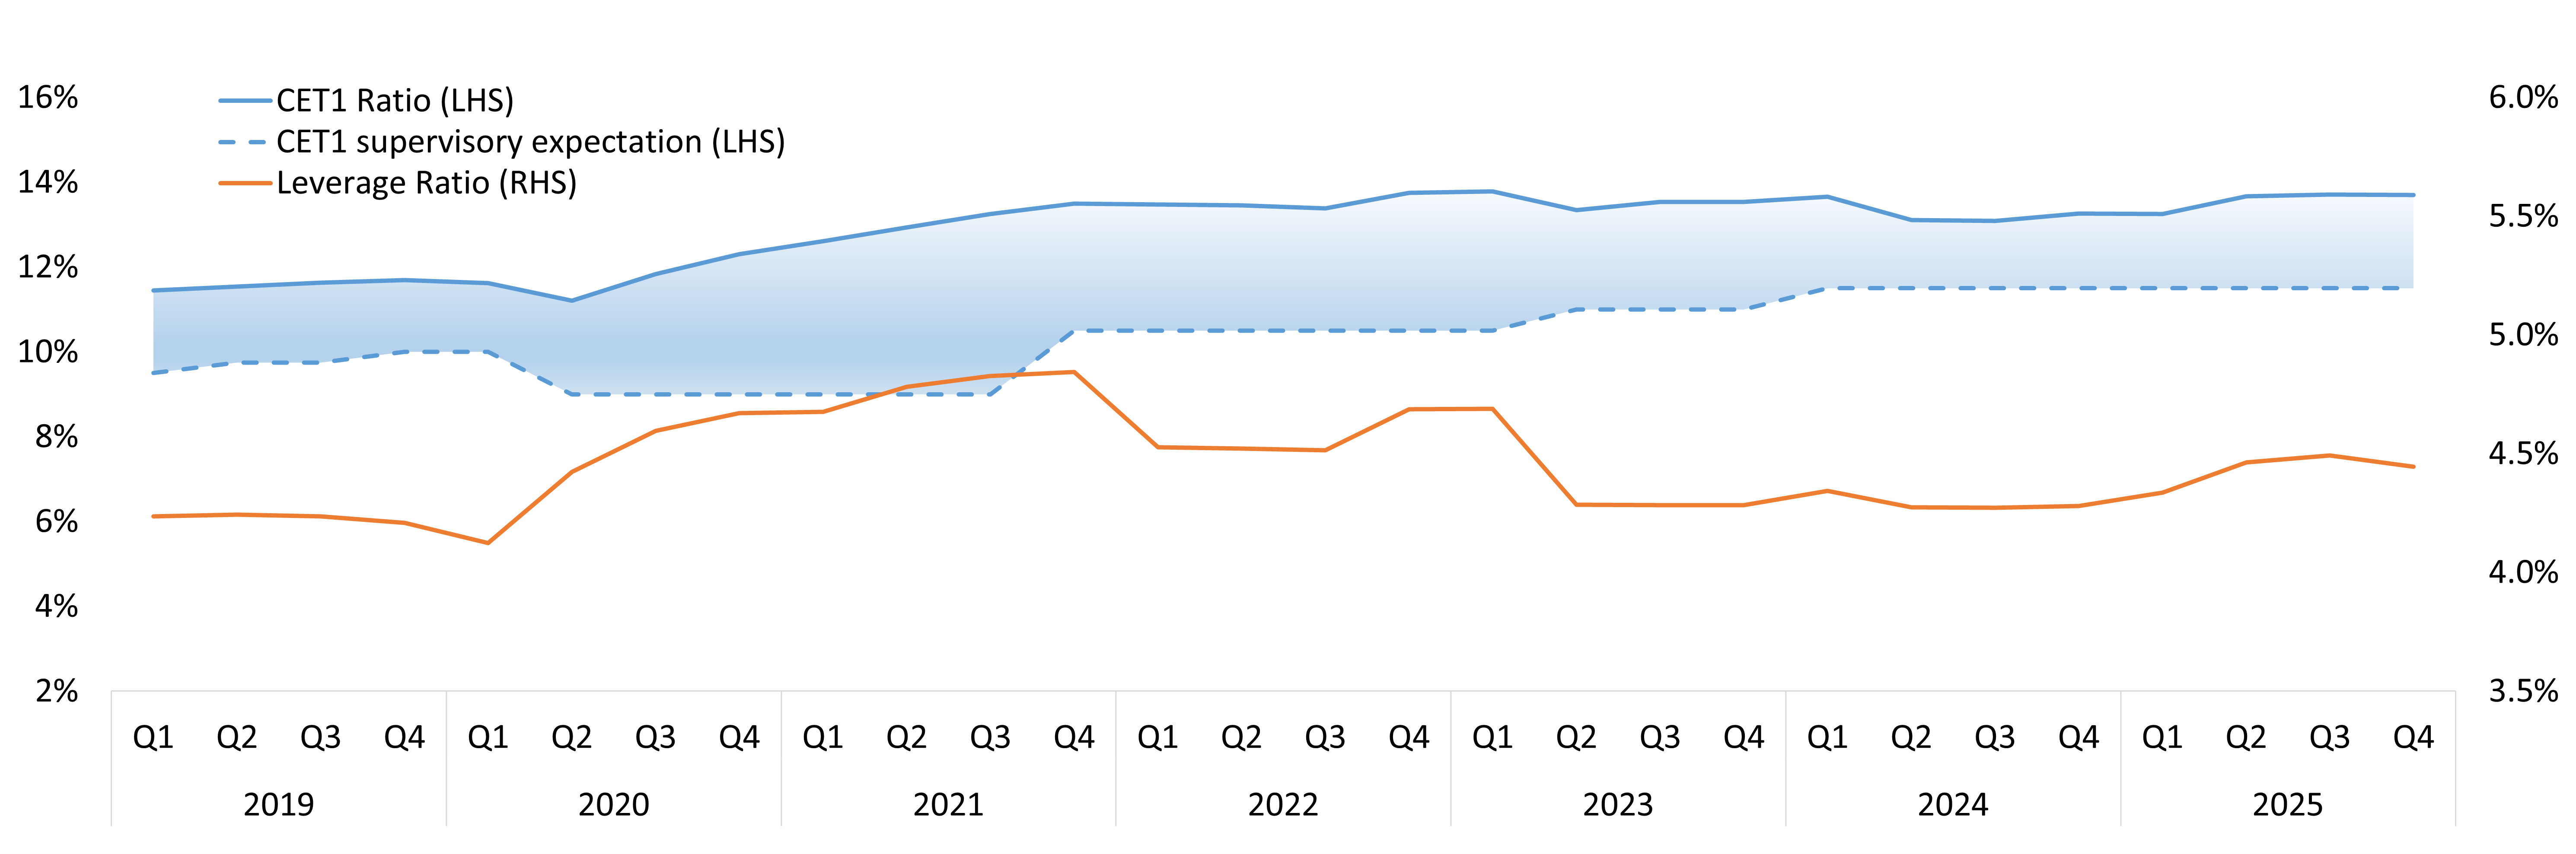
Figure II-A - Text version
| Year | Quarter | Average CET1 Ratio (LHS) | Average Leverage Ratio (RHS) | CET1 supervisory expectation (LHS) |
|---|---|---|---|---|
| 2019 | Q1 | 11.4% | 4.2% | 9.5% |
| 2019 | Q2 | 11.5% | 4.2% | 9.8% |
| 2019 | Q3 | 11.6% | 4.2% | 9.8% |
| 2019 | Q4 | 11.7% | 4.2% | 10.0% |
| 2020 | Q1 | 11.6% | 4.1% | 10.0% |
| 2020 | Q2 | 11.2% | 4.4% | 9.0% |
| 2020 | Q3 | 11.8% | 4.6% | 9.0% |
| 2020 | Q4 | 12.3% | 4.7% | 9.0% |
| 2021 | Q1 | 12.6% | 4.7% | 9.0% |
| 2021 | Q2 | 12.9% | 4.8% | 9.0% |
| 2021 | Q3 | 13.3% | 4.8% | 9.0% |
| 2021 | Q4 | 13.5% | 4.8% | 10.5% |
| 2022 | Q1 | 13.5% | 4.5% | 10.5% |
| 2022 | Q2 | 13.5% | 4.5% | 10.5% |
| 2022 | Q3 | 13.4% | 4.5% | 10.5% |
| 2022 | Q4 | 13.8% | 4.7% | 10.5% |
| 2023 | Q1 | 13.8% | 4.7% | 10.5% |
| 2023 | Q2 | 13.3% | 4.3% | 11.0% |
| 2023 | Q3 | 13.5% | 4.3% | 11.0% |
| 2023 | Q4 | 13.5% | 4.3% | 11.0% |
| 2024 | Q1 | 13.7% | 4.3% | 11.5% |
| 2024 | Q2 | 13.1% | 4.3% | 11.5% |
| 2024 | Q3 | 13.1% | 4.3% | 11.5% |
| 2024 | Q4 | 13.3% | 4.3% | 11.5% |
| 2025 | Q1 | 13.2% | 4.3% | 11.5% |
| 2025 | Q2 | 13.7% | 4.5% | 11.5% |
| 2025 | Q3 | 13.7% | 4.5% | 11.5% |
| 2025 | Q4 | 13.7% | 4.4% | 11.5% |
Note: Figures represent aggregate capital ratios for Canadian SIBs, shaded area represents CET1 surplus above DSB.
Sources: OSFI regulatory returns, staff calculations
SIB CET1 ratio increases have coincided with RWA density decreases in recent years.
- Note there are a number of underlying factors that have contributed to RWA density changes over time, including evolution in, among other things, business mix, holdings of cash and liquid assets, credit quality and performance, acquisitions and divestments, and internal ratings-based models. Since the pandemic we have observed a gradual decline in loan segment risk weights across most business segments, particularly in wholesale and international segments.
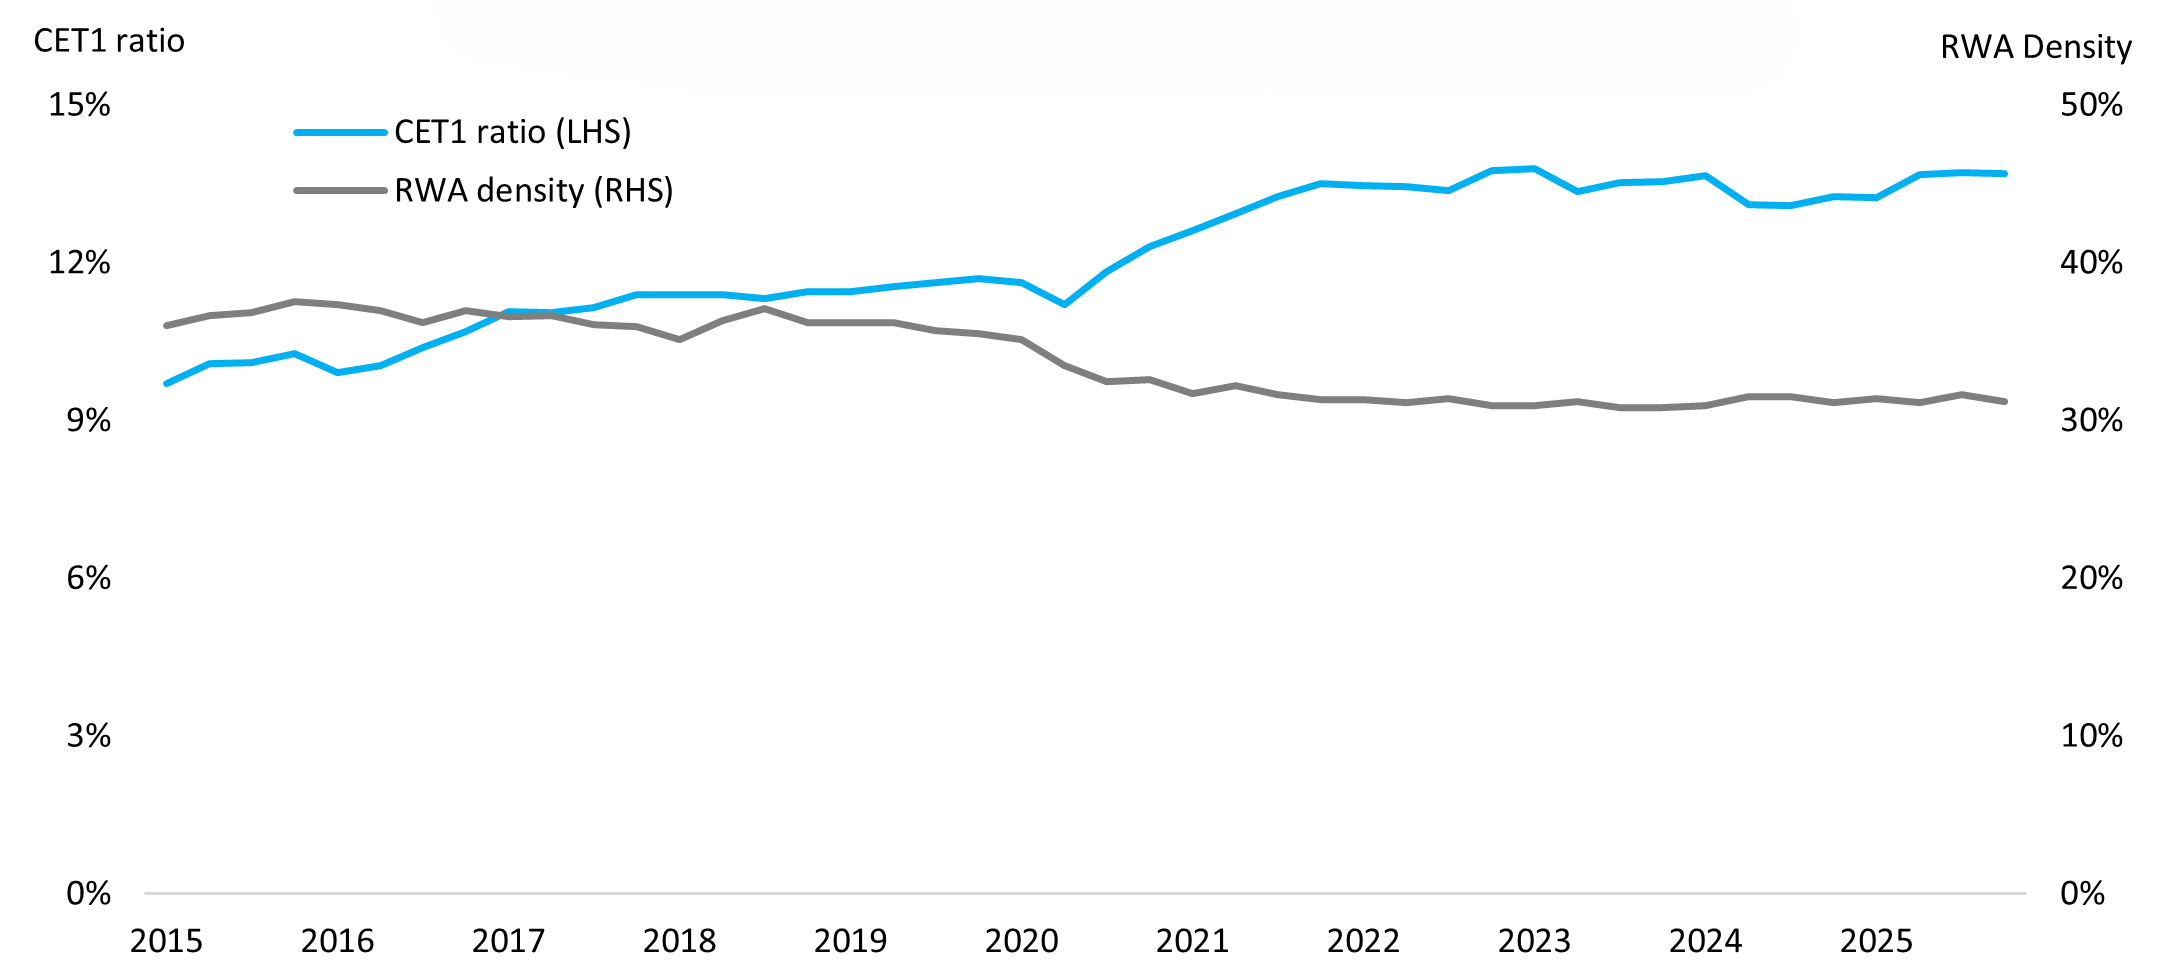
Figure II-B - Text version
| Year | Quarter | CET1 ratio (LHS) | RWA density (RHS) |
|---|---|---|---|
| 2015 | Q1 | 9.7% | 36.0% |
| 2015 | Q2 | 10.1% | 36.6% |
| 2015 | Q3 | 10.1% | 36.9% |
| 2015 | Q4 | 10.3% | 37.5% |
| 2016 | Q1 | 9.9% | 37.4% |
| 2016 | Q2 | 10.0% | 37.0% |
| 2016 | Q3 | 10.4% | 36.2% |
| 2016 | Q4 | 10.7% | 37.0% |
| 2017 | Q1 | 11.1% | 36.6% |
| 2017 | Q2 | 11.0% | 36.6% |
| 2017 | Q3 | 11.1% | 36.1% |
| 2017 | Q4 | 11.4% | 35.9% |
| 2018 | Q1 | 11.4% | 35.1% |
| 2018 | Q2 | 11.4% | 36.3% |
| 2018 | Q3 | 11.3% | 37.1% |
| 2018 | Q4 | 11.5% | 36.2% |
| 2019 | Q1 | 11.4% | 36.2% |
| 2019 | Q2 | 11.5% | 36.2% |
| 2019 | Q3 | 11.6% | 35.7% |
| 2019 | Q4 | 11.7% | 35.5% |
| 2020 | Q1 | 11.6% | 35.2% |
| 2020 | Q2 | 11.2% | 33.5% |
| 2020 | Q3 | 11.8% | 32.5% |
| 2020 | Q4 | 12.3% | 32.6% |
| 2021 | Q1 | 12.6% | 31.7% |
| 2021 | Q2 | 12.9% | 32.2% |
| 2021 | Q3 | 13.3% | 31.6% |
| 2021 | Q4 | 13.5% | 31.3% |
| 2022 | Q1 | 13.5% | 31.3% |
| 2022 | Q2 | 13.5% | 31.1% |
| 2022 | Q3 | 13.4% | 31.4% |
| 2022 | Q4 | 13.8% | 30.9% |
| 2023 | Q1 | 13.8% | 31.0% |
| 2023 | Q2 | 13.3% | 31.2% |
| 2023 | Q3 | 13.5% | 30.8% |
| 2023 | Q4 | 13.5% | 30.8% |
| 2024 | Q1 | 13.7% | 30.9% |
| 2024 | Q2 | 13.1% | 31.5% |
| 2024 | Q3 | 13.1% | 31.5% |
| 2024 | Q4 | 13.3% | 31.1% |
| 2025 | Q1 | 13.2% | 31.4% |
| 2025 | Q2 | 13.7% | 31.1% |
| 2025 | Q3 | 13.7% | 31.7% |
| 2025 | Q4 | 13.7% | 31.2% |
Notes: (1) RWA density defined as Total RWA divided by Total Assets, (2) figures represent aggregates for the Canadian SIBs.
Sources: OSFI regulatory returns, staff calculations
Expanded peer group analysis which includes countries beyond the 25 peer banks previously assessed indicates that Canadian SIB ratios are somewhat lower than peer group medians.
- Expanded peer group includes the six Canadian SIBs and 55 of the largest globally active banks across comparable advanced and major economy banking systems where relevant data was available.Footnote 8
- Canadian SIBs are broadly in line with the peer group median for IRB CET1 ratio but somewhat lower among countries surveyed for standardized CET1 and leverage ratio medians.
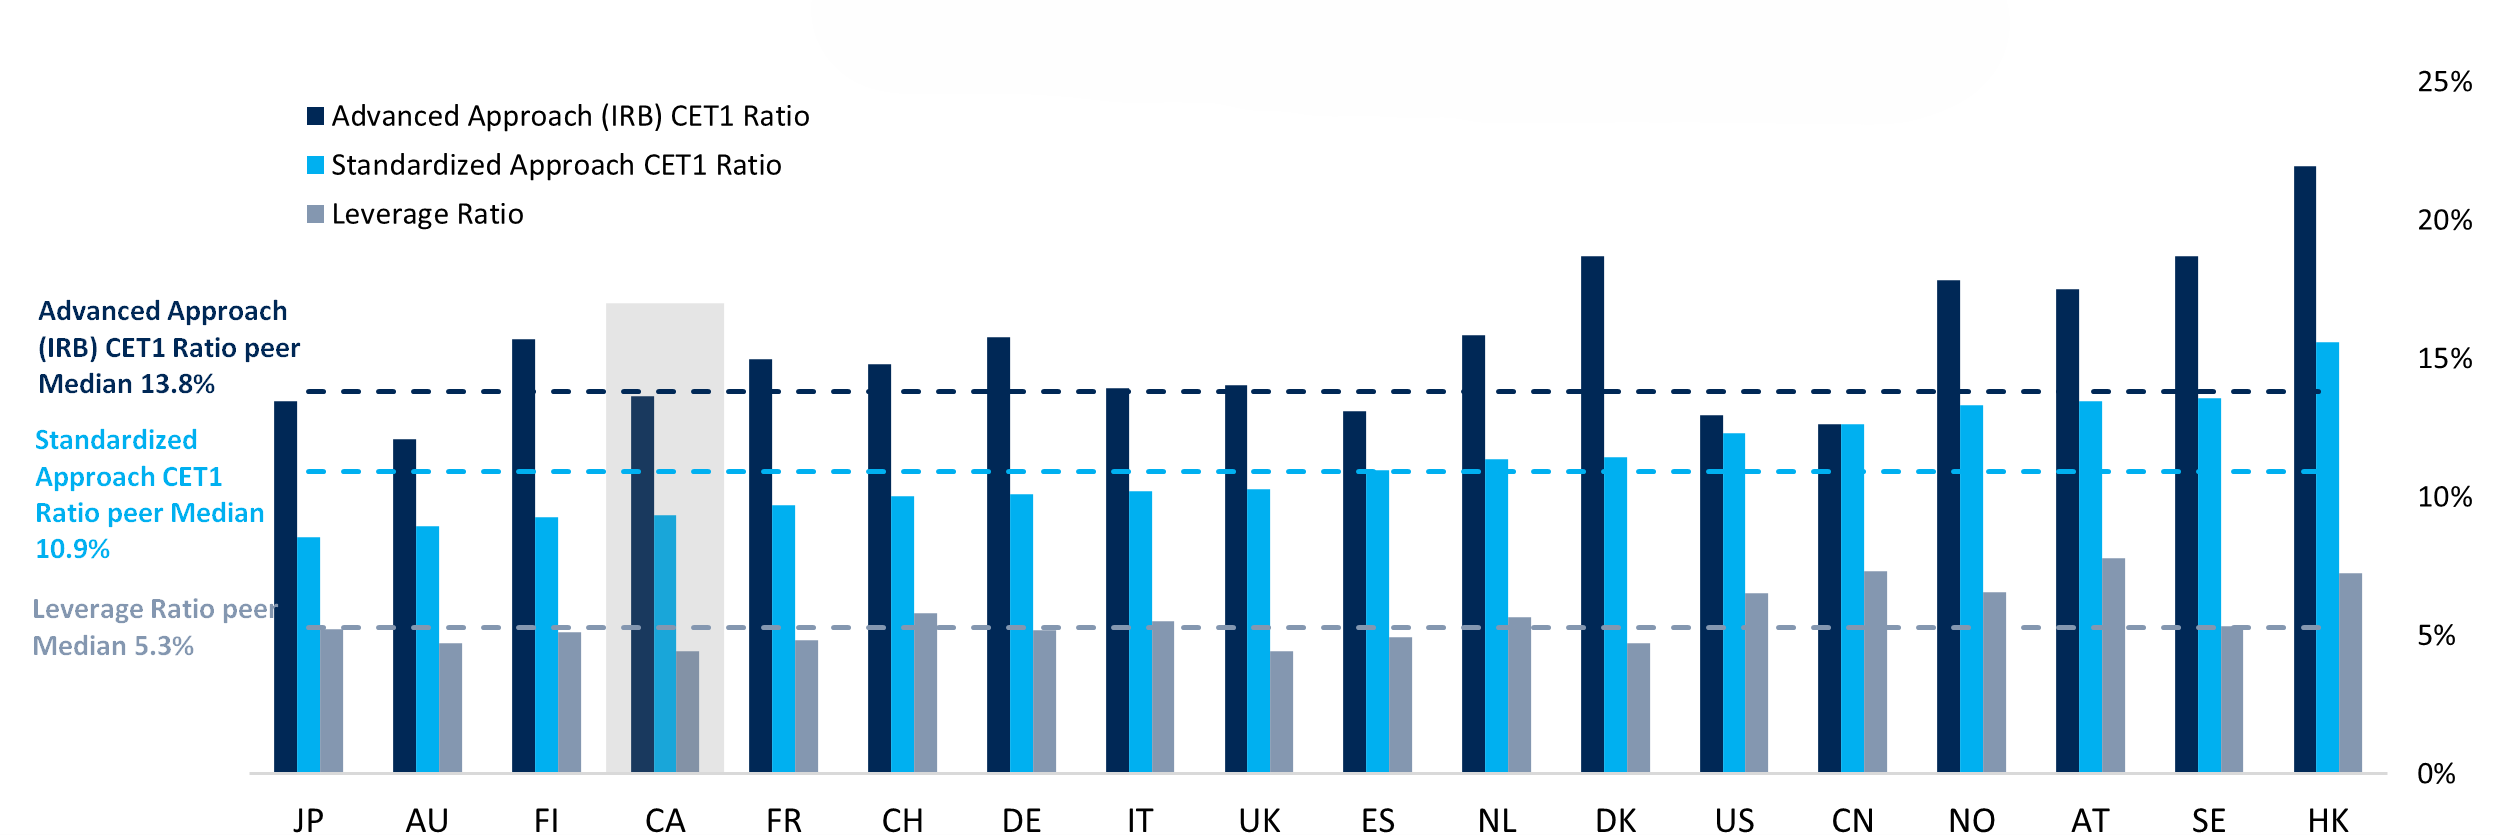
Figure II-C - Text version
International Capital Ratio comparison (2025)
- Advanced Approach (IRB) CET1 Ratio peer Median: 13.8%
- Standardized Approach CET1 Ratio peer Median: 10.9%
- Leverage Ratio peer Median: 5.3%
| Advanced Approach CET1 Ratio | Standardized Approach CET1 Ratio | Leverage Ratio | |
|---|---|---|---|
| JP | 13.5% | 8.6% | 5.2% |
| AU | 12.1% | 8.9% | 4.7% |
| FI | 15.7% | 9.3% | 5.1% |
| CA | 13.6% | 9.3% | 4.4% |
| FR | 15.0% | 9.7% | 4.8% |
| CH | 14.8% | 10.0% | 5.8% |
| DE | 15.8% | 10.1% | 5.2% |
| IT | 13.9% | 10.2% | 5.5% |
| UK | 14.0% | Approx. 10.3% | 4.4% |
| ES | 13.1% | 11.0% | 4.9% |
| NL | 15.8% | 11.4% | 5.7% |
| DK | 18.7% | 11.4% | 4.7% |
| US | 12.8% | 12.3% | 6.5% |
| CN | 12.6% | 12.6% | 7.3% |
| NO | 17.8% | 13.3% | 6.6% |
| AT | 17.5% | 13.5% | 7.8% |
| SE | 18.7% | 13.6% | 5.3% |
| HK | 22.0% | 15.6% | 7.2% |
Notes:
- Bars reflect the simple average of capital ratios of a sample of the largest banks in each jurisdiction ordered by Standardized Approach (JP = Japan, AU = Australia, FI = Finland, CA = Canada, CH = Switzerland, FR = France, DE = Germany, IT = Italy, UK = United Kingdom, ES = Spain, DK = Denmark, NL = Netherlands, US = United States, CN = China, NO = Norway, AT = Austria, SE = Sweden, HK = Hong Kong.
- Lines reflect a median of the capital ratios of the 61 banks within the peer group across jurisdictions, including six Canadian SIBs and 55 of the largest globally active peer banks where relevant data was available.
- Methodologies differ across jurisdictions and are not directly comparable across Advanced Approach, Standardized Approach and Leverage Ratio; figures shown on “as-reported” basis in each jurisdiction as of Q3-Q4 2025 based on public reporting.
- Standardized Approach is calculated as CET1 capital divided by Total RWA on a standardized basis reflecting each jurisdiction's unique implementation of the standardized approach. For UK banks, standardized RWA was approximated by grossing-up the reported advanced approach RWA.
- Leverage Ratio reflects Basel III standard or comparable approach as reported.
Sources: Bank filings, public pillar 3 disclosures, OSFI staff calculations.