Insights from the 2025 Climate Risk Returns
Key takeaways
1. First Submission Cycle–A Key Milestone
This year marked the first submission cycle for the Office of the Superintendent’s (OSFI’s) Climate Risk Return (CRR), an important step in measuring and quantifying climate-related financial risks. Canada’s six systemically important banks (D-SIBs)Footnote 1 and the four internationally active insurance groups (IAIGs)Footnote 2 were the first federally regulated institutions (FRFIs) to file.
The initial submissions provided valuable insights into how FRFIs are approaching climate-related data collection, reporting, and risk management. This information will help OSFI refine the CRR—adjusting data points, clarifying definitions, and amending requirements where appropriate. It will also support the broader industry as smaller and medium-sized FRFIs prepare to file their first returns beginning in 2026.
OSFI will take an iterative approach to ensure industry builds capacity to measure climate-related risks, improve data quality, and align with international standardsFootnote 3. By starting with the most sophisticated FRFIs, OSFI and the industry can work through data challenges early. Additionally, this will set the stage for consistent, comparable, and decision-useful climate risk reporting across the sector.
2. Data Quality and Reporting Discipline
The first submissions revealed recurring challenges with data quality and reporting discipline. Issues included incomplete fields, outdated or inaccurate postal code data, non-compliance with prescribed formats, and modifications to standardized templates. While some of these challenges are expected at this early stage, they limit comparability across FRFIs and reduce the useability of the data for supervisory analysis. OSFI has been clear, the goal is for FRFIs to improve their methodologies and strengthen internal controls over time. To support this goal, OSFI is using the early years of reporting to identify data gaps and quality issues. Ensuring accuracy, completeness, and adherence to standardized templates will be critical for the next reporting cycle.
3. Physical Risk Exposure
Physical risk data from banks comprise the most comprehensive geographically granular dataset not captured in other regulatory returns. We are using the return data and conducting geospatial hazard analysis (for example, flood, wildfire, and convective storm) to better understand how physical risks are distributed across portfolios.
Data from insurers will further strengthen insight into physical risk exposures in future reporting cycles. This includes peril-specific claims not captured in other regulatory returns, and forward-looking metrics like Probable Maximum Loss (PML).
4. Transition Risk Exposure
The submissions from the ten FRFIs revealed that, in aggregate, both banks and insurers have significant exposure to Transition Vulnerable Sectors (TVS)Footnote 4. Reported financed emissions totaled approximately 360 mega tonnes of CO₂ equivalent (MtCO₂e), comparable to more than half of Canada’s annual national emissionsFootnote 5. For the D-SIBs and IAIGs respectively, approximately 50% and 67% of financed emissions were tied to TVS, including those grouped under fossil fuels, transportation, and agriculture.
For banks, sovereign bonds and corporate loans drove most of the exposure, with agriculture, transportation, and fossil fuels accounting for approximately half. For insurers, corporate bonds dominated financed emissions, with fossil fuels representing the majority of TVS exposures. These findings underscore the financial system’s vulnerability to such high-emitting sectors and the potential downgrade risk embedded in long-duration debt holdings.
5. Amendments to the Returns
We will amend the Returns in Fall 2025 to reduce reporting burden and maintain supervisory focus on material climate-related financial risks. An overview of the amendments is included at the end of this report.
Introduction
Building resilience against climate-related risks requires federally regulated financial institutions (FRFIs) to address vulnerabilities in their business models, operations, and balance sheets. This calls for forward-looking, holistic approaches that rest on reliable data and sound analysis. In March 2024, OSFI, in partnership with the Bank of Canada (BoC) and the Canada Deposit Insurance Corporation (CDIC), introduced the Climate Risk Return (CRR). The CRR was developed to collect standardized climate-related emissions and exposure data directly from deposit-taking institutions (DTIs) and insurers.
The purpose of these returns is twofold. Firstly, to equip the tri-agencies with high-quality, comparable data to inform evidence-based policy development, regulation, and prudential supervision. This will enable us to compare risks across FRFIs and identify common vulnerabilities that could affect system-wide resilience. Secondly, to improve FRFIs’ ability to identify and measure their own exposures by embedding standardized approaches across the sector. Standardized returns enforce a shared structure, ensuring that all FRFIs use the same definitions and reporting categories. This reduces ambiguity, improves data reliability, and enables FRFIs to benchmark their own exposures against sectoral peers.
This will also strengthen market discipline and governance by encouraging FRFIs to develop internal systems, controls, and risk management practices that are consistent with international standards.
The returns captureFootnote 6:
- exposures to physical risks, mapped by geophysical location
- potential exposures to transition risks
- absolute greenhouse gas (GHG) emissions across Scopes 1, 2, and 3
While the data remains confidential, the process of design, consultation, and implementation offered OSFI valuable lessons—highlighting what worked well, where challenges emerged, and how future data initiatives can better support supervisory practice.
This report reflects on these intended outcomes and evaluates how the CRR has advanced them. It also distills the insights OSFI has gained from the first cycle of reporting, and outlines improvements expected in the years ahead.
Insights
Physical Risk
The D-SIB's 2025 CRR submissions captured approximately $5.8 trillion in outstanding balances across 23 asset classes. Physical risk exposures were disproportionately concentrated in five key classes:
- residential real estate (RESL)
- commercial real estate (CRE)
- corporate loans
- sovereign bonds
- public sector entities—representing about 75% of the total
The physical exposure data collected through the CRR is a critical input into OSFI’s broader supervisory assessment. By requiring FRFIs to map exposures by asset class and geophysical location, the CRR enables OSFI to identify concentrations of risk and assess system-wide vulnerabilities. Early submissions show that exposures are heavily concentrated in a few dominant asset classes:
- residential and commercial real estate
- corporate loans
- sovereign bonds
- public sector entities
This makes these asset classes a natural focal point for supervisory analysis.
OSFI is leveraging this data to conduct geospatial overlays with recognized hazard datasets (for example, flood plains, wildfire hazard indices, and convective storm models). These overlays provide more granular insight into how risks are distributed across portfolios and regions. This allows us to evaluate not only the size of exposures, but also their sensitivity to acute events (such as floods and wildfires) and chronic trends (such as heat stress and sea level rise).
Transition Risk
Financed emissions are the absolute greenhouse gas (GHG) emissions linked to the loans and investments of FRFIs. They generally represent the portion of counterparties’ Scope 1, 2, and relevant Scope 3 emissions attributable to financing or underwriting by banks and insurersFootnote 7.
Under the CRR, these emissions must be calculated using the GHG Protocol standards and the Partnership for Carbon Accounting FinancialsFootnote 8 (PCAF) methodology. Where counterparty data is not current, FRFIs may rely on the most recently available emissions information alongside their own current-year financial data, recognizing the common time lag in reported GHG information.
Aggregate financed GHG emissions reported in the first submission are approximately 301 million (MtCO₂e) for banks and 58.2 MtCO₂e for insurers. Combined, the financial industry reported around 360 MtCO₂e. While this figure is not directly comparable to Canada’s national inventory—694 MtCO₂e, according to a September 2025 estimate by the Canadian Climate Institute—it shows the magnitude of the financial sector’s indirect exposure to carbon-intensive activities.
For the D-SIBs, sovereign bonds and corporate loans accounted for around 80% of these emissions. Excluding sovereign assets (37%, 111 MtCO₂e) without sectoral details, TVS represent about 50% of financed emissions led by Agriculture (mostly driven by livestock), Transportation, and Fossil Fuels.
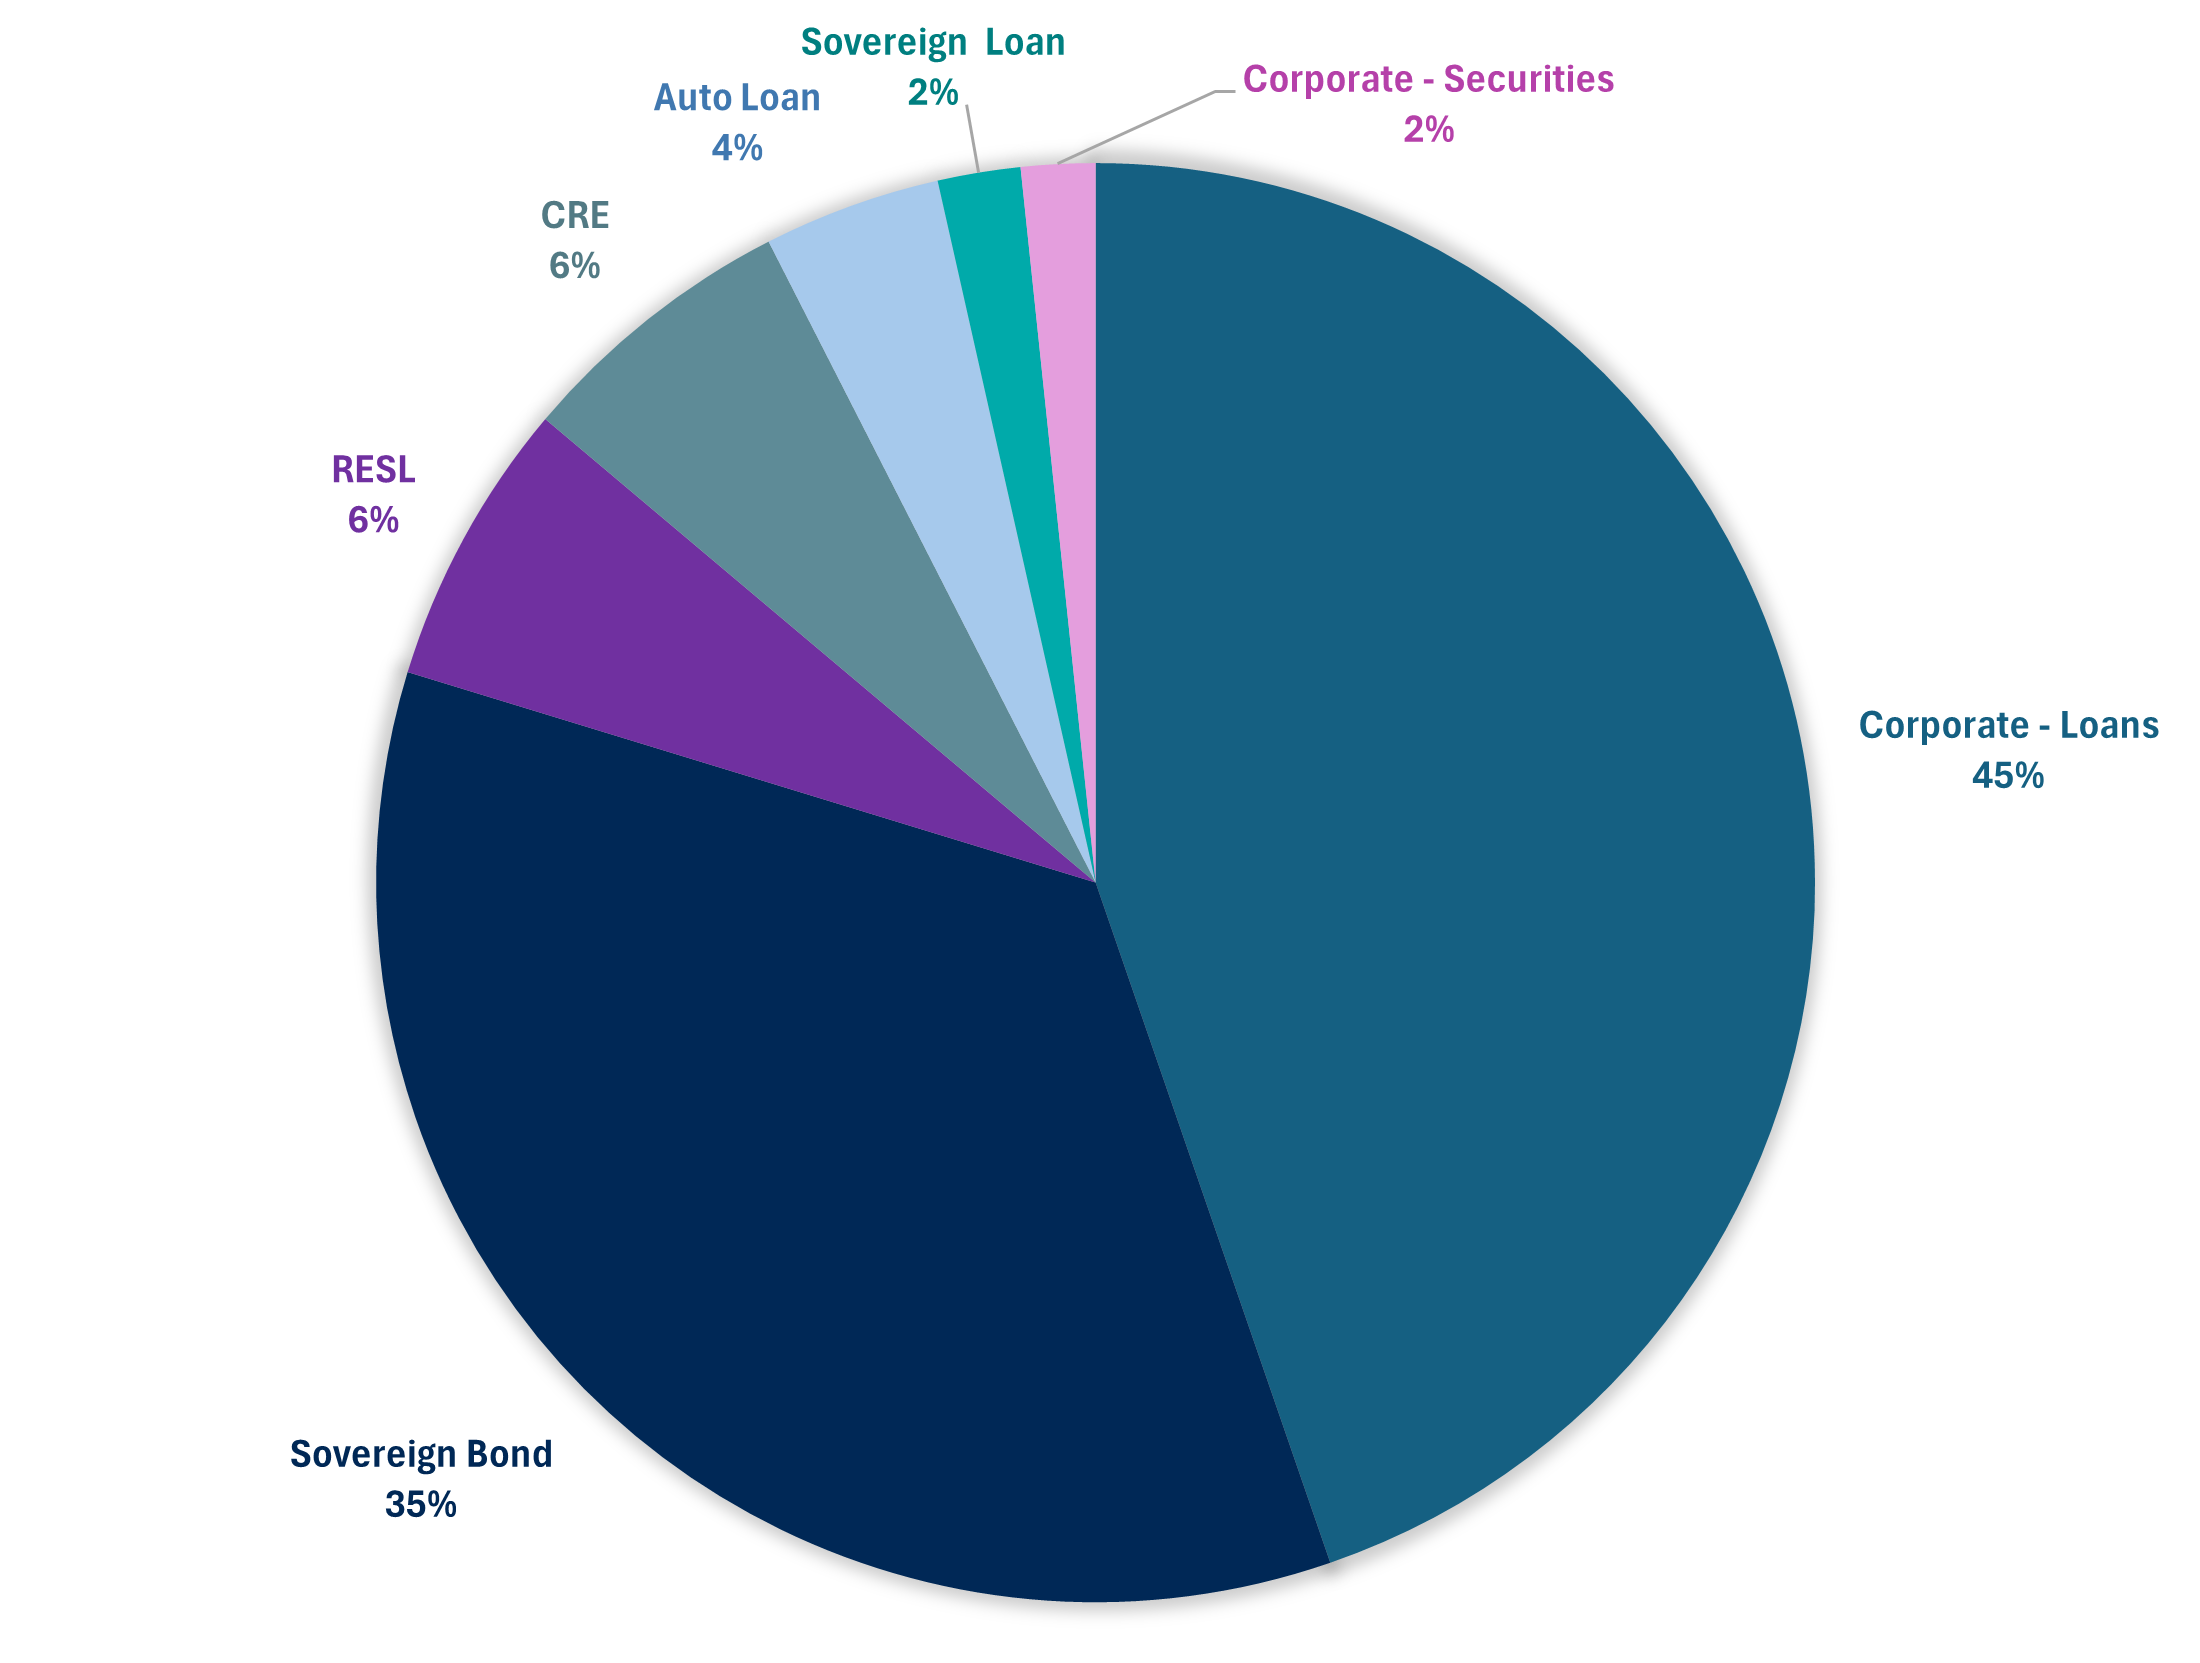
Figure 1 - Text version
- Corporate - Loans: 45%
- Sovereign Bond: 35%
- RESL: 6%
- CRE: 6%
- Auto Loan: 4%
- Sovereign Loan: 2%
- Corporate - Securities: 2%
Source: OSFI calculations based on CRR data
For IAIGs, about 77% of their financed emissions came from corporate bonds. When sovereign assets are excluded, TVS contributes ~39 MtCO₂e. Within this, fossil fuels alone represent approximately 75% of that total, highlighting the IAIGs’ exposure to carbon-intensive sectors.
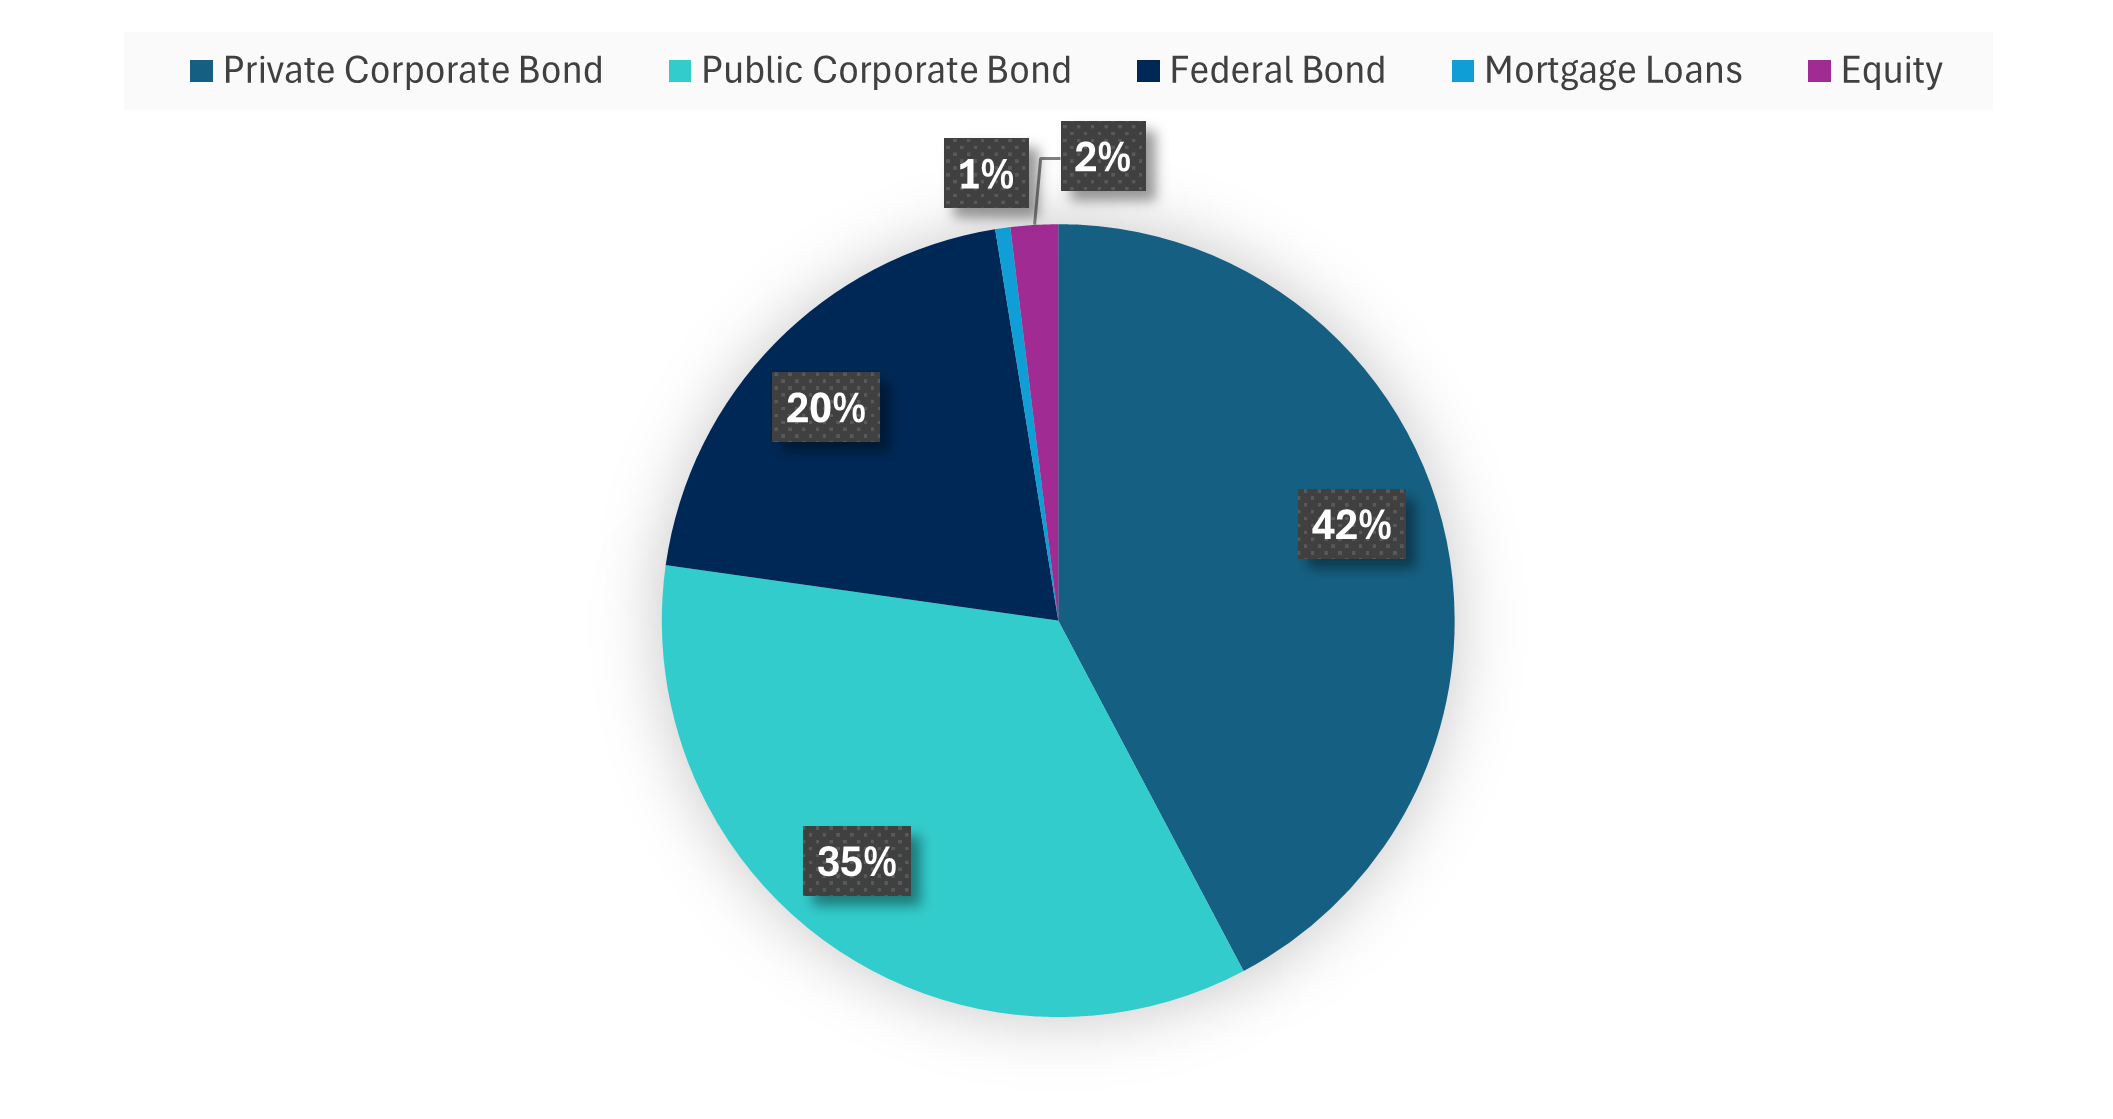
Figure 2 - Text version
- Private Corporate Bond: 42%
- Public Corporate Bond: 35%
- Federal Bond: 20%
- Mortgage Loans: 1%
- Equity: 2%
Source: OSFI calculations based on CRR data
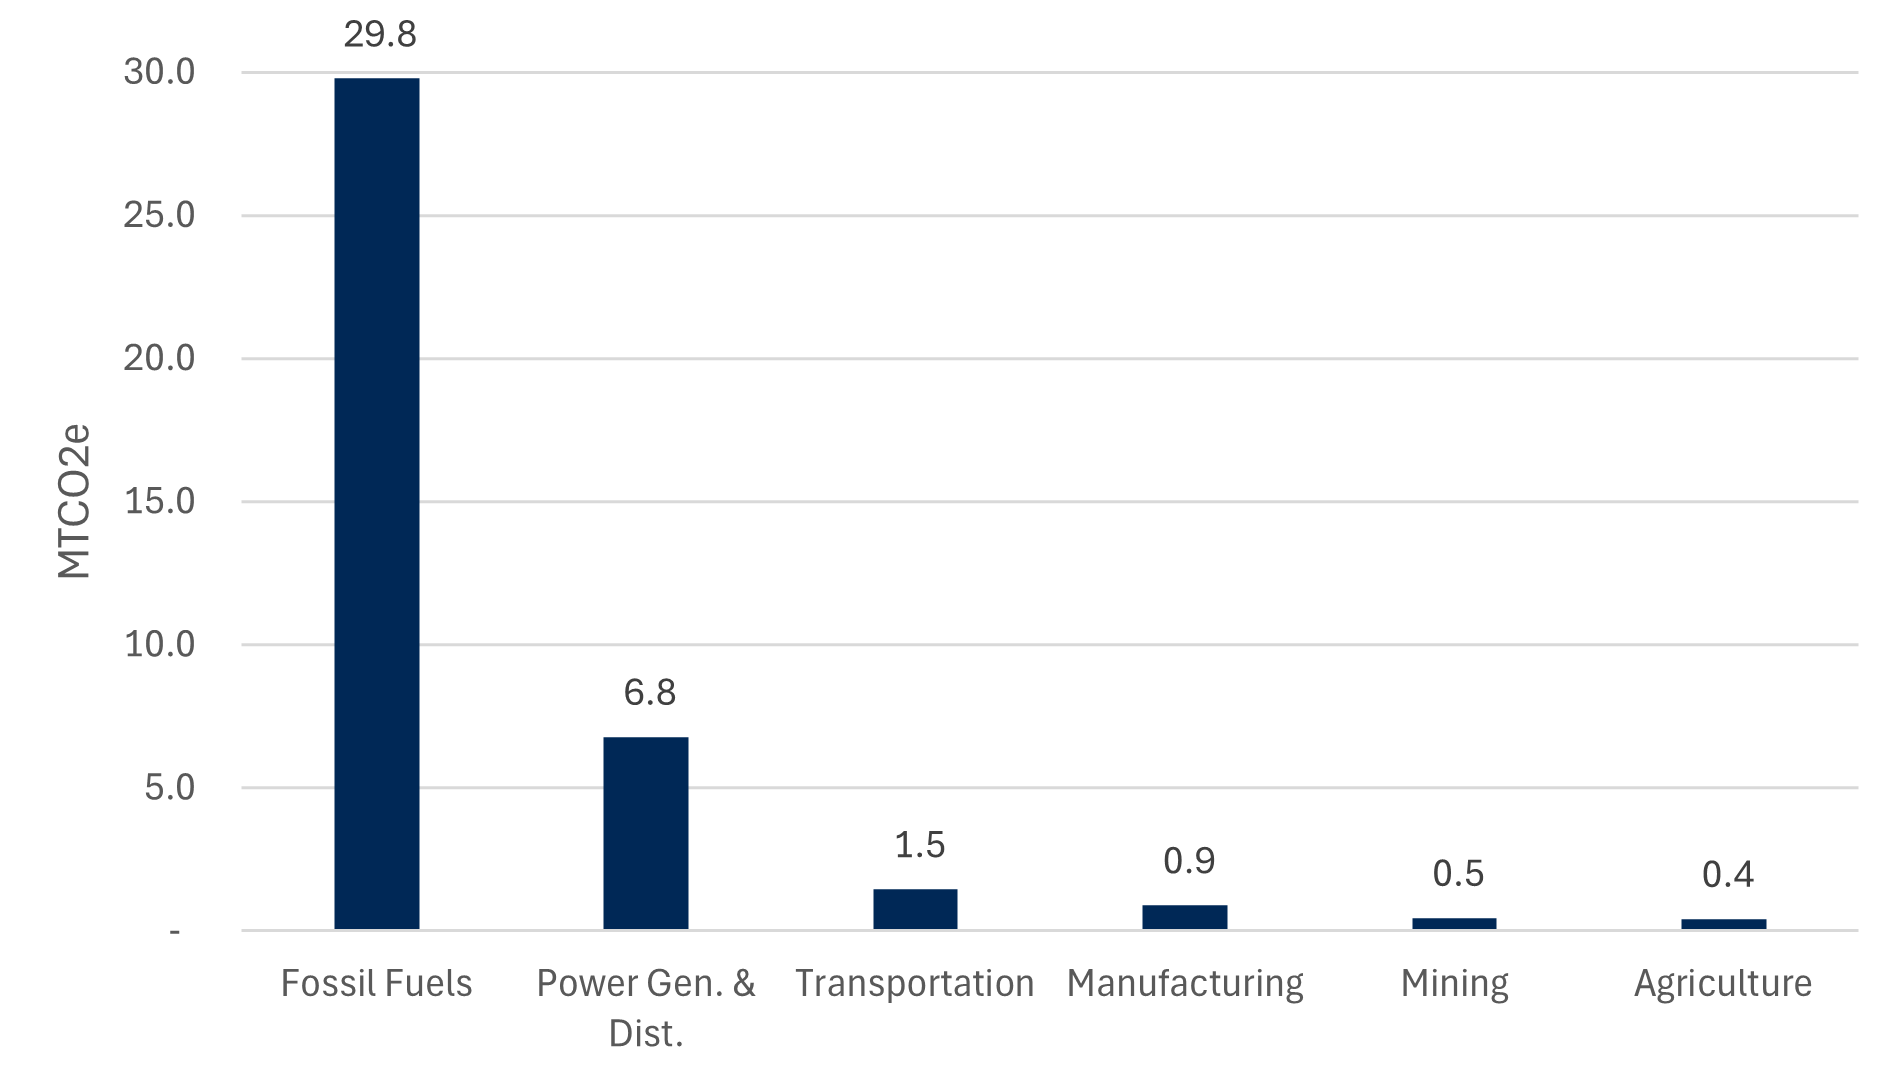
Figure 3 - Text version
| MtCO₂e | |
|---|---|
| Fossil Fuels | 29.8 |
| Power Gen. & Dist. | 6.8 |
| Transportation | 1.5 |
| Manufacturing | 0.9 |
| Mining | 0.5 |
| Agriculture | 0.4 |
Figure 3 footnotes
- Figure 3 footnote *
-
Excludes emissions from sovereign assets.
Source: OSFI calculations based on CRR data
IAIGs’ investment portfolios were largely concentrated in sovereign and investment-grade corporate bonds. However, lower-rated and unrated corporate debt was present in some cases, particularly within long-duration holdings. These exposures embed transition risk and downgrade potential in the long term (for example, over a decade).
Over time, as data quality improves and methodologies mature, financed emissions reporting will provide a robust foundation for stress testing, scenario analysis, and supervisory dialogue. It will also help ensure that FRFIs’ exposures are better understood, better managed, and more resilient in the face of transition risks.
Reporting Challenges
With the first submissions we observed several challenges in completing the CRR. FRFIs reported difficulties in mapping their internal sector codes—North American Industry Classification System (NAICS), Global Industry Classification Standard (GICS), and Standard Industrial Classification (SIC)—to OSFI’s designated sector classifications. This was most evident in oil and gas, where missing production and revenue data limited the ability to provide detailed breakdowns. FRFIs also reported delays in obtaining current-year emissions data from counterparties. In some cases, FRFIs were only able to access Scope 3 data, whereas the CRR requires disaggregated reporting across Scopes 1, 2, and 3.
Compliance with the return template was another area of concern. Several FRFIs modified the templates, resulting in submissions that did not conform to the prescribed format. Others failed to report International Financial Reporting Standards (IFRS) 9 probability of default (PD), and loss given default (LGD) data for standardized portfolios. Finally, frequent errors were observed including outdated or incorrect Forward Sortation Area (FSA) data.
These challenges underscore the importance of building robust systems and governance to measure and report climate-related data. Without strong internal capabilities, controls, and reliable inputs, FRFIs cannot generate decision-useful information or meet supervisory expectations. Data quality in regulatory submissions is foundational for comparability, credibility, and ultimately for integrating climate-related risks into prudential oversight.
Data Quality – Financed Emissions
To facilitate consistent reporting while acknowledging current data limitations, OSFI has allowed the use of PCAF data quality methodology in CRR submissions. This standardized five-point scale enables FRFIs to quantify financed emissions even when high-quality, counterparty-reported data is not yet available. A PCAF score of 1 indicates the highest quality, whereas 5 is the lowest. By disclosing both the emissions values and the quality of the underlying data, FRFIs provide transparency that supports comparability across the industry.
This approach encourages a pathway of continuous improvement, with FRFIs expected to progress over time from proxy-based estimates toward more reliable, counterparty-specific data. In doing so, we balance the need for early action in climate risk measurement with the practical realities of data availability. It also supports the alignment of Canadian supervisory practice with international standards.
Across both banks and insurers, FRFIs continue to rely heavily on proxy data and estimations, particularly in high-emitting sectors. This undermines the reliability and comparability of reported metrics.
For D-SIBs, sovereign bonds, sovereign loans, and equities reached a moderate score of 3, showing partial reliance on reported emissions. Auto loans and corporate securities scored lower at 4, but still lack robust, reported data. The lowest data quality was in the residential real estate secured lending (RESL), commercial real estate (CRE), corporate loans, and subordinated debt and equity all with an average PCAFFootnote 10 data quality scores of 5, indicating the use of proxies.
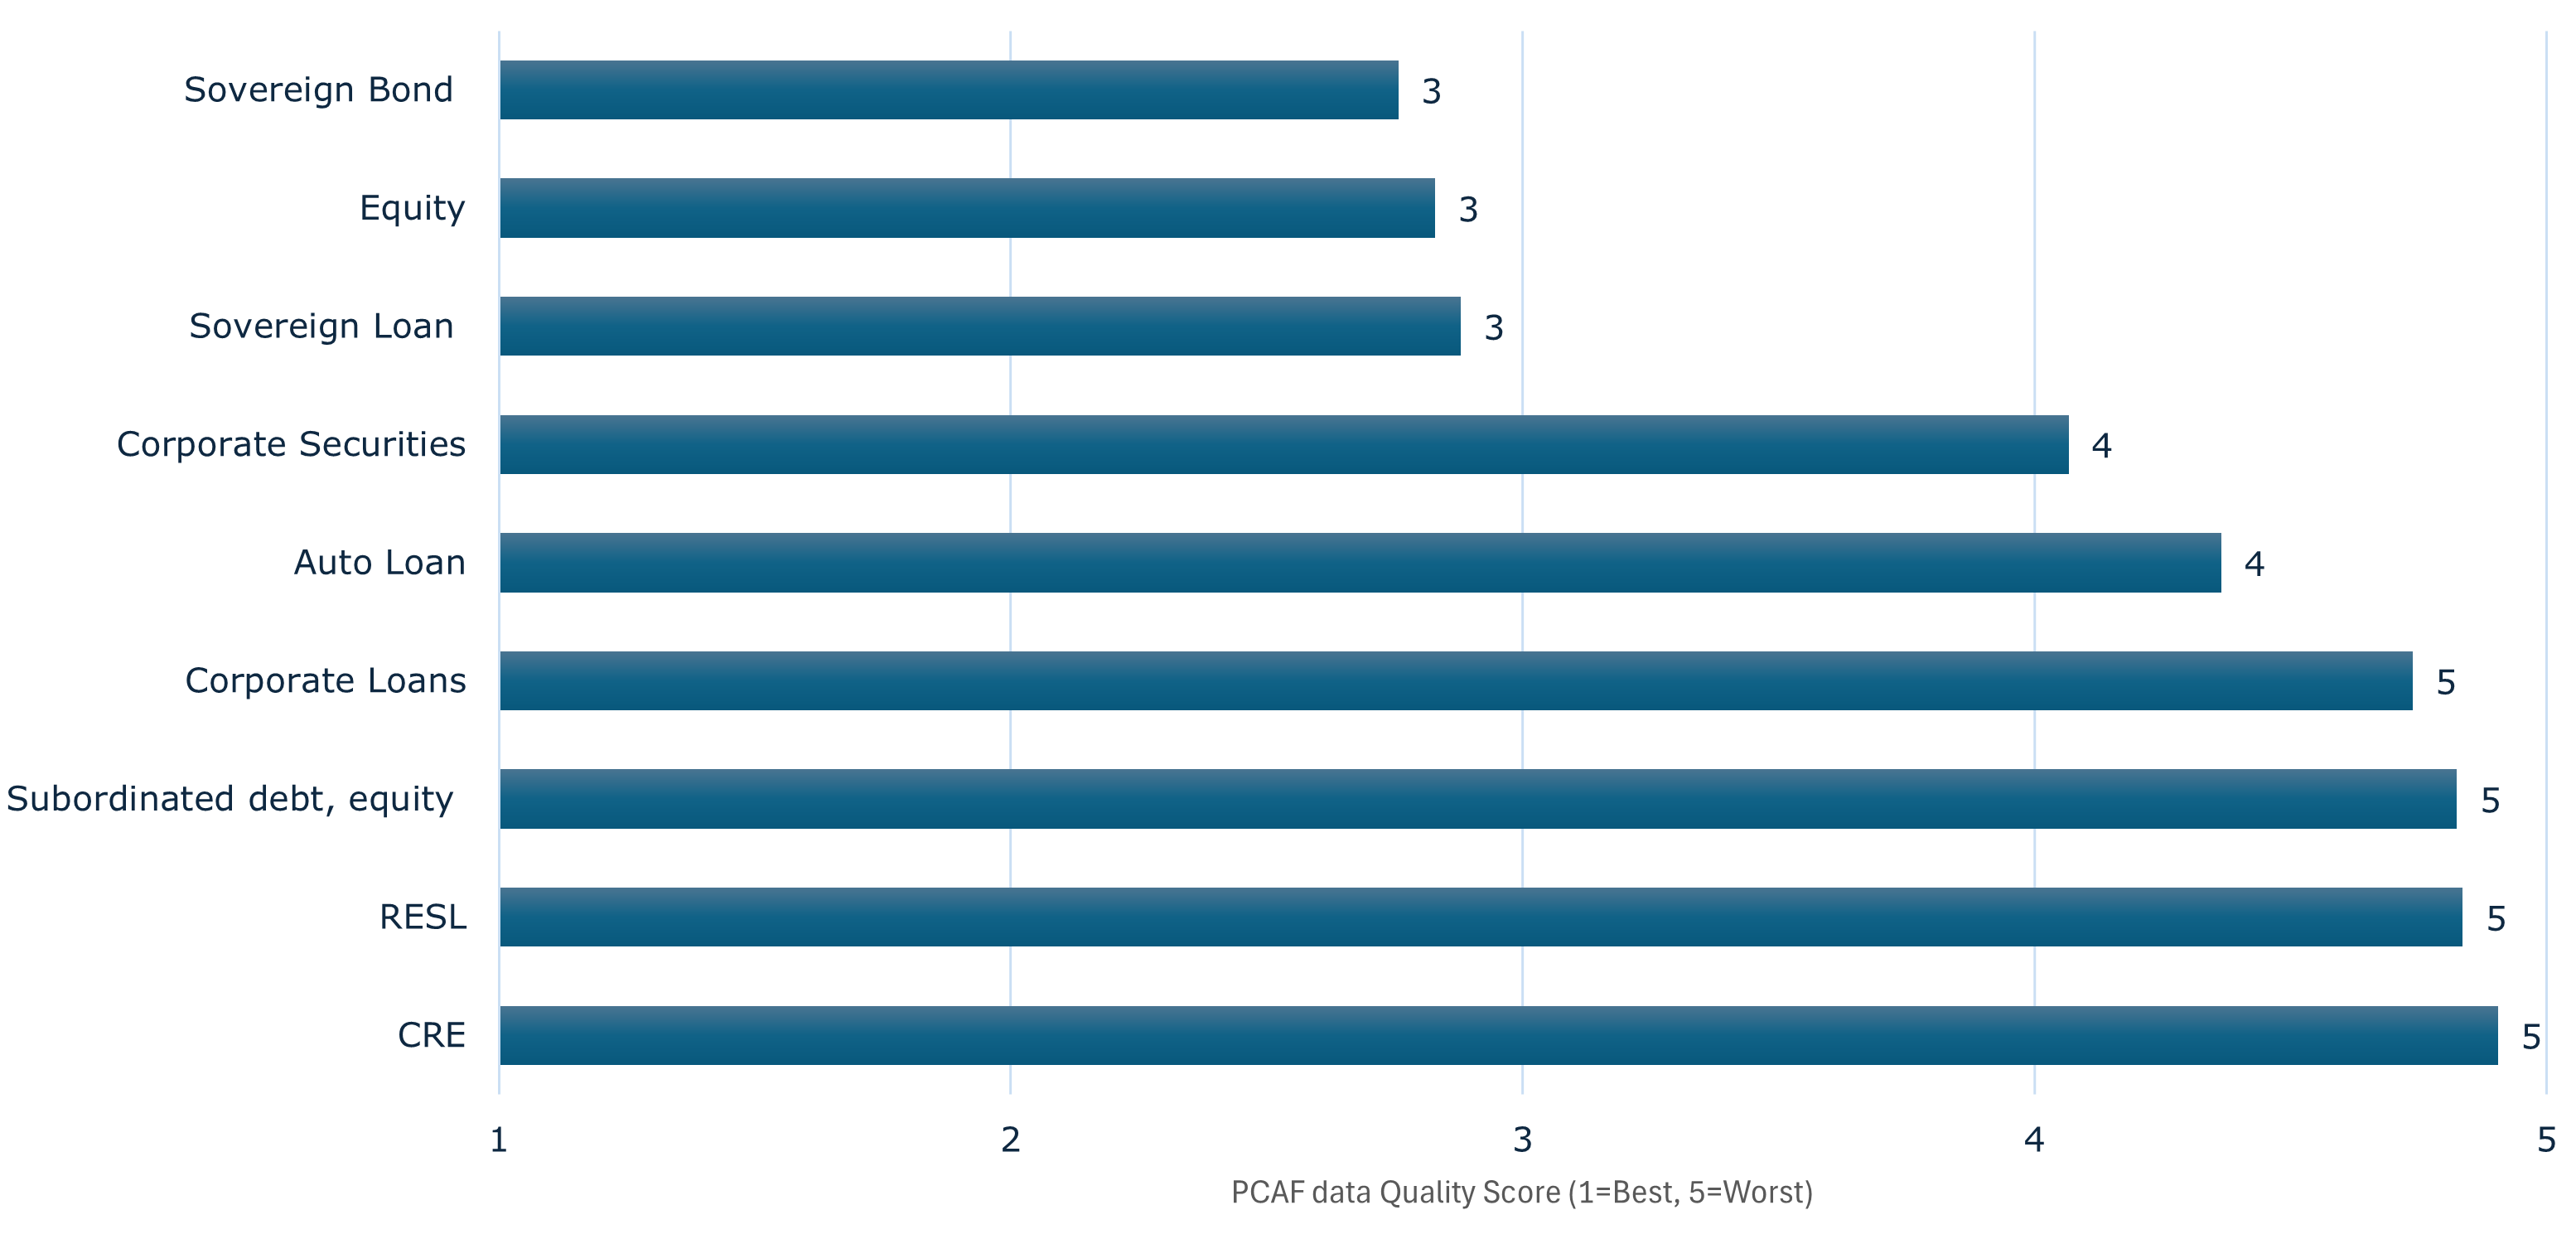
Figure 4 - Text version
| PCAF data quality score (1 = Best, 5 = Worst) |
|
|---|---|
| Sovereign Bond | 3 |
| Equity | 3 |
| Sovereign Loan | 3 |
| Corporate Securities | 4 |
| Auto Loan | 4 |
| Corporate Loans | 5 |
| Subordinated debt, equity | 5 |
| RESL | 5 |
| CRE | 5 |
Source: OSFI calculations based on CRR data
For IAIGs, equities (for example, preferred and common shares) showed the best data quality, averaging a score of 2, indicating moderate reliance on reported emissions. Corporate public bonds and federal government bonds both scored 3, indicating moderate data quality with some use of reported emissions. Mortgage loans scored 4, highlighting limited access to reported emissions. Corporate private bonds had the lowest data quality with an average score of 5, reflecting almost total reliance on estimates.
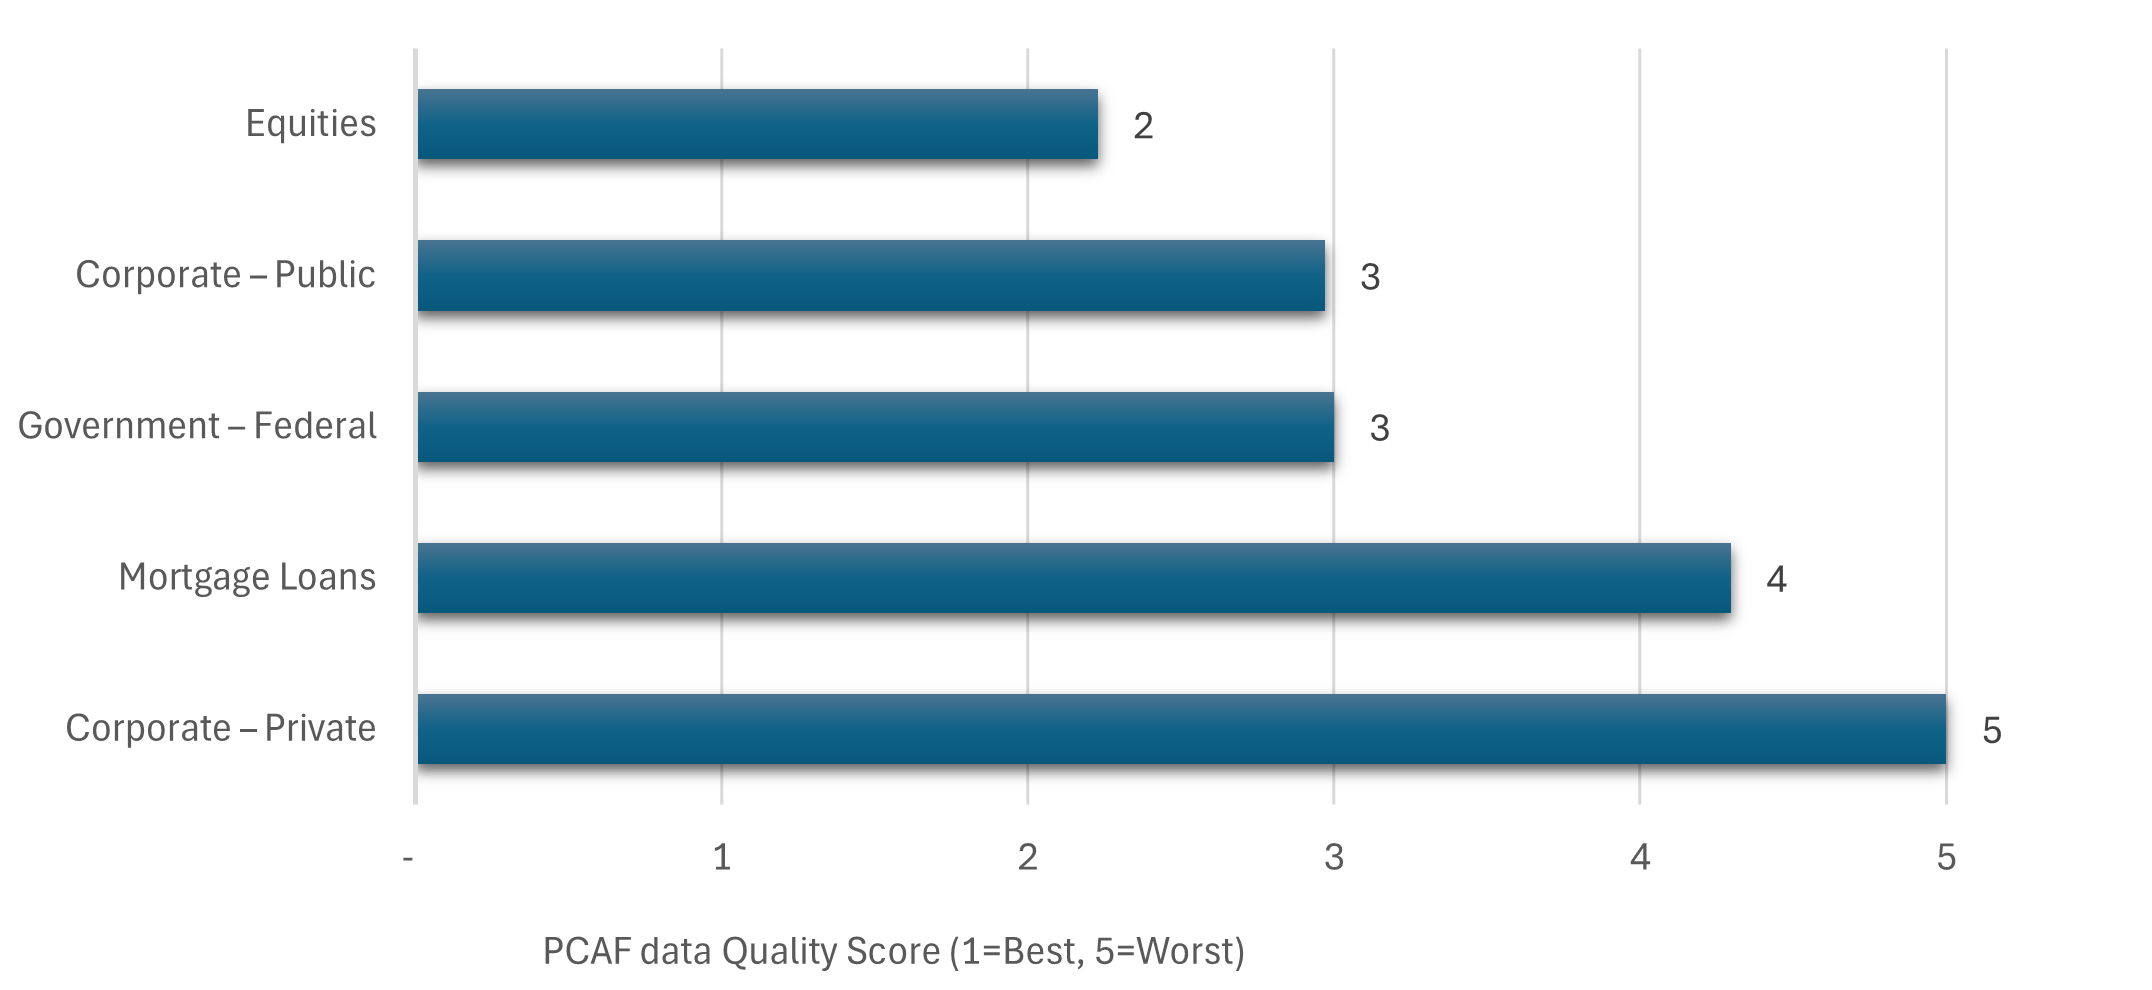
Figure 5 - Text version
| PCAF data quality score (1 = Best, 5 = Worst) |
|
|---|---|
| Equities | 2 |
| Corporate - Public | 3 |
| Government - Federal | 3 |
| Mortgage Loans | 4 |
| Corporate - Private | 5 |
Source: OSFI calculations based on CRR data
Conclusion and Next Steps
The first year of CRR submissions marks a significant step forward in building Canada’s capacity for climate risk reporting. FRFIs have begun quantifying operational and financed emissions and mapping exposures across sectors and geographies. This provides us and FRFIs alike with a clearer picture of potential vulnerabilities.
At the same time, the inaugural filings underscored substantial challenges, including:
- persistent data gaps
- heavy reliance on proxies
- inconsistent reporting practices that limit comparability and the overall reliability of results
These issues highlight the importance of improving data governance, reporting discipline, and the quality of underlying inputs.
Looking ahead, OSFI will refine expectations for CRR reporting to strike the right balance between data completeness, quality, and reporting burden. For 2026, OSFI’s expectation is that FRFIs will progressively strengthen internal controls and move toward more robust data. By embedding these improvements, the CRR will evolve into a cornerstone of Canada’s climate risk supervisory oversight—one that produces consistent, comparable, and decision-useful climate data to support resilience across the financial system.
Amendments to the Returns
Drawing on observations from the first submissions and feedback from industry, we are introducing amendments to the CRR effective in Fall 2025.
These amendments are intended to improve the quality, clarity, and comparability of reported data, while reducing unnecessary reporting burden on FRFIs. They reflect OSFI’s commitment to balancing completeness with data quality, while ensuring that supervisory focus remains on the most material climate-related financial risks. Details of the change can be found in the changelog.
-
Removal of certain reporting requirements
To focus on material exposures and to reduce unnecessary burden:
- operational emissions (FRFIs’ own emissions, Scope 3 categories 1–14) will no longer be required
- securitization exposures will no longer be reported by DTIs
- disaggregation of Financed Emissions Scope 3 by scope 1 and 2 will become optional
-
Refinement of industry classification
- Sector classification requirements will be streamlined to focus on high-emitting sectors. Updates will be co-developed with the industry with phased expectations for certain sectors where data limitations exist.
-
Clarifications of definitions
- Updated definitions and instructions will be provided to reduce ambiguity in CRR submissions and improve consistency across FRFI types.
-
Recommendations
To support a more accurate assessment of CRR submissions, FRFIs are encouraged to:
- include supplemental notes with their CRR filings that explain key assumptions, methodologies, and any data gaps
- provide a project plan outlining actions to improve data quality scores over time, particularly where challenges persist