Strengthening Climate Risk Financial Resilience: Insights from the Standardized Climate Scenario Exercise
Table of contents
Acknowledgements

Stéphane Tardif
Managing Director, Catastrophic Risk Division
As climate-related risks intensify, strengthening the ability of Canada's financial system to measure, manage, and price these risks has become increasingly important. The Standardized Climate Scenario Exercise (SCSE), conducted jointly by the Office of the Superintendent of Financial Institutions (OSFI) and the Autorité des marchés financiers (AMF), represents a critical step forward in building sector-wide capacity to assess both physical and transition risks.
This report reflects the contributions from over 250 federally and provincially regulated financial institutions in Quebec, whose participation provided essential insights and data for the exercise. I want to thank the experts and partners from The Bank of Canada, Environment and Climate Change Canada, Riskthinking.AI, and Moody's, who helped shape the methodologies used. Their commitment has been vital in advancing this important initiative.
Finally, I would like to express my heartfelt gratitude to the lead authors, Mahmood Alaghmandan, Meghal Arora, Gabriel Bruneau, Vadim Cebotari, Brett Lindsay, Stevan Manokaran, and Olga Streltchenko, for their commitment and expertise in drafting this report. This report would not have been possible without the considerable time and effort they invested, as well as by colleagues across OSFI and the AMF who supported the design, execution, and analysis of the exercise.
Key takeaways
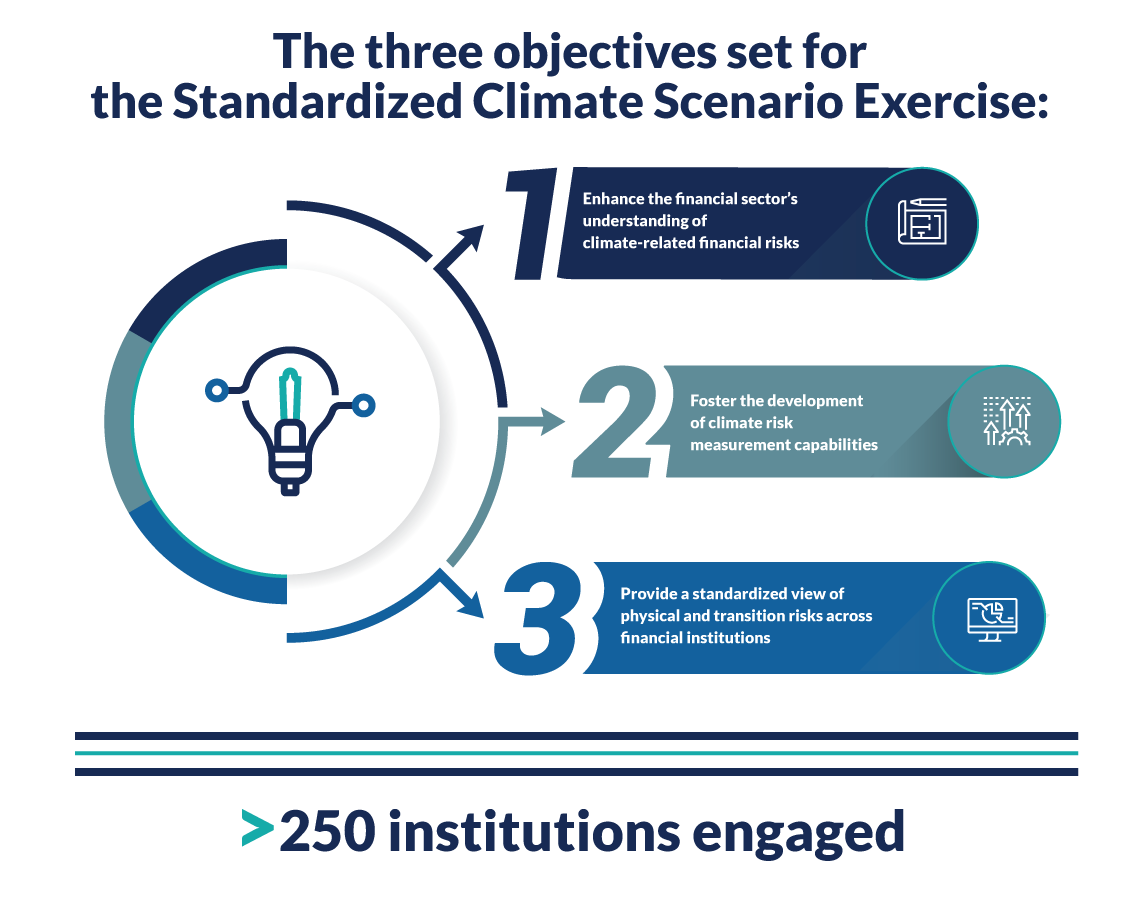
- In 2024, the Office of the Superintendent of Financial Institutions (OSFI), in collaboration with the Autorité des marchés financiers (AMF), conducted the Standardized Climate Scenario Exercise (the exercise or SCSE). We set three objectives for the exercise: (1) to enhance the financial sector's understanding of climate-related financial risks; (2) to foster the development of climate risk measurement capabilities; and (3) to provide a standardized, comparable view of physical and transition risks across financial institutions. More than 250 federally and provincially regulated financial institutions took part in the exercise.
- The exercise was effective in advancing institutional capability to identify, assess, and quantify climate-related risks using standardized frameworks and methodologies.
- The exercise incorporated standardized quantitative components that facilitated numerical assessments of the potential impacts of various climate scenarios. These results provided an evaluation of climate-related risks for participating institutions. For many, this represented their first exposure to such an assessment, thereby enhancing the overall value and relevance of the exercise.
- Property and Casualty (P&C) insurers are generally more advanced in geolocating exposures, enabling a more precise assessment of climate-related physical risks such as flood and wildfire. By contrast, Deposit-Taking Institutions (DTIs) and Life insurers remain behind in developing these capabilities, limiting their ability to integrate location-specific climate related physical risk into credit, underwriting, and risk management decisions. This gap is exacerbated by the fact that few institutions systematically collect or maintain flood insurance information for collateral properties, leaving them potentially exposed to underestimated risks.
- The flood module helped identify the bank's mortgage and real estate exposures that are in high-risk flood zones. With just 40% of Canadian homeowners purchasing optional flood insurance, and limited consideration of flood risk in mortgage underwriting, banks face heightened exposure to catastrophic flood events.
- The wildfire analysis found that under a moderate warming scenario, nearly twice the exposures in scope would be in high-risk areas compared to current climate conditions, indicating rising vulnerability to wildfires.
- The transition risk analysis revealed that financial institutions hold a significant portion of their commercial exposures in sectors vulnerable to transition-related risks. These exposures could experience a substantial increase in expected losses over a long term. The impact is especially pronounced in the case of a delayed transition.
- The exercise results indicate that, in the short to medium term, financial institutions appear able to absorb the modelled losses from physical and transition risks. Over the long term, however, many physical hazards intensify in non-linear ways, where small increases in warming can trigger disproportionately large impacts. Such escalation through more frequent extreme events, could amplify losses and strain resilience, particularly for institutions with concentrated regional or sectoral exposures.
- Strengthening approaches to the measurement, assessment and management of climate-related financial risks remains essential for supporting confidence in the Canadian financial system. Continued efforts in this area will contribute to preserving financial stability and enhancing institutional resilience as climate-related challenges evolve.
- To that end, OSFI and the AMF will incorporate these findings into ongoing supervisory expectations and risk management guidance. Future work will focus on assessing financial institutions' ability to measure and adequately price catastrophic- and climate-related financial risks using robust, data-driven approaches.
1. Overview
The imperative to assess climate-related financial risks has become increasingly evident as global warming intensifies the frequency and severity of extreme weather events. These risks pose potential threats to the financial system through various channels such as credit losses, asset devaluation, liability exposures, and operational disruptions.
Advancing Climate Risk Assessment in Canada's Financial Sector
The SCSE was designed to achieve three core objectives:
- Enhance the financial sector's understanding of climate-related financial risks
- Foster the development of climate risk measurement capabilities
- Provide a standardized view of physical and transition risks across financial institutions
Objectives set for the Standardized Climate Scenario Exercise - Text version
The three objectives set for the Standardized Climate Scenario Exercise:
- Enhance the financial sector's understanding of climate-related financial risks
- Foster the development of climate risk measurement capabilities
- Provide a standardized view of physical and transition risks across financial institutions
To meet these goals, OSFI and the AMF engaged over 250 financial institutions from Canada's federally and provincially regulated banking and insurance sectors. This broad participation helped lay the groundwork for more robust climate risk management across the financial system. While larger institutions showed varying levels of maturity in assessing climate risks, many smaller institutions began with limited capabilities—highlighting the need for sector-wide capacity building and common analytical frameworks.
A key insight from the exercise was the urgent need for strategic investment in climate-related data infrastructure. Reliable geospatial data—such as floodplain and wildfire hazard maps—remains scarce and fragmented, limiting institutions' ability to assess physical risks at the asset level. Tracking of property insurance coverage is also inadequate, creating blind spots in credit risk assessment. Moreover, adaptation remains underutilized, with few institutions offering guidance to borrowers or policyholders on how to protect assets from climate hazards.
On the transition risk side, the SCSE introduced a new classification framework to map exposures by sector and jurisdiction based on emissions intensity and transition sensitivity. This enabled institutions to classify millions of commercial exposures and better understand how transition scenarios affect different parts of their portfolios. However, the limited use of counterparty-level emissions data and property-level energy data constrained the precision of analysis—particularly in real estate, a sector responsible for up to 28% of national emissions.Footnote 1
Finally, the SCSE highlighted the limitations of standardized, top-down climate scenarios. While useful for comparability, they can obscure portfolio-specific vulnerabilities. As regulatory expectations evolve, institutions must strengthen their data and modeling capabilities to support more tailored, bottom-up analyses and integrate climate risk into core decision-making processes.
Physical risk analysis
As part of the third objective, providing a standardized view of physical and transition risks, the SCSE included a focused assessment of physical climate risks. Physical climate risks refer to the potential financial, economic, and societal losses, resulting from the direct impacts of climate-related hazards. These include both acute events—such as floods, wildfires, storms, and heatwaves—and chronic changes, like rising sea levels, sustained temperature increases, and long-term shifts in precipitation patterns. These risks can damage infrastructure and physical assets, disrupt supply chains and economic activity, and impair the value and performance of financial exposures. They also pose serious threats to human health by worsening heat-related illnesses, respiratory conditions, food and water insecurity, and the spread of vector-borne diseases. The adverse impacts and associated losses from these hazards are projected to intensify with each increment of global warming.Footnote 2 As two of the most financially impactful acute physical events in Canada are floods and wildfires, we focused our analysis on these hazards in the exercise.
Flood and wildfire risks can impact nearly all types of financial institutions in Canada through a range of risk transmission channels. P&C insurers are directly exposed through their insurance policies. DTIs and life insurers may face financial losses when investment properties or properties used as mortgage loan collateral that lack adequate flood insurance coverage are damaged by flooding. DTIs, life insurers, and mortgage insurers are all exposed to indirect financial impacts of flooding and wildfire, such as heightened probabilities of defaults from vulnerable borrowers, lower property valuations, and longer times to settlement for defaulted mortgages.
The flood module assessed riverine and coastal flooding in eleven Canadian urban regions, covering $904 billion in mortgage and real estate assets and $3 trillion in insured property values (IPV). It identified in-scope exposures in high-risk flood zones, which are areas with flood depths exceeding 0.5 meter in a 1-in-100-year return period.
Based on projected flood hazard maps for 2045, both P&C insurers and DTIs are expected to experience a significant increase in exposure to high-risk flood areas. Importantly, the projected increase in concentration of these exposures is similar across institutions, indicating a consistent vulnerability pattern regardless of institution type. Additionally, commercial exposures are projected to remain more concentrated in higher-risk flood zones, compared to residential exposures. Moreover, some institutions also showed significant concentrations of high loan-to-value (LTV) mortgages in projected flood-prone areas, posing heightened borrower vulnerability.
The wildfire module assessment captures exposures of $27 billion in mortgage and real estate assets and $359 billion in insured property values in seven geographic areas. We identified the in-scope exposures that fall within high-risk wildfire risk areas using a wildfire weather build-up index. Even under modest temperature increase scenarios, wildfire frequency and intensity are projected to increase, highlighting the potential for a changing climate to impact financial risks.
Transition risk analysis
The other module of the SCSE focused on the assessment of transition risks, which refers to the stresses faced by economic actors, sectors, or regions due to shifts in policy, consumer and business sentiment, or technologies associated with the transition to a lower-carbon economy.
To translate this risk into economic terms, the SCSE modeled three transition risk scenarios:
- Orderly transition
- Delayed transition
- Net-zero pathway
This report focuses on the delayed transition scenario, which reflects the current policy environment.
These scenarios were applied to the assets of financial institutions, covering nearly $4 trillion in commercial exposures reported by more than 150 institutions.
To assess vulnerability, we defined sectors of economic activity based on their exposure to climate mitigation policies and identified Transition Vulnerable Sectors (TVS)—industries potentially adversely affected by decarbonization-related risks, such as increased operating costs, declining demand, and stranded assets.
Under the delayed transition scenario, lifetime expected credit losses across all sectors are projected to increase by 73% over the long term. Notably, 96% of this increase stems from exposures in TVS, and 83% is concentrated in fossil fuel exposures, which represent only 7% of the total in-scope portfolio.
Delayed transition scenario - Text version
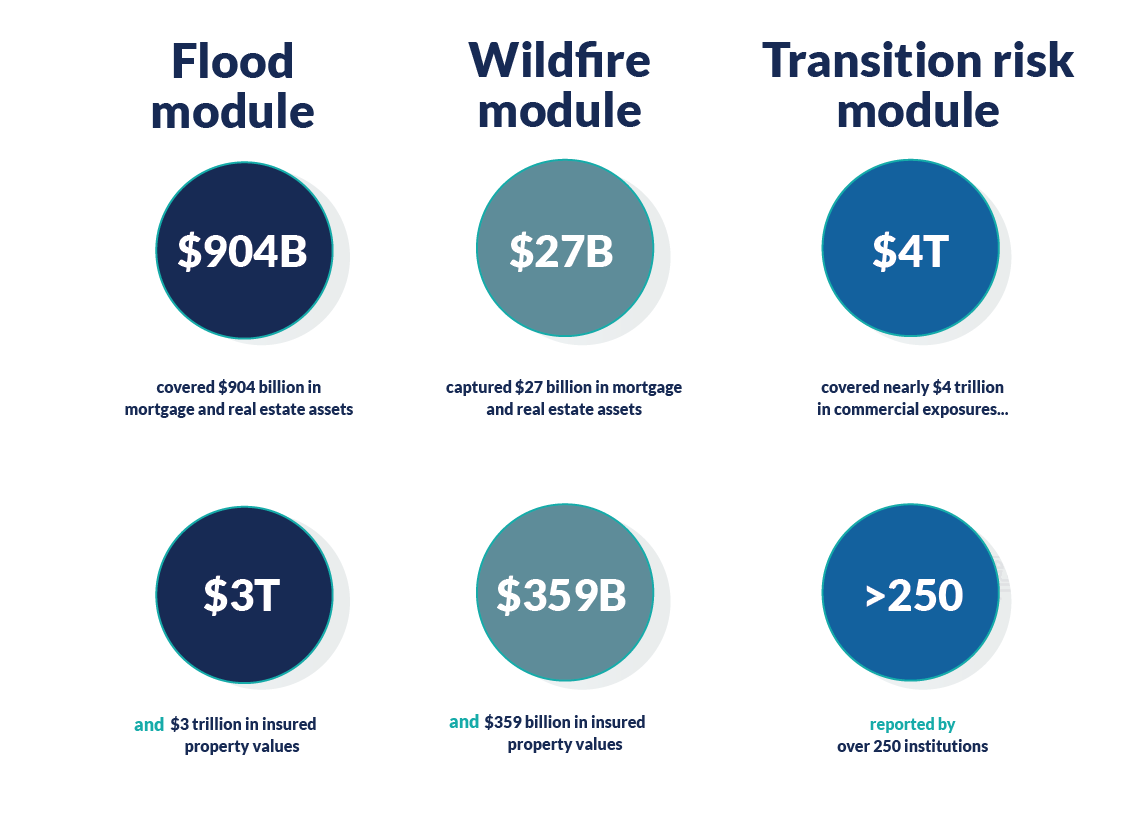
Flood module:
- Covered $904 billion in mortgage and real estate assets
- and $3 trillion in insured property value
Wildfire module:
- Captured $27 billion in mortgage and real estate assets
- and $359 billion in insured property values
Transition risk module
- Covered nearly $4 trillion in commercial exposures...
- reported by over 250 institutions
Conclusion and supervisory implications
The SCSE results demonstrate that while climate-related financial risks do not pose an immediate threat to financial stability, subject to the limitations of the proposed methodology, material vulnerabilities exist. This is particularly evident in transition-sensitive sectors or for geographic regions exposed to physical risks.
It is important to note that climate scenario-based exercises do not capture complex, non-linear, and cascading effects across the financial system. The exercise did not account for the full range of second- and third-order impacts, such as macroeconomic spillovers, supply chain disruptions, or systemic risks.
The exercise also revealed important data gaps and underscored the need for improved integration of climate risk considerations in underwriting, strategic planning, and enterprise risk management.
A robust approach to assessing and managing climate-related financial risks is critical to maintaining confidence in the Canadian financial system. It helps to preserve overall financial stability and ensure that institutions remain resilient in the face of an evolving climate landscape.
To that end, OSFI and the AMF will incorporate these findings into ongoing supervisory risk management assessments. Future work will focus on assessing financial institutions' ability to measure, manage, and adequately price catastrophic and climate-related financial risks using robust, data-driven approaches.
As outlined in OSFI Guideline B-15 Climate Risk Management, and the AMF Climate Risk Management Guideline, we expect institutions to map physical hazards to their portfolios, quantify potential financial impacts, and demonstrate how these risks are integrated into capital planning, liquidity management, and insurance coverage. As part of our ongoing supervisory work, we will incorporate physical risks into our regular reviews of institutions' capital models.
OSFI and the AMF will evaluate whether institutions conduct credible stress testing and scenario analysis, using geospatial data, hazard models, and loss estimates. We also expect institutions to monitor emerging climate and catastrophe trends, manage evolving risks, and maintain adequate capital buffers for physical risk exposures.
2. Building Sector-Wide Climate Risk Awareness and Capabilities
A central goal of the SCSE was to increase climate risk awareness and analytical capacity across Canada's financial sector. Prior to the exercise, most institutions had limited experience with climate scenario analysis, geospatial tools, and climate-relevant data. By engaging over 250 financial institutions, the SCSE helped build foundational expertise and revealed critical gaps in data infrastructure, analytical methods, and institutional readiness.
This section highlights key insights from the exercise, including the importance of strategic investment in climate-related data, the enabling role of geocoding and geospatial analysis, and the need to improve tracking of property insurance and adaptation measures. It also explores how institutions approached transition risk classification, the limitations of sectoral and top-down analysis, and the growing need for granular, property-level data—particularly in real estate portfolios.
Conducting the SCSE to build expertise and capacity
Prior to the SCSE, only 41% of DTIs, 31% of life insurers, and 49% of P&C insurers reported prior experience with physical climate scenario analysis. For transition scenario analysis the prior experience is 22%, 51% and 28% respectively
International standard-setting bodies increasingly emphasize the need for financial institutions to strengthen their ability to identify, assess, and manage climate-related financial risks. Measuring both physical and transition risks is essential for sound risk management and financial resilience. The Network for Greening the Financial System (NGFS) promotes forward-looking metrics and geospatial analysis for physical hazards. The Basel Committee on Banking Supervision (BCBS) calls for improved data and measurement approaches to integrate climate risks into prudential frameworks. The International Association of Insurance Supervisors (IAIS) highlights the importance of capturing risks on both sides of insurers' balance sheets—from extreme weather losses to asset devaluation.
However, a self-assessment questionnaire conducted by OSFI three years ago revealed that most Canadian financial institutions were not prepared to meet these expectations. Many had no plans in place to manage climate-related financial risks, or had plans but had yet to begin implementation.
In response to this gap, one of the central objectives of the SCSE was to raise awareness and build institutional capacity to assess climate-related financial risks. The SCSE engaged a broad spectrum of financial institutions across diverse business models and sizes. OSFI and the AMF received over 150 submissions, representing more than 250 institutions.
Through this exercise and this collaboration, the SCSE played a pivotal role in advancing institutional understanding of climate risks—particularly by promoting scenario analysis as a foundational tool for evaluating both physical and transition risks.
Strengthening Climate Risk Resilience Through Strategic Data Investment
Only 26% of DTIs, 25% of life insurers, and 12% of P&C insurers feel they have suitable data and information for use in climate scenario analysis
Access to reliable physical risk data remains difficult, constraining financial institutions' ability to assess climate exposure at the asset and counterparty levels. Both the NGFS's Bridging Data GapsFootnote 3 report and the joint Bank of Canada–OSFI study on flood riskFootnote 4 highlight the lack of consistent, standardized data—especially for floods and wildfires—at the granular geographic resolution needed for meaningful risk assessment.
To address these challenges, financial institutions must make strategic investments in climate-related data and data infrastructure. This includes building the internal capability to capture, organize, and analyze high-resolution data on both physical and transition risk. Investing in geospatial datasets, such as standardized hazard maps, enables institutions to evaluate climate-related risks with greater precision and to identify vulnerabilities across their portfolios.
Robust data capabilities are also essential for forward-looking scenario analysis. Institutions need to simulate a range of plausible climate pathways, including varying emissions trajectories and policy responses, to understand potential financial impacts. Without adequate data, scenario modeling becomes speculative and incomplete, weakening the ability to test portfolio resilience.
Investment in climate data is not only a technical necessity, but also a risk management imperative. It supports better decision-making, improves disclosures, and aligns institutions with evolving regulatory expectations. Capacity building—through staff training and the development of climate analytics expertise—is equally critical.
Finally, collaboration across the public and private sectors is essential. By working with policymakers, data providers, and standard-setting bodies, financial institutions can help shape a more coherent data ecosystem—one that supports consistent methodologies and improves comparability across institutions.
To carry out the various SCSE modules, participants were required to collect and label data for their portfolios. Specifically, the execution of the SCSE physical risk module depended on geolocating exposures, while the transition risk module required industry and regional classifications. Through this data collection and labeling process, participants gained a clearer understanding of the climate risk exposures within their in-scope portfolios.
Beyond the individual insights gained, this data investment also fostered collaboration between government bodies and the private sector. The SCSE played a key role in facilitating this cooperation, helping to shape a comprehensive and relevant exercise and gather data that will inform future supervisory strategies.
Geocoding as a foundational tool for climate risk analysis
Prior to the SCSE, only 28% of DTIs, 20% of life insurers, and 73% of P&C insurers reported prior experience with geocoding
By converting property addresses into precise geographic coordinates, geocoding allows financial institutions to assess exposure to localized physical hazards—such as floods and wildfires—with far greater accuracy than general location data permits. This spatial precision is essential for overlaying hazard maps and identifying risk concentrations that are often invisible in aggregated or regional datasets.
Despite its importance, geocoding remains underutilized. This limited adoption constrains institutions' ability to evaluate climate-related risks at the asset and counterparty levels, and to integrate these risks into capital planning, pricing, and underwriting decisions. Moreover, forward-looking climate risk assessments increasingly rely on geospatial integration of hazard projections—often using geographic information systems (GIS) and specialized data tools.
Despite these challenges, all participating institutions in the SCSE successfully geocoded 12.8 million properties, laying the groundwork for more accurate physical risk analysis. Strengthening this capability is essential for integrating climate risk into core risk management frameworks and meeting evolving regulatory expectations.
Leveraging geospatial data to assess climate risk
Prior to the SCSE, only 15% of DTIs, 23% of life insurers, and 56% of P&C insurers reported prior experience using flood and wildfire hazard maps
Geospatial mapping plays a critical role in climate risk analysis. It is the process of integrating GIS technologies, spatial data, and climate hazard models to identify, visualize, and assess the exposure and vulnerability of assets, populations, or ecosystems to climate-related threats.
However, its use remains limited across the financial sector. A major barrier to broader adoption is the limited availability of high-quality, publicly accessible climate-risk data. In Canada, government and academic sources currently fall short of supporting comprehensive financial risk assessments. For example, the absence of publicly available floodplain maps makes it difficult to determine whether homes or infrastructure are at risk of flooding—a significant gap in the national geospatial data landscape. In the absence of standardized public data, institutions must rely on climate data vendors or fragmented provincial and municipal sources.
This data shortfall particularly affects smaller institutions and regions prone to frequent or severe flooding, where the inability to assess asset-level vulnerability could translate into underestimated mortgage losses and mispriced risk.
As part of the SCSE, participants were asked to work with hazard maps, often for the very first time. This hands-on engagement with hazard data not only deepened their understanding of physical climate risks, but also marked a significant step forward in institutional capacity building. Encouragingly, the data landscape is improving. Since the finalization of the SCSE methodology, Natural Resources Canada (NRCan) has begun publishing granular wildfire data that complements the datasets from Environment and Climate Change Canada (ECCC) used in the exercise. Institutions are now better positioned to incorporate enhanced climate data as it becomes available.
The importance of property insurance
Only 12% of DTIs reported requiring or collecting information on flood insurance coverage for properties used as collateral for loans or investments
Property insurance plays a pivotal role in managing financial exposure to physical climate risks, yet it is a blind spot for many institutions. This limited insight into the adequacy of insurance coverage by borrowers represents a significant gap in assessing financial exposure to physical climate risks. For lenders, uninsured or underinsured properties in high-risk flood or wildfire zones pose a direct threat to the value of collateral. This increases the likelihood of credit losses in the event of a disaster. As noted by the Basel Committee on Banking SupervisionFootnote 5, financial institutions need to map exposures at a granular level, including insurance status, geographic location, and hazard vulnerability, to understand physical risk exposure and potential credit deterioration.
A key structural challenge lies in the mismatch between short-term insurance coverage and long-term financial exposures. Property insurance is typically renewed on an annual basis and is subject to repricing, exclusions, or withdrawal, based on market conditions or hazard experience. By contrast, mortgage and loan exposures can span many years. This misalignment creates a potential material risk: a property may be fully insured at origination, but coverage can lapse, become unaffordable, or be withdrawn during the life of the loan—leaving lenders exposed to losses they are not monitoring or mitigating.
Insurability itself is increasingly becoming a proxy indicator of physical risk. Properties deemed uninsurable due to repeated or severe hazards may face declining market values, reduced liquidity, and, over time, may become ineligible for mortgage financing. This can have systemic implications if concentrated in vulnerable regions or on a balance sheet of one institution. As emphasized by international standard-setting bodies (SSBs) for the financial sector , understanding these dynamics is critical not only for credit and underwriting risk management but also for maintaining financial stabilityFootnote 6.
The SCSE successfully drew attention to this information gap and potential shortcoming in internal risk management processes.
The importance of adaptation
Only 9% of DTIs, 5% of life insurers, and 36% of P&C insurers reported sharing information with mortgage borrowers and/or property insurance policyholders on how to protect their properties from flooding or wildfires. The majority indicated they have no current plans to provide such information
The primary cost of climate change impacting Canadians is residential basement flooding, with insured losses running about 3x higher today than a decade agoFootnote 7. Ten percent of homes (1.5 million households) are no longer eligible for flood insurance. A report by the Intact Centre on Climate Adaptation – Treading Water: Impact of Catastrophic Flooding on Canada's Housing Market – found that over the past decade homes in flood-impacted communities sold for 8% less and listings dropped by 44%.
Wildfire, Canada's second most costly impact to housing, set a record-shattering 2023 wildfire season that burned an area three times the size of Nova Scotia (18.5 million hectares). This is more than double the previous record set in 1995, and represents eight times the annual average area burned over the past 25 years. These wildfires forced 200,000 Canadians from their homes and launched calls for large scale investment in preventative actionFootnote 8.
Adaptation is a critical component of assessing and managing physical climate risks. By implementing measures to reduce vulnerability—such as flood-proofing buildings or creating defensible space against wildfires—property owners can significantly lower the potential for damage and financial loss. Despite its importance, most institutions indicated in the SCSE that they had no plans to share information with property owners on how to protect their assets from flooding or wildfires.
This lack of engagement represents a missed opportunity. Financial institutions—particularly lenders and insurers—are well-positioned to promote household-level adaptation, yet this role is not being fully realized. According to the Canadian Voices on Flood Risk (2020) report, only 25% of surveyed Canadians recalled receiving flood risk information from their insurance representative, underscoring a major communication gap.
Financial institutions have a pivotal role to play in advancing adaptation. By raising awareness, sharing practical guidance, and supporting proactive measures, they can help reduce future losses and strengthen the resilience of both households and financial portfolios.
Borrowers are especially vulnerable when adaptation is lacking. If their properties are damaged and they are unprepared, they may face increased financial stress, higher default risk, and reduced asset values. Encouraging property-level adaptation can mitigate these risks and improve long-term credit quality.
Sectoral sensitivity of transition risk
Prior to the SCSE, 62% of DTIs, 47% of life insurers, and 45% of P&C insurers reported having experience with climate-related industry and jurisdiction mapping suitable for transition scenario analysis
Quantifying transition risk requires capabilities that go beyond traditional exposure classification. Specifically, it involves mapping exposures based on how different sectors and jurisdictions are expected to respond to a transition scenario. Unlike conventional classifications, climate-relevant sectoral and regional mapping reflects greenhouse gas (GHG) emissions intensity and transition sensitivity—factors that are not necessarily aligned with standard economic or regulatory taxonomies.
To support this, the SCSE designed a comprehensive classification framework for use in the exercise and future applications. This framework was tailored for climate analysis, recognizing that exposures within industries or jurisdictions may differ significantly in their climate impact. The granularity and design features of these mappings were instrumental in achieving the SCSE's objectives—once the mapping is achieved, the corresponding transition adjustments can be applied to assess impacts of the underlying scenariosFootnote 9.
Working on the transition risk modules, financial institutions reported to have classified 2.5 million commercial exposures. Implementing these classifications not only familiarized participants with the type of mapping required for transition scenario analysis, but also laid the groundwork for future enhancements. Institutions can refine these mappings to better reflect the characteristics of their own portfolios in subsequent analyses.
Beyond the sectoral analysis
Only 12% of DTIs, 29% of life insurers, and 27% of P&C insurers reported using counterparty emissions data to quantify transition risk
An area of enhancement for transition risk analysis is the ability to conduct counterparty-level transition sensitivity analysis, instead of industry sector and jurisdiction level analysis. While the mapping built on the combination of sector and jurisdictions provides a useful proxy for transition risk, it lacks the precision needed to capture firm-specific vulnerabilities. Counterparty-level data, such as direct and financed GHG emissions, energy consumption, and transition plans, can significantly improve risk discrimination and scenario analysis.
However, a major barrier remains—the lack of reliable and standardized climate-related data. This data gap continues to hinder the financial sector's ability to quantify transition risks effectively. To address this, OSFI and the AMF encourages institutions to strengthen their data collection practices and integrate climate considerations into core risk management systems.
A key step forward is the implementation of the climate risk returnFootnote 10, which will become a regulatory expectation for all institutions starting next year. This return requires institutions to begin measuring and reporting counterparty-level emissions, laying the foundation for more granular and accurate transition risk assessments in the years ahead.
Property-level data is essential for assessing transition risks in real estate portfolios, yet its use remains limited
Only 3% of participating institutions reported using property-level heating and power source data in this assessment, with most relying on proxy data from Statistics Canada, the Canada Energy Regulator, and Natural Resources Canada
The real estate sector is highly exposed to transition risks due to its significant emissions profile. Buildings account for approximately 18% of Canada's national GHG emissions—13% from direct sources like heating and 5% from electricity use. When embodied carbon from construction materials and processes is included, the sector's contribution rises to 28%. Properties powered or heated by fossil fuels—such as natural gas or oil—may face declining market values as buyers and tenants increasingly prefer energy-efficient, low-emission buildings. These properties may also become more expensive to operate and maintain as carbon pricing, building code updates, and emissions regulations take effect—potentially leading to financial strain for owners and increased credit risk for lenders.
The SCSE's real estate transition module aimed to evaluate how these risks could transmit through financial portfolios, and whether institutions were equipped to assess them using granular, property-level data. While standardized scenarios provided consistency and comparability across institutions, they also revealed the limitations of top-down approaches in capturing portfolio-specific vulnerabilities. Despite the sector's vulnerability, most participating institutions reported relying on proxy data from sources such as Statistics Canada, the Canada Energy Regulator, and Natural Resources Canada. Only a small fraction used property-level heating and power source data, highlighting a significant gap in the ability to assess transition risks in real estate portfolios with precision. The exercise helped build awareness of the need for more detailed data and laid the groundwork for future improvements in climate risk analysis.
Beyond the top-down climate analysis
Standardized climate scenarios offer consistency and comparability across institutions, helping align methodologies and establish a common baseline for climate risk assessment. However, these scenarios are built on uniform assumptions and parameters, which can obscure the unique characteristics of individual portfolios and limit the ability to identify idiosyncratic risks. Financial institutions face diverse exposures to physical and transition risks, and a one-size-fits-all approach may hinder innovation, precision, and responsiveness.
Both have been significantly advanced by the SCSE. The top-down analysis, which help regulators to assess risks and provide financial institutions comparison with their peers, will be presented in the next section on quantitative physical and transition risk results.
The SCSE, as previously stated, significantly advanced climate risk awareness and analytical capacity across Canada's financial sector. It revealed critical gaps in data infrastructure, geospatial capabilities, and institutional preparedness—particularly among smaller institutions. Key enablers of effective climate risk analysis, such as geocoding, hazard mapping, and property-level data, remain underutilized. Similarly, property insurance and adaptation strategies are not yet fully integrated into risk management practices. On the transition risk side, the SCSE introduced a standardized classification framework and highlighted the need for counterparty-level emissions data to improve analytical precision.
Regulatory expectations are evolving accordingly. Climate risk management frameworks established by OSFI and the AMF emphasize the need for institutions to conduct climate due diligence tailored to their material exposures. This includes moving beyond top-down analysis to develop institution-specific data, models, and risk assessments. To meet these expectations, institutions must strengthen their climate data and modeling capabilities, building on the experience gained through the SCSE. Enhancing bottom-up analysis will allow institutions to better capture portfolio-specific vulnerabilities and integrate climate risk into core decision-making processes.
3. Quantitative physical and transition risk results
The third objective of the SCSE was to provide a standardized and comparable view of physical and transition risks across financial institutions. To support this goal, the exercise collected from the participating institutions quantitative results calculated based on a standardized methodology, therefore enabling consistent assessments of climate-related exposures and vulnerabilities.
This section presents key insights from the SCSE assessments. It focuses on physical risk exposures on residential and commercial exposure, and the modeled financial impacts of transition scenarios on commercial portfolios. It also briefly outlines the data sources and methodologies used in the analysis. While not comprehensive, the results included here illustrate how standardized approaches can reveal sector-wide patterns and inform future climate risk management practices.
Physical risk
The physical risk modules of the exercise evaluated financial institutions' exposure to flood—both fluvial and coastal—and wildfire hazards. Floods and wildfires can impact nearly all types of financial institutions in Canada through a range of risk transmission channels. In both cases, P&C insurers are directly exposed through property insurance policies. DTIs, life insurers, and mortgage insurers may also face financial losses when properties used as mortgage loan collateral are damaged or destroyed.
For flood risk, the transmission channels are amplified by the presence of a significant "flood insurance gap." In Canada, flood coverage is offered on an optional basis, with a take-up rate of only 40%Footnote 11, leaving many properties uninsured. When flood-damaged properties lack adequate insurance and are foreclosed, lenders are ultimately responsible for repair costs. The Government of Canada is working with the P&C insurance industry to address this gapFootnote 12. Mortgage insurers are generally not exposed to direct flood damages, as master contracts typically do not cover repair costs from natural disasters such as overland floodsFootnote 13. However, they remain vulnerable to indirect impacts like increased default probabilities, lower property valuations, and longer settlement times—risks that also affect DTIs and life insurers for uninsured mortgages.
In contrast, wildfire risk does not currently present an insurance coverage gap in Canada, as property insurance typically covers direct damages from that hazard. Nevertheless, financial institutions are still exposed to indirect impacts similar to those seen with flood risk—vulnerable borrowers may default, property values may decline, and settlement timelines may lengthen.
These risks are particularly relevant in rural areas where wildfire hazards are most acute. The wildfire module of the exercise focused on large rural Forward Sortation Areas (FSAs) that combine high fire weather indicators with the physical conditions necessary for ignition—such as the presence of combustible vegetation and other fuel sources—ensuring that the analysis captured areas of genuine wildfire risk rather than false positives from urban or agricultural regions.
To assess the importance of the flood and wildfire risks on financial institutions, the scope of assets covered included residential and commercial real estate. Specifically, it included mortgages, property insurance policies (both personal and commercial), properties owned by institutions, and other loans secured by immobile physical assets. For the covered assets, we collected portfolio characteristic distributions across several dimensions, such as region, LTV ratio, and property type. We also collected flood depth data for flood risk assessments, while wildfire indices were used to evaluate exposure to wildfire hazards. These metrics enabled us to classify exposures into high-risk and low-risk regions for both types of physical hazards, supporting a more granular and meaningful analysis of climate-related vulnerabilities.
The assessments did not estimate financial damage or institutional impacts, due to the lack of reliable, publicly available hazard-to-damage functions in Canada. However, the exercise produced a rich dataset—including flood depth and wildfire index data—that allowed us to provide a foundation for tracking how exposure to physical risks may evolve over time.
Physical risk scenarios
Physical climate risk scenarios are often structured using Representative Concentration Pathways (RCPs)—a set of standardized trajectories developed by the Intergovernmental Panel on Climate Change (IPCC) to describe potential future GHG emissions. They are used in climate modeling to explore how different levels of emissions might affect global temperatures and physical hazards, such as flood and wildfire, over time.
Three specific RCP scenarios are commonly used in physical climate risk analysis, each reflecting different levels of global warming and degrees of emissions reductions required to achieve it:
- RCP 2.6: temperature increase of 0.9℃ to 2.3℃ by 2090, requiring the most aggressive emissions reductions to remain on track
- RCP 4.5: temperature increase of 1.7℃ to 3.2℃ by 2090, requiring significant and sustained mitigation efforts
- RCP 8.5: temperature increase of 3.2℃ to 5.4℃ by 2090, assuming minimal action to reduce emissions
The wildfire risk module analyzed projected climate conditions for 2041–2070 under the moderate RCP 4.5 scenario and compared them to historical conditions, based on the 1971–2000 average.
In contrast, to support flood risk analysis, a stochastic modeling approach was applied to flood depth data, incorporating multiple Shared Socioeconomic Pathways (SSPs). These scenarios, introduced in 2021, provide refined projections of societal and economic trends that influence GHG emissions and other climate-relevant factors.
The analysis included two key components. First, a baseline flood risk assessment under current climate conditions and, secondly, a future flood risk projection for an average 1-in-100-year flood event, based on climate conditions projected for the year 2050.
By integrating multiple SSP scenarios, the approach captures a range of plausible futures, enhancing the robustness of flood risk estimates under climate change.
Execution methodology
To assess both flood and wildfire risks, participants overlaid their in-scope exposure data with standardized hazard data. The process involved four key steps. First, participants identified in-scope exposures by collecting data on the physical assets or collateral and their geographic locations. Second, they geocoded the address-level data into longitude-latitude coordinates. Third, they merged the exposure data with hazard datasets using these coordinates as the linking field. Finally, they aggregated the results by region, exposure type, LTV ratio, and other relevant dimensions. Since the geographic locations and hazard datasets differ significantly between flood and wildfire risks, they will be discussed separately in the subsections below.
Flood risk results
The flood risk analysis focuses on riverine (fluvial) and coastal floodingFootnote 14. Given the absence of high-quality, forward-looking flood data in the public domain, the SCSE partnered with a private vendor to fill this gap, Riskthinking.AI, to directly provide flood depth maps to financial institutions.
The flood module covered eleven urban regions in CanadaFootnote 15, each selected for their exposure to riverine flooding, and coastal flooding in the case of Vancouver. The module covered $904 billion in mortgage and real estate assets and $3 trillion in insured property values and together capture approximately 40% of mortgages in Canada.
Exposures in high-risk flood areas
Within this broader dataset, we analyzed the aggregate exposures concentrated in high-risk flood areas, defined as flood areas that exhibited a flood depth of 0.5m at the horizon of 2045 under the stochastic modeling approach. Concentrations in high-risk flood areas are similar across different types of institutions, ranging from 10% to 12%.
For the remainder of flood risk subsection, we focus on results for DTI and P&C insurers. Life insurers' exposures to physical risks through their mortgage portfolios are a relatively small proportion of their assets. The majority of mortgage insurance exposures are for underlying mortgages that are captured in DTI results.
Results by region
Geographic location is the most significant determinant of exposure to flood risk. While the overall concentration of exposures in high-risk zones is relatively consistent across institution types, regional differences are more pronounced, as shown on Figures 1 and 2Footnote 16. For example, while Vancouver and Montreal show higher absolute exposure volumes, Winnipeg and Fredericton show significantly higher concentration in high-risk flood areas.
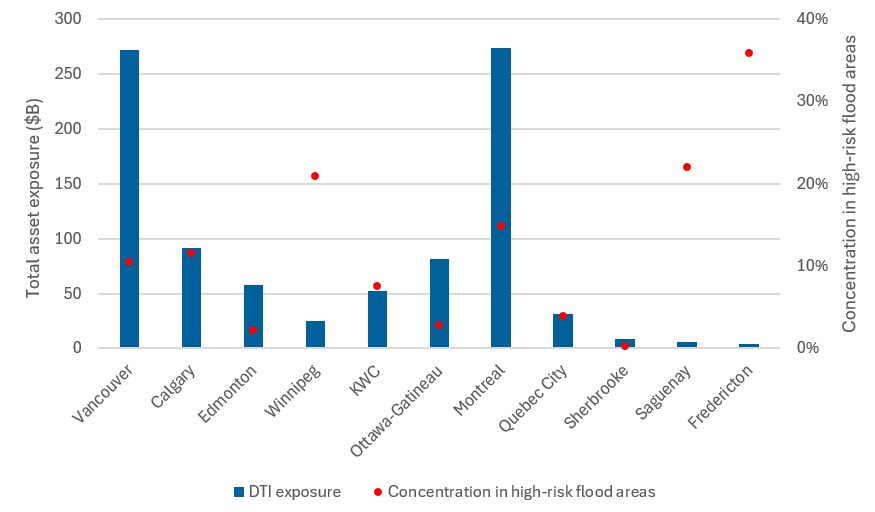
Figure 1 - Text version
| DTI exposure | Concentration in high-risk flood areas | |
|---|---|---|
| Vancouver | 272 | 10% |
| Calgary | 91 | 12% |
| Edmonton | 58 | 2% |
| Winnipeg | 25 | 21% |
| KWC | 52 | 8% |
| Ottawa-Gatineau | 81 | 3% |
| Montreal | 274 | 15% |
| Quebec City | 31 | 4% |
| Sherbrooke | 9 | 0% |
| Saguenay | 6 | 22% |
| Fredericton | 4 | 36% |
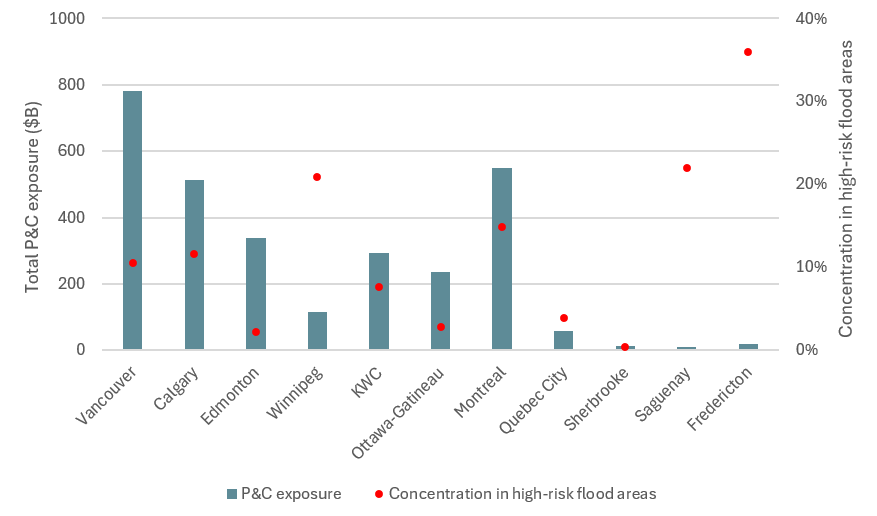
Figure 2 - Text version
| P&C exposure | Concentration in high-risk flood areas | |
|---|---|---|
| Vancouver | 783 | 11% |
| Calgary | 513 | 14% |
| Edmonton | 338 | 3% |
| Winnipeg | 117 | 27% |
| KWC | 294 | 3% |
| Ottawa-Gatineau | 236 | 7% |
| Montreal | 551 | 16% |
| Quebec City | 58 | 4% |
| Sherbrooke | 14 | 2% |
| Saguenay | 10 | 28% |
| Fredericton | 20 | 36% |
Importantly, Figures 3 and 4 reveal that within each region, the concentration of high-risk exposures varies significantly across institutions. Smaller DTIs and P&C insurers can have more than 50% of regional exposures in high-risk flood areas, indicating pockets of vulnerability that may not be visible in aggregate statistics. This variability underscores the importance of institution-specific risk assessments and the need for granular data to inform supervisory oversight.
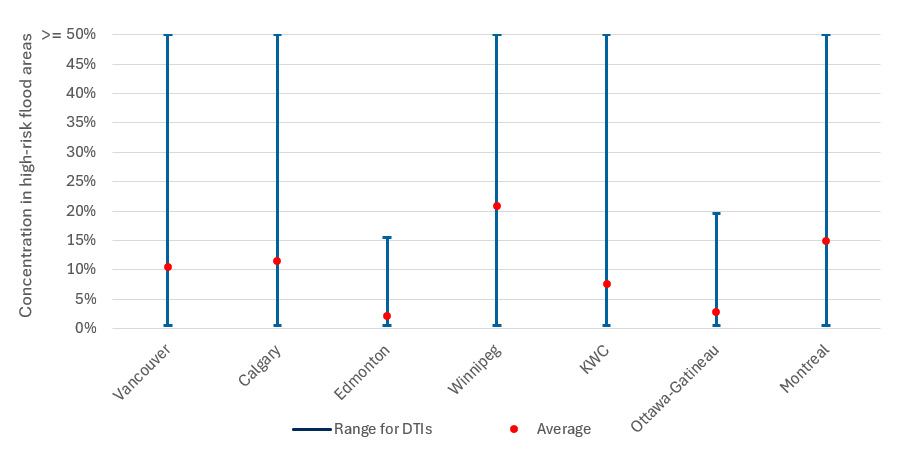
Figure 3 - Text version
| Vancouver | Calgary | Edmonton | Winnipeg | KWC | Ottawa-Gatineau | Montreal | |
|---|---|---|---|---|---|---|---|
| Min | 1% | 1% | 1% | 1% | 1% | 1% | 1% |
| Max | 52% | 100% | 16% | 61% | 56% | 20% | 75% |
| Average | 10% | 12% | 2% | 21% | 8% | 3% | 15% |
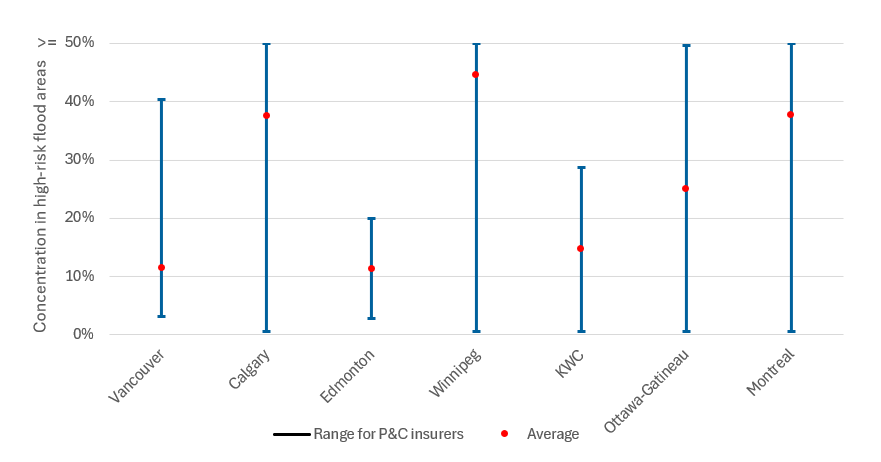
Figure 4 - Text version
| Vancouver | Calgary | Edmonton | Winnipeg | KWC | Ottawa-Gatineau | Montreal | |
|---|---|---|---|---|---|---|---|
| Min | 3% | 1% | 3% | 1% | 1% | 1% | 1% |
| Max | 40% | 75% | 20% | 89% | 29% | 50% | 75% |
| Average | 11% | 38% | 11% | 45% | 15% | 25% | 38% |
Further disaggregation by exposure type (Figures 5 and 6) shows that commercial exposures tend to be more concentrated in high-risk flood zones than residential exposures. This pattern holds across both DTIs and P&C insurers, and is particularly pronounced in Calgary, where commercial exposures are three times more likely to fall within high-risk flood areas compared to residential exposures. These findings suggest that commercial real estate portfolios may be more sensitive to flood risk, potentially due to location choices or asset characteristics.
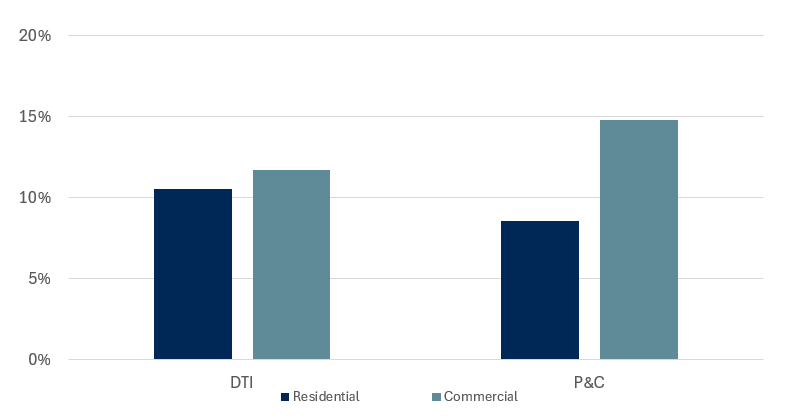
Figure 5 - Text version
| DTI | P&C | |
|---|---|---|
| Residential | 11% | 9% |
| Commercial | 12% | 15% |
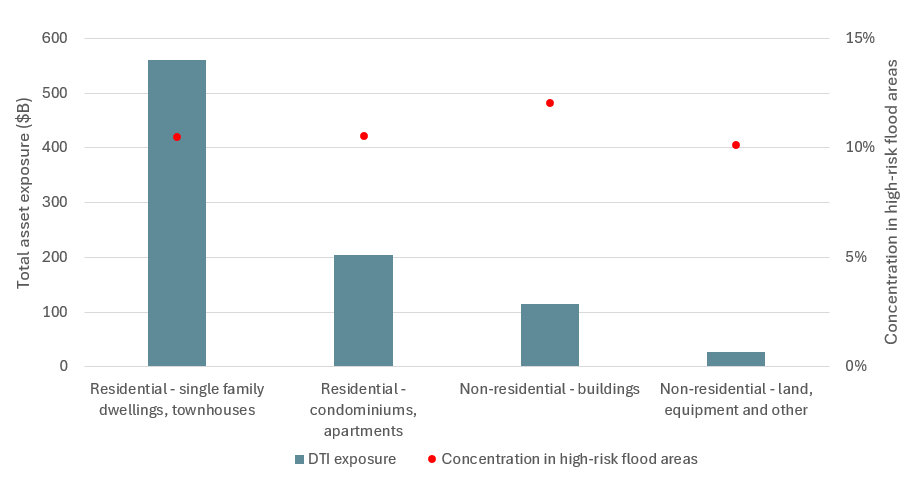
Figure 6 - Text version
| DTI exposure | Concentration in high-risk flood areas | |
|---|---|---|
| Residential - single family dwellings, townhouses | 561 | 10% |
| Residential - condominiums, apartments | 203 | 11% |
| Non-residential - buildings | 114 | 12% |
| Non-residential - land, equipment and other | 26 | 10% |
Together, these results highlight the importance of geographic and portfolio-level granularity in assessing flood-related vulnerabilities. They also point to the need for targeted supervisory engagement with institutions that exhibit elevated concentrations in high-risk areas, especially where those exposures intersect with high loan-to-value ratios or limited insurance coverage.
DTI results by LTV
LTV ratios are a key indicator of borrower vulnerability and credit risk. In the SCSE flood risk assessment, we examined how high-LTV mortgage exposures intersect with high-risk flood areas to better understand potential financial vulnerabilities for DTIs.
Borrowers with high LTV ratios – typically above 70% - have less equity in their properties, making them more susceptible to default in the face of a financial stressors such as catastrophic flooding, rising interest rates, or income losses. Moreover, mortgage insurance master agreementsFootnote 17 generally exclude coverage for "force majeure" events, including flood-related damages. As a result, lenders may face elevated LGD when flood-damaged properties lose resale value and become harder to liquidate.
Figure 7 shows the proportion of high-LTV lending exposures (LTV > 70%) and their concentration in high-risk flood areas. Each dot in this figure represents a participating DTI. Institutions with geographically diversified mortgage lending tend to show consistent concentrations in high-risk flood areas—typically between 9% to 11% for their high LTV segment. However, institutions with more geographically concentrated exposures exhibit a much wider range of results, with some showing up to 43% of their high-LTV exposures located in high-risk flood zones.
This variability highlights pockets of vulnerability within the financial system. Institutions with elevated concentrations of high-LTV mortgages in flood-prone areas may be underestimating credit risk, particularly if their models do not account for uninsured flood damage. These exposures are potentially mispriced, as losses from flooding are not covered by mortgage insurers and may not be reflected in standard credit risk assessments.
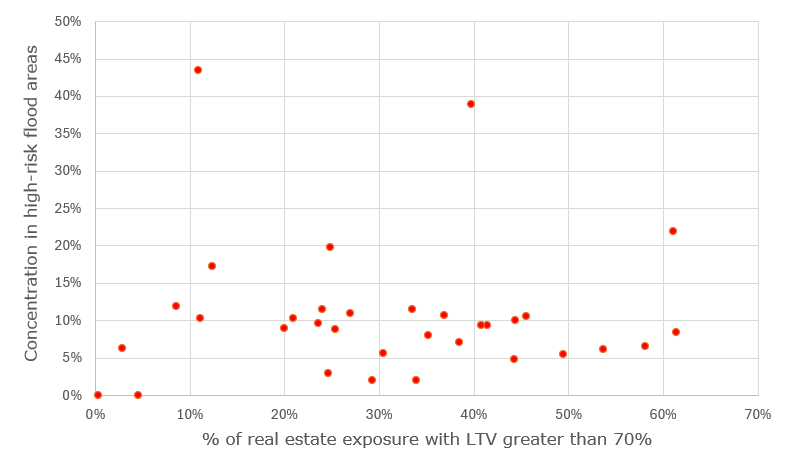
Figure 7 - Text version
| LTV greater than 70% | Concentration in high-risk flood areas |
|---|---|
| 24% | 10% |
| 27% | 11% |
| 44% | 10% |
| 25% | 9% |
| 20% | 9% |
| 24% | 11% |
| 41% | 9% |
| 46% | 11% |
| 61% | 8% |
| 9% | 12% |
| 37% | 11% |
| 21% | 10% |
| 38% | 7% |
| 3% | 6% |
| 25% | 3% |
| 44% | 5% |
| 33% | 12% |
| 58% | 7% |
| 5% | 0% |
| 35% | 8% |
| 25% | 20% |
| 49% | 5% |
| 11% | 43% |
| 12% | 17% |
| 30% | 6% |
| 0% | 0% |
| 40% | 39% |
| 11% | 10% |
| 34% | 2% |
| 54% | 6% |
| 29% | 2% |
| 61% | 22% |
| 41% | 9% |
Direct P&C insurers' use of reinsurance
Reinsurance plays a critical role in managing the financial exposure of P&C insurers to catastrophic events, including climate-related hazards such as floods. While the SCSE flood module did not capture detailed reinsurance arrangements at the contract level, participating insurers provided aggregate data on the proportion of total insured value (TIV) ceded to reinsurers.
The results reveal a wide spectrum of reinsurance practices across the industry. Approximately 70% of direct insurers reinsure less than 10% of their TIV, indicating a relatively low reliance on reinsurance to manage flood-related risks. In contrast, about 10% of insurers cede over 90% of their TIV, suggesting that reinsurance is central to their risk management strategies and business models.
This divergence underscores the importance of understanding institutional dependencies on reinsurance and the potential systemic implications of market shifts. Reinsurance contracts are typically renewed annually, and pricing is highly sensitive to recent catastrophic loss experience, reinsurer capital availability, and broader market conditions. As climate-related losses increase, insurers may face sustained upward pressure on reinsurance premiums, reduced coverage availability, or more restrictive terms—particularly for high-risk perils such as flooding, wildfires, and convective storms.
Institutions with low reinsurance coverage may be more exposed to volatility in claims costs. Those heavily reliant on reinsurance may face strategic and operational risks, if coverage becomes unaffordable or unavailable. These dynamics have implications not only for insurer solvency, but also for consumer protection, as reduced coverage could lead to gaps in insurability for properties in high-risk zones.
The SCSE findings highlight the need for supervisory attention to reinsurance dependency and stress testing of insurers' ability to absorb losses under adverse climate scenarios. Going forward, institutions should evaluate the resilience of their reinsurance strategies and consider how evolving climate risks may affect both availability and affordability of coverage.
Wildfire risk results
The wildfire risk module of the SCSE focused on evaluating financial institutions' exposure to wildfire hazards under changing climate conditions. Wildfire risk is driven by two primary factors: weather conditions, and fuel availability.
The module assessed areas with hot, dry, and windy conditions—climatic factors that significantly increase the likelihood of wildfire ignition and spread. To quantify these conditions, participating institutions used data from ClimateData.ca, a public portal managed by ECCC. This portal provides climate projections and indices relevant to wildfire risk.
A key metric used in the analysis was the Build-Up Index (BUI), which measures the temperature and dryness of the forest floor. BUI reflects how much fuel is available and how easily it can ignite. Higher BUI values indicate more intense and rapidly spreading fires. The BUI is a core component of the Canadian Forest Fire Weather Index (FWI) system, which integrates multiple weather variables to assess fire danger levels.Footnote 18
While weather conditions are essential, wildfires cannot occur without fuel—typically vegetation. The presence, type, and density of fuel sources are critical to determining actual wildfire risk. However, at the time of the SCSE, publicly available wildfire datasets did not include detailed fuel maps or vegetation data. This limitation meant that some areas with high fire weather indicators could be falsely flagged as high-risk, despite lacking the physical conditions necessary for fire ignition.
To mitigate this, the SCSE focused on large rural FSAs where both high BUI values and fuel availability were likely. These areas were selected to avoid false positives from urban or agricultural regions, such as large farming zones in the Prairies, where fire weather conditions may exist but fuel sources are minimal or absent.Footnote 19
Overview of results
The total in-scope exposure included $27 billion in mortgage and real estate assets from DTIs and $359B in TIV from P&C insurers.
For the purposes of assessment, we have defined BUI values of 90-110 as high risk and values of greater than 110 as very high risk. We defined these thresholds by considering Canada-wide BUI values. Generally, a BUI greater than 80 is recognized by the FWI system itself as a critical boundary. The rural regions included in the exercise were chosen to capture higher risk exposures.
Impact of a changing climate
To assess how wildfire risk may evolve under climate change, the SCSE compared current climate conditions to projections under the moderate RCP 4.5 scenario for the period 2041–2070. The analysis revealed a significant shift in exposure distributions toward higher risk categories.
For DTIs, the proportion of exposures in high or very high-risk wildfire zones is projected to increase from 16% under current conditions to 29% by 2050 (see Figure 8). This migration highlights the growing vulnerability of financial institutions to wildfire hazards, particularly in rural regions where both weather and fuel conditions align to create elevated risk.
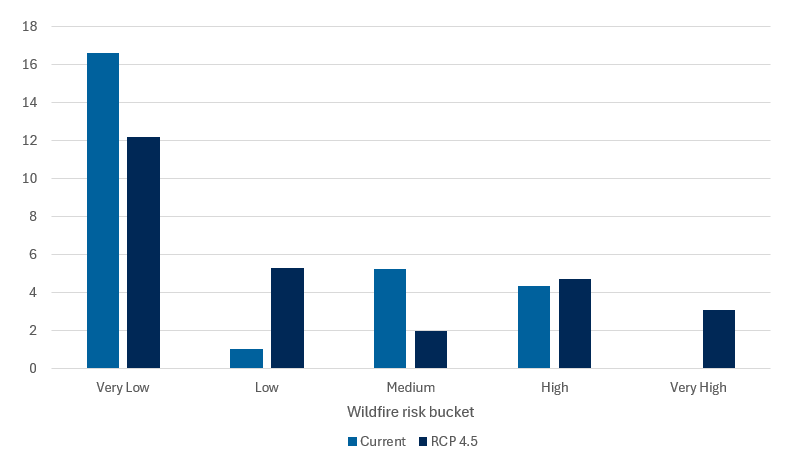
Figure 8 - Text version
| DTI | Very Low | Low | Medium | High | Very High |
|---|---|---|---|---|---|
| Current | 17 | 1 | 5 | 4 | 0 |
| RCP 4.5 | 12 | 5 | 2 | 5 | 3 |
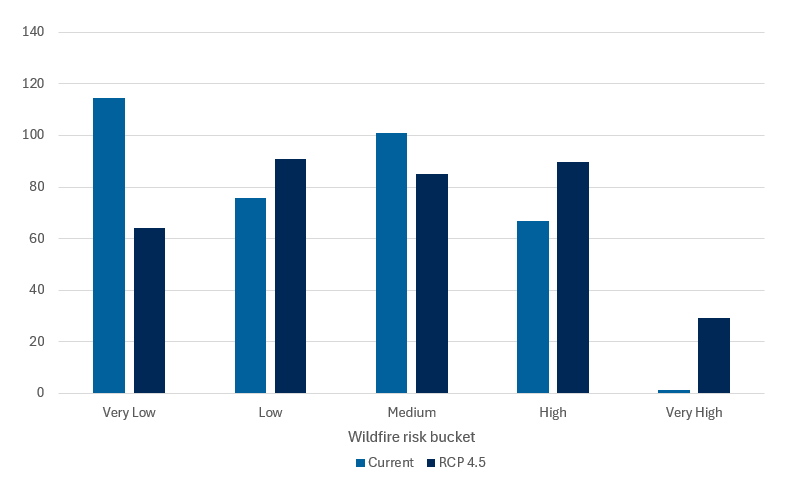
Figure 9 - Text version
| P&C | Very Low | Low | Medium | High | Very High |
|---|---|---|---|---|---|
| Current | 114 | 76 | 101 | 67 | 1 |
| RCP 4.5 | 64 | 91 | 85 | 90 | 29 |
Importantly, the increase in wildfire risk is not uniform across regions. For example, the concentration of DTI exposures in high-risk areas is projected to rise by a factor of 1.3 in Saskatoon, 2.5 in Northern Alberta, and 4.3 in the Northwest Territories (see Figure 10). These regional disparities underscore the importance of geospatial analysis in understanding climate-related vulnerabilities.
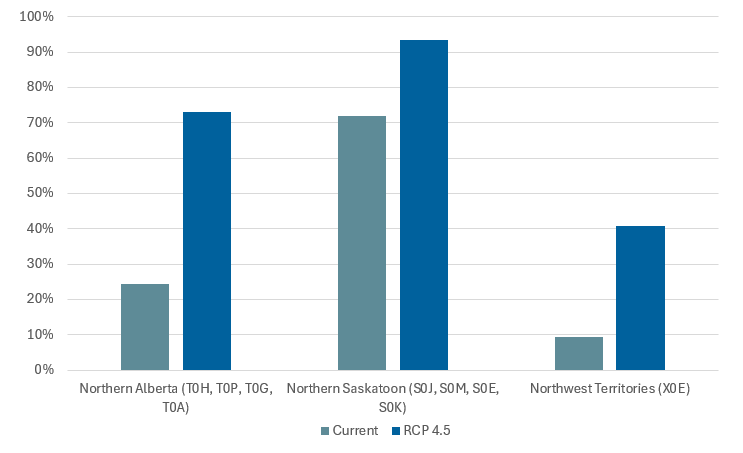
Figure 10 - Text version
| DTI | Current | RCP 4.5 |
|---|---|---|
| Northern Alberta (T0H, T0P, T0G, T0A) | 24% | 73% |
| Northern Saskatoon (S0J, S0M, S0E, S0K) | 72% | 94% |
| Northwest Territories (X0E) | 9% | 41% |
Physical risk: next steps for institutions
This SCSE provided a foundational perspective about institutional exposure to flood and wildfire hazards.
However, several areas for improvement were identified to support more robust risk quantification and management. Moving forward, we expect financial institutions to take the next steps in calculating financial risk metrics related to specific hazards that are relevant to their portfolios. This will require the development of robust and accurate damage functions that can translate flood depths or wildfire indices into monetary damages, as well as a methodology to convert these damage estimates into potential financial losses for financial institutions.
The exercise had geographical limitations. The flood risk assessment was confined to riverine and coastal flooding in eleven regions in Canada, while the wildfire analysis focused on seven non-urban areas. Financial institutions analyzing the physical risks affecting their portfolios will need to achieve comprehensive geographic coverage for their exposures. A thorough flood risk assessment should consider both pluvial (rain-related), fluvial (river-related), and coastal flooding.
For wildfire risk, incorporating fuel and vegetation data is a crucial area for enhancement. This would enable a comprehensive assessment across Canada, accurately identifying southern urban areas with high BUI numbers but limited fuel sources as low-risk locations.
Another area for improvement, particularly regarding wildfire risk, is to capture the broader impacts on the economies of affected regions, which can extend beyond the areas directly impacted by a wildfire. Including these second-order effects in economic and financial stability assessments is a complex challenge that represents an emerging area of research.
By addressing these gaps, financial institutions can move toward a more complete understanding of flood- and wildfire-related risks and enhance their resilience to climate-driven hazards.
Transition risk
Transition risks arise from the economic and financial consequences of the global shift toward a low-emission economy. They include impacts from climate policy changes, technological disruption, and changing consumer preferences. These dynamics can significantly alter the creditworthiness of borrowers and the value of financial assets.
The SCSE's transition risk module aimed to generate a standardized measurement of how such risks may affect Canadian financial institutions' commercial exposures. The exercise covered two core risk channels:
- Credit risk (via exposures in the banking book)
- Market risk (via traded instruments in the trading book)
It focused on the main types of commercial exposures, including commercial loans, corporate bonds, preferred shares, and common shares. Footnote 20
Transition risk scenarios
Climate transition risk is challenging to assess with traditional methods due to its forward-looking nature and uncertainties around future policy, technology, and socioeconomic developments. Scenario analysis offers a flexible tool to explore potential risks and opportunities through plausible pathways aimed at specific climate goals, without serving as forecasts or comprehensive predictions.Footnote 21
The analysis applied three distinct climate transition scenarios to their balance sheets:
- Below 2℃ – Immediate: Orderly transition scenario that assumes immediate policy action to limit average global warming to below 2℃ by 2100, relative to pre-industrial levels
- Below 2℃ – Delayed: Disorderly transition that assumes policy action begins in 2030 to achieve the same below 2℃ target by 2100
- Net-Zero 2050 (1.5℃): A more ambitious orderly transition scenario involving immediate policy action to limit warming to 1.5℃ by 2100, incorporating net-zero commitments from various economiesFootnote 22
These scenarios help financial institutions and businesses assess the potential risks and opportunities associated with the transition to a low-carbon economy.
Execution methodology
The scenarios were then used to define credit and market risk factors. To ensure comparability across financial institutions and reduce their modelling burden, the SCSE prescribed a set of standardized credit and market risk factors across:
- 25 industry sectorsFootnote 23
- 9 geographic jurisdictionsFootnote 24
- 6 credit quality bucketsFootnote 25
A total of 1,350 credit and market risk factors per scenario were applied to participating institutions' static balance sheet exposures between 2025 and 2050. A high-level description of the methodology and inputs used to develop these factors is provided in Appendix A.
All institutions mapped their exposures to these categories using SCSE guidance and OSFI's and AMF guidelinesFootnote 26 disclosure taxonomy, which aligns with the North American Industry Classification System (NAICS). In absence of information at the counterparty level, this mapping was used as a proxy for emissions intensity, stranded asset risk, and sensitivity to market shifts.
Results for both credit and market risks were aggregated by sector, region, credit quality, and asset class. For each group, participants reported total in-scope exposures along with current and climate-adjusted values, plus maturity and duration where relevant.
Credit Risk Methodology
This module collected exposure-at-default and projected lifetime losses, estimated by participants using their internal models to reflect their specific contexts. The credit risk module leveraged each institution's IFRS 9 lifetime Expected Credit Loss (ECL) methodology (see Box 1 for more details), adjusted for transition scenarios. Participants recalculated expected losses for each exposure by adjusting:
- Probability of Default (PD)
- Loss Given Default (LGD)
These adjustments were scenario-specific and tailored to sector, region, and credit quality. This approach ensured that the climate-adjusted credit losses estimates were comparable across institutions, while remaining relevant to each institution's internal practices.
Adjustments were performed at four time points: 2030, 2035, 2040, and 2045—allowing insights into short-, medium-, and long-term vulnerabilities.
Finally, to minimize the burden on participants, assets with exposures below $1.5 million were excluded from the module's scope.
Box 1. IFRS 9 Expected Credit Loss
IFRS 9 is a global accounting standard that improves financial reporting transparency by requiring the use of Expected Credit Loss (ECL) to measure credit risk. All SCSE participants apply this standard in their reporting.
Its forward-looking design makes IFRS 9 ECL well-suited for scenario analysis, including climate-related exercises. It enables institutions to estimate lifetime credit losses using projections for Probability of Default (PD) and Loss Given Default (LGD).
For the SCSE, participants used internally estimated lifetime ECLs as the baseline for all in-scope exposures. To reflect climate transition scenarios, OSFI and AMF developed adjustment factors across 25 sectors, nine jurisdictions, and six credit quality buckets. These were applied by institutions to modify PDs and LGDs, producing climate-adjusted ECLs.
The adjusted ECLs capture scenario impacts across three key dimensions:
- Industry classification: Reflects exposure to emissions, stranded assets, and market shifts
- Credit quality: Lower-rated counterparties are more vulnerable to climate shocks
- Maturity: Longer-term exposures face greater transition risks over time
Market Risk Methodology
The market risk module assessed the impact of transition scenarios on asset values in the trading book. Institutions applied market (valuation) factors to equities and corporate bonds, relative to a baseline of current policies. This enabled directional comparisons across institutions without requiring bespoke market risk modelling. See Box 2 for details.
Box 2. Market Risk
As countries adopt climate policies, transition drivers—like regulation, technology, and consumer behavior—can significantly affect asset valuations. The SCSE's market risk module explored these impacts across various transition scenarios, using the "current policies" scenario as a baseline. Ten FRFIs participated (six DSIBs, three IAIGs, one P&C insurer), and five AMF regulated financial institutions (one DTI, three life insurers and one P&C insurer).
Participants applied standardized SCSE risk factors to estimate market value changes, enabling consistent comparisons.Box 2 footnote * The focus was on directional insights rather than precise quantification.
- Scope: The analysis covered equities and corporate bonds in the trading book. To ease implementation, derivatives, segregated funds, and other climate-sensitive assets (e.g., FX, commodities, hedge funds, sovereign/municipal bonds) were excluded.
- Balance Sheet Assumption: A static balance sheet was assumed, which doesn't reflect the dynamic nature of trading books—highlighting areas for future improvement.
Despite limitations, the exercise provided valuable institutional insights. For example, IAIGs' treatment of corporate bonds clarified their exposures and improved comparability. The module also helped build capacity by requiring institutions to map exposures to detailed SCSE sectors, laying the foundation for more advanced future analyses.
Box 2 footnotes
- Box 2 footnote *
-
The strengths of the employed methodology were showcased in the following publication: Ruihua Qiao & Jun Yua, "Climate Transition Risk Case Study: Financial Impact Assessment Methodologies and Applications" (forthcoming).
Exposure Classification
Many key findings stemmed from the analysis of Transition-Vulnerable Sectors (TVS)—fossil fuels, energy-intensive industries, agriculture and forestry, and air and other transportation. These sectors face elevated transition risks and are prominent in institutional portfolios. Sectors likely to benefit or remain largely unaffected—such as renewable energy, hydroelectricity, electricity distribution, rail transport, and other industries—were excluded. TVS were central to the assessment due to their heightened exposure to climate-related transition impacts.
Credit Risk Outcomes
The credit risk module covered $3.5 trillion in exposures across 150+ institutions, capturing 29% of total balance sheet assets across all participating financial institutions (FI).
TVS accounted for roughly 17% of the total in-scope portfolio across participating institutions. While exposure levels varied, TVS remained a significant component of most portfolios. Notably, these exposures often had longer maturities—an important consideration given the exercise's static balance sheet assumption. This suggests that the financial system remains exposed to TVS over time, and that divesting or rebalancing these positions would likely be both operationally complex and financially costly.
A delayed transition leads to significantly higher costs than an orderly, early transition. Over the long term, lifetime losses were 43% higher in the delayed scenario, reflecting the financial impact of postponing action (see Figure 11). This is due to the need for more abrupt and costly adjustments to meet the same climate targets in a shorter timeframe.
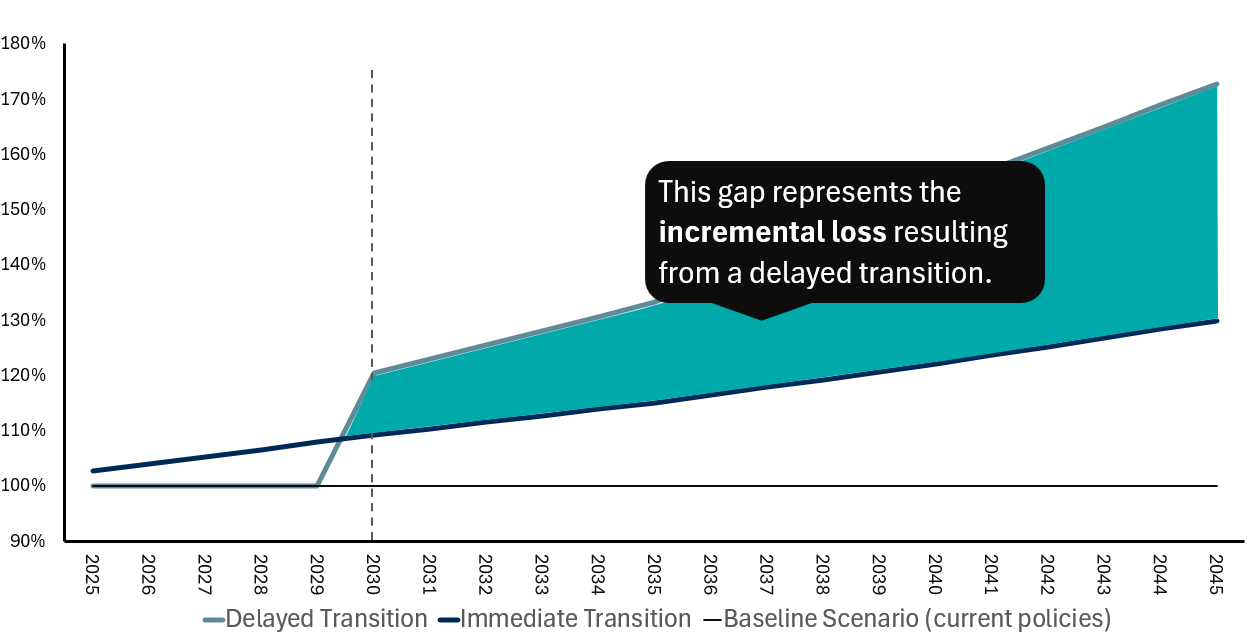
Figure 11 - Text version
| Year | Transition Scenario | ||
|---|---|---|---|
| Delayed Transition | Immediate Transition | Baseline Scenario (current policies) | |
| 2023 | 100% | 100% | 100% |
| 2024 | 100% | 101% | 100% |
| 2025 | 100% | 103% | 100% |
| 2026 | 100% | 104% | 100% |
| 2027 | 100% | 105% | 100% |
| 2028 | 100% | 107% | 100% |
| 2029 | 100% | 108% | 100% |
| 2030 | 120% | 109% | 100% |
| 2031 | 123% | 110% | 100% |
| 2032 | 125% | 111% | 100% |
| 2033 | 128% | 113% | 100% |
| 2034 | 131% | 114% | 100% |
| 2035 | 133% | 115% | 100% |
| 2036 | 137% | 116% | 100% |
| 2037 | 141% | 118% | 100% |
| 2038 | 145% | 119% | 100% |
| 2039 | 149% | 121% | 100% |
| 2040 | 154% | 122% | 100% |
| 2041 | 157% | 124% | 100% |
| 2042 | 161% | 125% | 100% |
| 2043 | 165% | 127% | 100% |
| 2044 | 169% | 128% | 100% |
| 2045 | 173% | 130% | 100% |
The impact of transition risk varies across institutions, driven by differences in portfolio composition and exposure to TVS.
Transition effects are also uneven across sectors. Each sector's vulnerability depends on its exposure to transition risks and its ability to adapt. Most of the increase in lifetime losses came from TVS, with the fossil fuel sector alone accounting for 83% of the total increase—despite representing just 7% of total exposures (see Figure 12).
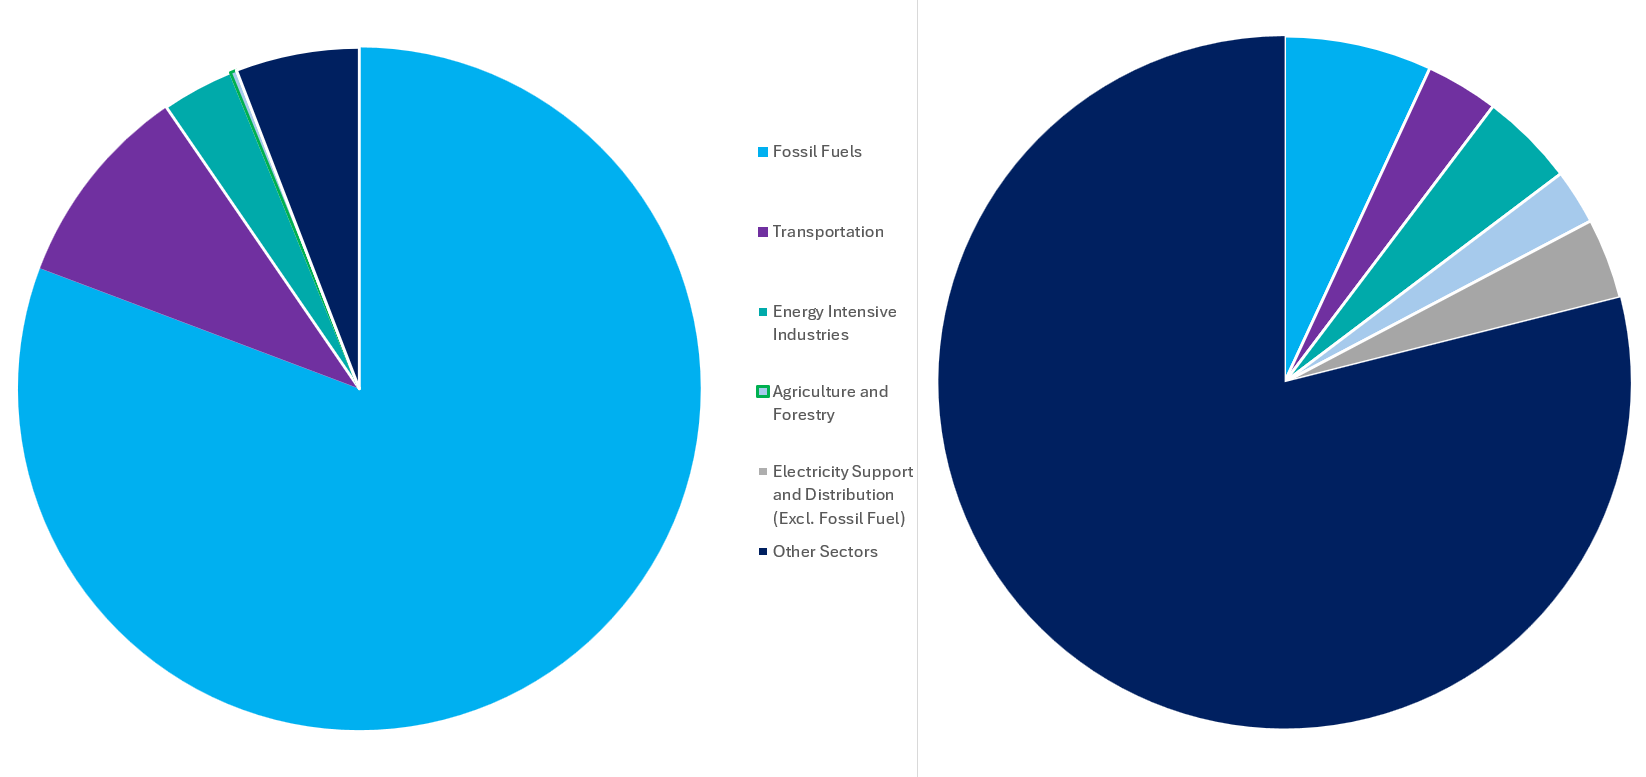
Figure 12 - Text version
| Both - All | Increase in losses | Exposure |
|---|---|---|
| Fossil Fuels | 83% | 246,658,561,107 |
| Transportation | 10% | 121,598,261,752 |
| Energy Intensive Industries | 4% | 157,564,547,006 |
| Agriculture and Forestry | 0% | 92,001,865,825 |
| Electricity Support and Distribution (Excl. Fossil Fuel) | 0% | 135,094,941,258 |
| Other Sectors | 6% | 2,822,107,801,568 |
Box 3. Interpreting Transition Results
The SCSE exercise provided a valuable foundation for assessing climate transition risks, but several methodological and design limitations suggest that the estimated losses likely understate the potential impacts of the underlying scenarios.
First, the scope of the analysis was restricted. Smaller exposures (below $1.5 million), sovereign bonds, loans to households which could be negatively affected by the transition, and other potentially sensitive assets were excluded, despite their materiality in some portfolios.
Second, the use of a static balance sheet assumption fails to reflect the dynamic nature of financial institutions' portfolios, particularly in trading books. This simplification overlooks how institutions might respond to evolving market conditions and significantly reduces the likelihood of fire-sale and other indirect impacts that have the potential of generating systemic risks.
Finally, the exercise focused solely on first-order transition impacts and did not account for physical climate risks or systemic second-order effects. These omissions are critical, especially in delayed transition scenarios where physical risks intensify. The interconnectedness of the financial system means that shocks can propagate widely, amplifying vulnerabilities.
Taken together, these constraints imply that the credit losses reported in the exercise likely represent a lower bound. A more complete and dynamic analysis would likely reveal greater potential losses and more nuanced risk exposures across institutions and sectors.
Next Steps for Financial Institutions
The SCSE exercise provided a foundational assessment of climate transition risks, offering institutions valuable insights into their exposures and relative positioning. Bilateral sharing of results enabled benchmarking against peers and supported internal capacity-building efforts. However, to move from foundational analysis to robust climate risk management, institutions are encouraged to enhance their methodologies and expand the scope of their assessments.
A key priority is refining exposure classification. Institutions should move beyond sector-level proxies and begin incorporating counterparty and asset-level emissions data to better capture transition risk. Strengthening scenario analysis capabilities—particularly by integrating credit and market risk perspectives—will also be essential for developing a more holistic view of climate-related vulnerabilities.
Expanding the scope of instruments included in climate risk assessments is another critical step. Derivatives, sovereign bonds, and other currently excluded exposures may carry significant transition risk and should be incorporated to improve completeness. Institutions are also encouraged to engage in system-wide stress testing that accounts for second-order effects and macro-financial feedback loops, which are currently underrepresented in most analyses.
By addressing these limitations, institutions can move toward more comprehensive and realistic assessments of climate transition risk—ultimately improving resilience and preparedness in the face of accelerating climate policy and market shifts.
Appendix: Transition risk methodology
The transition risk module considered three different scenarios, each of which captures different degrees of transition risks, namely, Below 2℃ immediate, Below 2℃ delayed scenario, and Net-zero 2050, to create SCSE climate factors. To develop the risk factors for each of these scenarios, we benchmarked these scenarios against a current policy scenario, which is the baseline scenario consistent with global climate policies currently in place. The SCSE did not require participants to work directly with climate scenarios. Instead, they applied the SCSE prescribed risk factors to their own internal assessments. In this appendix, we present an overview of how these factors were created.
OSFI and the AMF developed the SCSE transition risk factors using two independent but complementary implementations of scenario narratives. The following provides a high-level overview of the methodology. Figure 13 presents a conceptual illustration of these implementations.
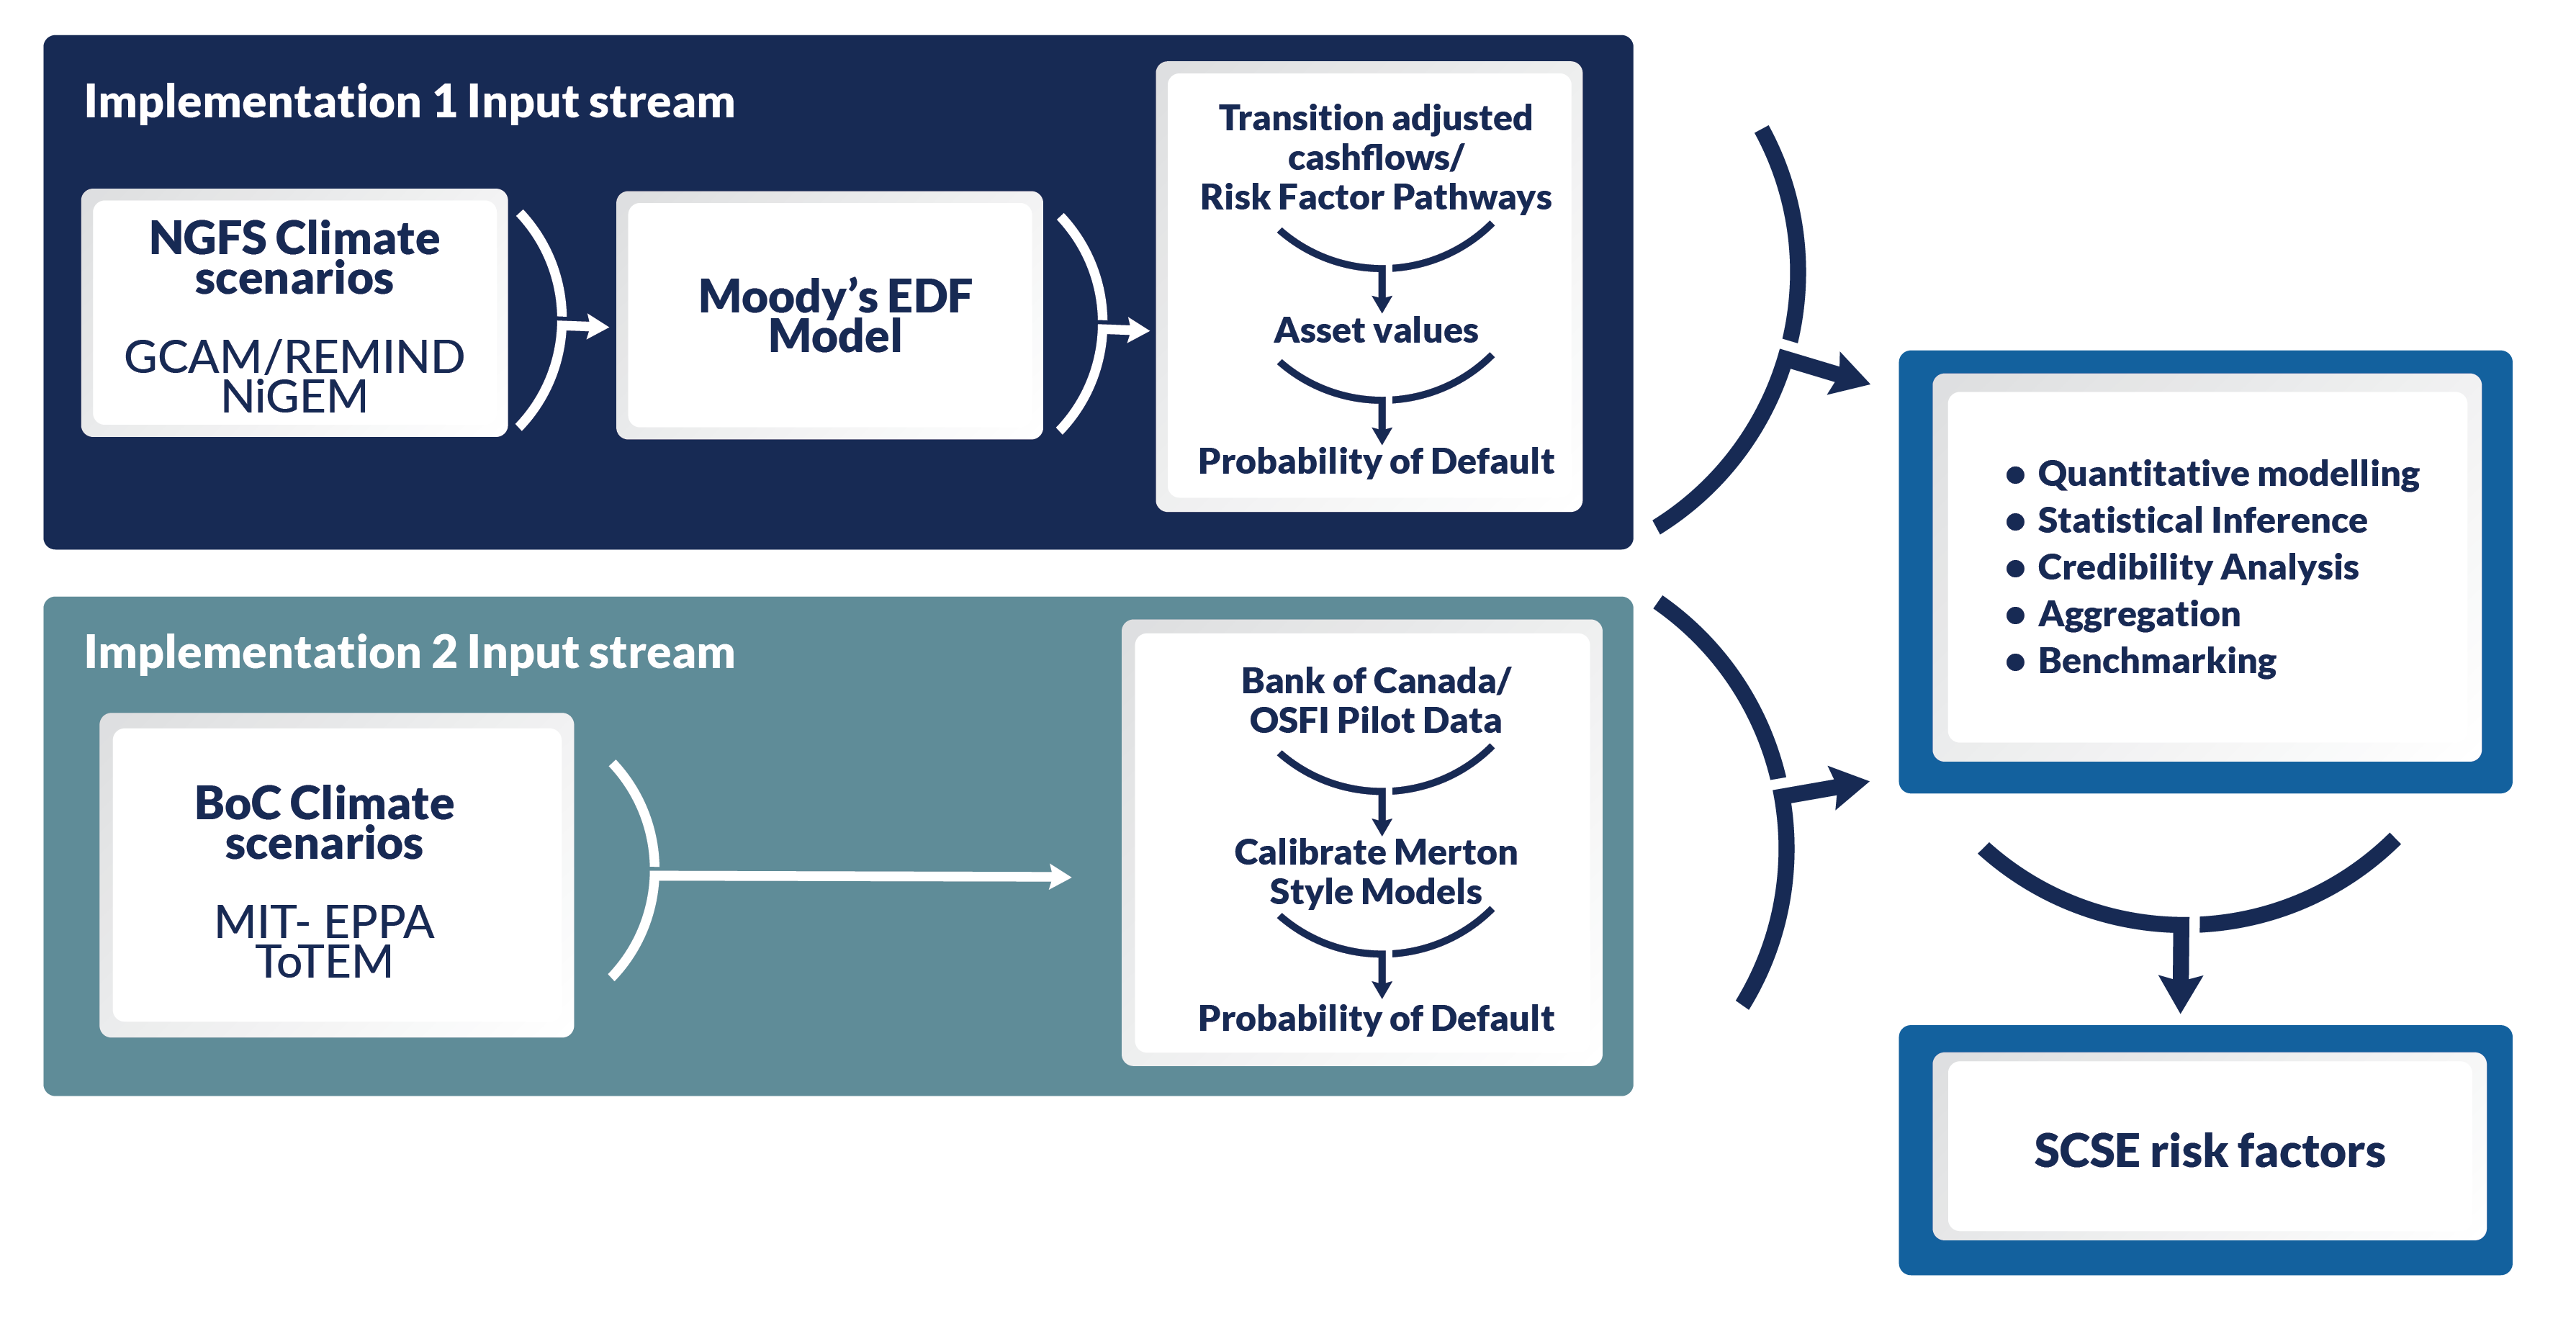
Figure 13 - Text version
-
NGFS Scenarios Implementation: For this implementation, we used scenario data developed by the Network for the Greening of the Financial System (NGFS), the international standard setter for climate scenario data—specifically, the NGFS Phase III scenarios. We utilized the macroeconomic narratives from these scenarios through two Integrated Assessment Models (IAMs): the Global Change Analysis Model (GCAM) and the Regional Model of Investments and Development (REMIND). GCAM was selected for its industrial granularity which made it a suitable model for SCSE, while REMIND was incorporated to enhance the integrity of the results and mitigate any shortcomings in the GCAM outputs.
These scenarios were used to project cash flows and default frequencies for a sample of more than 36,000 publicly traded entities worldwide for the interval of 2025 to 2050. To achieve this, we leveraged Moody's solution to generate forward-looking estimates for each entity.
Subsequently, after labeling the sample according to SCSE's industry and regional classifications, OSFI conducted statistical modeling to capture observed forecasts to create adjustment factors tailored to each industry, region, and credit quality bucket. These models were developed using generally accepted statistical inference methods—regression analysis for credit adjustments and credibility analysis for market shocks. These models were rigorously tested and demonstrated adequate performance.
- MIT/Bank of Canada Scenarios Implementation: This approach used transition scenarios developed by the Bank of Canada and MIT, tailored to the Canadian economy via the EPPA model. It builds on the 2021 BoC–OSFI Climate Scenario Pilot with updated data. Credit adjustments were derived using Merton-style models, calibrated with climate-related PDs from pilot participantsFootnote 27. These models transformed baseline PDs into scenario-adjusted values, applied to the updated BoC scenarios.
For each underlying transition scenario, the difference between the outputs of each implementation and those associated with the baseline scenario (i.e., current policies) resulted in a set of climate adjustment factors for each implementation. These adjustments, calculated for each industry sector and region, were further benchmarked against the narratives of the underlying scenarios, emissions data by sector and region, and the corresponding adjustments from the other implementation.
A cross-review was also conducted to ensure that the adjustments across different sectors and jurisdictions were relatively consistent and reasonable. The resulting adjustments for the 2025–2050 period was adopted as the SCSE adjustment factors and shared with participants.