Registered Pension Plans (RPP) and Other Types of Savings Plans – Coverage in Canada (2023)
The scope of this article is to present coverage in Canada by Registered Pension Plans (RPPs) and other savings vehicles that contribute to retirement wealth. To this end, Registered Retirement Savings Plans (RRSPs), Tax-Free Savings Accounts (TFSAs), and First Home Savings Accounts (FHSAs) are included. Although the FHSA’s primary purpose is to facilitate home ownership rather than generate retirement income, it is presented alongside RRSPs and TFSAs to acknowledge its role as a tax-assisted savings option and to recognize that home ownership is an important component of retirement wealth. In practice, individuals often consider these accounts together when determining how to allocate their personal savings.
RPP By Number
The total number of active RPP members increased steadily from 5.2 million in 1993, to 6.2 million in 2013, and to 7.2 million in 2023.
In 2023, women accounted for 51% of the 7.2 million active RPP members. Although women’s share of RPP membership has grown over time, the pace of growth has slowed in the last twenty years. In 1993, 42% (2.2 million) of active RPP members were women. This proportion increased to 47% (2.6 million) in 2003, rose to 50% (3.1 million) in 2013, and reached 51% (3.7 million) in 2023.
RPP Coverage by Number of Employees
Although the number of active RPP members has increased since 1998, the number of employees has grown at a faster pace. As presented in the chart below, the proportion of employees covered by a RPP decreased from 45% in 1993 to 38% in 2013 and has remained at 38% in 2023. The main exception occurred in 2020, when coverage temporarily increased due to a decline in the number of employees caused by the Covid-2019 pandemic.
As a proportion of employees, the coverage for women has been higher than the coverage for men since 2004.
Chart 1: Evolution of RPP Coverage as a Percentage of Employees
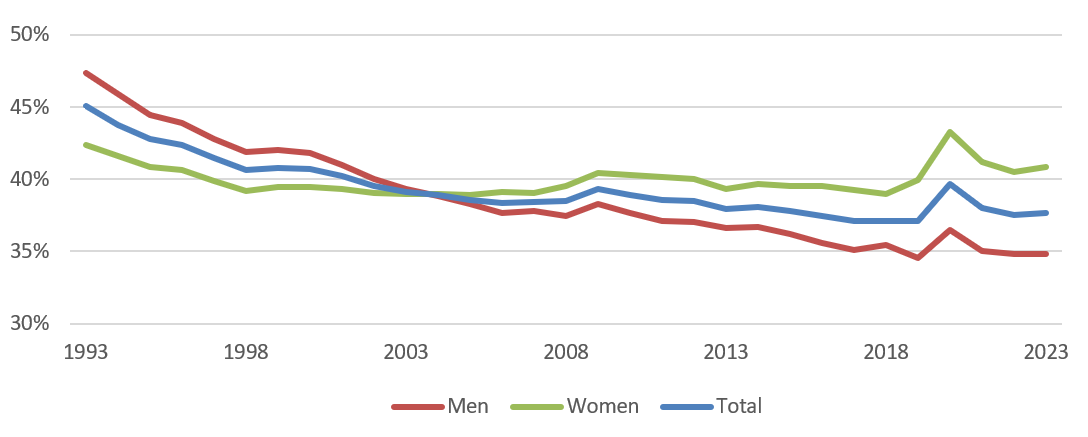
Chart 1 - Text version
| Year | Men | Women | Total |
|---|---|---|---|
| 1993 | 47.4% | 42.4% | 45.1% |
| 1994 | 46.0% | 41.6% | 43.8% |
| 1995 | 44.5% | 40.9% | 42.8% |
| 1996 | 43.9% | 40.6% | 42.4% |
| 1997 | 42.8% | 39.9% | 41.5% |
| 1998 | 41.9% | 39.2% | 40.6% |
| 1999 | 42.0% | 39.4% | 40.8% |
| 2000 | 41.9% | 39.5% | 40.8% |
| 2001 | 41.0% | 39.4% | 40.2% |
| 2002 | 40.0% | 39.1% | 39.6% |
| 2003 | 39.3% | 39.0% | 39.2% |
| 2004 | 38.9% | 39.0% | 38.9% |
| 2005 | 38.3% | 38.9% | 38.6% |
| 2006 | 37.7% | 39.1% | 38.4% |
| 2007 | 37.8% | 39.0% | 38.4% |
| 2008 | 37.5% | 39.6% | 38.5% |
| 2009 | 38.3% | 40.5% | 39.4% |
| 2010 | 37.7% | 40.3% | 39.0% |
| 2011 | 37.1% | 40.2% | 38.6% |
| 2012 | 37.0% | 40.1% | 38.5% |
| 2013 | 36.6% | 39.4% | 37.9% |
| 2014 | 36.7% | 39.7% | 38.1% |
| 2015 | 36.2% | 39.5% | 37.8% |
| 2016 | 35.6% | 39.5% | 37.5% |
| 2017 | 35.1% | 39.3% | 37.1% |
| 2018 | 35.4% | 39.0% | 37.1% |
| 2019 | 34.5% | 40.0% | 37.1% |
| 2020 | 36.5% | 43.3% | 39.7% |
| 2021 | 35.0% | 41.2% | 38.0% |
| 2022 | 34.8% | 40.5% | 37.5% |
| 2023 | 34.8% | 40.9% | 37.7% |
RPP Coverage by Sector of Activity
The charts below summarize the change of RPP coverage of Canadian employees by sector of activity between 1993 and 2023.
Chart 2: Distribution of Employees by Sector and RPP Coverage
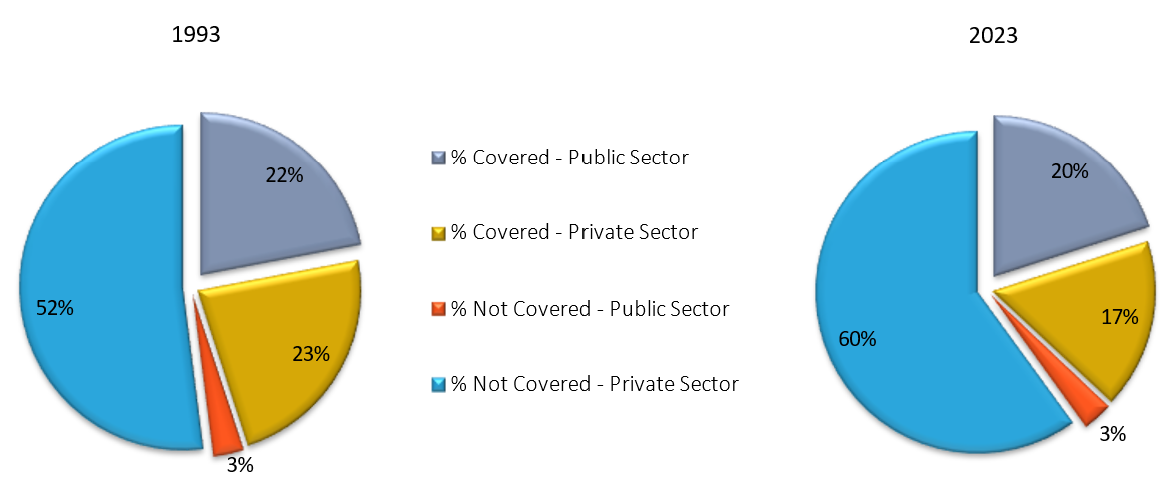
Chart 2 - Text version
| By Sector of Activity | 1993 | 2023 |
|---|---|---|
| % Covered - Public Sector | 22.0% | 20.0% |
| % Covered - Private Sector | 23.0% | 17.0% |
| % Not Covered - Public Sector | 3.0% | 3.0% |
| % Not Covered - Private Sector | 52.0% | 60.0% |
RPP By Type of Plan – Defined Benefit Plan, Defined Contribution Plan and Other Plans
The proportion of active RPP members in Defined Benefit (DB) plans has declined from 89% in 1993 to 68% in 2023. Chart 3 presents the evolution of the DB coverage for active RPP members in the public and private sectors during this period. It shows that the reduction in DB plan coverage has been more significant for private sector employees.
Chart 3: Proportion of Active RPP Members Covered by DB plans
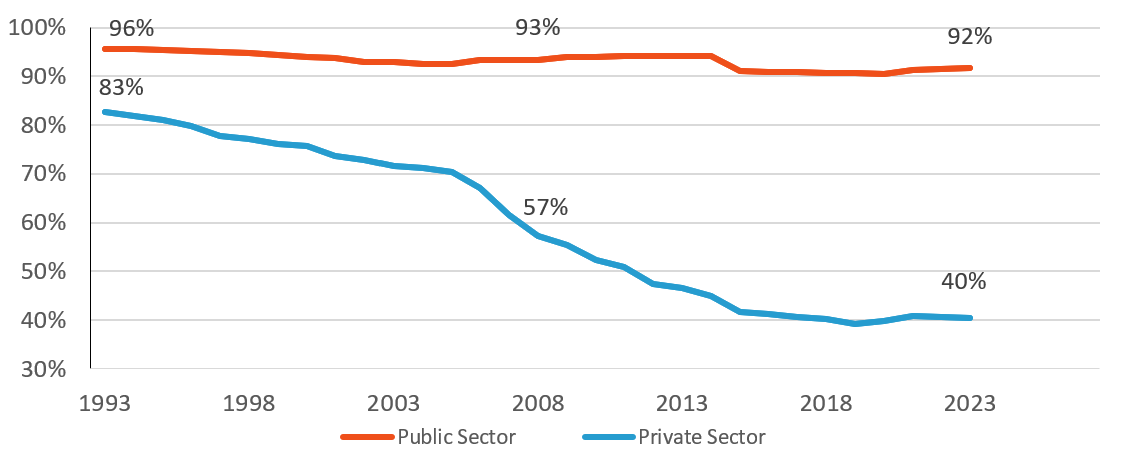
Chart 3 - Text version
| Year | Public | Private |
|---|---|---|
| 1993 | 95.7% | 82.7% |
| 1994 | 95.7% | 81.8% |
| 1995 | 95.5% | 81.1% |
| 1996 | 95.1% | 79.8% |
| 1997 | 95.0% | 77.8% |
| 1998 | 94.7% | 77.2% |
| 1999 | 94.4% | 76.1% |
| 2000 | 94.0% | 75.7% |
| 2001 | 93.7% | 73.6% |
| 2002 | 93.0% | 72.9% |
| 2003 | 92.9% | 71.6% |
| 2004 | 92.5% | 71.2% |
| 2005 | 92.5% | 70.4% |
| 2006 | 93.4% | 67.1% |
| 2007 | 93.3% | 61.6% |
| 2008 | 93.4% | 57.2% |
| 2009 | 94.0% | 55.4% |
| 2010 | 94.1% | 52.3% |
| 2011 | 94.1% | 50.8% |
| 2012 | 94.2% | 47.4% |
| 2013 | 94.3% | 46.6% |
| 2014 | 94.3% | 44.9% |
| 2015 | 91.0% | 41.8% |
| 2016 | 91.0% | 41.2% |
| 2017 | 90.8% | 40.7% |
| 2018 | 90.7% | 40.3% |
| 2019 | 90.7% | 39.2% |
| 2020 | 90.6% | 39.8% |
| 2021 | 91.2% | 40.8% |
| 2022 | 91.5% | 40.7% |
| 2023 | 91.6% | 40.4% |
Since 2004, there has been a trend whereby employers, particularly those in the private sector, have been either establishing new Defined Contribution (DC) plan or converting existing DB plan to either a DC or another type of plan. These other types of plans include plans with DB and DC components, target benefit or shared-risk plans, and any other types of hybrid plans. The number of active members in these other types of plans increased from 179,000 in 2004 to 963,000 in 2023, where in 2023 85% of these members were private sector employees. Chart 4 shows the changes in RPP coverage for private sector employees by plan type since 1993.
Chart 4: Coverage by Pension Plan Type – Private Sector
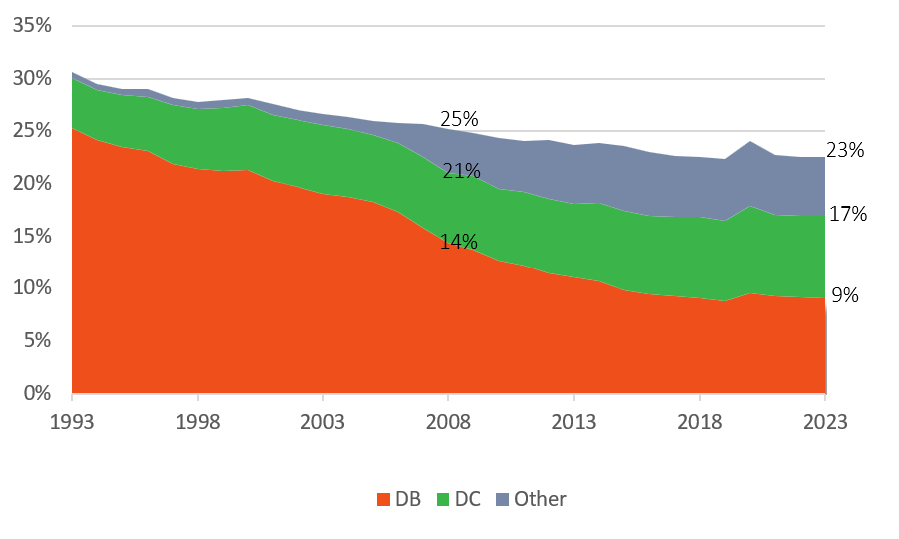
Chart 4 - Text version
| Coverage year | DB | DC | Other |
|---|---|---|---|
| 1993 | 25.3% | 4.8% | 0.6% |
| 1994 | 24.2% | 4.8% | 0.6% |
| 1995 | 23.6% | 4.9% | 0.6% |
| 1996 | 23.1% | 5.1% | 0.7% |
| 1997 | 21.9% | 5.6% | 0.6% |
| 1998 | 21.4% | 5.7% | 0.6% |
| 1999 | 21.3% | 6.0% | 0.7% |
| 2000 | 21.3% | 6.2% | 0.6% |
| 2001 | 20.3% | 6.2% | 1.1% |
| 2002 | 19.7% | 6.3% | 1.0% |
| 2003 | 19.1% | 6.5% | 1.1% |
| 2004 | 18.8% | 6.4% | 1.2% |
| 2005 | 18.3% | 6.4% | 1.3% |
| 2006 | 17.3% | 6.5% | 2.0% |
| 2007 | 15.8% | 6.7% | 3.1% |
| 2008 | 14.4% | 6.6% | 4.2% |
| 2009 | 13.8% | 6.9% | 4.2% |
| 2010 | 12.7% | 6.8% | 4.8% |
| 2011 | 12.3% | 7.0% | 4.9% |
| 2012 | 11.5% | 7.1% | 5.6% |
| 2013 | 11.1% | 7.1% | 5.6% |
| 2014 | 10.7% | 7.5% | 5.6% |
| 2015 | 9.8% | 7.6% | 6.1% |
| 2016 | 9.5% | 7.5% | 6.0% |
| 2017 | 9.2% | 7.6% | 5.8% |
| 2018 | 9.1% | 7.8% | 5.7% |
| 2019 | 8.8% | 7.8% | 5.9% |
| 2020 | 9.6% | 8.3% | 6.2% |
| 2021 | 9.3% | 7.8% | 5.7% |
| 2022 | 9.2% | 7.8% | 5.6% |
| 2023 | 9.1% | 7.9% | 5.6% |
Furthermore, the proportion of active RPP members participating in a contributory pension plan increased from 75% in 2003, to 85% in 2013, and 90% in 2023. The shift from non-contributory to contributory plans occurred during the same period when DB plans were converted into other types of plans.
Estimation of Other Types of Tax-Assisted Plans Offered by Employers
In 2023, there were 7.2 million active RPP members, which represented 34% of the labour force and 38% of employees.
Based on the 2023 Survey of Financial Security, an additional 2.5 million individuals participated in an employer-sponsored Group Registered Retirement Savings Plan (RRSP) and/or a Deferred Profit-Sharing Plan (DPSP) and were not active members of a RPP. As a result, employer-sponsored tax-assisted plans coverage rates are 45% of the labour force and 51% of employees.
Assuming that all 2.5 million individuals are in the private sector, the theoretical 2023 coverage rate for employees in the private sector would increase from 23% to 39%.
Registered Retirement Savings Plans (RRSP)
Although the number of RRSP contributors remained stable throughout the 2010s, recent data shows a reversal of this trend. The number of contributors increased from 5.9 million in 2019 to 6.4 million in 2023. However, because the total number of tax filers grew at a faster rate, the proportion of tax filers who contributed to an RRSP declined from 24% in 2010 to 21% in 2023.
At the same time, the average annual contributions to an RRSP increased by an average of 3.4% per year between 2013 and 2023, going from $6,281 to $8,777. By comparison, the inflation during this period averaged 2.5% per year.
Tax Free Savings Account (TFSA)
As of the end of 2023, there were 18.4 million TFSA holders, which represents an increase of 7.7 million since 2013. During this period, the proportion of tax filers holding a TFSA increased from 42% to 62%.
The total contributions in TFSA’s increased from $40 billion in 2013 to $107 billion in 2023. The average annual contributions per tax filers increased from $5,938 to $10,520 over the same decade.
First Home Savings Account (FHSA)
This new savings vehicle offers an additional tax-incentive option alongside RRSPs and TFSAs.
Canadians can contribute to a FHSA since April 1, 2023. In its first year of availability, approximately 485,000 tax fillers contributed to an FHSA for a total of $2.9 billion, with a median contribution of $8,000 (the annual maximum).
Charts 5 and 6 show the proportion of tax filers who contributed to an RRSP, a TFSA, or a FHSA by age group and by total income class in 2023, while Chart 7 shows the evolution of total contributions for RRSP, TFSA, and FHSA for the last ten years.
Chart 5: Proportion of Tax filers who Contributed to a RRSP, TFSA, or a FHSA by Age Group – 2023
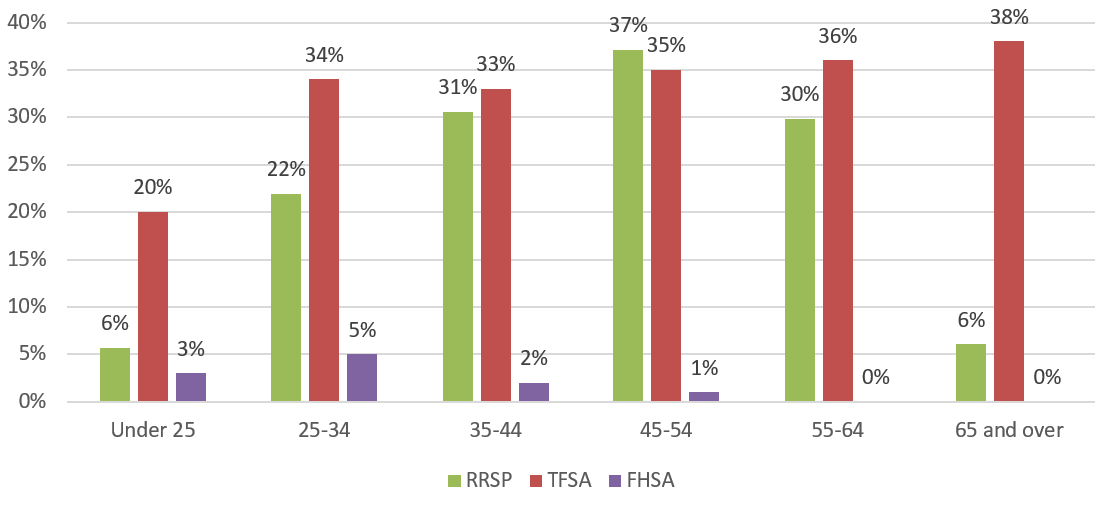
Chart 5 - Text version
| Age Groups | RRSP | TFSA | FHSA |
|---|---|---|---|
| Under 25 | 5.7% | 19.8% | 2.9% |
| 25-34 | 21.9% | 34.4% | 5.1% |
| 35-44 | 30.6% | 33.3% | 1.6% |
| 45-54 | 37.1% | 35.1% | 0.5% |
| 55-64 | 29.9% | 35.9% | 0.1% |
| 65 and over | 6.1% | 38.0% | 0.0% |
Over the last decade, RRSP participation either declined or remained unchanged across all age groups, with an overall average of 21% of tax filers contributing in 2023 compared to 23% in 2013. In contrast, TFSA participation moved in the opposite direction, with every age group increasing its share of contributors, bringing the overall average to 34% in 2023, up from 27% in 2013.
Chart 6: Proportion of Tax filers who Contributed to a RRSP, TFSA, or a FHSA by Income Class – 2023
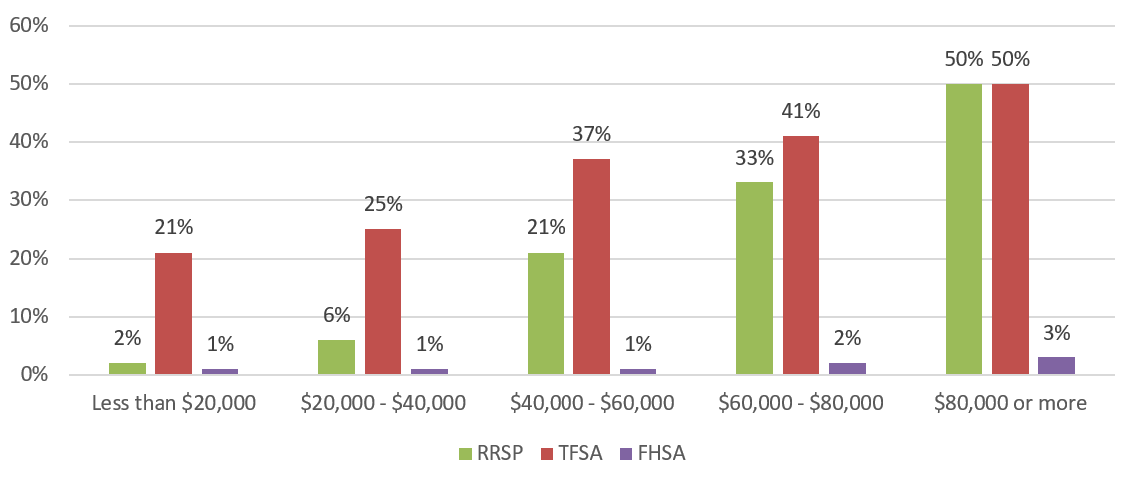
Chart 6 - Text version
| Total income class | RRSP | TFSA | FHSA |
|---|---|---|---|
| Less than $20,000 | 1.8% | 21.0% | 0.5% |
| $20,000 - $40,000 | 6.2% | 24.9% | 0.9% |
| $40,000 - $60,000 | 21.2% | 36.6% | 1.4% |
| $60,000 - $80,000 | 32.6% | 40.6% | 1.5% |
| $80,000 or more | 49.8% | 50.0% | 2.8% |
Over the last decade, RRSP participation declined across all income class. In contrast, TFSA participation generally increased across income classes, except for the $20,000–$40,000 income class, which saw a slight decrease.
Chart 7: Evolution of contributions to RRSP, TFSA, and FHSA over the last ten years
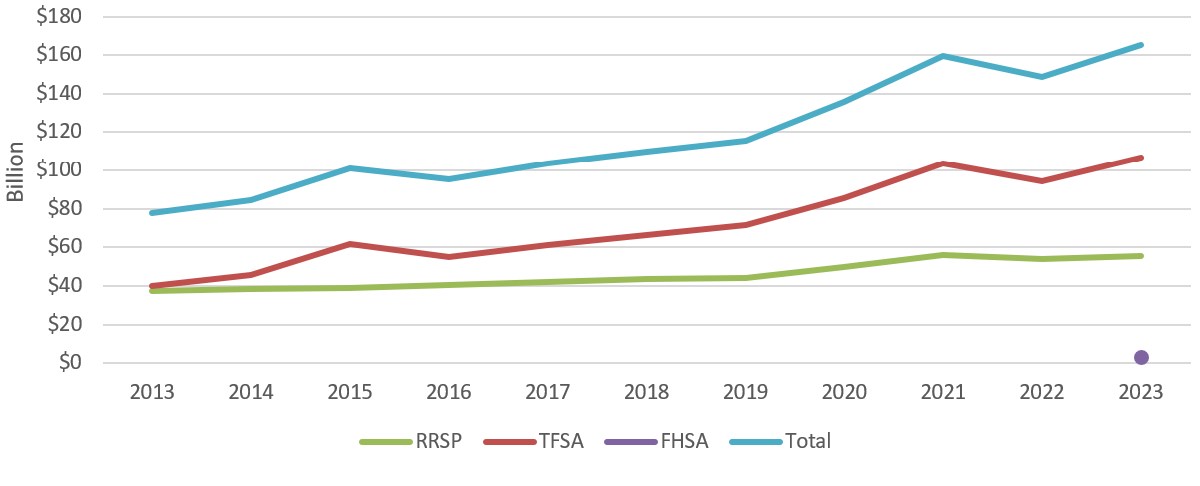
Chart 7 - Text version
| Year | RRSP | TFSA | FHSA | Total |
|---|---|---|---|---|
| 2013 | $ 37,419,255,000 | $ 40,163,568,000 | no data | $ 77,582,823,000 |
| 2014 | $ 38,613,965,000 | $ 45,836,554,000 | no data | $ 84,450,519,000 |
| 2015 | $ 39,185,200,000 | $ 61,925,669,000 | no data | $ 101,110,869,000 |
| 2016 | $ 40,394,515,000 | $ 54,831,843,000 | no data | $ 95,226,358,000 |
| 2017 | $ 42,005,710,000 | $ 61,447,657,000 | no data | $ 103,453,367,000 |
| 2018 | $ 43,502,385,000 | $ 66,583,295,000 | no data | $ 110,085,680,000 |
| 2019 | $ 44,268,370,000 | $ 71,474,012,000 | no data | $ 115,742,382,000 |
| 2020 | $ 50,053,300,000 | $ 85,620,810,000 | no data | $ 135,674,110,000 |
| 2021 | $ 56,137,560,000 | $ 103,440,067,000 | no data | $ 159,577,627,000 |
| 2022 | $ 54,217,110,000 | $ 94,345,879,000 | no data | $ 148,562,989,000 |
| 2023 | $ 55,734,780,000 | $ 106,625,110,000 | $ 2,886,650,000 | $ 165,246,540,000 |
Since 2013, TFSA accounts consistently received more contributions than RRSP accounts, and the gap has continued to widen. Between 2013 and 2023, total TFSA contributions grew by 165%, compared to 50% increase for RRSP contributions.
Conclusion
The number of active RPP members has increased since the beginning of the century, with the number of women increasing faster than the number of men. Despite this, the number of active RPP members as a percentage of employees has decreased. The proportion of active RPP members in DB plans has seen the steepest decrease, particularly in the private sector.
Rising contributions to tax-incentive vehicles reflect taxpayers’ sustained interest in these options. Over the last decade, TFSAs have become the preferred option, capturing a growing share of contributions, while RRSPs have declined.
Source of Information
- Various Statistics Canada data tables;
- Information provided by the Income, Pensions and Wealth Division, Statistics Canada; and,
- Canada Revenue Agency TFSA statistics.
Contact Information
For more information about the Office of the Chief Actuary or the Office of the Superintendent of Financial Institutions Canada, please
- Visit our Web site at osfi-bsif.gc.ca, or
- Toll-Free line: 1-800-385-8647
- Local calls (Ottawa and Gatineau): (613) 943-3950