Loan-to-income limits for uninsured mortgage portfolios
Financial institutions are required to manage the volume of newly originated uninsured mortgage loans that exceed a 4.5x loan-to-income multiple. This supervisory measure is called a loan-to-income (LTI) limit.
Why LTI limits are important
High household debt affects the safety and soundness of financial institutions and the overall stability of Canada’s financial system. LTI limits promote financial resilience by guarding against buildups of highly leveraged borrowers within mortgage portfolios.
As seen in 2020 to 2021, low interest rates increased borrowing capacity and put upward pressure on home prices. This resulted in borrowers taking on larger loans relative to their incomes. LTI limits would have tempered these buildups in highly leveraged mortgage origination volumes, and in turn, reduced credit risk to financial institutions’ mortgage portfolios.
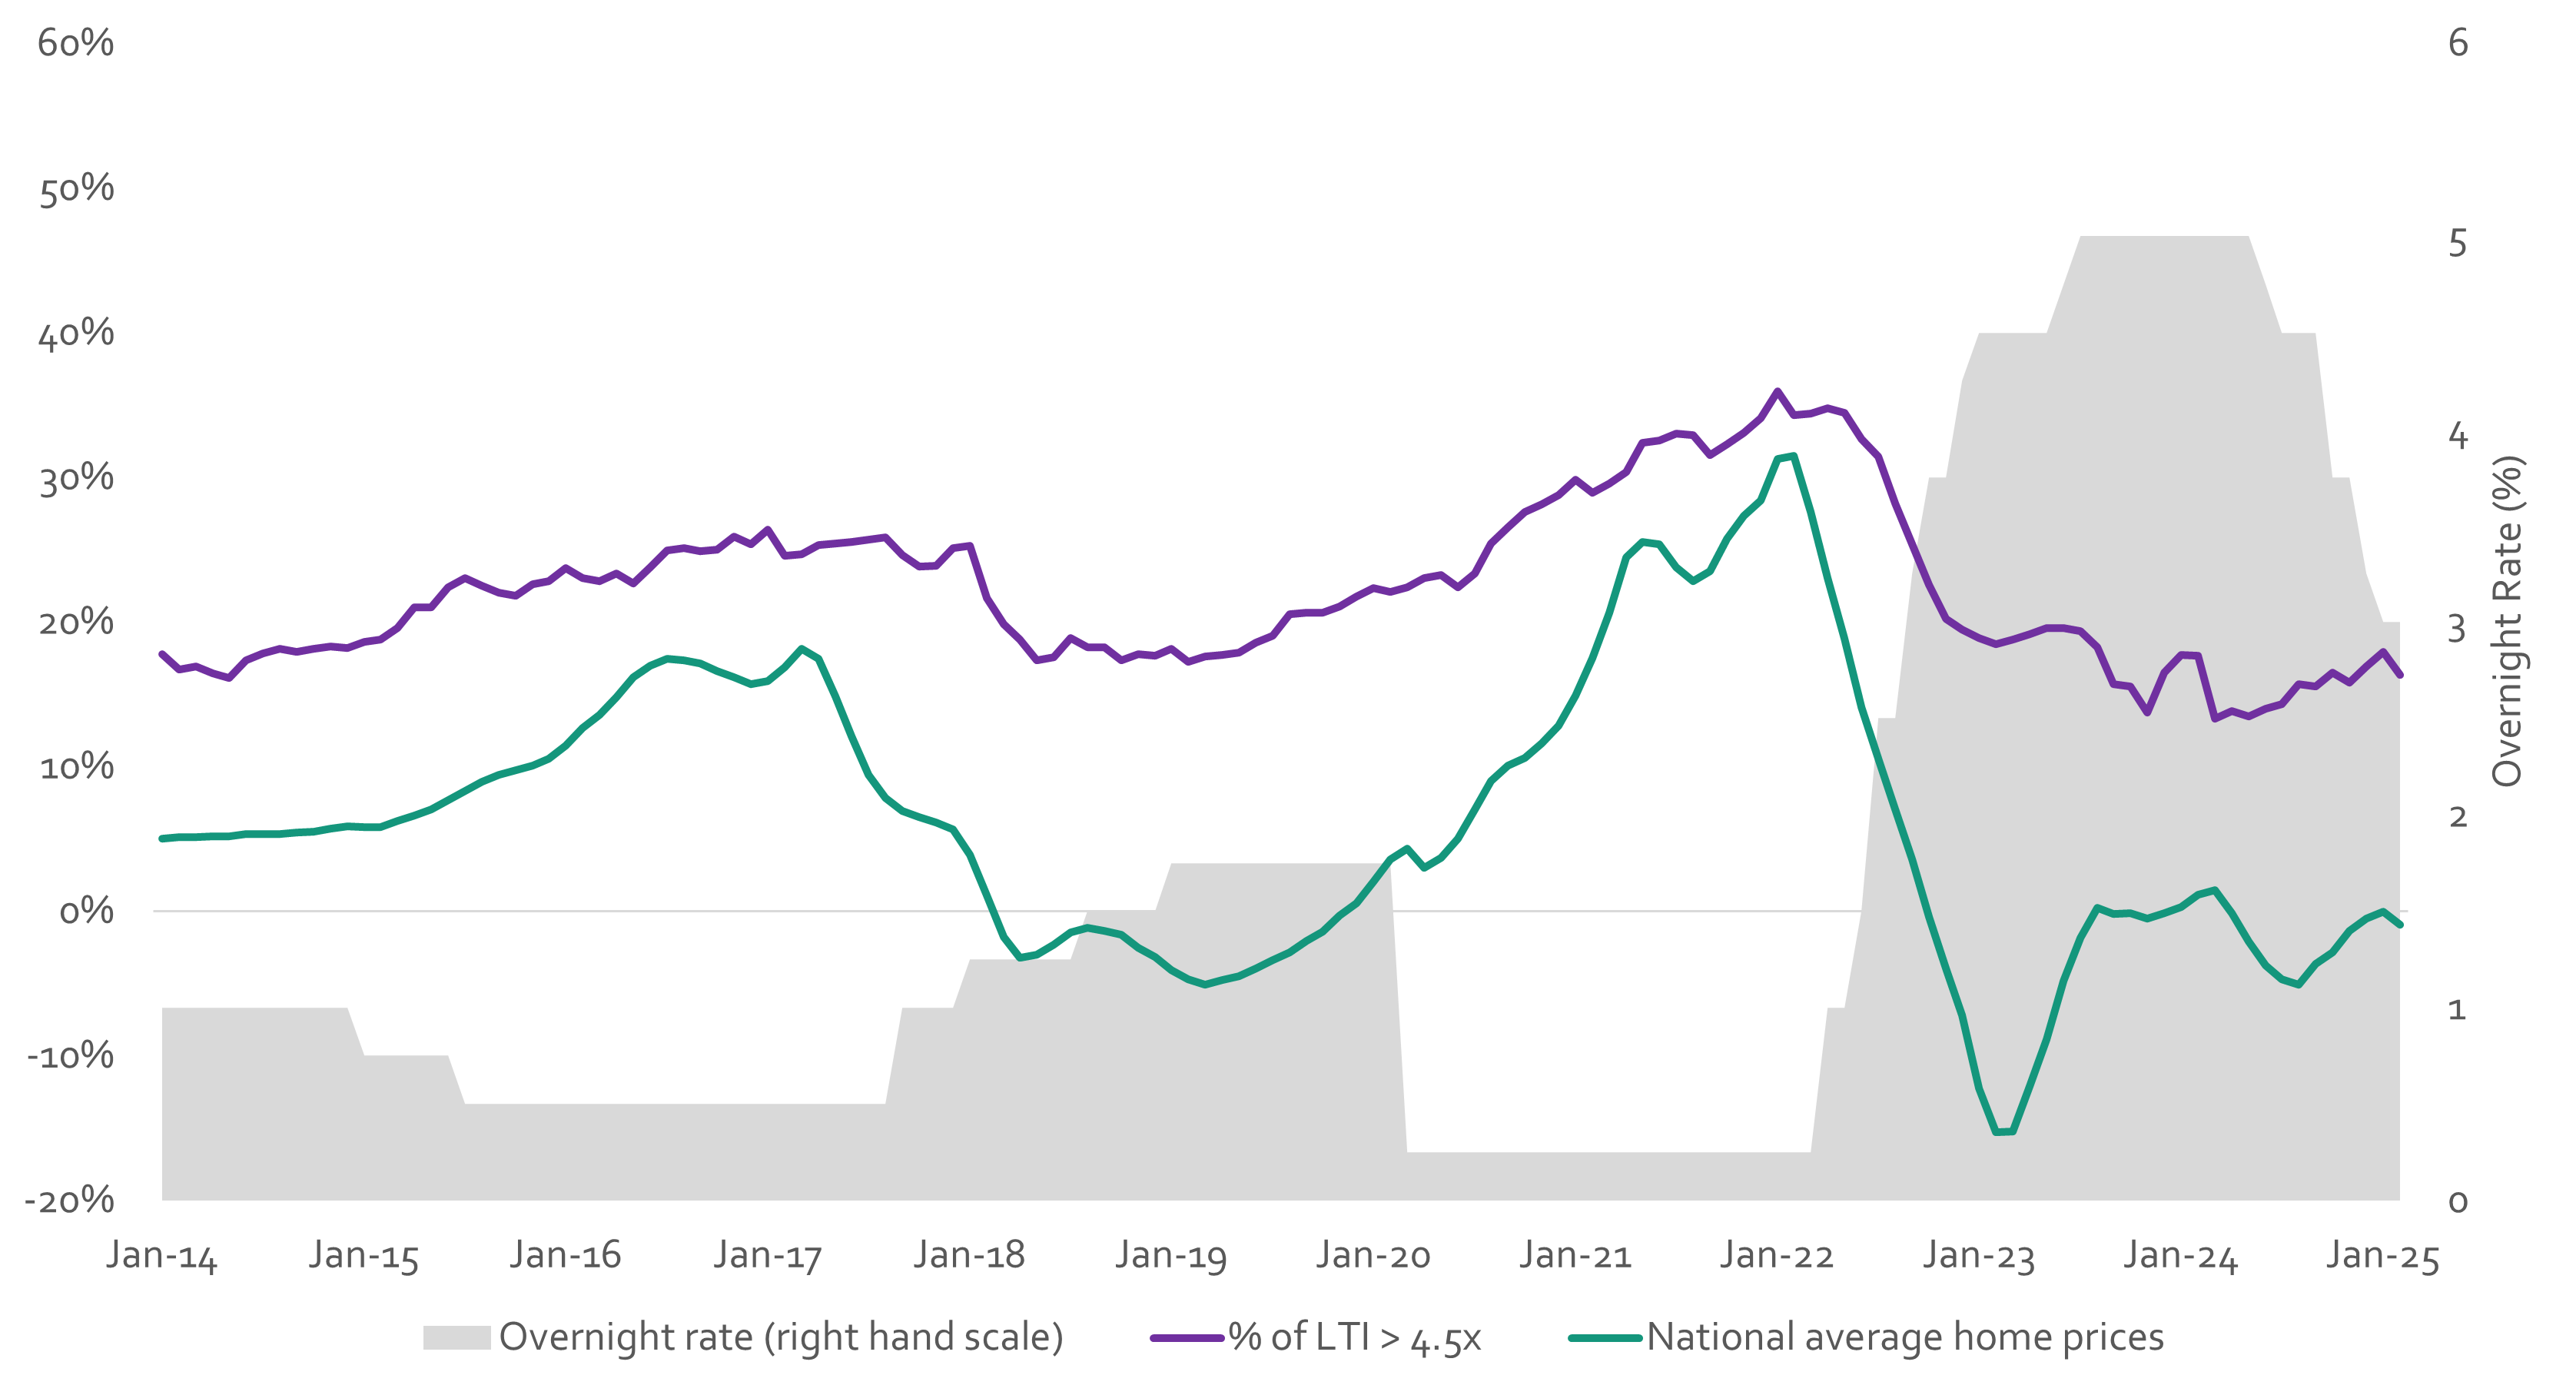
Source: Financial institutions’ filings to OSFI and Canadian Real Estate Association
Chart 1 - Text version
| Filing date | % of LTI > 4.5x | National average home prices (YoY, non-seasonally adjusted) | Overnight rate (right hand scale) |
|---|---|---|---|
| 1/31/2014 | 17.7% | 5.0% | 1.00 |
| 2/28/2014 | 16.7% | 5.1% | 1.00 |
| 3/31/2014 | 16.9% | 5.1% | 1.00 |
| 4/30/2014 | 16.5% | 5.2% | 1.00 |
| 5/31/2014 | 16.1% | 5.2% | 1.00 |
| 6/30/2014 | 17.3% | 5.3% | 1.00 |
| 7/31/2014 | 17.8% | 5.3% | 1.00 |
| 8/31/2014 | 18.1% | 5.3% | 1.00 |
| 9/30/2014 | 17.9% | 5.4% | 1.00 |
| 10/31/2014 | 18.1% | 5.5% | 1.00 |
| 11/30/2014 | 18.3% | 5.7% | 1.00 |
| 12/31/2014 | 18.2% | 5.8% | 1.00 |
| 1/31/2015 | 18.6% | 5.8% | 0.75 |
| 2/28/2015 | 18.8% | 5.8% | 0.75 |
| 3/31/2015 | 19.6% | 6.2% | 0.75 |
| 4/30/2015 | 21.0% | 6.6% | 0.75 |
| 5/31/2015 | 21.0% | 7.1% | 0.75 |
| 6/30/2015 | 22.4% | 7.7% | 0.75 |
| 7/31/2015 | 23.0% | 8.3% | 0.50 |
| 8/31/2015 | 22.5% | 8.9% | 0.50 |
| 9/30/2015 | 22.0% | 9.4% | 0.50 |
| 10/31/2015 | 21.8% | 9.8% | 0.50 |
| 11/30/2015 | 22.6% | 10.1% | 0.50 |
| 12/31/2015 | 22.8% | 10.5% | 0.50 |
| 1/31/2016 | 23.7% | 11.4% | 0.50 |
| 2/29/2016 | 23.0% | 12.7% | 0.50 |
| 3/31/2016 | 22.8% | 13.6% | 0.50 |
| 4/30/2016 | 23.3% | 14.8% | 0.50 |
| 5/31/2016 | 22.7% | 16.2% | 0.50 |
| 6/30/2016 | 23.8% | 17.0% | 0.50 |
| 7/31/2016 | 24.9% | 17.5% | 0.50 |
| 8/31/2016 | 25.1% | 17.3% | 0.50 |
| 9/30/2016 | 24.9% | 17.1% | 0.50 |
| 10/31/2016 | 25.0% | 16.6% | 0.50 |
| 11/30/2016 | 25.9% | 16.2% | 0.50 |
| 12/31/2016 | 25.3% | 15.7% | 0.50 |
| 1/31/2017 | 26.4% | 15.9% | 0.50 |
| 2/28/2017 | 24.6% | 16.8% | 0.50 |
| 3/31/2017 | 24.7% | 18.1% | 0.50 |
| 4/30/2017 | 25.3% | 17.4% | 0.50 |
| 5/31/2017 | 25.4% | 14.9% | 0.50 |
| 6/30/2017 | 25.6% | 12.1% | 0.50 |
| 7/31/2017 | 25.7% | 9.4% | 0.50 |
| 8/31/2017 | 25.9% | 7.9% | 0.50 |
| 9/30/2017 | 24.6% | 6.9% | 1.00 |
| 10/31/2017 | 23.9% | 6.5% | 1.00 |
| 11/30/2017 | 23.9% | 6.1% | 1.00 |
| 12/31/2017 | 25.1% | 5.7% | 1.00 |
| 1/31/2018 | 25.3% | 3.9% | 1.25 |
| 2/28/2018 | 21.6% | 1.1% | 1.25 |
| 3/31/2018 | 19.9% | −1.8% | 1.25 |
| 4/30/2018 | 18.8% | −3.2% | 1.25 |
| 5/31/2018 | 17.3% | −3.0% | 1.25 |
| 6/30/2018 | 17.6% | −2.3% | 1.25 |
| 7/31/2018 | 18.9% | −1.5% | 1.25 |
| 8/31/2018 | 18.2% | −1.2% | 1.50 |
| 9/30/2018 | 18.2% | −1.3% | 1.50 |
| 10/31/2018 | 17.4% | −1.6% | 1.50 |
| 11/30/2018 | 17.8% | −2.5% | 1.50 |
| 12/31/2018 | 17.7% | −3.2% | 1.50 |
| 1/31/2019 | 18.1% | −4.1% | 1.75 |
| 2/28/2019 | 17.2% | −4.7% | 1.75 |
| 3/31/2019 | 17.6% | −5.1% | 1.75 |
| 4/30/2019 | 17.7% | −4.8% | 1.75 |
| 5/31/2019 | 17.9% | −4.5% | 1.75 |
| 6/30/2019 | 18.6% | −4.0% | 1.75 |
| 7/31/2019 | 19.0% | −3.4% | 1.75 |
| 8/31/2019 | 20.6% | −2.9% | 1.75 |
| 9/30/2019 | 20.6% | −2.1% | 1.75 |
| 10/31/2019 | 20.6% | −1.4% | 1.75 |
| 11/30/2019 | 21.1% | −0.3% | 1.75 |
| 12/31/2019 | 21.7% | 0.5% | 1.75 |
| 1/31/2020 | 22.3% | 2.0% | 1.75 |
| 2/29/2020 | 22.1% | 3.6% | 1.75 |
| 3/31/2020 | 22.4% | 4.3% | 0.25 |
| 4/30/2020 | 23.0% | 3.0% | 0.25 |
| 5/31/2020 | 23.3% | 3.7% | 0.25 |
| 6/30/2020 | 22.4% | 5.0% | 0.25 |
| 7/31/2020 | 23.4% | 7.0% | 0.25 |
| 8/31/2020 | 25.4% | 9.0% | 0.25 |
| 9/30/2020 | 26.5% | 10.1% | 0.25 |
| 10/31/2020 | 27.6% | 10.6% | 0.25 |
| 11/30/2020 | 28.1% | 11.6% | 0.25 |
| 12/31/2020 | 28.8% | 12.9% | 0.25 |
| 1/31/2021 | 29.8% | 14.9% | 0.25 |
| 2/28/2021 | 28.9% | 17.5% | 0.25 |
| 3/31/2021 | 29.6% | 20.6% | 0.25 |
| 4/30/2021 | 30.4% | 24.5% | 0.25 |
| 5/31/2021 | 32.4% | 25.5% | 0.25 |
| 6/30/2021 | 32.5% | 25.4% | 0.25 |
| 7/31/2021 | 33.0% | 23.8% | 0.25 |
| 8/31/2021 | 32.9% | 22.8% | 0.25 |
| 9/30/2021 | 31.5% | 23.5% | 0.25 |
| 10/31/2021 | 32.3% | 25.8% | 0.25 |
| 11/30/2021 | 33.1% | 27.4% | 0.25 |
| 12/31/2021 | 34.1% | 28.4% | 0.25 |
| 1/31/2022 | 35.9% | 31.3% | 0.25 |
| 2/28/2022 | 34.3% | 31.5% | 0.25 |
| 3/31/2022 | 34.4% | 27.6% | 0.25 |
| 4/30/2022 | 34.8% | 23.0% | 1.00 |
| 5/31/2022 | 34.4% | 18.8% | 1.00 |
| 6/30/2022 | 32.7% | 14.1% | 1.50 |
| 7/31/2022 | 31.4% | 10.5% | 2.50 |
| 8/31/2022 | 28.2% | 7.0% | 2.50 |
| 9/30/2022 | 25.4% | 3.6% | 3.25 |
| 10/31/2022 | 22.5% | −0.4% | 3.75 |
| 11/30/2022 | 20.2% | −3.9% | 3.75 |
| 12/31/2022 | 19.5% | −7.2% | 4.25 |
| 1/31/2023 | 18.9% | −12.3% | 4.50 |
| 2/28/2023 | 18.5% | −15.3% | 4.50 |
| 3/31/2023 | 18.8% | −15.2% | 4.50 |
| 4/30/2023 | 19.2% | −12.1% | 4.50 |
| 5/31/2023 | 19.6% | −8.8% | 4.50 |
| 6/30/2023 | 19.6% | −4.8% | 4.75 |
| 7/31/2023 | 19.4% | −1.8% | 5.00 |
| 8/31/2023 | 18.3% | 0.2% | 5.00 |
| 9/30/2023 | 15.7% | −0.2% | 5.00 |
| 10/31/2023 | 15.5% | −0.2% | 5.00 |
| 11/30/2023 | 13.7% | −0.5% | 5.00 |
| 12/31/2023 | 16.5% | −0.2% | 5.00 |
| 1/31/2024 | 17.7% | 0.3% | 5.00 |
| 2/28/2024 | 17.7% | 1.1% | 5.00 |
| 3/27/2024 | 13.3% | 1.5% | 5.00 |
| 4/30/2024 | 13.8% | −0.2% | 5.00 |
| 5/31/2024 | 13.5% | −2.1% | 5.00 |
| 6/30/2024 | 14.0% | −3.8% | 4.75 |
| 7/31/2024 | 14.3% | −4.7% | 4.50 |
| 8/31/2024 | 15.7% | −5.1% | 4.50 |
| 9/30/2024 | 15.5% | −3.6% | 4.50 |
| 10/31/2024 | 16.5% | −2.9% | 3.75 |
| 11/30/2024 | 15.8% | −1.4% | 3.75 |
| 12/31/2024 | 16.9% | −0.5% | 3.25 |
| 1/31/2025 | 17.9% | 0.0% | 3.00 |
| 2/28/2025 | 16.3% | −0.9% | 3.00 |
How we set LTI limits
As a supervisory measure, we apply a unique LTI limit to each financial institution’s mortgage portfolio. This is a limit on the volume of newly originated uninsured mortgage loans, at that financial institution, that exceed a 4.5x loan-to-income multiple. This is not a limit on each individual loan.
We set limits that are proportionate to each institution’s mortgage lending business model and strategy. We consider each institution’s historical LTI proportions during both low- and high-interest rate periods, along with a range of vulnerability indicators in the housing market and economic environment. This approach allows financial institutions to continue competing effectively, while taking reasonable risks.
LTI limits have been in effect since each institution’s 2025 fiscal year start and are reported to us on a quarterly basis.
The LTI multiple
LTI is a simple ratio of the loan size relative to total qualifying income. Mortgage loans that exceed this multiple are considered highly leveraged.
Loan size (the “L” in LTI) is based on all loans secured against the subject property, regardless of the intended use of the property. First and second mortgages, home equity lines of credit, and other secured loans held by the same or a different institution are included.
Excluded are insured loans, reverse mortgages, renewals, and refinances where the only change is an extension of contractual amortization.
Total qualifying income (the “I” in LTI) is based on the financial institution’s definition of income. The qualifying income used to calculate LTI should align with the logic used to calculate debt service ratios.