Estimated solvency ratio results (May 2022)
Information
OSFI regularly estimates the solvency ratio for federally regulated pension plans with defined benefit provisions. The Estimated Solvency Ratio (ESR) exercise assists OSFI in identifying solvency issues that could affect the security of pension benefits promised to members and beneficiaries before a plan files their actuarial report. The ESR results also help identify broader trends.
The ESR is calculated using the most recent actuarial, financial and membership information filed with OSFI for each plan before the analysis date. Assets are projected based on either the rate of return provided on the Solvency Information Return (SIR) or an assumed rate of return for the plan when no SIR has been filed. Solvency liabilities are projected using relevant commuted value and annuity proxy rates prescribed by the Canadian Institute of Actuaries. Expected contributions, benefit payments, and expenses are taken into account and an ESR based on the estimated adjusted market value of the fund and estimated liabilities is then calculated for each plan.
The solvency position of pension plans improved significantly in 2021. The median ESR for the 333 plans included in the exercise (down from 342 last year) increased to 1.09 as at December 31, 2021, up from 0.97 at the end of 2020. The liability weighted average ESR for all plans is also 1.09 as at December 31, 2021, up from 1.00 at the end of 2020. The main drivers of the increase in the ESR are higher solvency discount rates and strong investment returns in 2021. The three-year estimated average solvency ratio (EASR), on which funding requirements are based, has increased to 1.03 as at December 31, 2021, up from 0.99 at the end of 2020. The graph below shows the current and previous ESRs, median ESRs, and the three-year EASRs dating back to December 2012.
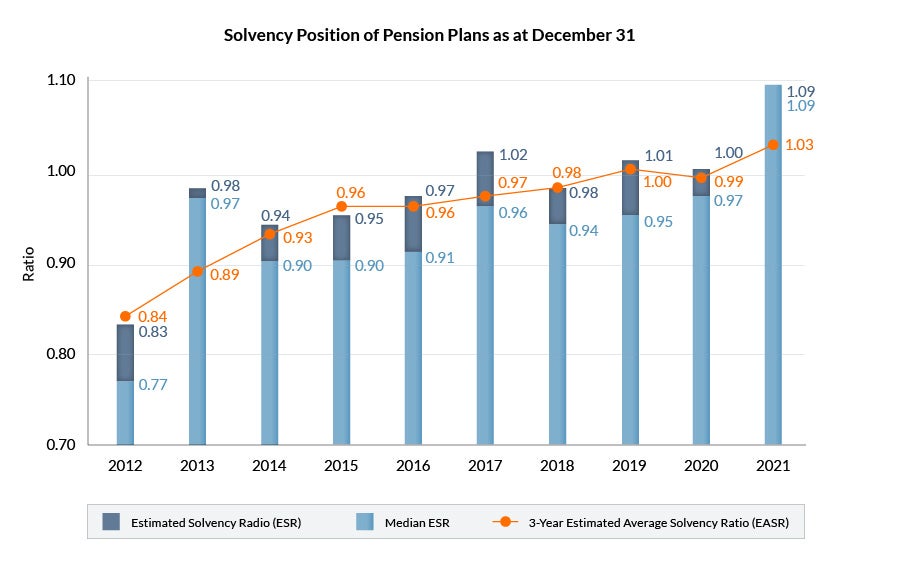
Text Description - Solvency Position of Pension Plans as at December 31
| 2012 | 2013 | 2014 | 2015 | 2016 | 2017 | 2018 | 2019 | 2020 | 2021 | |
|---|---|---|---|---|---|---|---|---|---|---|
| Median ESR | 0.77 | 0.97 | 0.90 | 0.90 | 0.91 | 0.96 | 0.94 | 0.95 | 0.97 | 1.09 |
| Estimated Solvency Ratio (ESR) | 0.83 | 0.98 | 0.94 | 0.95 | 0.97 | 1.02 | 0.98 | 1.01 | 1.00 | 1.09 |
| 3-year Estimated Average Solvency (EASR) | 0.84 | 0.89 | 0.93 | 0.96 | 0.96 | 0.97 | 0.98 | 1.00 | 0.99 | 1.03 |
The most recent ESR results show that around three-quarters of defined benefit plans are fully funded – the first time that most pension plans have been fully funded in a number of years! There was a significant reduction in the percentage of plans that were underfunded (23% in 2021 versus 61% in 2020). The number of plans that were significantly underfunded (ESRs below 0.80) also decreased (7% in 2021 down from 15% in 2020). It should be noted that these plans are all designated plans and therefore their funding is limited by the Income Tax Regulations. The graph below illustrates the distribution of the ESR results as at December 31 of each year since 2012.
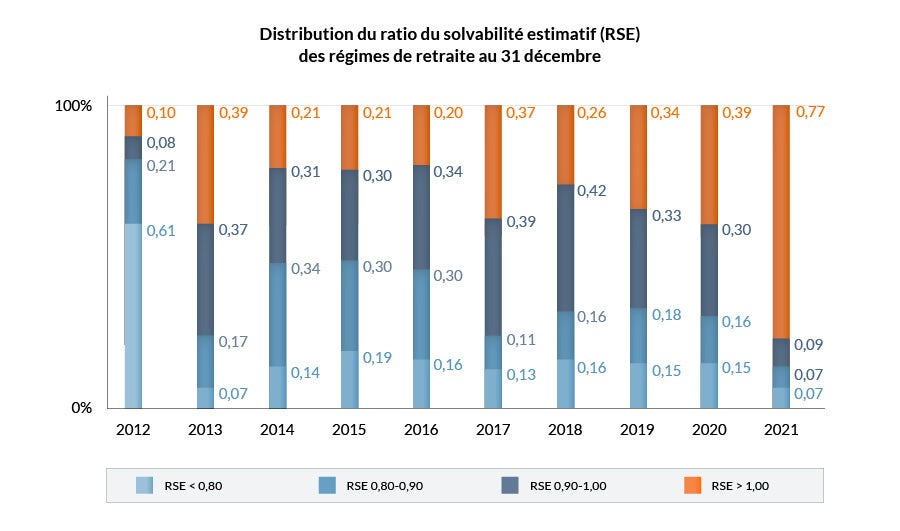
Text Description - Distribution of the Estimated Solvency Ratio (ESR) of Pension Plans as at December 31
| 2012 | 2013 | 2014 | 2015 | 2016 | 2017 | 2018 | 2019 | 2020 | 2021 | |
|---|---|---|---|---|---|---|---|---|---|---|
| ESR < 0.80 | 0.61 | 0.07 | 0.14 | 0.19 | 0.16 | 0.13 | 0.16 | 0.15 | 0.15 | 0.07 |
| ESR 0.80-0.90 | 0.21 | 0.17 | 0.34 | 0.30 | 0.30 | 0.11 | 0.16 | 0.18 | 0.16 | 0.07 |
| ESR 0.90-1.00 | 0.08 | 0.37 | 0.31 | 0.30 | 0.34 | 0.39 | 0.42 | 0.33 | 0.30 | 0.09 |
| ESR > 1.00 | 0.10 | 0.39 | 0.21 | 0.21 | 0.20 | 0.37 | 0.26 | 0.34 | 0.39 | 0.77 |