Assessing the Financial Sustainability of the Base Canada Pension Plan through Actuarial Balance Sheets: Actuarial Study No. 21
Accessibility statement
The Web Content Accessibility Guidelines (WCAG) defines requirements for designers and developers to improve accessibility for people with disabilities. It defines three levels of conformance: Level A, Level AA, and Level AAA. This report is partially conformant with WCAG 2.0 level AA. If you require a compliant version, please contact webmaster@osfi-bsif.gc.ca.
Office of the Chief Actuary
Office of the Superintendent of Financial Institutions Canada
12th Floor, Kent Square Building
255 Albert Street
Ottawa, Ontario
K1A 0H2
Facsimile: (613) 990-9900
E-mail address: oca-bac@osfi-bsif.gc.ca
An electronic version of this report is available
on our Web site: www.osfi-bsif.gc.ca
Table of contents
List of tables
- Table 1 Best-Estimate Annual Rates of Return on CPP Assets
- Table 2 Base CPP Balance Sheets Summary as at 31 December 2018 and 2030 - Comparison of Methodologies
- Table 3 Base CPP Open Group Balance Sheet as at 31 December 2018: Various Projection Periods
- Table 4 Individual Sensitivity Tests
- Table 5 Base CPP Balance Sheets under Closed and Open Groups as at 31 Dec. 2018: Sensitivity to Total Fertility Rate
- Table 6 Base CPP Balance Sheets under Closed and Open Groups as at 31 Dec. 2018: Sensitivity to Mortality Rates
- Table 7 Base CPP Balance Sheets under Closed and Open Groups as at 31 Dec. 2018: Sensitivity to Real Wage Increase
- Table 8 Base CPP Balance Sheets under Closed and Open Groups as at 31 Dec. 2018: Sensitivity to Real Rate of Return on Assets
List of Charts
- Chart 1 Base CPP Actuarial Balance Sheet Figures under Closed and Open Group Methodologies as at 31 December 2018 (9.9% legislated contribution rate, $ billion)
- Chart 2 Contributions and Investment Income as % Total Base CPP Revenues (9.9% legislated contribution rate)
- Chart 3 Assets/Expenditures Ratio - Base CPP (legislated and minimum contribution rates)
- Chart 4 Closed and Open Group Approaches as Applied to an Actuarial Balance Sheet
1 Executive Summary
1.1 Purpose
This is the twenty-first actuarial study to be published by the Office of the Chief Actuary (OCA). All the findings in this study are based on the 30th Actuarial Report on the Canada Pension Plan as at 31 December 2018 ("30th CPP Actuarial Report").
The purpose of this study is to provide further information regarding the base CPP actuarial balance sheet figures shown in the 30th CPP Actuarial Report, including analysis regarding the use of alternative methodologies.
This study is a follow-up to earlier actuarial studies on the financial sustainability of the CPP. The most recent of these studies was Measuring and Reporting Actuarial Obligations of the Canada Pension Plan: Actuarial Study No. 19, published in April 2018. This 21st actuarial study updates information presented in the previous studies on the basis of the 30th CPP Actuarial Report.
The 30th CPP Actuarial Report is the first triennial actuarial report on both components of the CPP - the base Plan and the new enhancement to the CPP, the additional Plan, which took effect 1 January 2019. Given that the additional Plan is a new component of the CPP with little experience to date, the update of information in this study pertains only to the base Plan. Over time, once more experience develops regarding the additional CPP, future studies on methodologies to assess the financial sustainability of the CPP will examine both the base and additional components.
1.2 Scope
Section 2 discusses the legislated financing approach for the base Plan. Section 3 next presents an analysis of the assets and obligations of the base CPP using different actuarial balance sheet methodologies. Section 4 discusses sensitivity analysis based on different demographic, economic, and investment assumptions under the closed group without future benefit accruals and open group approaches. Section 5 addresses the reporting of the financial state of the CPP. The conclusion follows in section 6. Lastly, two appendices provide the references used for this study and a list of contributors to this study.
1.3 Main Findings
The main findings of this study are as follows:
- The open group methodology is the most appropriate methodology to use for an actuarial balance sheet to measure the long-term financial sustainability of the base CPP. The reason is that the open group methodology fully accounts for both future contributions and invested assets as the means of financing the base Plan's future expenditures, which is consistent with the partial funding approach of the base Plan.
- In comparison, closed group methodologies, without or with future benefit accruals, do not reflect the partial funding approach of the base CPP, and as such are inappropriate to use for an actuarial balance sheet to assess the long-term financial sustainability of the base Plan.
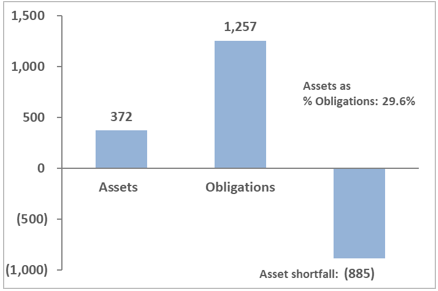
- The actuarial balance sheets for the base CPP show that, under an open group, the starting assets value plus the present value of future contributions of current and future contributors exceed the present value of current and future benefits. As a result, there is an asset excess under the open group as compared to asset shortfalls under the closed groups (without or with future accruals). The actuarial balance sheet figures for the base CPP under closed and open groups as at 31 December 2018 are shown in the following Chart 1.
Chart 1 Base CPP Actuarial Balance Sheet Figures under Closed and Open Group Methodologies as at 31 December 2018
(9.9% legislated contribution rate, $ billion)
Closed Group without Future Accruals
Closed Group with Accruals
Open Group
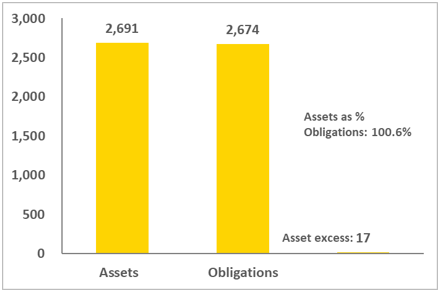
Chart 1 - Graphical descriptions
Three bar charts showing the base CPP actuarial balance sheet figures under a closed group without future accruals, a closed group with future accruals, and an open group methodology as at 31 December 2018. Y-axis for each bar chart represents billions of dollars, and X-axis represents three categories: assets, obligations, and asset shortfalls under the closed groups or an asset excess under the open group.
Under a closed group without future accruals methodology, the assets are $372 billion and obligations are $1,257 billion, which results in an asset shortfall of $885 billion and assets as a percentage of obligations equal to 29.6%, as at 31 December 2018.
Under a closed group with future accruals methodology, the assets are $1,338 billion and obligations are $1,908 billion, which results in an asset shortfall of $570 billion and assets as a percentage of obligations equals to 70.1%, as at 31 December 2018.
Under an open group methodology, the assets are $2,691 billion and obligations are $2,674 billion, which results in an asset excess of $17 billion and assets as a percentage of obligations equal to 100.6%, as at 31 December 2018.
In addition to the main results above, sensitivity analysis of the base CPP balance sheet measures using alternative assumptions to the best-estimate assumptions of the 30th CPP Actuarial Report was also performed. This sensitivity analysis highlights the importance of the right choice of the methodology used to measure the assets and obligations of the base CPP for the purpose of assessing its long-term financial sustainability - the methodology should provide meaningful indications of how various risks could impact the financial states of the base Plan. Measuring the base Plan's assets and obligations using the open group approach provides information that properly reflects how changes in assumptions affect the long-term sustainability of the base Plan. On the other hand, using the closed group without or with future accruals approach may provide incomplete or even misleading information.
A main tool used by the CPP stakeholders to assess the long-term financial sustainability of the Plan is the statutory actuarial reports prepared by the OCA. In addition, the long-term financial sustainability of the CPP is discussed in the notes to the CPP consolidated financial statements in the CPP Annual ReportsFootnote 1 and the Public Accounts of Canada. The actuarial balance sheet measures under both open group and closed group without future benefit accruals approaches are presented in the CPP actuarial and Annual Reports and in the Public Accounts of Canada, with an emphasis on the results under the open group.
1.4 Conclusion
The CPP is intended to be long-term and enduring in nature, a fact that is reinforced by the federal, provincial, and territorial governments' joint stewardship through the established strong governance and accountability framework of the Plan. In particular, this means it is expected that the base CPP will continue its high reliance on future contributions as a source of financing. It therefore follows that if financial sustainability of the base Plan is to be measured based on its asset excess or shortfall, it should be done on an open group basis that fully accounts for both future contributions and invested assets as the means of financing all future expenditures. Under the best-estimate assumptions of the 30th CPP Actuarial Report, the assessment of the base Plan's financial state on an open group basis confirms that the base Plan is able to meet its financial obligations over the long term.
In comparison, a closed group methodology, whereby only current participants are considered without or with their future benefit accruals, does not provide a proper assessment of the financial sustainability of the base CPP. This is because a closed group methodology does not reflect the partial funding approach of the base Plan whereby future contributions represent a major source of financing of future expenditures.
Although the key legislated financial measure for evaluating the base CPP is the minimum contribution rate, specifically, its adequacy and stability over time, other indicators such as the open group balance sheet should be used in combination with the minimum contribution rate to assess the financial sustainability of the base Plan.
It is important to note that the ratio of assets to obligations on an open group basis under the legislated contribution rate is not an absolute measure of financial sustainability of the base Plan. The base CPP can tolerate fluctuations in this ratio and still be financially sustainable over the long term.
Future demographic, economic, and financial market environments may differ from those assumed under the best‑estimate scenario of the 30th CPP Actuarial Report, and as a result may impact the base Plan's financial state differently. Sensitivity analysis was performed to examine the impacts of different environments on the base Plan's financial state. The results show that actuarial balance sheets under a closed group without future accruals approach may provide incomplete or even misleading information on the financial state of the base CPP.
The statutory actuarial reporting and the further provision of relevant and complete information in the CPP consolidated financial statements of the CPP Annual Reports and Public Accounts of Canada are aimed at providing all stakeholders with accurate, appropriate, and comprehensive information to enable informed decisions.
2 Financing of the Base CPP
The Canada Pension Plan came into effect on 1 January 1966 as an earnings‑related plan to provide working Canadians with retirement pensions, disability pensions, benefits for children of disabled contributors, survivor's pensions, orphan's benefits, and the death benefit. The Plan was established primarily to assist with income replacement upon retirement.
The legislated combined employer-employee contribution rate for the base CPP has been 9.9% since 2003, shared equally (4.95%) between an employer and employee, or applied fully to self-employed persons. Contributions to the base Plan are based on contributory earnings between the Year's Basic Exemption (YBE) and the Year's Maximum Pensionable Earnings (YMPE). The YBE has been fixed at $3,500 since 1997, and the YMPE increases each year in line with average weekly earnings. In 2021, the YMPE is $61,600, giving a maximum contributory earnings base of $58,100 and maximum contribution of $5,751.90 ($2,875.95 each per employer and employee).
Since its inception, the CPP statute has been subject to various amendments, including the 1997 Reforms and the introduction of the additional Plan in 2019. For a description of the history of the amendments to the statute and financing of the CPP, the reader may refer to the 30th CPP Actuarial Report (OSFI, 2019) as well as previous actuarial reports and studies.Footnote 2
The base and additional Plans are financed using different methodologies in accordance with legislation and regulations (the Calculation of Contribution Rates Regulations, 2021). It is important to note that the financing methodologies for both components of the Plan are based on an open group approach, whereby contributions and benefits of both current and future participants are considered.
For both components of the Plan, the financing objectives are stated in the CPP statute in terms of minimum contribution rates and how they relate to the respective legislated contribution rates. An overview of the base CPP financing methodology is provided below. For a detailed description of the financing methodology of the additional CPP, the reader is referred to the 30th CPP Actuarial Report and the actuarial study: Technical paper on the Additional Canada Pension Plan Regulations – Actuarial Study No. 20 (OSFI, 2018b).
The base CPP is a partially funded plan that is financed using a "steady-state funding" methodology. Steady‑state funding involves a steady‑state contribution rate that is the lowest rate sufficient to ensure the long‑term financial sustainability of the base Plan without recourse to further rate increases. The steady-state rate is determined separately from any incremental full funding rates for increased or new benefits. Both the steady-state and incremental rates, if applicable, are calculated by the Chief Actuary based on regulations (the Calculation of Contribution Rates Regulations, 2021) referred to in the CPP statute and are part of each actuarial valuation of the Plan that is made public.
The steady‑state contribution rate ensures the stabilization of the ratio of end-of-year assets to the following year's expenditures (A/E ratio) over time, before consideration of any full funding of increased or new benefits. Specifically, the Calculation of Contribution Rates Regulations, 2021 require that the steady‑state contribution rate be the lowest rate such that the A/E ratios in the 10th and 60th year following the third year of the most recent CPP triennial review period are the same.
The sum of the steady‑state and incremental full funding rates is the minimum contribution rate (MCR) of the base Plan. Insufficient rates provisions exist in the CPP statute to safeguard the base Plan in the event the MCR exceeds the legislated contribution rate.
Under the 30th CPP Actuarial Report, the steady-state contribution rate is 9.71% for the year 2022 and thereafter. The incremental full funding rate required to fund the recent amendments under the Budget Implementation Act, 2018, No. 1 is 0.04% for years 2022 to 2033 and 0.01% for the year 2034 and thereafter. The MCR (the sum of the steady-state and full funding rates) to sustain the base Plan is thus 9.75% of contributory earnings for years 2022 to 2033 and 9.72% for the year 2034 and thereafter. The base CPP legislated contribution rate of 9.9% applies to the first three years after the valuation year (2018), that is, to the current triennial review period of 2019-2021.
The results of the 30th CPP Actuarial Report confirm that the legislated contribution rate of 9.9% for year 2019 and thereafter is sufficient to maintain the long‑term financial sustainability of the base Plan.
The main two sources of income of the base CPP are contributions and investment income. The combination of a freeze on the YBE at $3,500, the continued increase in the YMPE, and the growth in the workforce has led to the contributory earnings base increasing each year, which results in higher base Plan contributions revenue.
Excess cash flows not required to pay benefits are transferred to the CPPIB to be invested in the financial markets. The role of the CPPIB is becoming increasingly important as assets have grown significantly over the past two decades. Moreover, it is projected that after 2021, an increasing proportion of investment income will be required to meet expenditures.Footnote 3 However, even if net cash flows are projected to be negative after 2021, asset growth is still expected to continue.
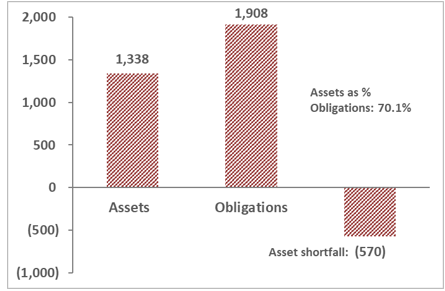
The nature of steady-state funding of the base CPP results in the base Plan being highly reliant on future contributions as a source of its revenues. Chart 2 shows that while the importance of investment income as a source of the revenues increases over time in line with the overall growth in the base CPP assets, contributions are projected to remain the main source of revenues for the base Plan. According to the projections of the 30th CPP Actuarial Report, contributions are expected to represent about 60% of total base CPP revenues over the long term.
Chart 2 Contributions and Investment Income as % Total Base CPP Revenues
(9.9% legislated contribution rate)
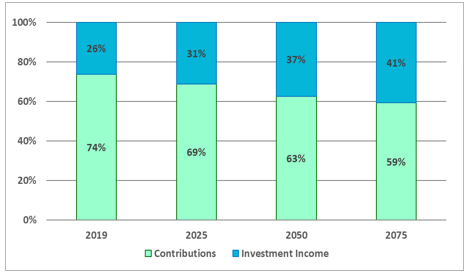
Chart 2 - Graphical description
Stacked bar charts showing the projection over time of base CPP contributions and investment income as percentages of total base CPP revenues. Y-axis represents percent from 0 to 100, and X-axis represents the year.
In 2019, contributions represents 74% of total base CPP revenues, and investment income represents the other 26%.
In 2025, contributions are projected to represent 69% and investment income 31% of total base CPP revenues.
In 2050, contributions are projected to represent 63% and investment income 37% of total base CPP revenues.
In 2075, contributions are projected to represent 59% and investment income 41% of total base CPP revenues.
As can be seen in Chart 3, under the legislated contribution rate of 9.9%, the A/E ratio for the base Plan is projected to remain relatively stable at a level of about 7.6 over the period 2019 to the early 2030s. Thereafter, it continues to rise overall to a value of 9.5 in 2095.
As the legislated rate of 9.9% is greater than the MCR of 9.75% for years 2022-2033 and 9.72% thereafter, the A/E ratio under the legislated rate is higher than under the MCR. The A/E ratio under the MCR for year 2022 and thereafter is shown in Chart 3 for comparison. The years 2031 and 2081 are the target years for the steady-state contribution rate of 9.71%, under which the A/E ratios are equal for those years at a value of 7.5.
The projected initial slowdown in the growth of the A/E ratio until the early 2030s under the legislated rate of 9.9% is caused by the retirement of the baby boom generation, which increases the cash outflows of the Plan. The existence of a large pool of assets enables the base Plan to absorb the increased outflow and maintain the contribution rate of 9.9%.
Chart 3 Assets/Expenditures Ratio - Base CPP
(legislated and minimum contribution rates)Footnote 1
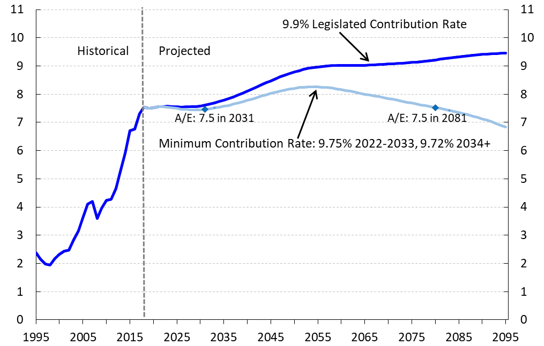
Chart 3 - Graphical description
Line chart showing the historical and projected base CPP's assets to expenditures ratio under the legislated and minimum contribution rates. Y-axis represents the assets to expenditures ratio. X-axis represents the year.
The assets to expenditures ratio under the 9.9% legislated contribution rate is 2.4 in 1995, increases to 7.6 in 2018, and is projected to increase to 9.5 in 2095.
The assets to expenditures ratio under the minimum contribution rate of 9.75% for years 2022 to 2033, and 9.72% for year 2034 and thereafter is projected to be 7.6 in 2022, to increase to a maximum of 8.3 in 2054, and then decrease to 6.8 in 2095.
The assets to expenditures ratio under the minimum contribution rate equals 7.5 in years 2031 and 2081.
Footnotes
- Footnote 1
-
Chart 3 corresponds to Chart 15 in the 30th CPP Actuarial Report.
3 Analysis of Assets and Obligations of the Base CPP
This section presents an analysis and comparison of the assets and obligations, i.e. an actuarial balance sheetFootnote 4 of the base CPP under different closed and open group methodologies. Two measures of the financial state of the base Plan are analyzed for each methodology: the difference between the base Plan's assets and obligations (this difference is termed an "asset excess", if positive, or "asset shortfall", if negative) and the base Plan's assets as a percentage of its obligations. Both measures provide an indication of the extent to which the base Plan's obligations are covered by its assets.
3.1 General Methodology
A closed group includes only current participants of a plan, with no new entrants permitted. In comparison, an open group is one that includes all current and future participants of a plan. Two types of closed groups are discussed in this section: a closed group without future benefit accruals for the group's members, and a closed group with future accruals for its members.
As well, the open group approach is discussed. It is important to note that the legislated methodologies to determine the steady-state and incremental full funding contribution rates of the base CPP are based on the open group approach (in accordance with the Calculation of Contribution Rates Regulations, 2021).Footnote 5
Based on a schematic shown in section 2 of the Technical compilation guide for pension data in national accounts – 2020 edition by Eurostat and the European Central Bank (2020), the following schematic illustrates the differences between the three approaches with respect to the components included in determining the balance sheet of a social security program.
Chart 4 Closed and Open Group Approaches as Applied to an Actuarial Balance SheetFootnote 1
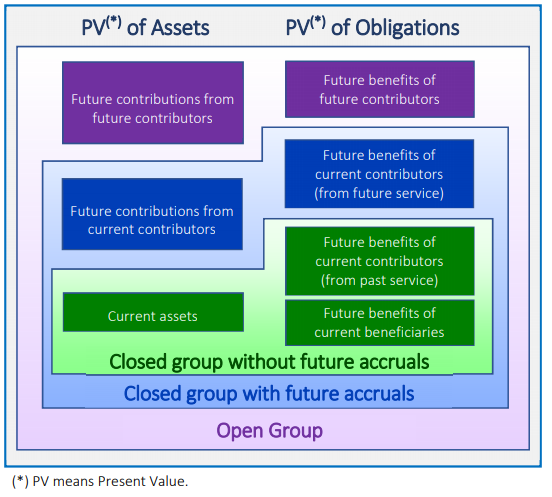
Chart 4 - Graphical description
Schematic diagram showing the components of closed and open group approaches as applied to an actuarial balance sheet, with the groups building upon another with respect to the components they include. All the components are determined as present values and belong to either the assets or obligations side of a balance sheet.
A closed group without future accruals has only current assets on the assets side of the balance sheet. The obligations consists of the present values of future benefits of current beneficiaries and future benefits of current contributors from past service.
A closed group with future accruals includes all the components under a closed group without accruals as well as additional components. On the assets side of the balance sheet there is in addition the present value of future contributions from current contributors, and on the obligations side there is in addition the present value future benefits of current contributors from future service.
An open group includes all the components under the closed group with future accruals as well as additional elements. The assets side of the balance sheet includes in addition the present value of future contributions from future contributors, and the obligations side includes in addition the present value of future benefits of future contributors.
Footnotes
- Footnote 1
-
Source: (Eurostat & European Central Bank, 2020, Box 1).
The long-term financial sustainability of a social security system may be assessed based on its balance sheet, i.e. the adequacy of future sources of income (contributions and investment income in the case of the CPP) to cover its obligations. As recommended in the 2018 special issue of the International Social Security Review of the International Social Security Association, titled Actuarial and financial reporting of social security obligations (ISSA, 2018), the methodology used to correctly assess the long-term financial sustainability of a social security system should be determined by the system's financing approach.
This recommendation is also supported by professional actuarial standards of practice. As stated in the International Actuarial Association's International Standard of Actuarial Practice 2 (ISAP 2) – Financial Analysis of Social Security Programs (IAA, 2018, p. 3), "The actuary should use a methodology that is consistent with the financing method used for the SSP" (social security program). ISAP 2 further describes different financing methodologies and whether using open or closed group methodologies would be appropriate. The Canadian Institute of Actuaries' Standards of Practice, Part 7000 – Practice-Specific Standards for Social Security Programs (CIA, 2018, p. 7006), which is modelled on ISAP 2, state that in choosing a method to assess the financial state of a social security program:
"The actuary would use a valuation methodology that is consistent with the financing method used for the social security program. Two methods are available:
- An open group methodology, under which contributions and benefits of both current and future participants are considered, is most appropriate for pay-as-you-go and partially funded social security programs and may also be used for social security programs that are meant to be fully funded; and
- A closed group methodology, under which only current participants are considered, with or without their assumed future benefit accruals and contributions, is only appropriate for a fully funded social security program that is meant to be fully funded."
For systems that are expected to have invested assets sufficient to pay for all accrued-to-date benefits of current participants at any given date, the accrued obligations are assumed to be funded in advance. Therefore, balance sheets determined under a closed group without future accruals are appropriate for such plans.
The balance sheets under a closed group with future accruals could correspond, for example, to a situation when a social security system is closed to new entrants. In such situations, independently of its financing methodology, the system would rely on the existing invested assets and future contributions of current participants to pay for their current and future benefits.
In comparison to closed group systems, ongoing pay-as-you-go and partially funded systems that cover simultaneously multiple current and future generations represent social contracts where, in any given year, current contributors allow the use of their contributions to pay current beneficiaries' benefits. As a result, such social contracts create a claim for current and past contributors to contributions of future contributors. The proper assessment of the financial sustainability of a social security pay-as-you-go or partially funded system by means of its balance sheet should take these claims into account. The traditional closed group methodologies do not reflect these claims since only current participants are considered. In comparison, the open group approach accounts explicitly for these claims by considering the benefits and contributions of both current and future plan participants.
It follows that the open group approach is the most appropriate approach for evaluating the long-term financial sustainability of the base Plan. An open group approach reflects the partial funding and intended long-term nature of the base CPP with social contracts created between generations of past, current, and future contributors. Using an open group approach allows for the continuous amortization of actuarial excesses and shortfalls that arise over time and the long-term stability in the contribution rates of the base Plan.
The use of closed group and open group methodologies to determine the actuarial balance sheets of the base CPP is discussed in this section. For all balance sheets discussed, it is assumed that future contributions are determined using the legislated contribution rate of 9.9% for the base CPP. It is also assumed that the assets of the base Plan are invested in its best‑estimate portfolio of the 30th CPP Actuarial Report.
For the base Plan, the best-estimate portfolio is invested ultimately as 42% in equities, 32% in fixed income securities, and 26% in real assets, such as real estate, infrastructure, and natural resources. The assumed ultimate annual nominal and real returns on this portfolio are 6.01% and 4.01%, respectively. The assumed nominal and real rates of return are shown in Table 1.
| Year | Base CPP | |
|---|---|---|
| Nominal | Real | |
| 2019 | 4.85 | 2.85 |
| 2020 | 4.85 | 2.85 |
| 2021 | 5.77 | 3.77 |
| 2022 | 5.62 | 3.62 |
| 2023 | 5.69 | 3.69 |
| 2030+ | 6.01 | 4.01 |
| Average over: | ||
| 2019-2023 | 5.35 | 3.35 |
| 2019-2028 | 5.57 | 3.57 |
| 2019-2093 | 5.95 | 3.95 |
| 2019-2168 | 5.98 | 3.98 |
Table 1 Footnotes
|
||
For the purpose of determining the actuarial assets and obligations of the base CPP, the future cash flows are discounted using the assumed nominal rate of return on the base Plan assets.
The question of the discount rate to be used in order to determine the actuarial assets and obligations generates considerable debate in actuarial as well as financial and statistical reporting communities. Possible types of discount rates considered include the rate of return on assets, rates linked to the yield of a basket of government bonds (e.g. under the European System of Accounts (Eurostat, 2013)), and the rate of growth in the Gross Domestic Product (e.g. as used in the United Kingdom to determine unfunded public service pension contributions (Thurley, 2019)).
In the earlier actuarial study on the base CPP: Measuring and Reporting Actuarial Obligations of the Canada Pension Plan – Actuarial Study No. 19 (OSFI, 2018a), an alternative discount rate was considered, which was equal to a mix of the assumed nominal rate of return and the growth in the contributory base. This rate was assumed to reflect the partial funding nature of the base Plan and its associated high reliance on future contributions as a source of financing. It was shown that using the alternative discount rate resulted in the same asset excess/shortfall as determined by using the assumed nominal rate of return on the base CPP assets.
Another important element of the methodology used to determine the components of the base CPP balance sheet is the length of the projection period. In this study, the cash flows are projected over an extended time period of 150 years. Section 3.6 provides the rationale for this choice.
3.2 Closed Group without Future Accruals
For this approach, no new entrants to the CPP are permitted, and current Plan participants who are not receiving benefits at the valuation date are assumed to make no further contributions beyond that date, and hence accrue no further benefits.
To determine the actuarial obligations under the closed group approach, the benefits that will be paid in respect of CPP participation up to and including the valuation date must first be projected. For beneficiaries in pay, expenditures are projected using the best-estimate assumptions of the 30th CPP Actuarial Report with benefits increased annually in line with inflation as provided under the current Plan. For contributors, the projection is also based on the best‑estimate assumptions of the 30th CPP Actuarial Report with the following exceptions:
- No new entrants to the Plan are included; and
- Current Plan participants who are not receiving benefits at the valuation date are assumed to make no further contributions beyond that date. Their projected benefits are calculated by assuming they will have no pensionable earnings from the valuation date up to the year of benefit take-up. In accordance with the base Plan's provisions, the YMPE is still projected to the year of benefit take-up, and the pre-valuation date pensionable earnings are still wage-indexed to the year of benefit take-up using projected nominal wage increases, i.e. changes in the Consumer Price Index (CPI) plus real wage increases.
Under the base Plan, the maximum contributory period for each participant is 47 years; that is, from age 18 to 65. Some periods of low pensionable earnings may be excluded from the benefit calculation by reason of pensions commencing after age 65, disability, child‑rearing for a child less than seven years of age, and the general low-earnings drop-out provision. The general low-earnings drop-out provision allows for 17% of the number of months in the contributory period with the lowest earnings (up to a maximum of about eight years) to be dropped from the calculation of the retirement benefit. The contributory period also excludes periods on or after 1 January 2012 during which a beneficiary contributes while in receipt of a retirement pension.
For the purpose of determining the projected benefits under a closed group without future accruals basis, the general low-earnings drop-out provision is applied to the portion of the contributory period up to the valuation date. Thus, if a participant has been eligible to contribute for a period of 30 years prior to the valuation date, and is assumed to take his/her retirement benefit at age 65, then only 17% of those years (about 5, in this example) will be dropped and the maximum contributory period will be 42 years (assuming no other drop-outs apply).
A participant's annual base CPP retirement pension is equal to 25% of the average of the YMPE for the year of his or her retirement and the four previous years, referred to as the Maximum Pensionable Earnings Average (MPEA), adjusted to take into account the contributor's pensionable earnings. For this purpose, the contributor's pensionable earnings for any given month are indexed by the ratio of the MPEA for the year of retirement to the YMPE for the year to which the given month belongs. It follows that if a contributor paid contributions on earnings equal to the YMPE for thirty years, his average adjusted earnings, taking into account the low-earnings drop-out of 17%, would be determined by multiplying his MPEA by the ratio of 30/42.
The resulting projected expenditures (including projected operating expenses) for the base CPP are next discounted using the expected nominal rate of return on the base Plan's assets to determine the present value of the expenditures. These are the actuarial obligations of the base CPP under the closed group without future benefit accruals approach, which are also called the "accrued‑to-date" obligations. The assets under this approach consist of the base Plan's current assets. Under this approach, as at 31 December 2018, the base Plan's asset shortfall is $885 billion and the total assets represent 29.6% of the actuarial obligations.
The balance sheet for the base CPP as at 31 December 2018 under the closed group without future accruals approach is presented in Table 2 of section 3.5 together, for comparison, with the balance sheets under a closed group with future accruals and open group approaches, discussed in the next two sections. Table 2 also presents the balance sheets under the three approaches as at 31 December 2030, and comparisons over time and between approaches are discussed in section 3.5.
It is worth noting that according to the actuarial study: Measuring and Reporting Actuarial Obligations of the Canada Pension Plan: Actuarial Study No. 19 (OSFI, 2018a), under a closed group without future accruals approach, the total base CPP assets as a percentage of the actuarial obligations was 24.4% as at 31 December 2015. The substantial increase in this ratio over the three years from 2015 to 2018 is mainly due to the strong investment performance over that period, which resulted in higher assets than projected.
As a result of the 1997 Amendments, the base CPP has moved away from pure pay‑as‑you‑go financing (with a small contingency reserve) to partial funding. However, it should be noted that full funding of the base Plan (i.e. the accumulation of the invested assets equal to the actuarial obligations under the closed group approach without future accruals) was never intended by the stakeholders. The closed group methodology does not reflect the partial financing approach of the base Plan, where future contributions represent a major source of financing of future expenditures, or the implied social contract between different generations of participants. Therefore, while the figures for the base CPP of the accrued-to-date obligations and relative size of the asset shortfall under the closed group without future accruals may be used for certain purposes, it is inappropriate to reach a conclusion regarding the base Plan's financial sustainability considering only the asset shortfall under the closed group balance sheet.
All disclosures related to the base CPP balance sheet under the closed group without future accruals approach should be accompanied by information regarding the balance sheet under the open group approach in order to provide users with objective information.
3.3 Closed Group with Future Accruals
For this group, no new entrants to the CPP are permitted, and current Plan participants who are not receiving benefits at the valuation date are assumed to continue contributing to the Plan beyond that date. Thus, current Plan participants also continue to accrue benefits with future salary increases in line with expected wage increases. As a result, the obligations side of the balance sheet includes the present value of future expenditures in respect of accrued and future service for current Plan participants, while the assets side includes the present value of their future contributions as well as current assets. Under this approach, the asset shortfall for the base Plan as at 31 December 2018 is $570 billion, with total assets representing 70.1% of the actuarial obligations, as shown in Table 2.
3.4 Open Group
An open group is defined as one that includes all current and future participants of a plan, where the plan is considered to be ongoing into the future, that is, over an extended time horizon. This means that future contributions of current and new participants and their associated benefits are considered in order to determine whether current assets and future contributions will be sufficient to pay for all future expenditures.
To determine the actuarial obligations of the base CPP under the open group approach, future base CPP expenditures with respect to current and future Plan participants are first projected using the best-estimate assumptions of the 30th CPP Actuarial Report. Next, in order to determine their present values, the total projected expenditures of the base Plan are discounted using the respective expected nominal rate of return on assets. These are the actuarial obligations under the open group approach.
To determine the assets of the base CPP under the open group approach, the future contributions of current and future contributors are projected using the best-estimate assumptions of the 30th CPP Actuarial Report and the legislated contribution rates of 9.9%. In order to determine their present value, the total projected contributions are discounted using the expected nominal rate of return on base CPP assets. This present value is added to the base Plan's current assets to obtain the total base CPP assets.
Under this approach, there is an asset excess of $17 billion for the base CPP as at 31 December 2018, and the total assets cover 100.6% of the actuarial obligations.
The base CPP balance sheet under this methodology as at 31 December 2018 is presented in the 30th CPP Actuarial Report. This information is further included in the Notes to the CPP Consolidated Financial Statements in the Public Accounts of Canada (Receiver General for Canada, 2020). Section 5 of this study provides more discussion on the financial reporting of the CPP assets and obligations.
The CPP is intended to be long-term and enduring in nature, a fact that is reinforced by the federal, provincial, and territorial governments' joint stewardship through the established strong governance and accountability framework of the Plan. In particular, this means it is expected that the base Plan will continue its high reliance on future contributions as a source of financing. It therefore follows that if financial sustainability of the base Plan is to be measured based on its asset excess or shortfall, it should be done on an open group basis that fully accounts for both future contributions and invested assets as the means of financing all future expenditures. The inclusion of future contributions and benefits with respect to both current and future participants in the assessment of the base Plan's financial state indicates that the base Plan is able to meet its financial obligations over the long term.
It is also important to note that the ratio of assets to obligations on an open group basis under the legislated contribution rate is not an absolute measure of financial sustainability of the base Plan. The base CPP can tolerate fluctuations in this ratio and still be financially sustainable over the long term. As such, the actuarial balance sheet of the base Plan under its legislated contribution rate should be viewed in conjunction with its MCR in assessing the financial sustainability of the base CPP.
3.5 Comparison of Closed and Open Groups - Summary of Assets and Obligations as at 31 December 2018 and 2030
As mentioned earlier, Table 2 compares and summarizes for the base CPP the assets, obligations, and resulting asset excess or shortfall as at 31 December 2018 and 2030 for the three approaches. The results are based on the best-estimate assumptions of the 30th CPP Actuarial Report, the legislated contribution rate of 9.9%, and the discount rate as shown in Table 1 (best-estimate assumed nominal rate of return on base CPP assets).
As shown in Table 2, the closed group without future benefit accruals generates the largest asset shortfall and lowest ratio of assets to obligations of the three different approaches considered. This is because there are no future contributions as well as no future benefit accruals. Under the closed group without future benefit accruals, the asset shortfall for the base CPP increases from $885 billion to $1,319 billion between 2018 and 2030. Despite the growth in the asset shortfall, the ratio of assets to obligations increases from 29.6% to 34.3% over the same period, reflecting that the growth in total assets outpaces the growth in total obligations.
The closed group with future accruals includes the future contributions and associated benefits for current contributors in the calculation of the base Plan's assets and obligations. As a result, total assets and obligations increase significantly compared to the closed group without accruals approach. Moreover, total assets increase to a greater extent than total obligations because the present value of future contributions exceeds the present value of the associated benefits. This results in a decrease in the asset shortfall (from $885 billion to $570 billion in 2018) and the ratio of assets to obligations increasing significantly (from 29.6% to 70.1% in 2018). A substantial shortfall still exists under the closed group with accruals, since this approach does not fully account for contributions from future participants as a major source of financing for the base Plan. Between 2018 and 2030, the assets shortfall increases from $570 billion to $854 billion. However, as the growth in total assets between 2018 and 2030 still slightly exceeds the growth in total obligations, the ratio of the assets to obligations increases slightly to 71.3% in 2030.
The open group includes future contributions and benefits for both current and future participants in the calculation of the assets and obligations. Under the open group, the current assets and present value of future contributions of current and future contributors greatly exceeds the present value of future benefits (from current beneficiaries in pay and current and future contributors). Thus, the asset shortfall of the base CPP becomes an asset excess compared to the closed groups. Under the open group approach, the asset excess for the base Plan increases from $17 billion in 2018 to $20 billion in 2030. The ratio of the assets to obligations remains stable at about 101% as the growth in total assets between 2018 and 2030 is similar to the growth in total obligations.
The open group balance sheet figures demonstrate that the base Plan is financially sustainable over the long term. The future contributions under the legislated contribution rate in combination with investment income are sufficient to pay the future expenditures and build a larger fund. In turn, this larger fund provides additional capacity for mitigating impacts on the base CPP's finances from future adverse demographic, economic, and investment environments.
| Present Value as at 31 DecemberFootnote 1 | 31 December 2018 | 31 December 2030 |
|---|---|---|
| Closed Group without Future Accruals | ||
| Assets | ||
| Current Assets | 372 | 688 |
| Future Contributions | — | — |
| Total Assets (a) | 372 | 688 |
| Obligations | ||
| Current Benefits | 459 | 1,058 |
| Future Benefits | 798 | 948 |
| Total Obligations (b) | 1,257 | 2,006 |
| Asset Excess (Shortfall) (c) = (a) - (b) | (885) | (1,319) |
| Total Assets as Percentage of ObligationsFootnote 2 (a)/(b) | 29.6% | 34.3% |
| Closed Group with Future Accruals | ||
| Assets | ||
| Current Assets | 372 | 688 |
| Future Contributions | 966 | 1,437 |
| Total Assets (d) | 1,338 | 2,124 |
| Obligations | ||
| Current Benefits | 459 | 1,058 |
| Future Benefits | 1,449 | 1,921 |
| Total Obligations (e) | 1,908 | 2,979 |
| Asset Excess (Shortfall) (f) = (d) - (e) | (570) | (854) |
| Change in Asset Excess or Shortfall (f) - (c) | 315 | 464 |
| Total Assets as Percentage of ObligationsFootnote 2 (d)/(e) | 70.1% | 71.3% |
| Open Group | ||
| Assets | ||
| Current Assets | 372 | 688 |
| Future Contributions | 2,319 | 3,439 |
| Total Assets (g) | 2,691 | 4,127 |
| Obligations | ||
| Current Benefits | 459 | 1,058 |
| Future Benefits | 2,216 | 3,049 |
| Total Obligations (h) | 2,674 | 4,107 |
| Asset Excess (Shortfall) (i) = (g) - (h) | 17 | 20 |
| Change in Asset Excess or Shortfall (i) - (f) | 587 | 874 |
| Total Assets as Percentage of ObligationsFootnote 2 (g)/(h) | 100.6% | 100.5% |
Table 2 Footnotes
|
||
3.6 Length of the Projection Period
In this study, the cash flows are projected over an extended time period of 150 years. Subsection 115(1.1) of the Canada Pension Plan specifies that the CPP actuarial report should present financial information for a period of at least 75 years following the valuation date. For a closed group without or with future accruals, the projection of future contributions and expenditures for a 75-year period is sufficient to cover virtually all future contributions and expenditures associated with the group's participants.
However, the use of a 75-year projection period for the open group balance sheet could be viewed as insufficient. In general, by limiting the projection period, part of the future expenditures for cohorts that will enter the labour force during that time are excluded from the obligations, while most of the contributions for these cohorts are included in the assets.
For comparison, projections over periods of both 75 years and an infinite horizon are used to determine the financial sustainability of the Old‑Age, Survivors, and Disability Insurance (OASDI) program in the United States. However, the limitations of doing so are also noted. In: The 2020 Annual Report of the Board of Trustees of the Federal Old-Age and Survivors Insurance and Federal Disability Insurance Trust Funds (the "2020 Trustees Report"), (U.S. OASDI Board of Trustees, 2020, pp. 17-18), it is stated that "[c]onsideration of summary measures alone for a 75-year period can lead to incorrect perceptions and to policy prescriptions that do not achieve sustainable solvency." It is explained in a footnote that "[s]ustainable solvency for the financing of the program under a specified set of assumptions has been achieved when the projected trust fund ratio is positive throughout the 75-year projection period and is either stable or rising at the end of the period." On the other hand, the 2020 Trustees Report also notes that "[t]he infinite horizon values provide an additional indication of Social Security's financial condition for the period beginning with the inception of the program and extending indefinitely into the future, but results are subject to much greater uncertainty."
One of the factors that drive the choice of the length of the projection period is the discount rate. This is due to the fact that adding additional projection years beyond a certain point may have a negligible effect because of discounting.
Table 3 presents the base CPP open group balance sheet determined using different projection periods. It could be seen that the ratio of assets to obligations decreases, but at a slowing rate, as the length of the projection period increases.
| Length of the Projection Period in Years | ||||||
|---|---|---|---|---|---|---|
| 75 | 100 | 125 | 150 | 175 | 200 | |
| Total Assets | 2,342 | 2,529 | 2,633 | 2,691 | 2,724 | 2,742 |
| Total Obligations | 2,222 | 2,460 | 2,596 | 2,674 | 2,719 | 2,744 |
| Asset excess (shortfall) | 120 | 69 | 37 | 17 | 5 | (3) |
| Total Assets as a Percentage of Total Obligations (%) | 105.4% | 102.8% | 101.4% | 100.6% | 100.2% | 99.9% |
Table 3 shows that, while using longer projection periods beyond 150 years allows for more complete cash flows, the impact on the results is marginal, with the total assets as a percentage of obligations falling by less than one percentage point (from 100.6% to 99.9%) when the projection period is extended for an additional 50 years. The decline in the percentage is marginal due to the discounting of the cash flows occurring more than 150 years in the future.
Finally, it is worth repeating that although increasing the length of the projection period somewhat enhances the assessment of the financial sustainability of the base CPP, it also increases the uncertainty of results.
4 Sensitivity Analysis
The financial sustainability of a partially funded social security system is affected by various factors such as a country's economic growth, its demographic profile, as well as the ability of the system's assets to generate sufficient investment income. Different environments impact a system's contributions and/or expenditures, as well as assets needed to pay its expenditures. These impacts vary as to their extent and timing. For example, the economic growth of a country affects its system's contributions and expenditures through labour force participation rates, the unemployment rate, and the growth in participants' earnings. While the fluctuations in these factors have an immediate impact on the system's contributions, there could be some time before the effect on expenditures is seen.
This subsection explores the applicability of using the closed group without future accruals to measure the impacts of different demographic, economic, and investment environments other than those assumed under the best‑estimate scenario on the assets and obligations of the base CPP. The impacts under the closed group without future accruals are examined vis-à-vis an open group to recognize that actuarial balance sheets under a closed group without future accruals approach may provide incomplete or even misleading information on the financial state of the base Plan. In comparison, the actuarial balance sheet under an open group approach provides the correct assessment of the sensitivity of the base Plan to different future environments. Moreover, it is worth emphasizing that the MCR, which is the key financial measure of the base Plan and an indicator of the impact of future environments, is determined by statute under an open group approach. For the remainder of this section, the terms "closed group without future accruals" and "closed group" are used interchangeably.
The impacts are illustrated using the lower-cost and higher-cost assumptions for the total fertility rate, mortality rates, real wage increase, and real rate of return on assets, as considered in the 30th CPP Actuarial Report. Table 4 below summarizes the assumptions used. The alternative scenarios are described as lower/higher regarding the assumptions used, as well as lower/higher-cost in terms of the resulting MCR.
| Scenario | Assumption | ||
|---|---|---|---|
| Total Fertility Rate (number of children per woman) |
Higher Total Fertility Rate - Lower Cost | 1.92 | |
| Best Estimate | 1.62 | ||
| Lower Total Fertility Rate - Higher Cost | 1.32 | ||
| Mortality Rates | Higher Mortality Rates - Lower Cost | Life Expectancy in 2050 at age 65 (years) with assumed future mortality improvements |
|
| Males | Females | ||
| 21.0 | 23.4 | ||
| Best Estimate | 23.3 | 25.6 | |
| Lower Mortality Rates - Higher Cost | 25.8 | 28.0 | |
| Real Wage Increase | Higher Real Wage Increase - Lower Cost | 1.7% | |
| Best Estimate | 1.0% | ||
| Lower Real Wage Increase - Higher Cost | 0.3% | ||
| Real Rate of Return (75-year average) |
Higher Real Rate of Return - Lower Cost | 5.55% | |
| Best Estimate | 3.95% | ||
| Lower Real Rate of Return - Higher Cost | 2.35% | ||
Total fertility rate
The balance sheets for the base Plan under the higher and lower total fertility rate assumptions using the legislated 9.9% contribution rate are presented in Table 5.
The higher total fertility rate results in a lower cost for the base Plan as determined using the statutory steady-state valuation methodology. Similarly, the lower total fertility rate results in a higher cost for the base Plan. The MCR applicable for the year 2034 and thereafter decreases to 9.43% under the higher total fertility rate and increases to 10.03% under the lower total fertility rate. These MCRs compare to the best-estimate MCR of 9.72%.
The higher total fertility rate leads to an increase in the number of contributors in the medium and long term and eventually to an increase in the amount of benefits paid in the long term. The total obligations of the base Plan as at 31 December 2018 under the open group approach are higher, increasing from $2,674 billion under the best-estimate scenario to $2,776 billion. However, this increase is more than compensated by the higher assets as a result of higher contributions. In such a demographic environment, the asset excess increases to $126 billion, and assets represent 104.5% of obligations.
In comparison, under the lower total fertility rate assumption, there are fewer contributors and thus eventually less benefits being paid, leading to lower total CPP obligations under the open group approach. However, a lower volume of contributions also leads to lower assets, which fall to a greater extent than the obligations. Thus, there is an asset shortfall of $72 billion, and assets represent 97.2% of obligations.
It could be concluded that the base CPP balance sheet under the open group approach reflects the impact of a changing demographic environment on the financial state of the base CPP.
Looking at the balance sheet under the closed group approach, it is observed that it does not provide any significant information regarding the changing cost of the base CPP under the alternative total fertility rate assumptions. The obligations differ only slightly due to differences in the amount of future children's benefits paid to children of disabled or deceased contributors. As the obligations change little, the asset shortfall of $885 billion remains nearly the same and the ratio of assets to obligations remains at 29.6% if the total fertility rate assumption changes. This is a direct result of the accrued-to-date nature of the closed group methodology, which does not reflect the reliance of the base Plan on future contributions as a major source of financing.
| Best Estimate Total Fertility Rate: 1.62 children per woman | ||
|---|---|---|
| MCRFootnote 1: 9.72% | ||
| Closed Group without Future Accruals |
Open group | |
| Total Assets (a) | 372 | 2,691 |
| Obligations (b) | 1,257 | 2,674 |
| Asset Excess/(Shortfall) (a) - (b) | (885) | 17 |
| Total Assets as a Percentage of ObligationsFootnote 2 (%) (a)/(b) | 29.6% | 100.6% |
| Higher Total Fertility Rate: 1.92 children per woman | ||
| MCRFootnote 1: 9.43% | ||
| Closed Group without Future Accruals |
Open group | |
| Total Assets (a) | 372 | 2,902 |
| Obligations (b) | 1,257 | 2,776 |
| Asset Excess/(Shortfall) (a) - (b) | (885) | 126 |
| Total Assets as a Percentage of ObligationsFootnote 2 (%) (a)/(b) | 29.6% | 104.5% |
| Lower Total Fertility Rate: 1.32 children per woman | ||
| MCRFootnote 1: 10.03% | ||
| Closed Group without Future Accruals |
Open group | |
| Total Assets (a) | 372 | 2,511 |
| Obligations (b) | 1,256 | 2,583 |
| Asset Excess/(Shortfall) (a) - (b) | (884) | (72) |
| Total Assets as a Percentage of ObligationsFootnote 2 (%) (a)/(b) | 29.6% | 97.2% |
Table 5 Footnotes
|
||
Mortality rates
The balance sheets for the base Plan under the higher and lower mortality rates scenarios using the legislated 9.9% contribution rate are presented in Table 6.
The higher mortality rates result in lower costs for the base Plan, and lower mortality rates result in higher costs. Under the lower cost scenario, the base Plan MCR for year 2034 and thereafter decreases to 9.38%. Under the higher cost scenario, the base Plan MCR increases to 10.06%.
Under the higher mortality rates scenario, slightly fewer individuals reach retirement age, and the payment period for beneficiaries is shorter. This scenario leads to lower expenditures mainly due to shorter durations of benefit payments. At the same time, since mortality rates before age 65 remain quite low, there is almost no change to the contributions stream. Under the open group approach, for the base CPP as at 31 December 2018, there is an asset excess of $127 billion, and the total assets represent 105% of obligations.
The lower mortality rates scenario leads to higher life expectancies at age 65, and, therefore to higher expenditures. Once again, since the best-estimate mortality rates before age 65 are already very low, under this scenario the contributions stream does not change significantly. In this case under the open group approach, for the base CPP as at 31 December 2018, there is an asset shortfall of $87 billion, and the ratio of assets to obligations is 96.9%.
Contrary to the total fertility rate scenarios, the base CPP balance sheet under the closed group approach is impacted by changes in the level of mortality. However, the impacts are much lower than those emerging under the open group approach since younger generations who are affected the most by the changes in future mortality are either not included at all in the valuation or have low accrued-to-date benefits. As shown in Table 6, the asset shortfall for the base CPP under the closed group approach increases from $885 billion under the best-estimate scenario to $911 billion under the lower mortality rates scenario, an overall increase in the asset shortfall of $26 billion. This compares to a corresponding decrease in the asset excess by $104 billion under the open group approach (from an asset excess of $17 billion to an asset shortfall of $87 billion). The figures show that the base CPP balance sheet under an open group approach gives a more complete picture of the impacts of different future mortality rates scenarios.
| Best Estimate Mortality Rates Life expectancy in 2050 at age 65 with assumed future mortality improvement: 23.3 males and 25.6 females |
||
|---|---|---|
| MCRFootnote 1: 9.72% | ||
| Closed Group without Future Accruals |
Open group | |
| Total Assets (a) | 372 | 2,691 |
| Obligations (b) | 1,257 | 2,674 |
| Asset Excess/(Shortfall) (a) - (b) | (885) | 17 |
| Total Assets as a Percentage of ObligationsFootnote 2 (%) (a)/(b) | 29.6% | 100.6% |
| Higher Mortality Rates Life expectancy in 2050 at age 65 with assumed future mortality improvements: 21.0 males and 23.4 females |
||
| MCRFootnote 1: 9.38% | ||
| Closed Group without Future Accruals |
Open group | |
| Total Assets (a) | 372 | 2,666 |
| Obligations (b) | 1,232 | 2,539 |
| Asset Excess/(Shortfall) (a) - (b) | (860) | 127 |
| Total Assets as a Percentage of ObligationsFootnote 2 (%) (a)/(b) | 30.2% | 105.0% |
| Lower Mortality Rates Life expectancy in 2050 at age 65 with assumed future mortality improvements: 25.8 males and 28.0 females |
||
| MCRFootnote 1: 10.06% | ||
| Closed Group without Future Accruals |
Open group | |
| Total Assets (a) | 372 | 2,712 |
| Obligations (b) | 1,283 | 2,799 |
| Asset Excess/(Shortfall) (a) - (b) | (911) | (87) |
| Total Assets as a Percentage of ObligationsFootnote 2 (%) (a)/(b) | 29.0% | 96.9% |
Table 6 Footnotes
|
||
Real Wage Increase
Table 7 presents the balance sheets for the base Plan under the higher and lower real wage increase assumptions using the 9.9% legislated contribution rate.
Wage increases affect the financial balance of the base CPP in two ways. In the short term, an increase in the average wage translates into higher contribution income with little immediate impact on benefits. Over the longer term, higher average wages produce higher benefits. Higher real wages have the effect of decreasing the MCR, and lower real wages increase the MCR.
Under the lower-cost scenario (higher real wage) the MCR for year 2034 and thereafter decreases to 9.29%, while under the higher-cost scenario (lower real wage) the MCR increases to 10.15%.
The impacts of changes in the real wage increase on the financial state of the base CPP as measured under the open group approach are consistent with the changes in the MCR determined under the statutory steady-state methodology. Under the higher real wage increase assumption, while both open group assets and obligations increase compared to the best-estimate scenario as at 31 December 2018, the increase in assets outpaces the increase in obligations, creating an asset excess of $151 billion and ratio of assets to obligations of 104.6%. Under the lower real wage increase assumption, the assets decrease more than the obligations, resulting in an asset shortfall of $62 billion and ratio of assets to obligations of 97.3%.
For the closed group approach, the eventually higher benefits under a higher real wage increase assumption result in higher obligations. The reason is that although there are no future benefit accruals, benefits eventually paid in the future are higher since they are determined according to a higher wage indexation based on the year of benefit take-up. At the same time, higher contributions are not reflected in the assets since there are no future accruals. As a result, the balance sheet position worsens - the asset shortfall increases to $924 billion and the ratio of assets to obligations falls slightly to 28.7%. The opposite effect occurs under the lower real wage increase assumption - the asset shortfall decreases to $848 billion and the ratio of assets to obligations increases to 30.5%.
It is thus observed that if the financial state of the base CPP is assessed using the closed group approach, the change in the real wage increase assumption leads to conclusions that are in the opposite direction to those reached using the statutory open group methodology. Thus, assessing the impact of alternative future real wage increase assumptions on the base Plan under a closed group approach leads to misleading information. In comparison, a correct interpretation results from using an open group approach.
| Best Estimate Real Wage Increase: 1.0% per year | ||
|---|---|---|
| MCRFootnote 1: 9.72% | ||
| Closed Group without Future Accruals |
Open group | |
| Total Assets (a) | 372 | 2,691 |
| Obligations (b) | 1,257 | 2,674 |
| Asset Excess/(Shortfall) (a) - (b) | (885) | 17 |
| Total Assets as a Percentage of ObligationsFootnote 2 (%) (a)/(b) | 29.6% | 100.6% |
| Higher Real Wage Increase: 1.7% per year | ||
| MCRFootnote 1: 9.29% | ||
| Closed Group without Future Accruals |
Open group | |
| Total Assets (a) | 372 | 3,423 |
| Obligations (b) | 1,296 | 3,272 |
| Asset Excess/(Shortfall) (a) - (b) | (924) | 151 |
| Total Assets as a Percentage of ObligationsFootnote 2 (%) (a)/(b) | 28.7% | 104.6% |
| Lower Real Wage Increase: 0.3% per year | ||
| MCRFootnote 1: 10.15% | ||
| Closed Group without Future Accruals |
Open group | |
| Total Assets (a) | 372 | 2,220 |
| Obligations (b) | 1,220 | 2,282 |
| Asset Excess/(Shortfall) (a) - (b) | (848) | (62) |
| Total Assets as a Percentage of ObligationsFootnote 2 (%) (a)/(b) | 30.5% | 97.3% |
Table 7 Footnotes
|
||
Rates of Return on Investments
Changes in financial market returns do not affect the stream of contributions and expenditures of the base CPP. However, returns do affect the second source of the base Plan's revenues - investment income.
For the base CPP, under the higher assumed real rate of return on assets, higher investment income leads to a lower cost, with the MCR decreasing to 8.28% compared to the best-estimate MCR of 9.72% for the year 2034 and thereafter. Under the lower assumed real rate of return on assets, lower investment income results in a higher MCR of 11.16%.
For both the open and closed groups, the amount of the base CPP obligations at a given date depends directly on the expected rate of return on assets, since the cash flows are discounted at this rate. Therefore, higher expected rates of return lead to lower obligations under both open and closed groups. Similarly, lower expected rates of return lead to higher obligations under both open and closed groups.
Since the assets under the open group include the present value of future contributions, the asset value moves in the same direction as obligations when the discount rate changes. However, due to the timing of future contributions and future benefits, the change (either decrease or increase) in the value of the open group assets is lower than the corresponding change in the open group obligations. Therefore, as shown in Table 8, under the higher real rate of return assumption, there is a higher asset excess of $206 billion and ratio of assets to obligations of 112.7%, while under the lower assumed real rate of return on assets, there is an asset shortfall of $633 billion and a lower ratio of assets to obligations of 89.2% compared to the best-estimate scenario.
Under the closed group, the higher assumed real rate of return on assets results in a lower asset shortfall of $625 billion and higher ratio of assets to obligations of 37.3%, while the lower assumed real rate of return on assets results in a higher asset shortfall of $1,275 billion and lower ratio of assets to obligations of 22.6% compared to the best-estimate scenario.
Only the present value of obligations is affected by different assumed rates of return under a closed group. As such, sensitivity of the base CPP balance sheet figures under the closed group to different rates return does not properly reflect the partial funding of the base Plan and its high reliance on contributions as a source of financing.
| Best-Estimate Real Rate of Return 75-year average: 3.95% per year | ||
|---|---|---|
| MCRFootnote 1: 9.72% | ||
| Closed Group without Future Accruals |
Open group | |
| Total Assets (a) | 372 | 2,691 |
| Obligations (b) | 1,257 | 2,674 |
| Asset Excess/(Shortfall) (a) - (b) | (885) | 17 |
| Total Assets as a Percentage of ObligationsFootnote 2 (%) (a)/(b) | 29.6% | 100.6% |
| Higher Real Rate of Return: 75-year average: 5.55% per year | ||
| MCRFootnote 1: 8.28% | ||
| Closed Group without Future Accruals |
Open group | |
| Total Assets (a) | 372 | 1,822 |
| Obligations (b) | 997 | 1,616 |
| Asset Excess/(Shortfall) (a) - (b) | (625) | 206 |
| Total Assets as a Percentage of ObligationsFootnote 2 (%) (a)/(b) | 37.3% | 112.7% |
| Lower Real Rate of Return: 75-year average: 2.35% per year | ||
| MCRFootnote 1: 11.16% | ||
| Closed Group without Future Accruals |
Open group | |
| Total Assets (a) | 372 | 5,205 |
| Obligations (b) | 1,647 | 5,838 |
| Asset Excess/(Shortfall) (a) - (b) | (1,275) | (633) |
| Total Assets as a Percentage of ObligationsFootnote 2 (%) (a)/(b) | 22.6% | 89.2% |
Table 8 Footnotes
|
||
The provisions of the Canada Pension Plan, including the regular review process by federal and provincial Ministers of Finance, ensure the continual monitoring and management of the financing of the CPP. The base CPP is unique in terms of the structure and long‑term nature of its obligations, the associated contributions and assets that must cover those obligations, and the dynamics between them. As such, ensuring the base Plan's long‑term financial sustainability requires regularly assessing the characteristics of and the relationship between its assets and obligations.
The sensitivity analysis presented in this section highlights the importance of managing the risks that the base CPP could face from varying demographic, economic, and investment environments. This analysis also highlights the importance of measuring the base Plan's assets and obligations in a way that provides meaningful indications of how various risks may impact the financial state of the base Plan. Measuring the base Plan's assets and obligations using the open group approach provides information that properly reflects how changes in the economic, demographic, and investment environments affect the long-term sustainability of the base Plan.
The analysis in this section also demonstrates that the relationship between the assets and obligations of the base CPP determined under the closed group without future accruals approach may provide incomplete information, as in the case of changes in the total fertility rate and level of mortality, or even misleading information, as in the case of changes in real wage increase expectations.
5 Reporting on the Financial State of the Canada Pension Plan
The processes used to assess the financial sustainability of the CPP and the corresponding reporting are recognized around the world as best practices.Footnote 6
A main tool used by the CPP stakeholders to assess the long-term financial sustainability of the Plan is the statutory actuarial reports prepared by the OCA. The 1997 Reforms strengthened the CPP stewardship and accountability to Canadians. In particular, the frequency of both the statutory actuarial reports and the periodic reviews of the Plan by the federal and provincial Finance Ministers was increased from once every five years to every three years. By legislation, actuarial reports produced by the Chief Actuary are one of the main elements taken into consideration by the Finance Ministers when they perform their financial review of the CPP. These reports provide a comprehensive actuarial assessment of the financial state of the base CPP and, more recently, the additional Plan. They include detailed projections of the each component's future cash flows, the respective minimum contribution rates, as well as extensive discussion on the uncertainty of the results.
Further to the 1997 Reforms, the federal, provincial, and territorial Finance Ministers took additional steps in 1999 to strengthen the transparency and accountability of actuarial reporting on the CPP. They endorsed regular independent peer reviews of the actuarial reports and consultations by the Chief Actuary with experts on the assumptions to be used in the reports.
As of 2020, there have been eight independent reviews performed. All information related to these reviews can be found on OSFI's website.Footnote 7
The United Kingdom Government Actuary's Department, recognized for its expertise in the field of social security, assists with selecting the members of the peer review panel through an open process and provides an independent opinion of the review. The terms of reference of the panel are to provide opinions on the following questions:
- Is the professional experience of the Chief Actuary and the staff who worked on the report adequate for carrying out the work required?
- Has the work been completed in compliance with the relevant professional standards of practice and statutory requirements?
- Did the Chief Actuary have access to the information required to perform the valuation, and were relevant tests and analysis on the data completed as might be expected?
- Were the actuarial methods and assumptions used in completing the report reasonable?
- Does the Actuarial Report fairly communicate the results of the work performed by the Chief Actuary and the Chief Actuary's staff?
As well, in providing opinions on the questions listed above, the peer reviewers provide such recommendations as the peer reviewers deem appropriate with respect to future actuarial reports on the CPP prepared by the OCA.
The most recent independent review panel found that the work conducted by the OCA on the 30th CPP Actuarial Report complied with all relevant professional standards of practice and statutory requirements (Gutterman et al., 2020). The panel also concluded that the methods and assumptions used in the 30th CPP Actuarial Report were reasonable, confirming that the legislated contribution rates are sufficient to finance the CPP over the long term. The peer reviewers also provide recommendations for future reports. Each recommendation is reviewed and considered by the OCA. Over the years, many of the recommendations have been incorporated into subsequent actuarial reports to provide Canadians with more relevant information and to improve the quality and transparency of the actuarial reports.
To ensure the quality of actuarial reports, the Chief Actuary also consults with experts in the fields of demography, economics, and investments, and periodic CPP seminars are hosted by the OCA where such experts present their views. The information and presentations from these seminars can be found on OSFI's website.Footnote 8
In 2010, the Office of the Auditor General Canada (OAG) asked the management of the Department of Employment and Social Development Canada (ESDC, the CPP administrators) to include information on the actuarial obligations of the CPP in the notes to the CPP consolidated financial statements. As a result of cooperation between the OAG, ESDC, and the OCA, the decision was taken to provide further relevant and more complete information regarding the financing of the CPP, the long-term financial sustainability of the CPP as assessed by the statutory actuarial reports, and the actuarial balance sheets under both open and closed groups. It was felt such multiple disclosures would provide all stakeholders with accurate, appropriate, and comprehensive information to enable informed decisions to be made.
Therefore, starting from the fiscal year ending 31 March 2011, the discussion on the long-term sustainability of the CPP appears in the notes to the CPP consolidated financial statements in both the CPP Annual Reports (ESDC, 2011) and the Public Accounts of Canada (Receiver General for Canada, 2011). Both sources provide the same information.
Initially, a single note to the CPP consolidated financial statements titled "Actuarial obligation in respect of benefits" was introduced. It discussed the financing approach of the (base) CPP, the statutory methodology used by the Chief Actuary to assess the long-term sustainability of the Plan, and the actuarial balance sheets under both the open group and the closed group without future accruals approaches. The emphasis was put on the statutory assessment and results under the open group approach. To quote the initial note to the financial statements, which was in respect of the base CPP:
"The CPP was never intended to be a fully-funded plan… although the relative size of the unfunded obligation under the closed group may be used as a measure of the Plan's financial status, the key financial measure for evaluating the sustainability of the Plan is the adequacy and stability of the steady-state contribution rate over time. Due to the CPP's long-term and enduring nature, if the Plan's sustainability is to be measured based on its unfunded obligation, the open group approach that includes both future contributions and future benefits with respect to both current and future participants provides the more appropriate assessment of the Plan's financial status."
In 2015, the notes to the (base) CPP consolidated financial statements were further modified to draw a clearer distinction between (i) the financing of the CPP and its long-term sustainability as assessed by the Chief Actuary, and (ii) the information presented through the actuarial balance sheets. As a result, Note 12 on the "Financial sustainability of the Canada Pension Plan" concentrates on the description of the financing approach of the CPP and on the main results of the most recent actuarial report, including the sensitivity of these results to alternative demographic, economic, and investment environments. Note 13Footnote 9 on the "Actuarial obligation in respect of benefits" presents the actuarial balance sheet under both open group and closed group approaches with emphasis on the results under the open group. Note 13 further stresses that "the financial sustainability of the base CPP is not assessed based on its actuarial obligation in respect of benefits".
The change in the reporting of actuarial balance sheet figures in the actuarial reports has followed in step with the reporting in the consolidated financial statements. Prior to the 30th CPP Actuarial Report, the base Plan's obligations measured under the closed group without future benefit accruals methodology was presented in the CPP triennial actuarial reports as supplementary information within the main text, and then as footnotes (starting with the 26th CPP Actuarial Report, (OSFI, 2013)). The open group balance sheet of the base Plan first appeared in the 25th CPP Actuarial Report (OSFI, 2010b), following Actuarial Study No. 8 on the financing of the CPP (OSFI, 2010a). Following the publication of subsequent studies on financing of the CPP (OSFI, 2012, 2014, and 2018a), more emphasis has been placed on the open group balance sheet. The 30th CPP Actuarial Report contains open group balance sheets for both the base and additional Plans and also shows closed group without future accruals information as footnotes for both components of the CPP.
In summary, the decision to include further relevant and more complete information in the Notes to the CPP consolidated financial statements, which are included in both the CPP Annual Reports and Public Accounts of Canada, as well open and closed group actuarial balance sheet figures in the actuarial reports serve the objective of educating readers by providing meaningful information and explaining how different measures should be interpreted. The CPP actuarial reports together with the Notes to the CPP consolidated financial statements enable stakeholders to make informed decisions regarding the Plan.
6 Conclusion
The CPP is intended to be long-term and enduring in nature, a fact that is reinforced by the federal, provincial, and territorial governments' joint stewardship through the established strong governance and accountability framework of the Plan. In particular, this means it is expected that the base CPP will continue its high reliance on future contributions as a source of financing. It therefore follows that if financial sustainability of the base Plan is to be measured based on its asset excess or shortfall, it should be done on an open group basis that fully accounts for both future contributions and invested assets as the means of financing all future expenditures. Under the best-estimate assumptions of the 30th CPP Actuarial Report, the assessment of the base Plan's financial state on an open group basis confirms that the base Plan is able to meet its financial obligations over the long term.
In comparison, a closed group methodology, whereby only current participants are considered without or with their future benefit accruals, does not provide a proper assessment of the financial sustainability of the base CPP. This is because a closed group methodology does not reflect the partial funding approach of the base Plan whereby future contributions represent a major source of financing of future expenditures.
Although the key legislated financial measures for evaluating the base CPP is the minimum contribution rate, specifically, its adequacy and stability over time, other indicators such as the open group balance sheet should be used in combination with the minimum contribution rate to assess the financial sustainability of the base Plan.
It is important to note that the ratio of assets to obligations on an open group basis under the legislated contribution rate is not an absolute measure of financial sustainability of the base Plan. The base CPP can tolerate fluctuations in this ratio and still be financially sustainable over the long term.
Future demographic, economic, and financial market environments may differ from those assumed under the best‑estimate scenario of the 30th CPP Actuarial Report, and as a result may impact the base Plan's financial state differently. Sensitivity analysis was performed to examine the impacts of different environments on the base Plan's financial state. The results show that actuarial balance sheets under a closed group without future accruals approach may provide incomplete or even misleading information on the financial state of the base CPP.
The statutory actuarial reporting and the further provision of relevant and complete information in the CPP consolidated financial statements of the CPP Annual Reports and Public Accounts of Canada are aimed at providing all stakeholders with accurate, appropriate, and comprehensive information to enable informed decisions.
Appendix A - References
CIA. (2018). Standards of Practice, Part 7000 – Social Security Programs, effective February 1, 2018. Canadian Institute of Actuaries. Ottawa.
ESDC. (2011). Annual Report of the Canada Pension Plan 2010–2011. Employment and Social Development Canada. Ottawa.
Eurostat. (2013). European System of Accounts – ESA 2010. Publications Office of the European Union. Luxembourg. https://ec.europa.eu/eurostat/web/products-manuals-and-guidelines/-/KS-02-13-269
Eurostat & European Central Bank. (2020). Technical compilation guide for pension data in national accounts — 2020 edition. Publications Office of the European Union. Luxembourg. https://ec.europa.eu/eurostat/web/products-manuals-and-guidelines/-/ks-gq-20-008?inheritRedirect=true&redirect=%2Feurostat%2Fpublications%2Fmanuals-and-guidelines
Gutterman, S., Plamondon, P., & Wagman, J. (2020). Review of the 30th Actuarial Report on the Canada Pension Plan. Conducted by the CPP Actuarial Review Panel. 18 March 2020. Ottawa. https://www.osfi-bsif.gc.ca/Eng/oca-bac/ipr-rip/Pages/default.aspx
IAA. (2018). International Standard of Actuarial Practice 2 (ISAP 2) – Financial Analysis of Social Security Programs. International Actuarial Association. 1 December 2018. Ottawa. https://www.actuaries.org/iaa/IAA/Publications/ISAPs/IAA/Publications/05ISAPs.aspx?hkey=334b21a7-a3ac-4e0e-8294-3cbc755ab14a
ILO & ISSA. (2016). Guidelines on Actuarial Work for Social Security, Edition 2016. International Labour Organization and International Social Security Association. Geneva. https://ww1.issa.int/guidelines/act
ISSA. (2018). Actuarial and financial reporting of social security obligations. International Social Security Review, Special Issue: Vol. 71, Issue 3, July/September 2018. International Social Security Association. Switzerland. https://onlinelibrary.wiley.com/toc/1468246x/2018/71/3
OSFI. (2010a). Technical Aspects of the Financing of the Canada Pension Plan – Actuarial Study No. 8. Office of the Superintendent of Financial Institutions – Office of the Chief Actuary. Ottawa. https://www.osfi-bsif.gc.ca/Eng/oca-bac/as-ea/Pages/default.aspx
OSFI. (2010b). Twenty-Fifth Actuarial Report on the Canada Pension Plan as at 31 December 2009. Office of the Superintendent of Financial Institutions – Office of the Chief Actuary. Ottawa. https://www.osfi-bsif.gc.ca/Eng/oca-bac/ar-ra/cpp-rpc/Pages/default.aspx
OSFI. (2012). Measuring the Financial Sustainability of the Canada Pension Plan – Actuarial Study No. 10. Office of the Superintendent of Financial Institutions – Office of the Chief Actuary. Ottawa. https://www.osfi-bsif.gc.ca/Eng/oca-bac/as-ea/Pages/default.aspx
OSFI. (2013). Twenty-Sixth Actuarial Report on the Canada Pension Plan as at 31 December 2012. Office of the Superintendent of Financial Institutions – Office of the Chief Actuary. Ottawa. https://www.osfi-bsif.gc.ca/Eng/oca-bac/ar-ra/cpp-rpc/Pages/default.aspx
OSFI. (2014). Assessing the Sustainability of the Canada Pension Plan though Actuarial Balance Sheets – Actuarial Study No. 13. Office of the Superintendent of Financial Institutions – Office of the Chief Actuary. Ottawa. https://www.osfi-bsif.gc.ca/Eng/oca-bac/as-ea/Pages/default.aspx
OSFI. (2018a). Measuring and Reporting Actuarial Obligations of the Canada Pension Plan – Actuarial Study No. 19. Office of the Superintendent of Financial Institutions – Office of the Chief Actuary. Ottawa https://www.osfi-bsif.gc.ca/Eng/oca-bac/as-ea/Pages/default.aspx
OSFI. (2018b). Technical Paper on the Additional Canada Pension Plan Regulations – Actuarial Study No. 20. Office of the Superintendent of Financial Institutions – Office of the Chief Actuary. Ottawa. https://www.osfi-bsif.gc.ca/Eng/oca-bac/as-ea/Pages/default.aspx
OSFI. (2019). Thirtieth Actuarial Report on the Canada Pension Plan as at 31 December 2018. Office of the Superintendent of Financial Institutions – Office of the Chief Actuary. Ottawa. https://www.osfi-bsif.gc.ca/Eng/oca-bac/ar-ra/cpp-rpc/Pages/default.aspx
Receiver General for Canada. (2011). Public Accounts of Canada. Volume 1. Summary Report and Consolidated Financial Statements. Government of Canada Publications. Ottawa. https://www.tpsgc-pwgsc.gc.ca/recgen/cpc-pac/index-eng.html
Receiver General for Canada. (2020). Public Accounts of Canada. Volume 1. Summary Report and Consolidated Financial Statements. Government of Canada Publications. Ottawa. https://www.tpsgc-pwgsc.gc.ca/recgen/cpc-pac/index-eng.html
Settergren, O., & Boguslaw D. M. (2005). "The rate of return of pay-as-you-go pension systems: a more exact consumption-loan model of interest". Journal of Pension Economics & Finance, Volume 4, Issue 2, July 2005,pp. 115-138. Cambridge University Press. https://doi.org/10.1017/S1474747205002064
Thurley, D. (2019). "Public service pensions – employer contributions". Briefing Paper Number CBP-7539, 11 April 2019. UK House of Commons Library. https://commonslibrary.parliament.uk/research-briefings/cbp-7539/
U.S. OASDI Board of Trustees. (2020). The 2020 Annual Report of the Board of Trustees of the Federal Old-Age and Survivors Insurance and Federal Disability Insurance Trust Funds. Board of Trustees of the Federal Old-Age and Survivors Insurance and Disability Insurance Trust Funds. Washington, D.C.: U.S. Government Publishing Office, 2020. https://www.ssa.gov/oact/TR/index.html
Appendix B - Acknowledgements
The following people assisted in the preparation of this study:
Assia Billig, PhD, FCIA, FSA
Yu Cheng, ASA
Patrick Dontigny, ASA
Christine Dunnigan, FCIA, FSA
Sari Harrel, FCIA, FSA
Michel Montambeault, FCIA, FSA
Kelly Moore
Footnotes
- Footnote 1
-
The Annual Reports on the CPP are produced by Employment and Social Development Canada in collaboration with the Department of Finance Canada. The reports are accessible at: https://www.canada.ca/en/employment-social-development/services/pension/reports.html
- Footnote 2
-
CPP Actuarial Reports and OCA actuarial studies are available from the following webpages:
https://www.osfi-bsif.gc.ca/Eng/oca-bac/ar-ra/cpp-rpc/Pages/default.aspx,
https://www.osfi-bsif.gc.ca/Eng/oca-bac/as-ea/Pages/default.aspx.
- Footnote 3
-
It is projected in the 30th CPP Actuarial Report that base CPP contributions will exceed expenditures up to and including the year 2021 after which a portion of investment income will be required to pay for expenditures. However, given the economic consequences of the COVID-19 pandemic, it is possible that expenditures may exceed contributions starting in 2021.
- Footnote 4
-
In this study, the terms "balance sheet" and "actuarial balance sheet" are used interchangeably.
- Footnote 5
-
The steady-state contribution rate and incremental full funding rate in respect of future Plan membership are determined on an open group basis. For incremental full funding of increased or new benefits in respect of past membership (before the effective date of an amendment), the increase in obligations is determined on a closed group basis without future accruals. The increase in obligations is then amortized over 15 years of open group contributory earnings to arrive at the incremental full funding rate in respect of past Plan membership.
- Footnote 6
-
For examples of such recognition the reader is referred to the International Social Security Association database of Good Practices in Social Security https://ww1.issa.int/gp#mainContent as well as the special issue of the International Social Security Review of ISSA, titled Actuarial and financial reporting of social security obligations (ISSA, 2018).
- Footnote 7
-
http://www.osfi-bsif.gc.ca/Eng/oca-bac/ipr-rip/Pages/default.aspx
- Footnote 8
-
http://www.osfi-bsif.gc.ca/Eng/oca-bac/is-ci/Pages/default.aspx
- Footnote 9
-
In Volume I of the Public Accounts of Canada 2019-2020. Notes 12 and 13 correspond to Notes 13 and 14, respectively, in the Public Accounts of Canada for previous fiscal years 2014-2015 to 2018-2019.